
Effects of Freeze–Thaw Cycles on the Mechanical Properties and Microstructure of a Dispersed Soil


Abstract
:1. Introduction
2. Materials and Methods
2.1. Dispersed Soil
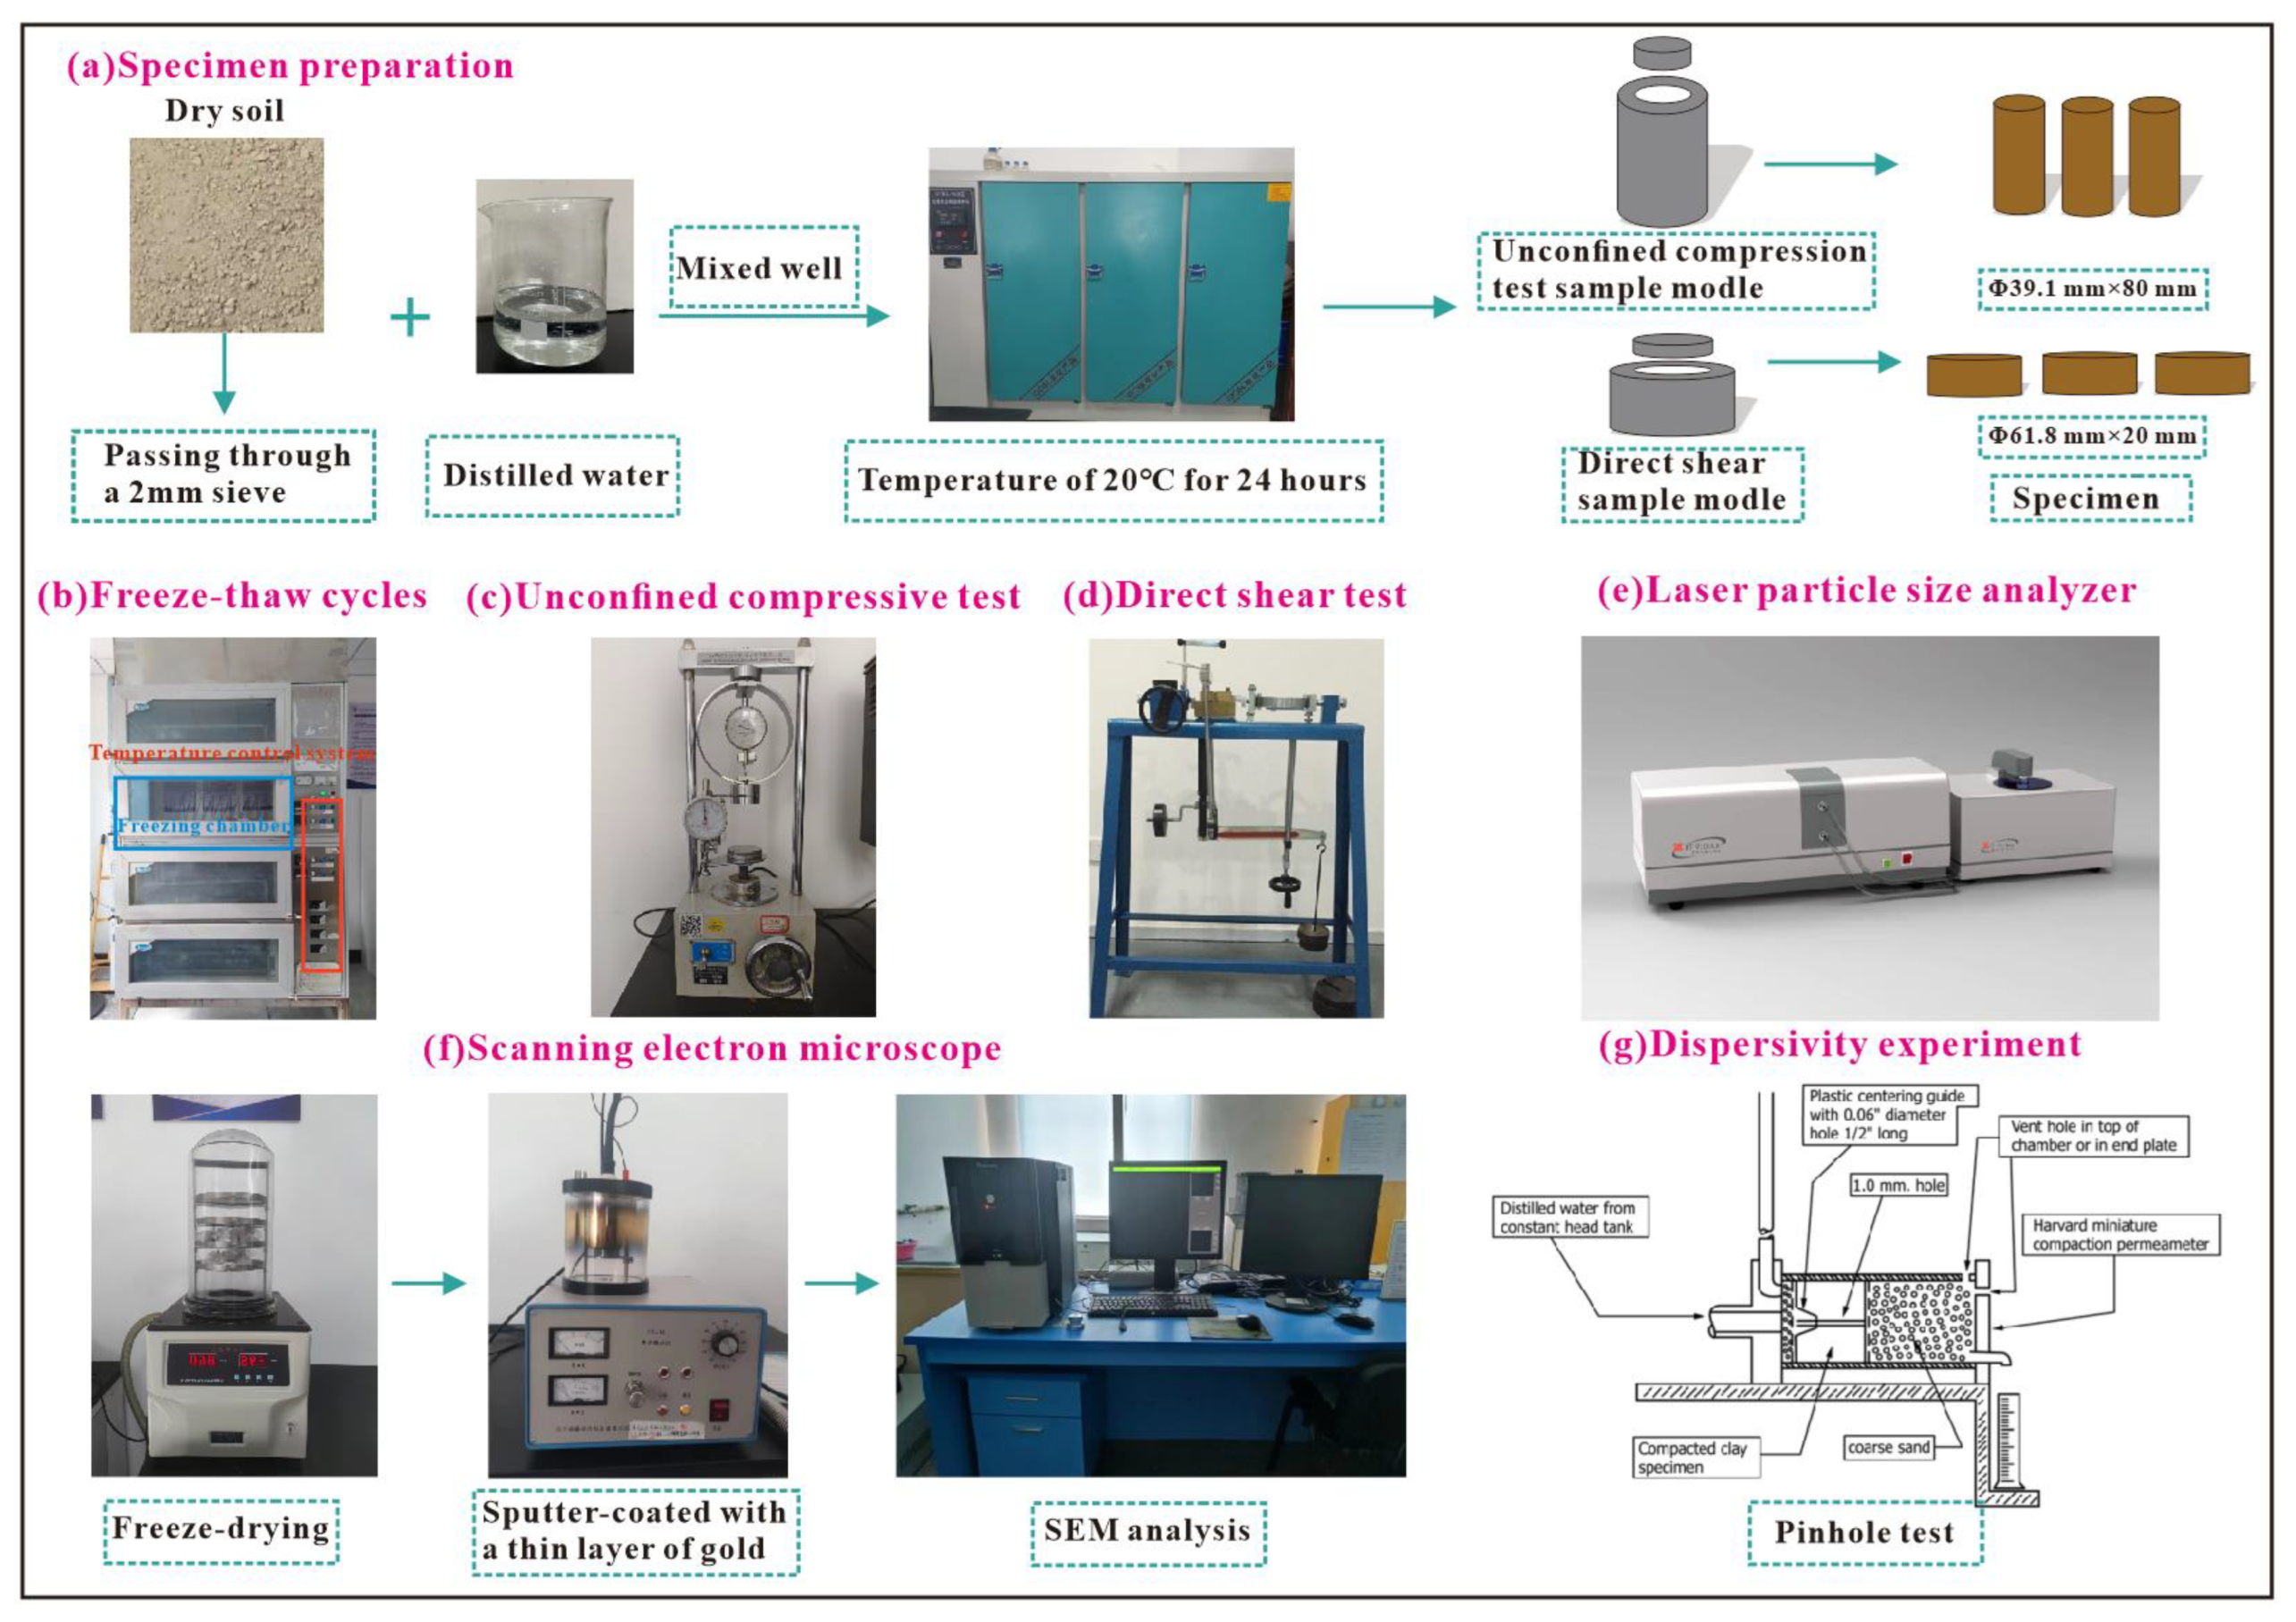
2.2. Specimen Preparation
2.3. Testing Methods
2.3.1. Freeze–Thaw Cycle Test
2.3.2. Identification of Dispersibility of the Soil Samples
- (1)
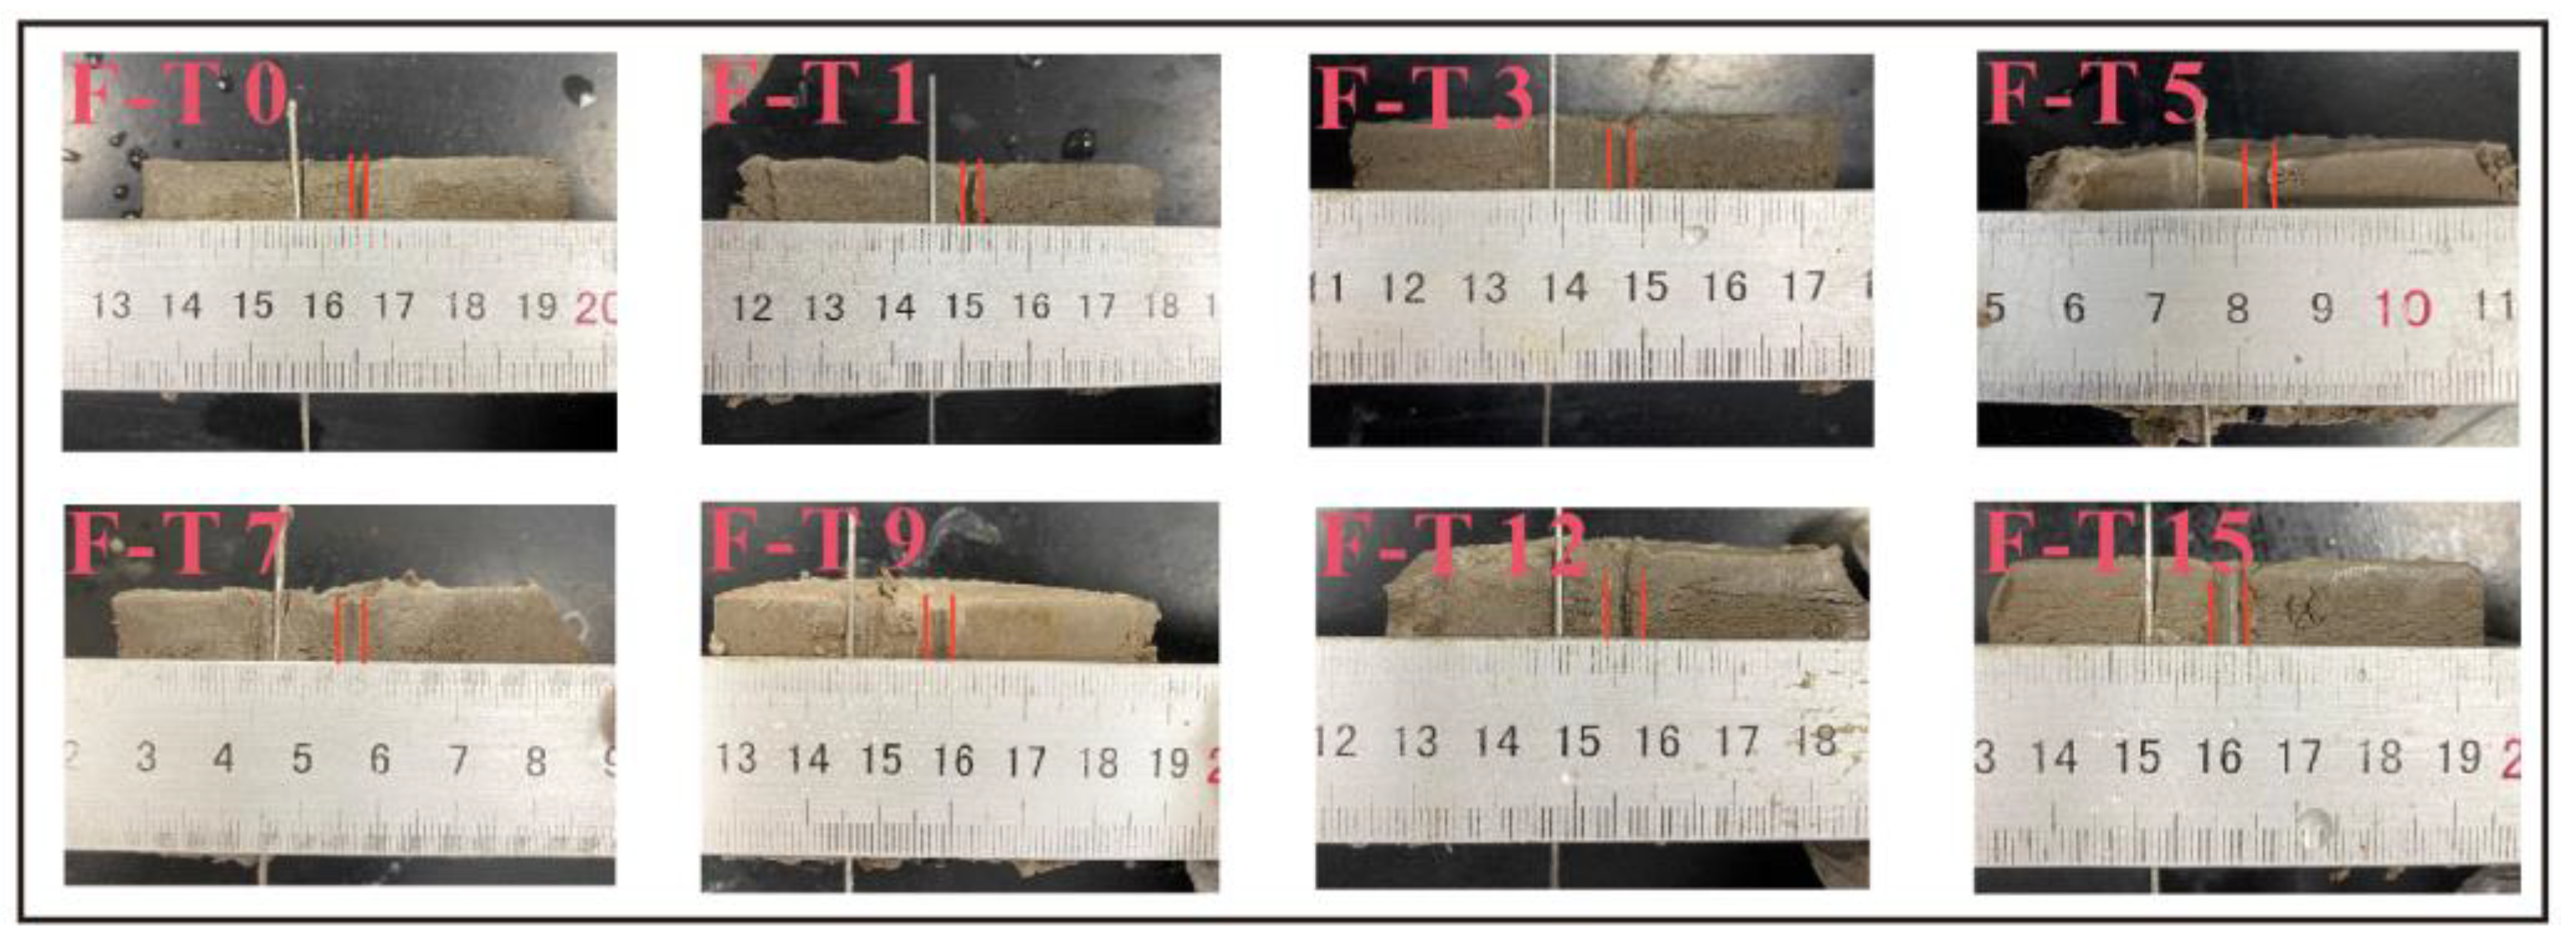
- Pinhole test
- (2)
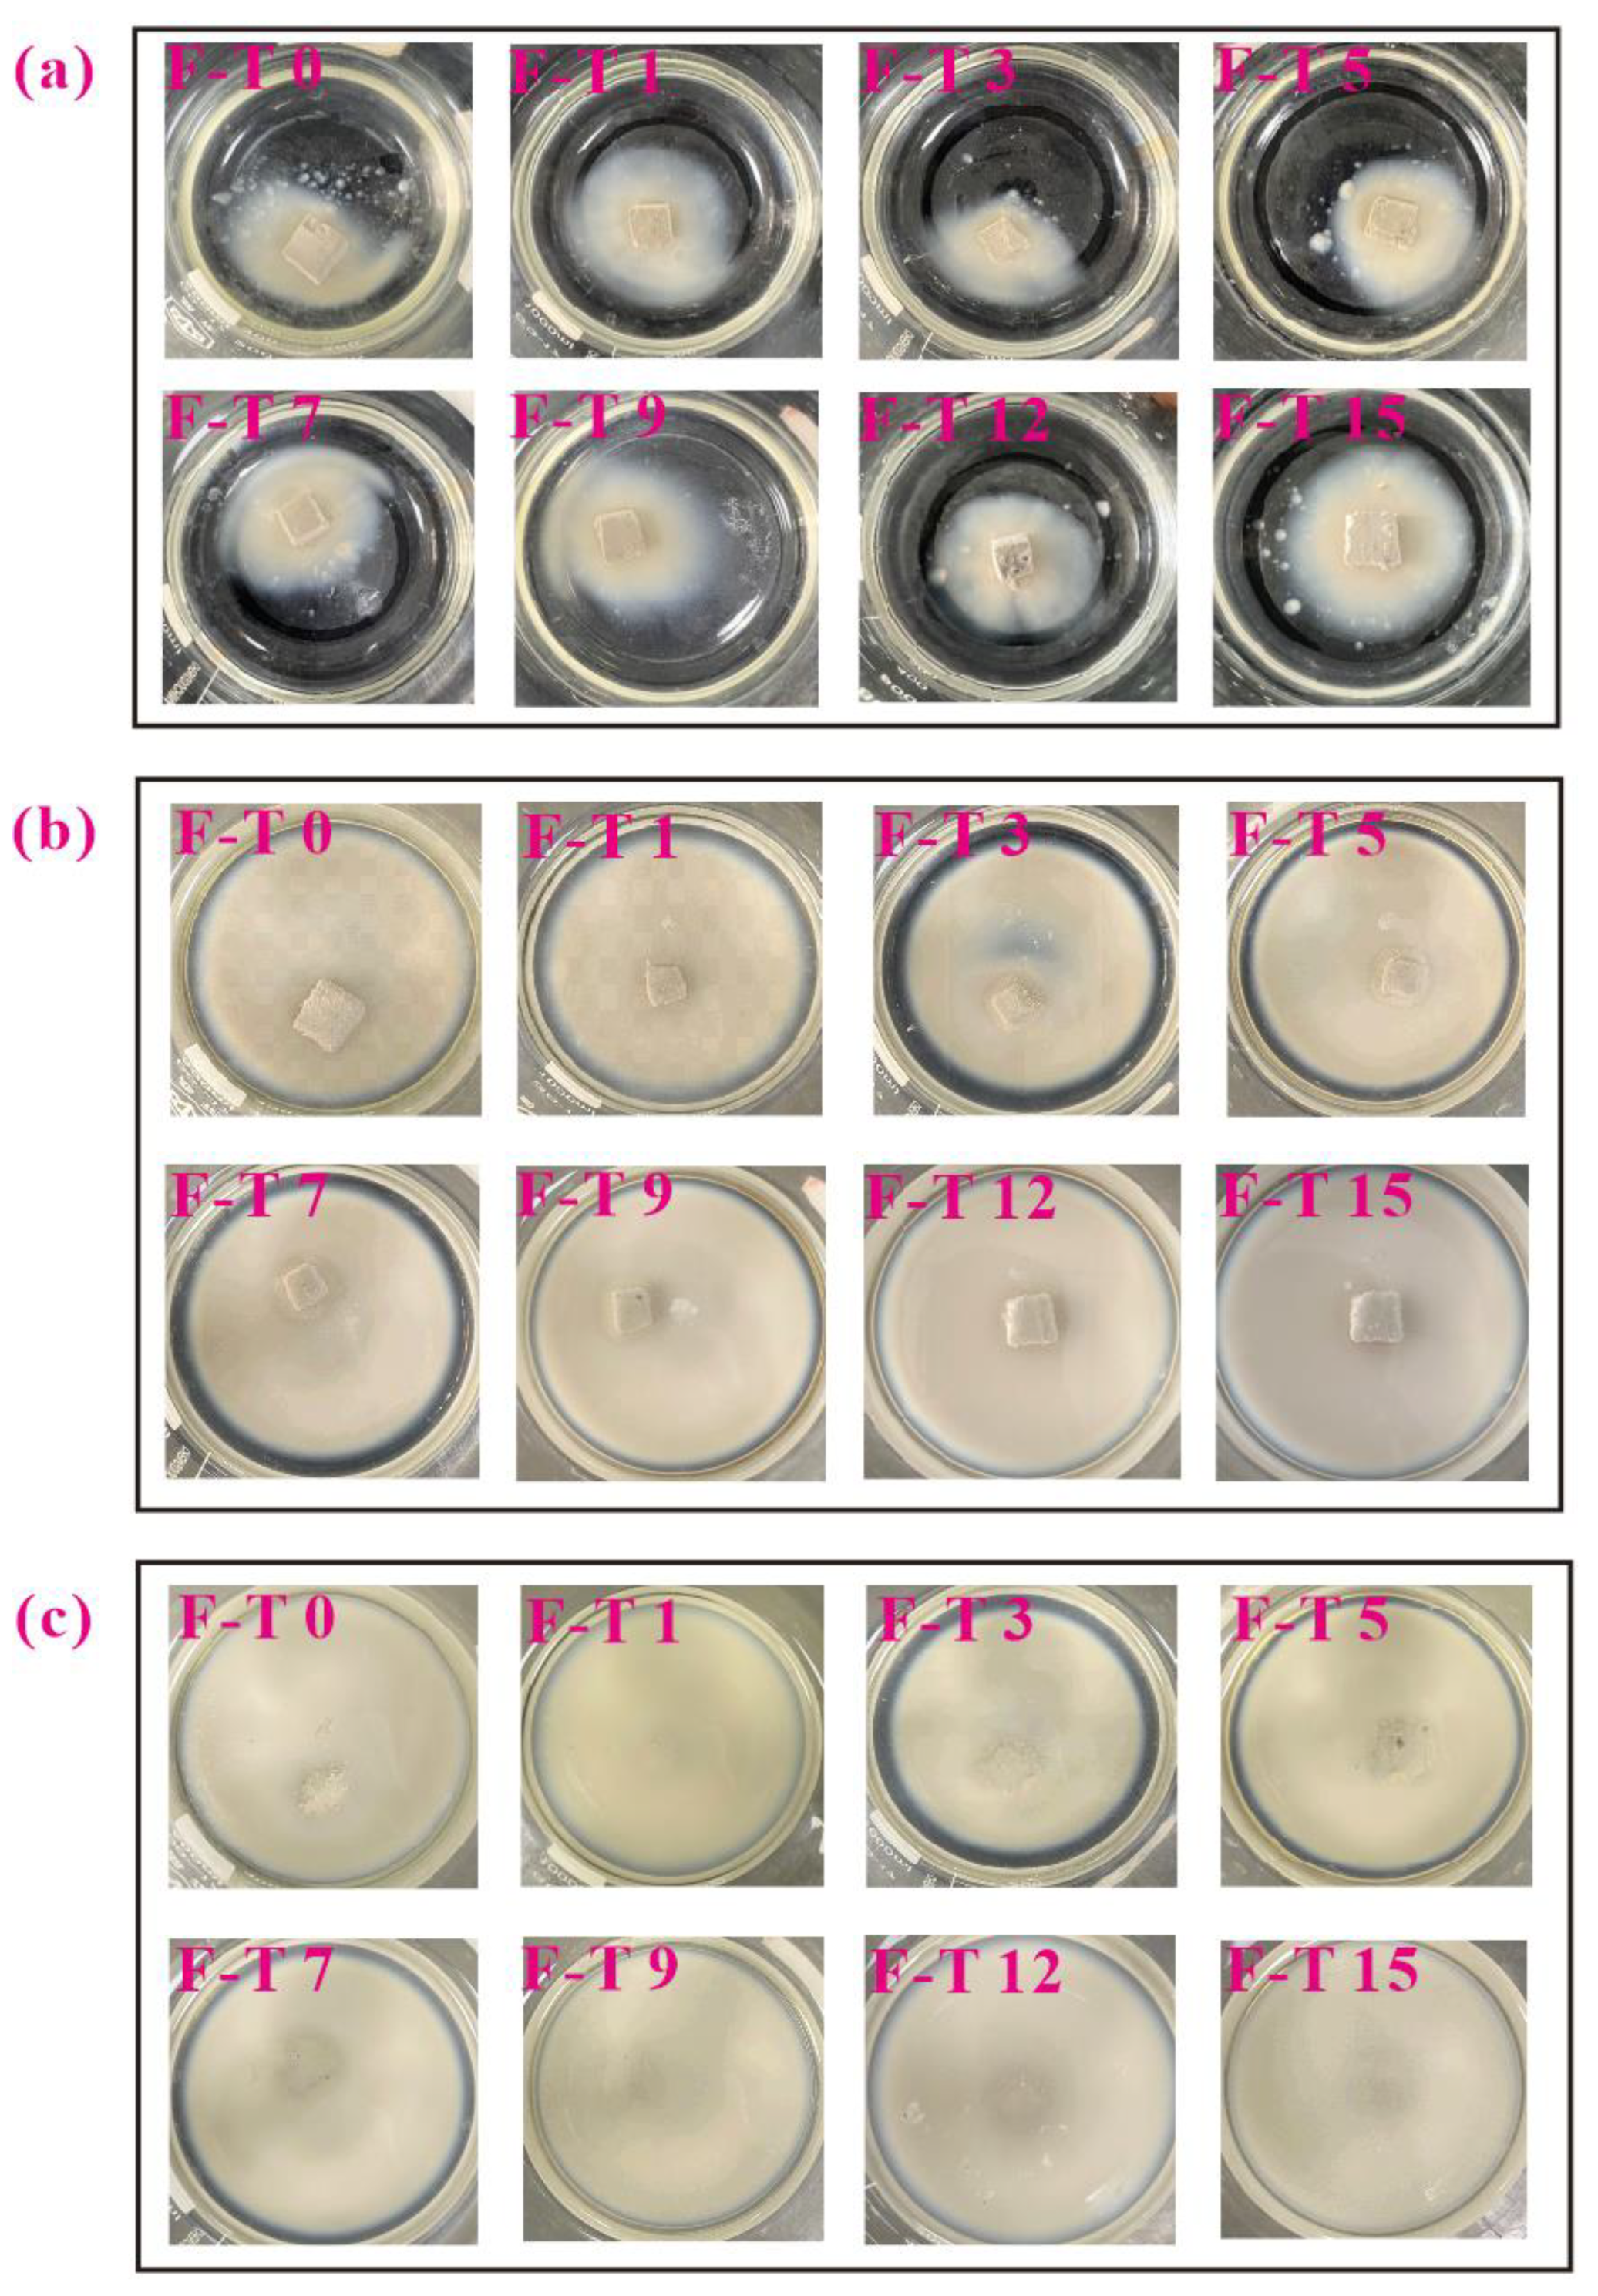
- Crumb test
- (3)
- Double hydrometer test
2.3.3. Unconfined Compressive Strength Test
2.3.4. Direct Shear Test
2.3.5. Particle Size Analysis Test
2.3.6. Scanning Electron Microscopic Test
3. Result and Discussion
3.1. Soil Sample Dispersion Identification Test
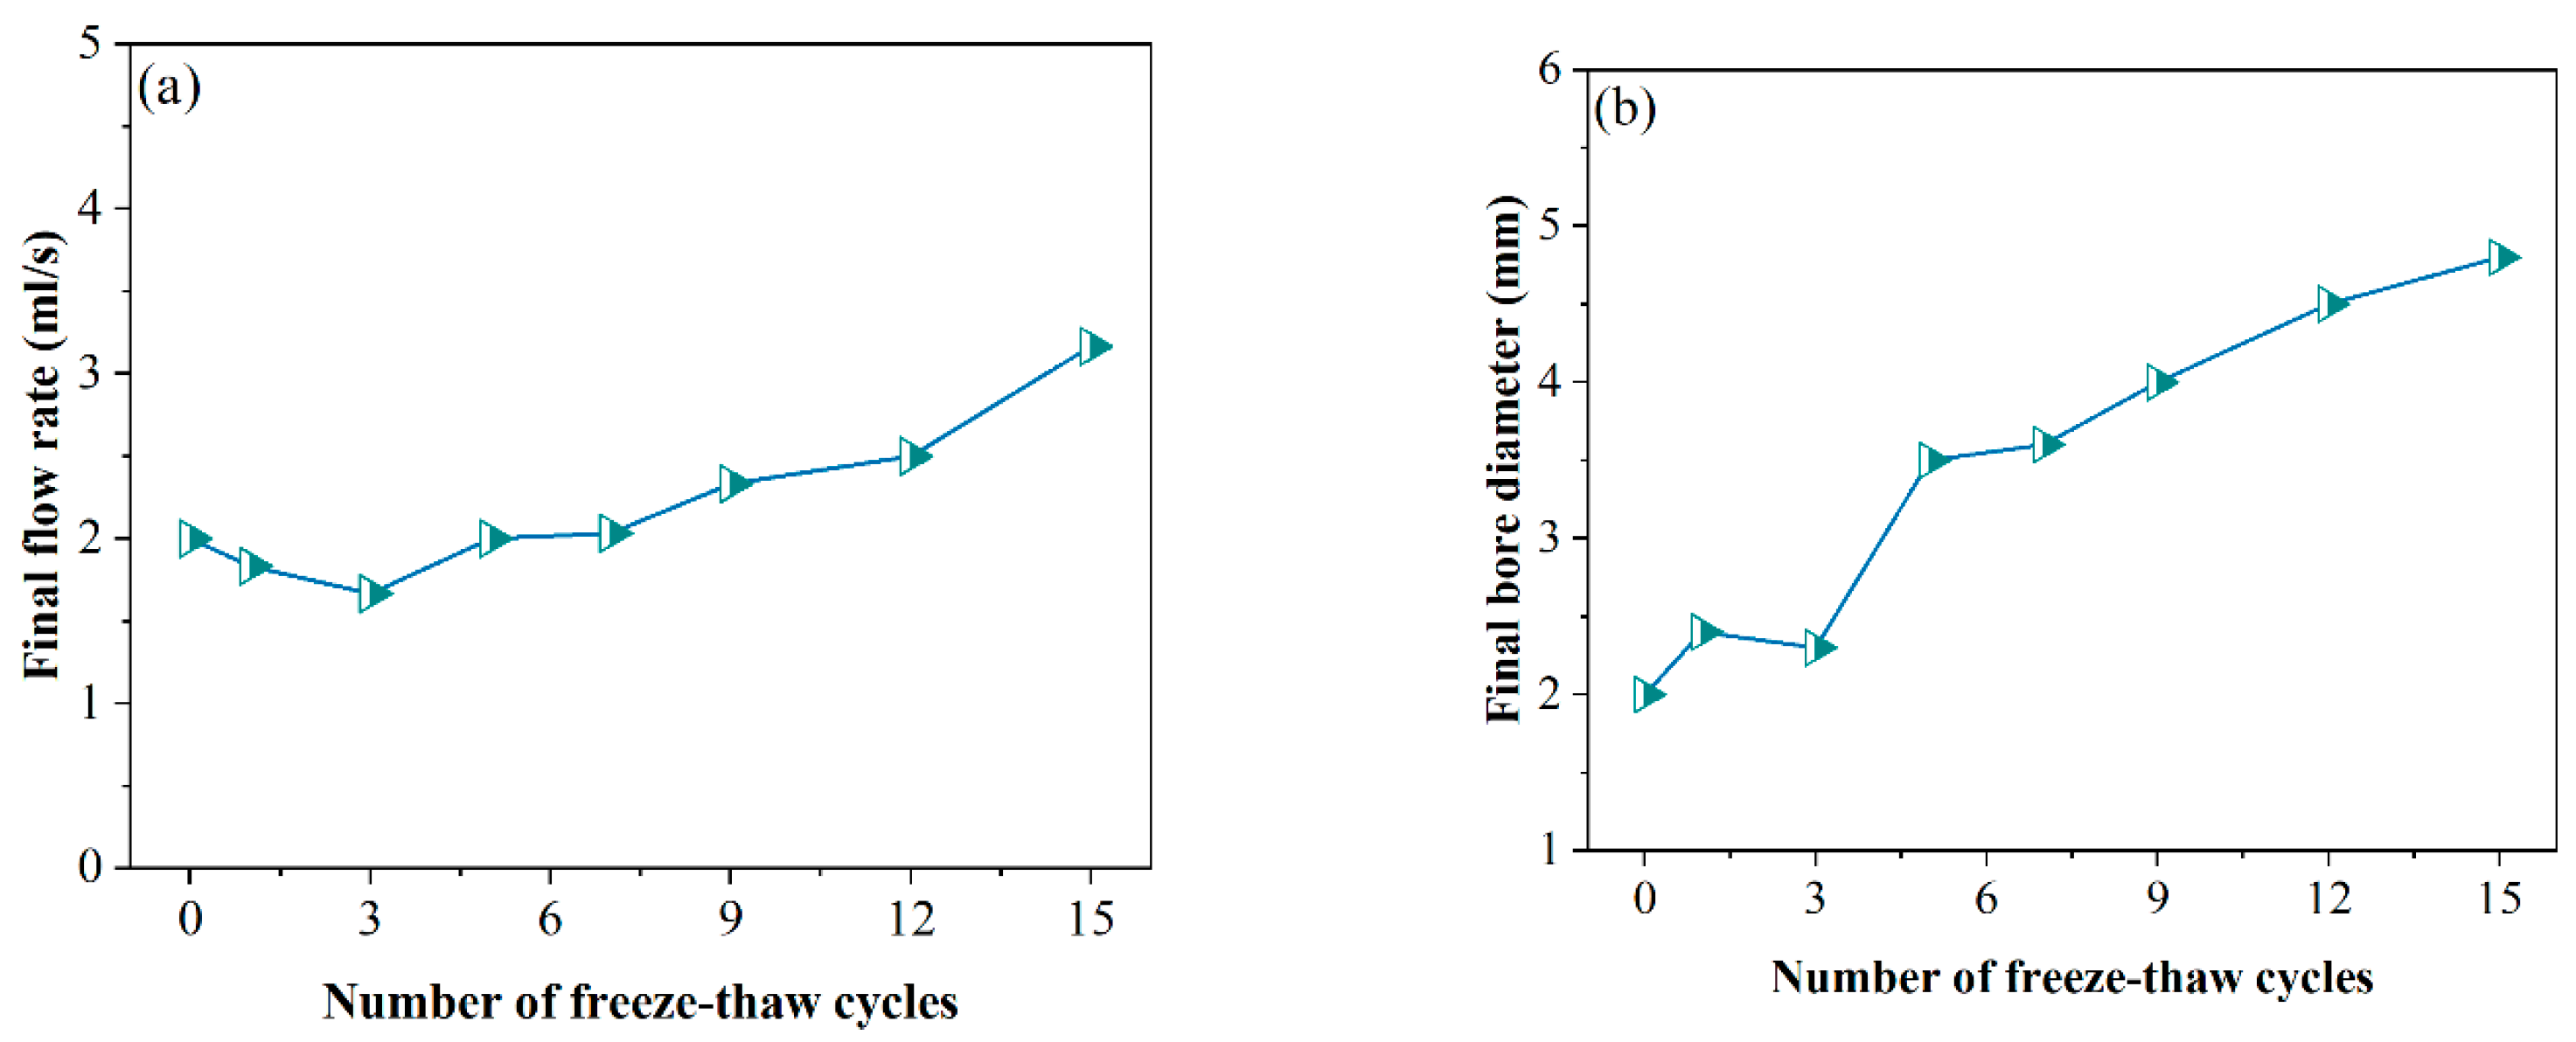
3.1.1. Pinhole Test
3.1.2. Crumb Test
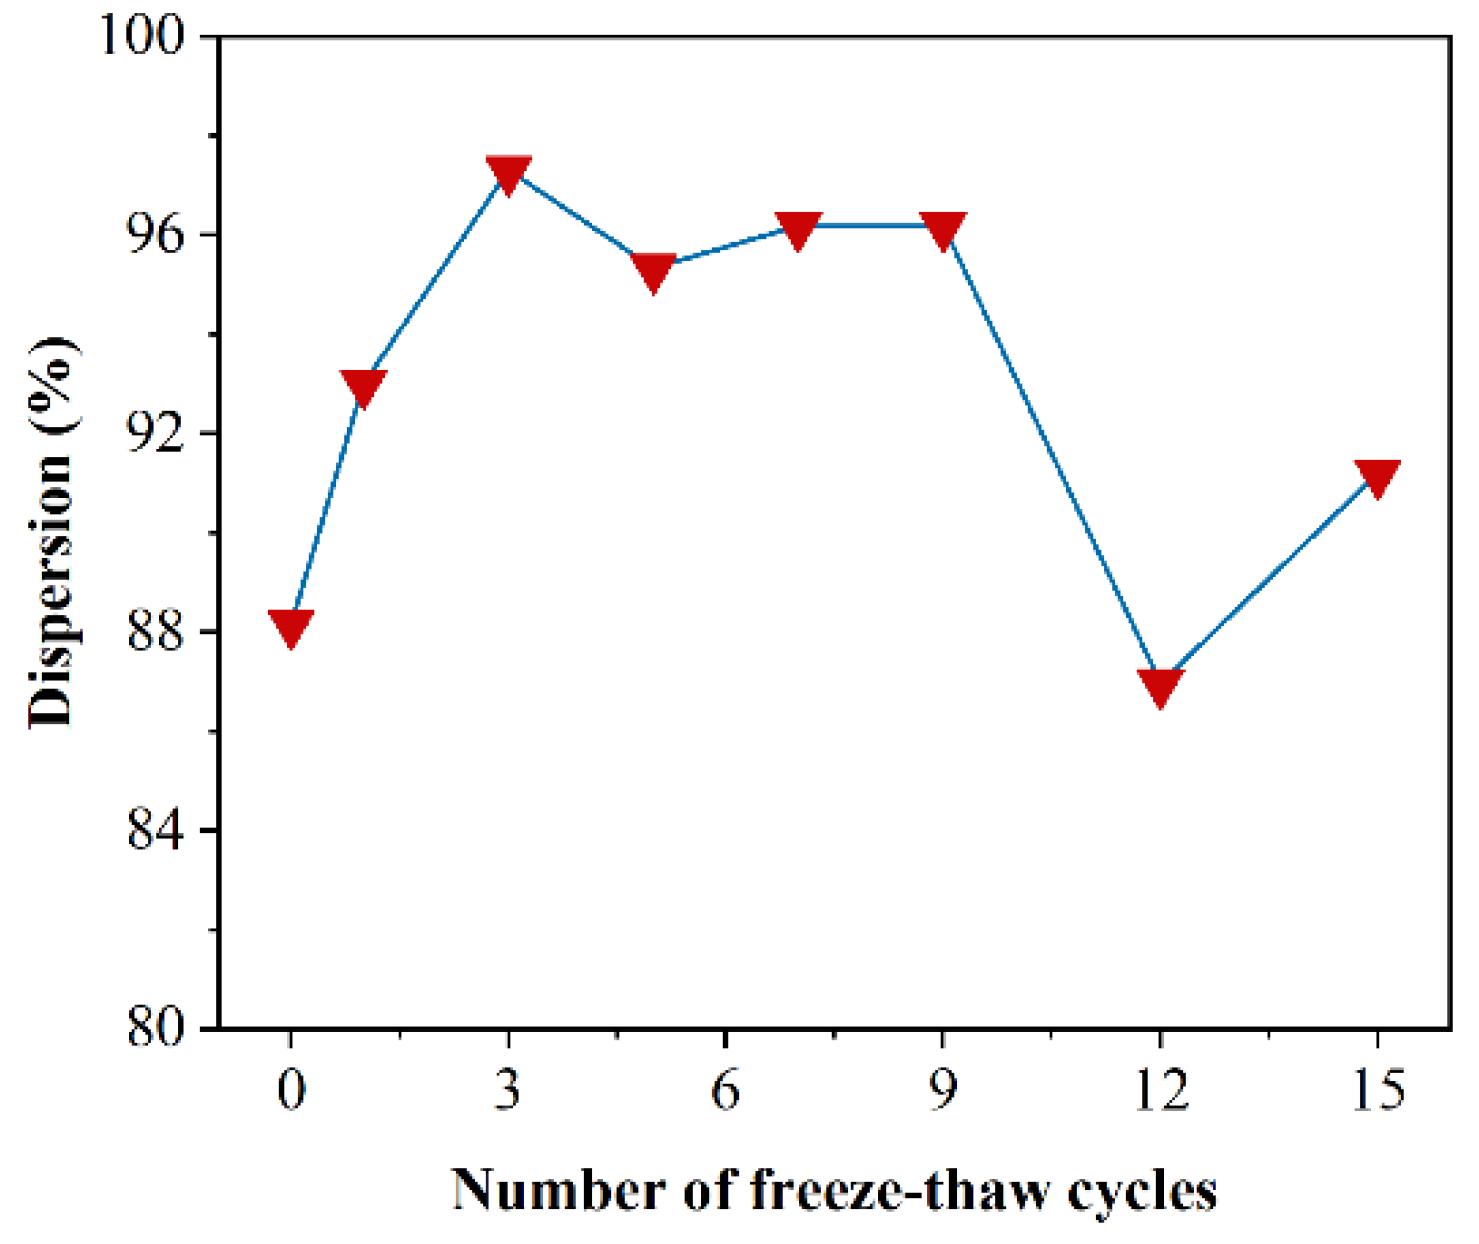
3.1.3. Double Hydrometer Test
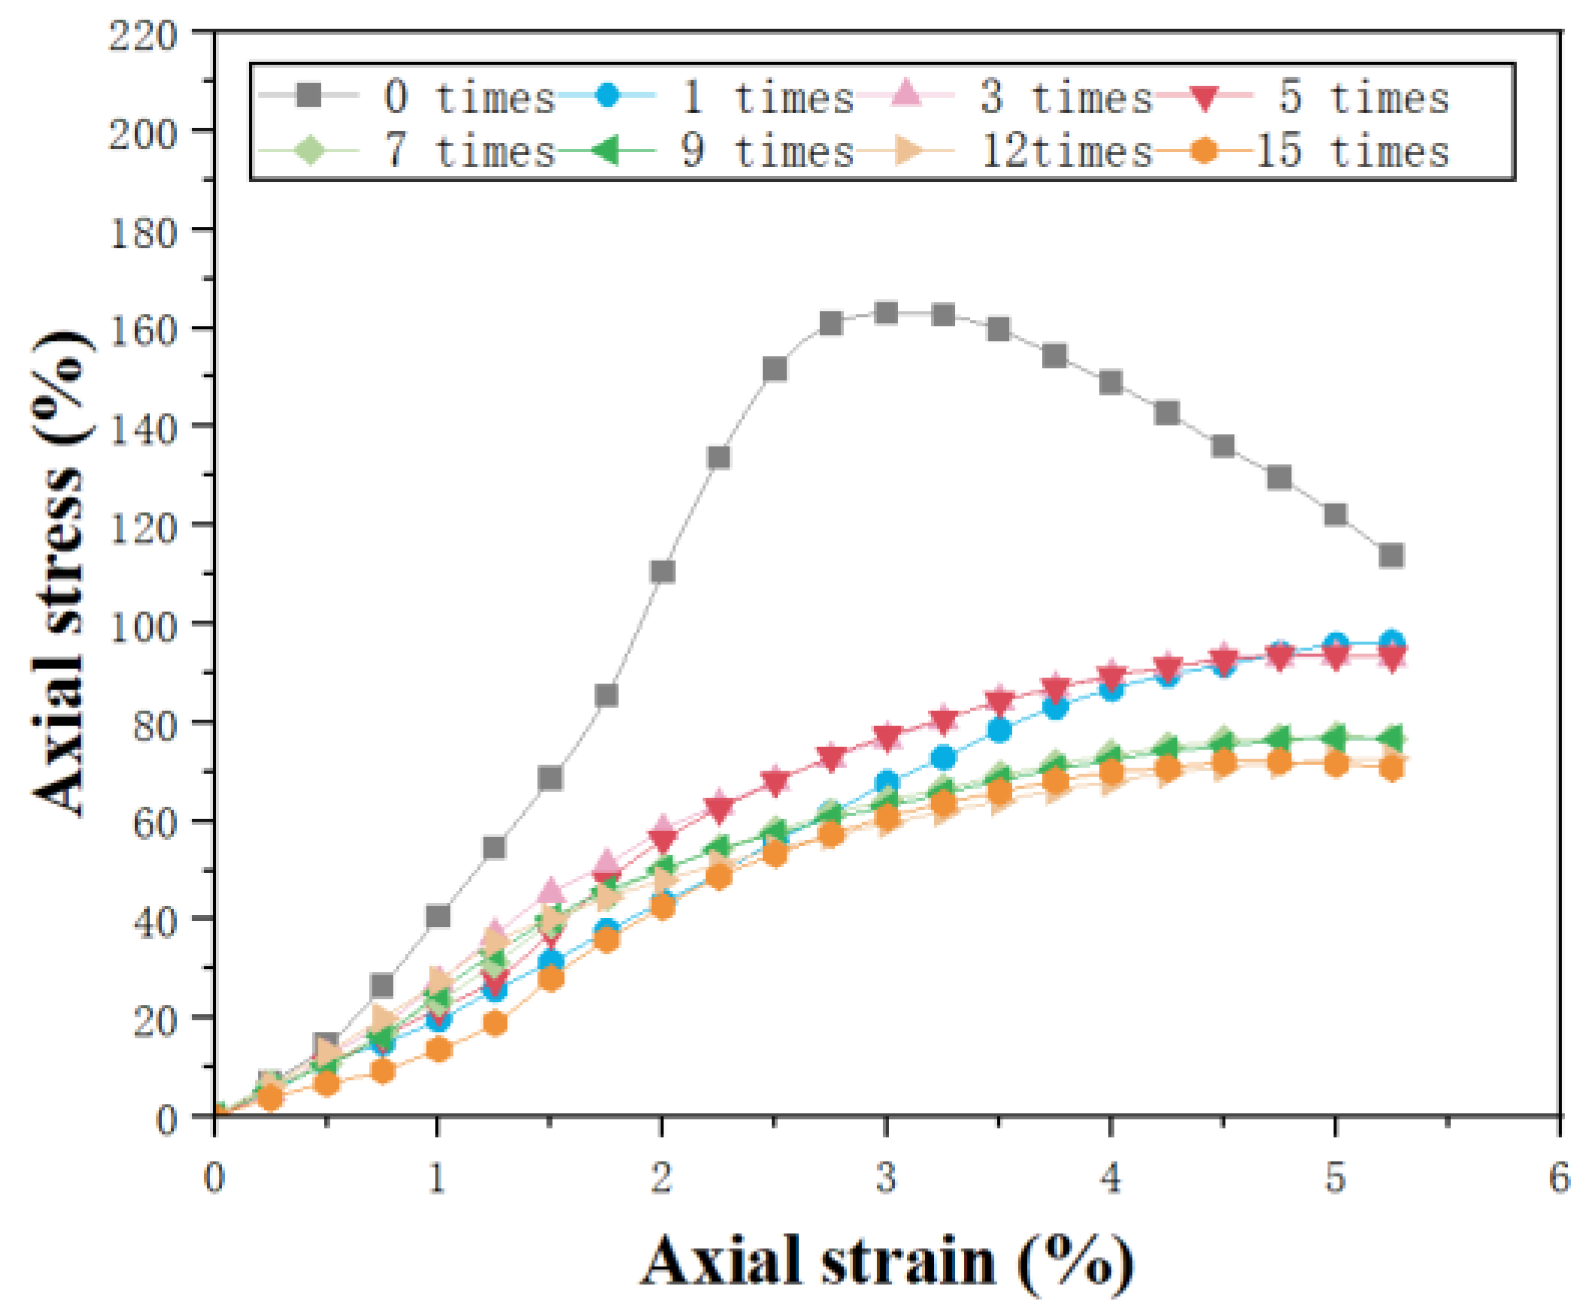
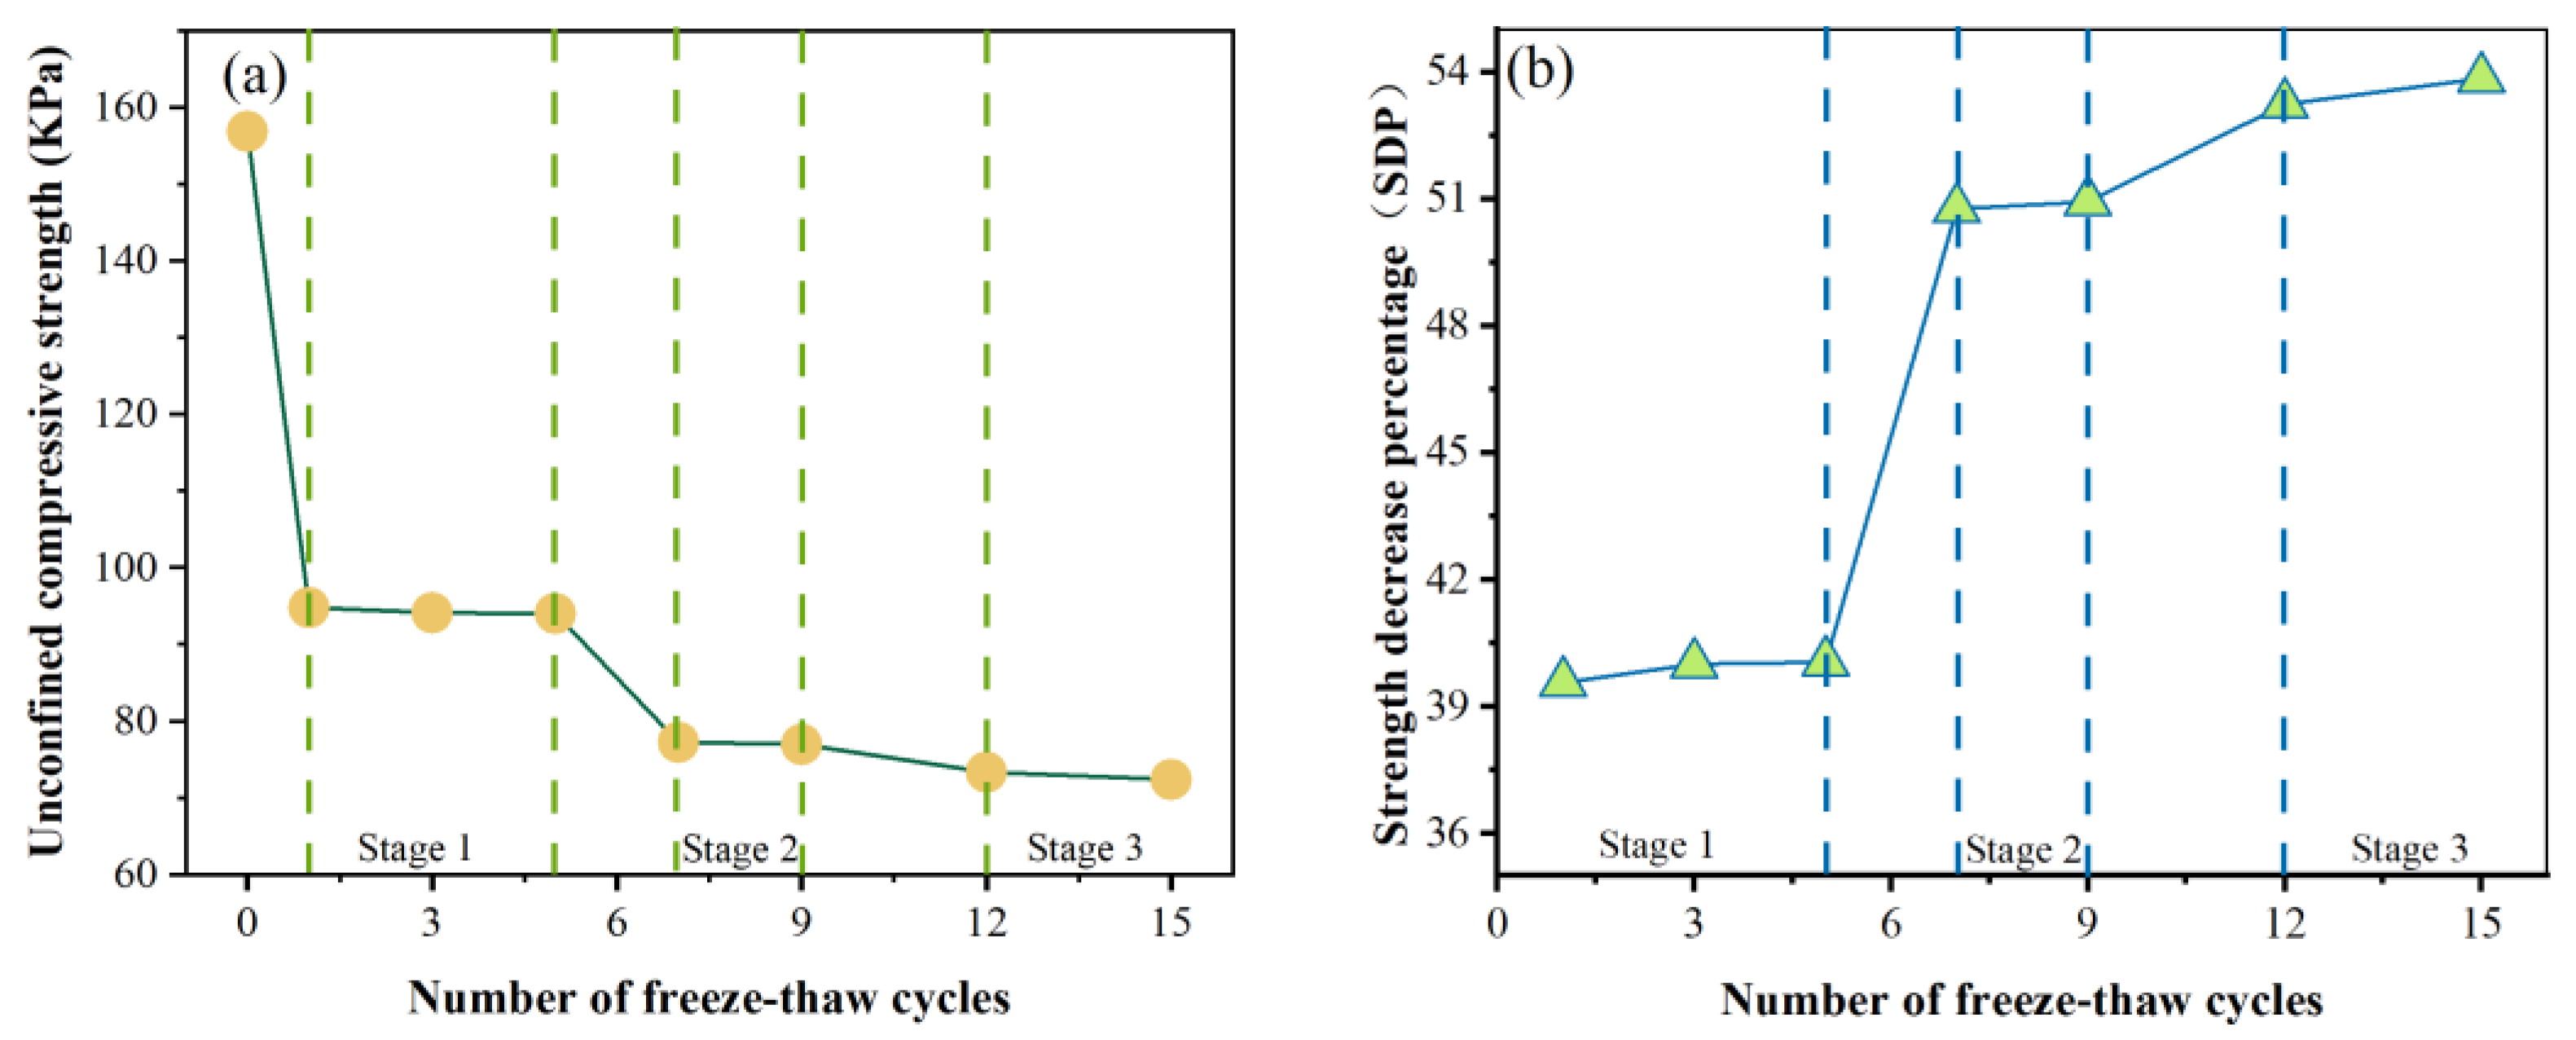
3.2. UCS Test
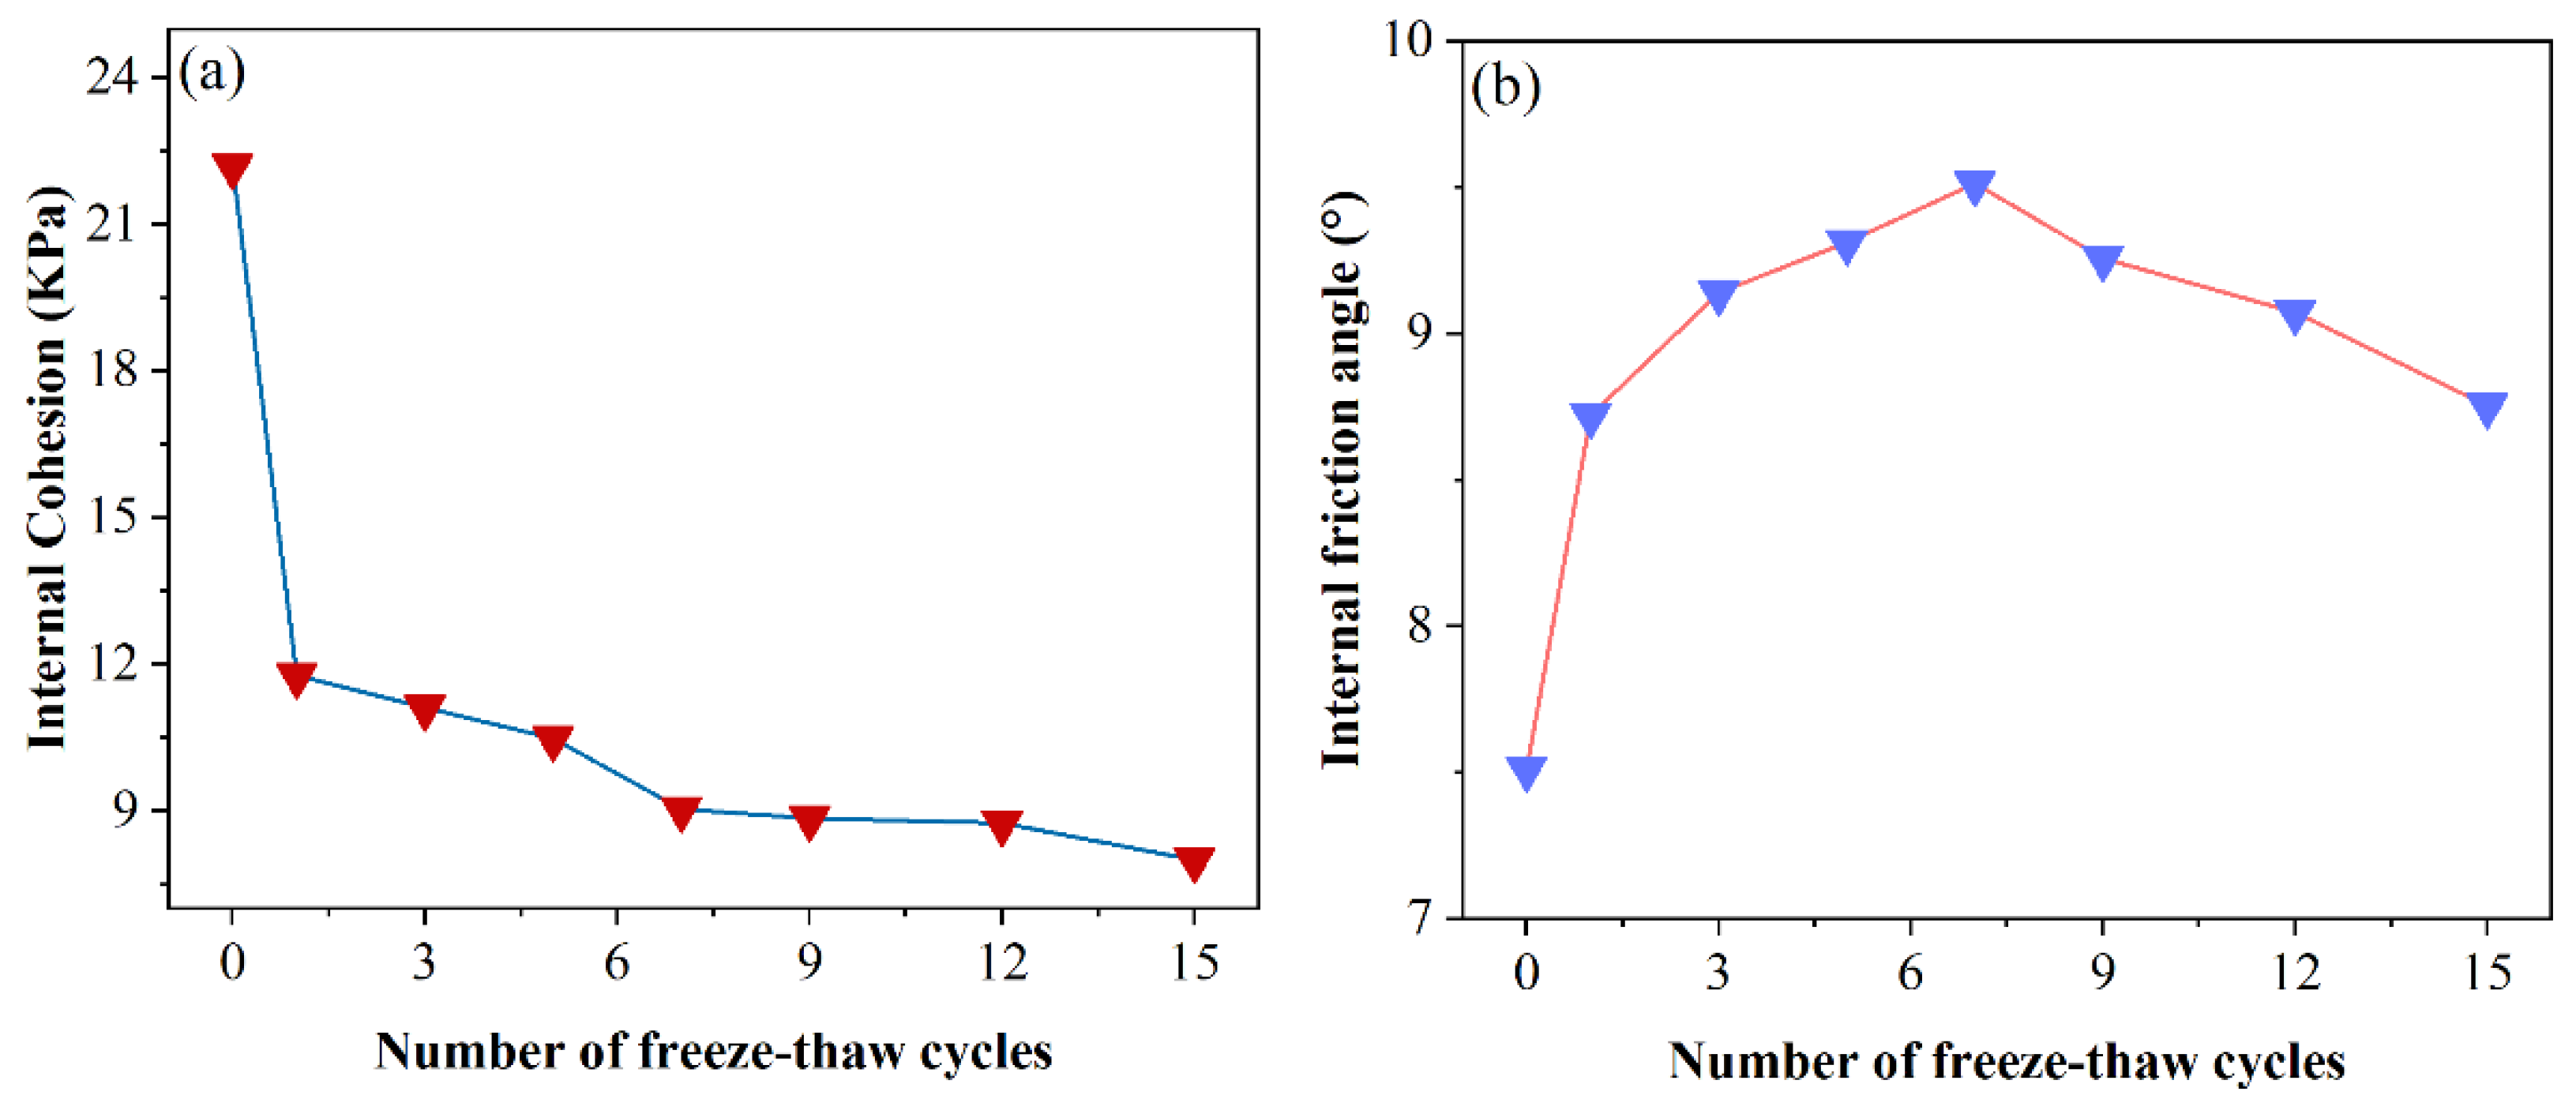
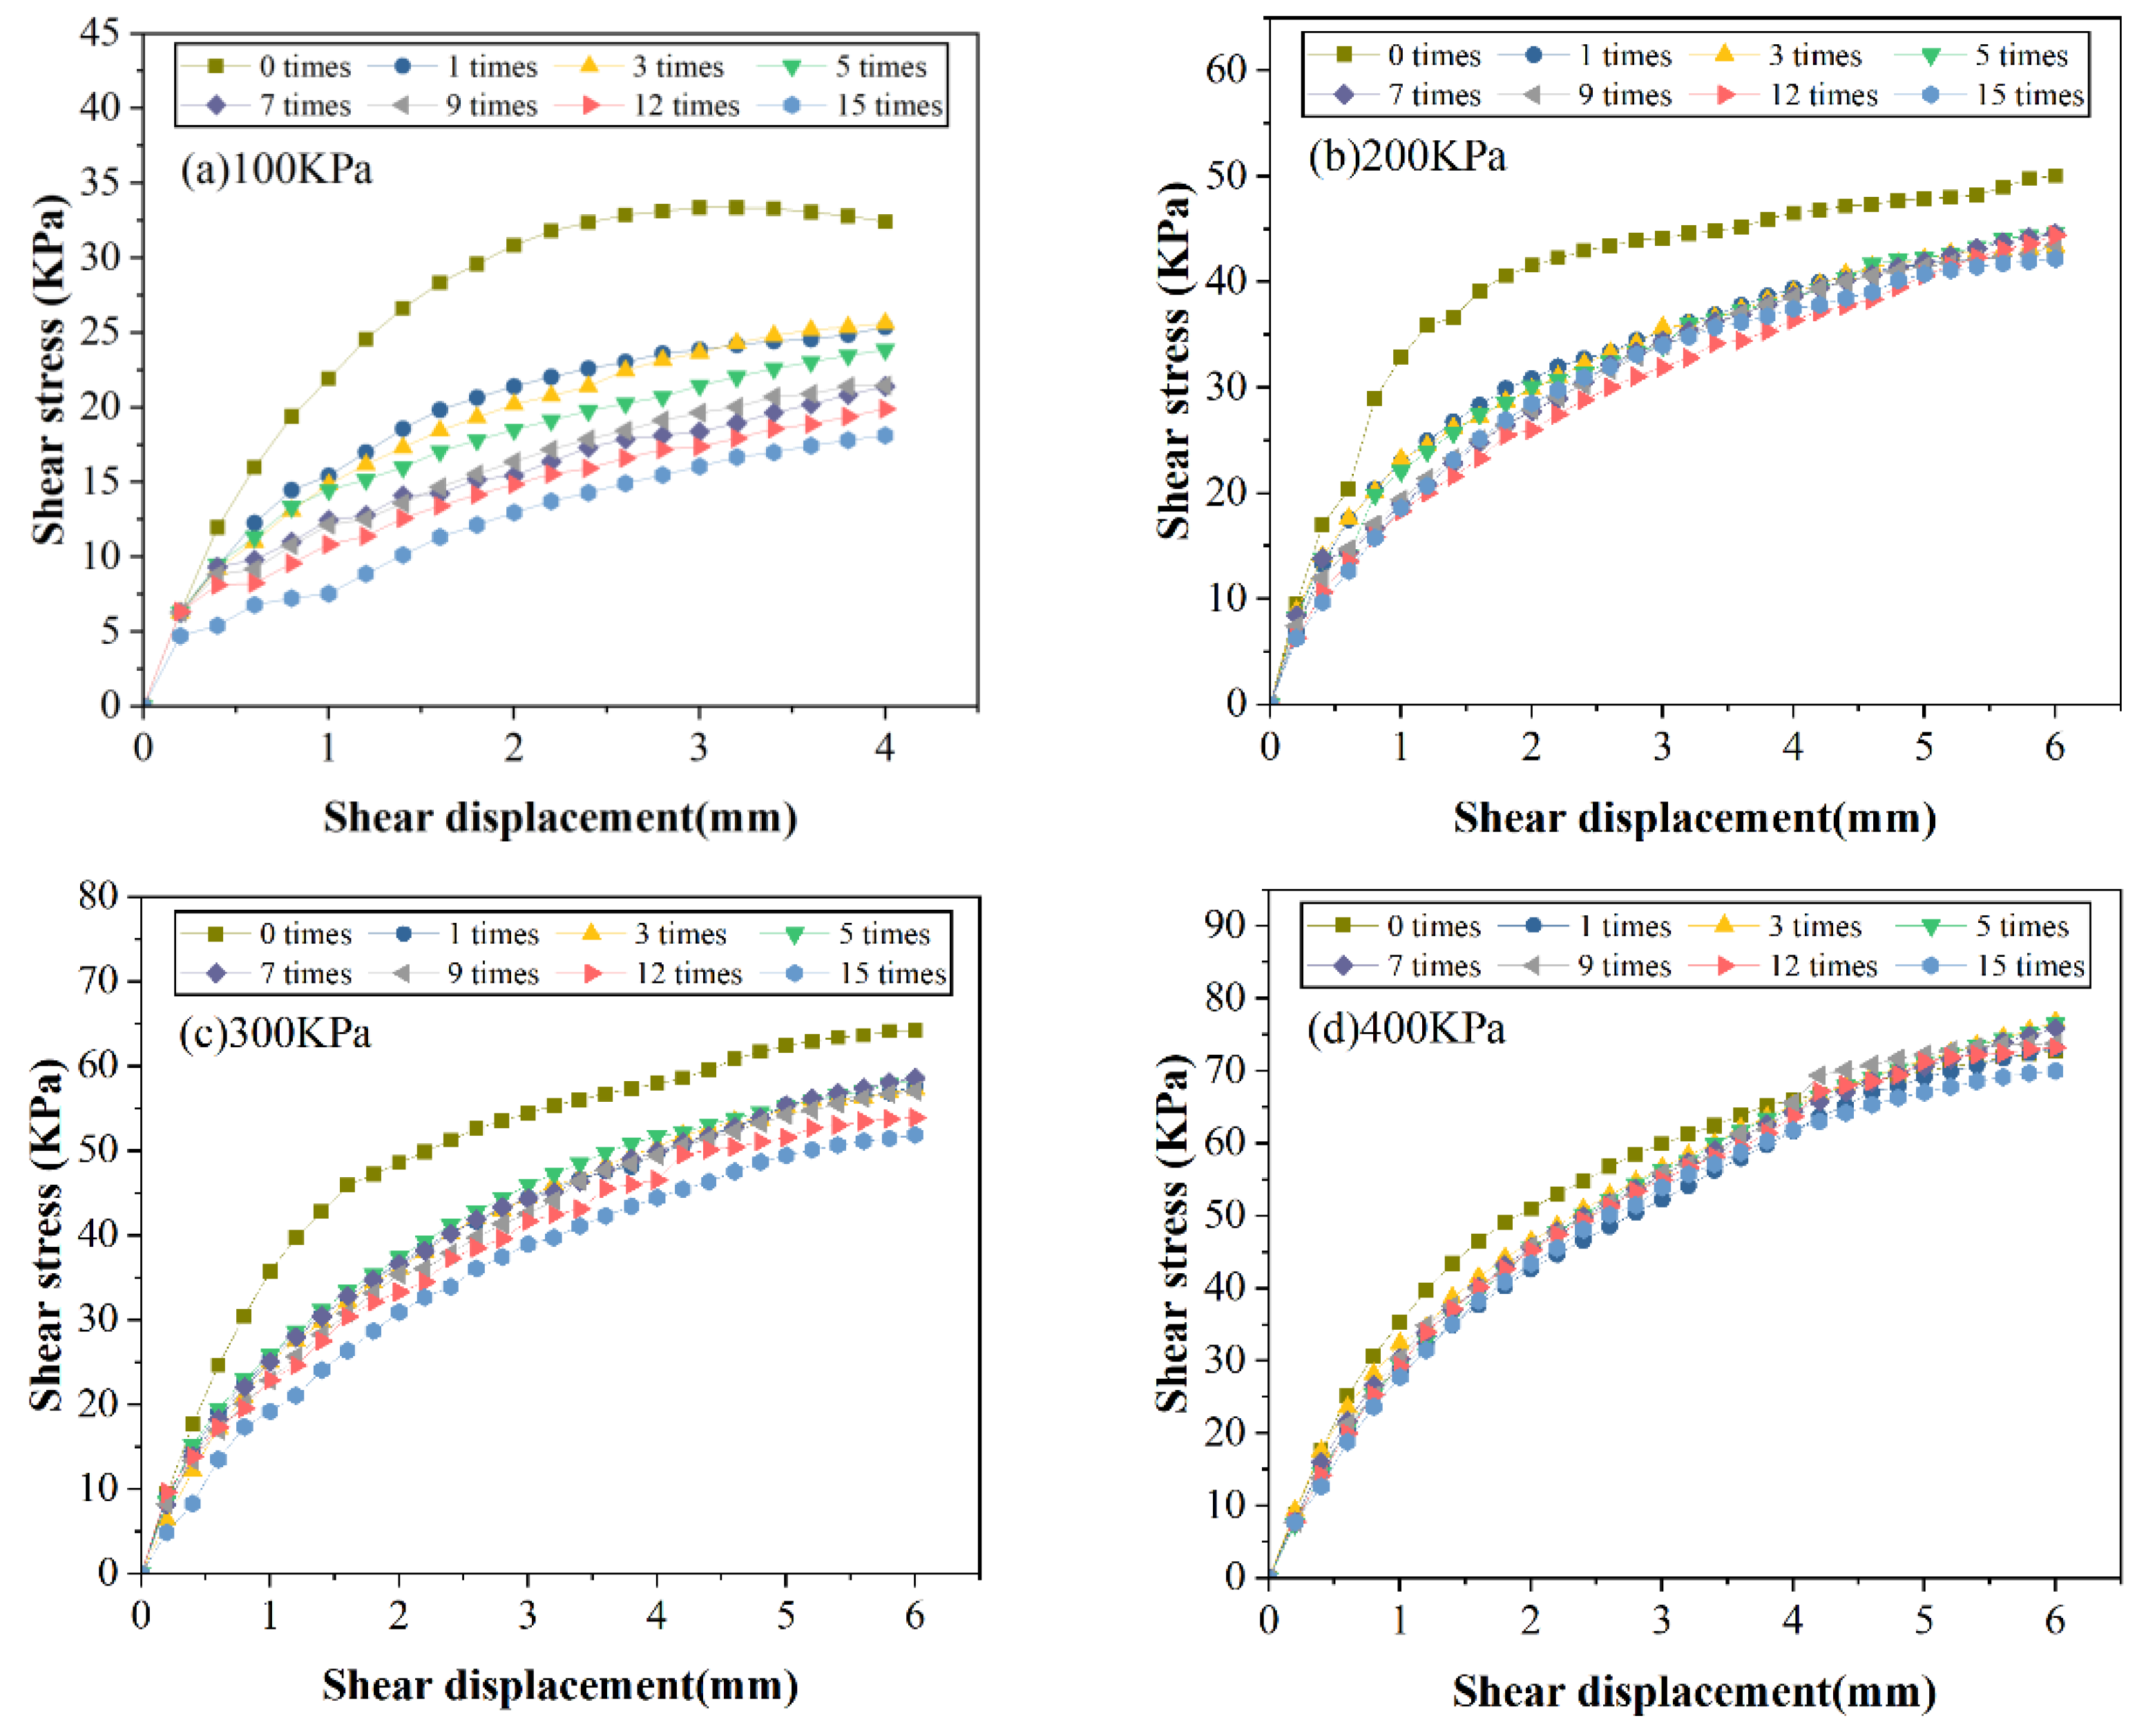
3.3. Direct Shear Test
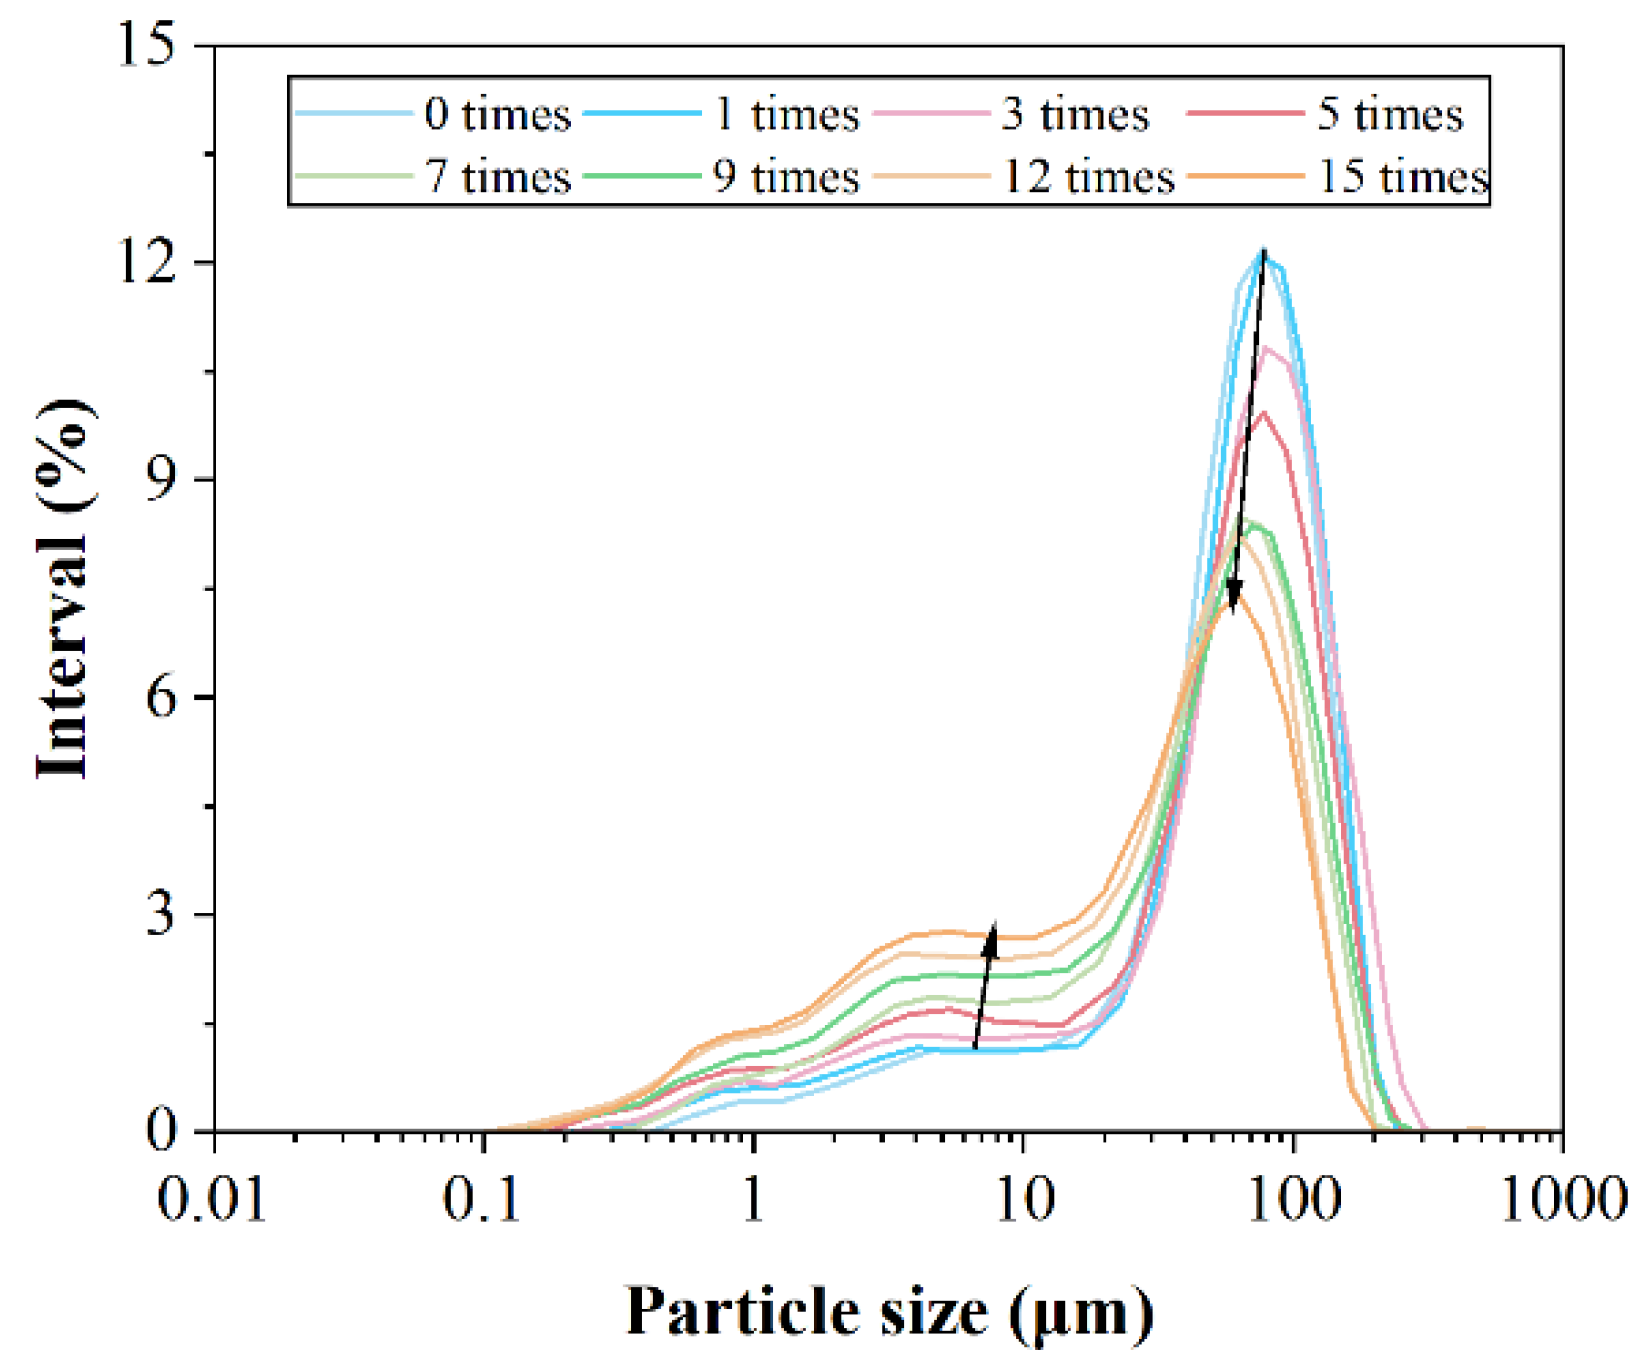
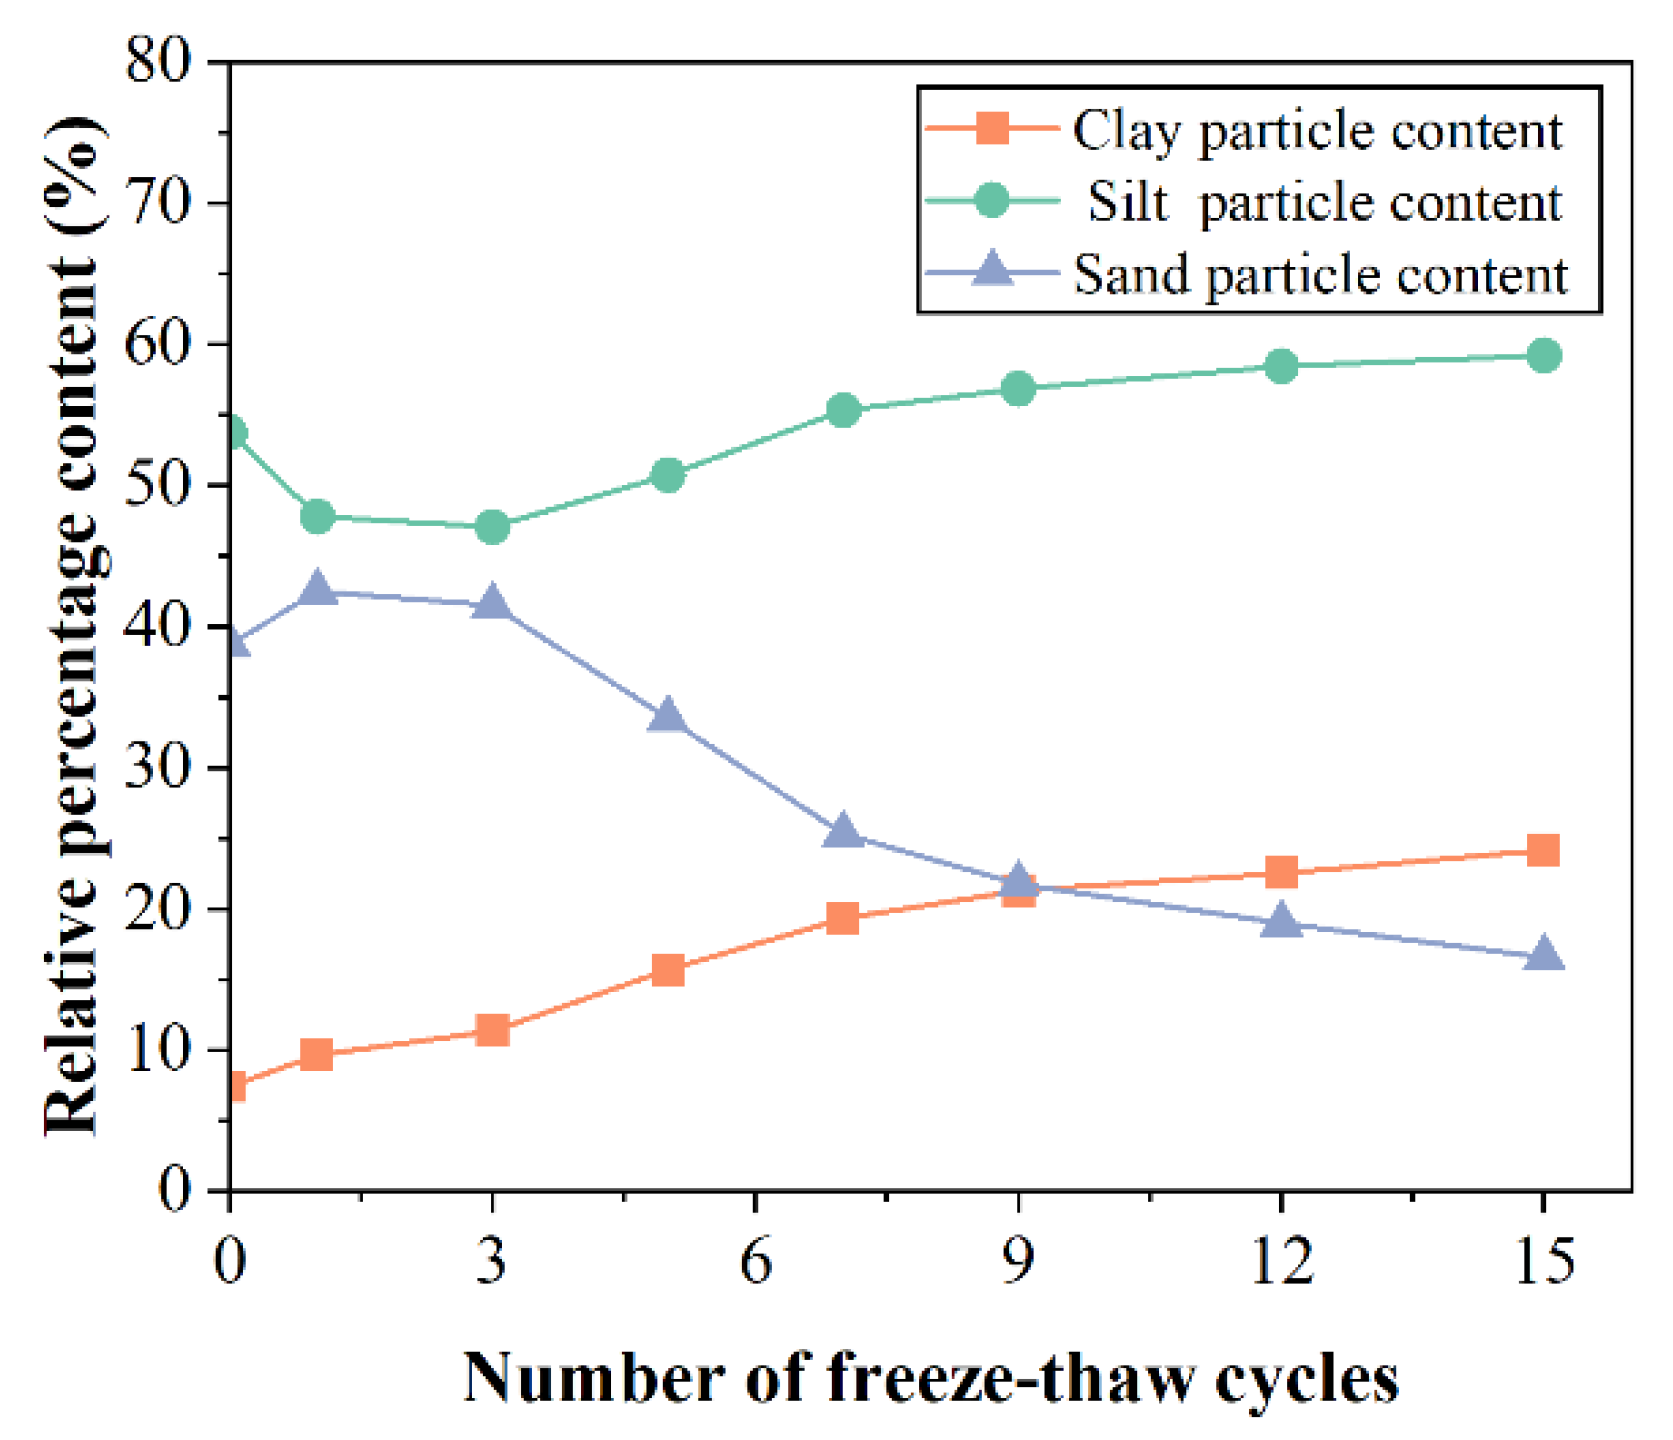
3.4. Particle Size Analysis Test
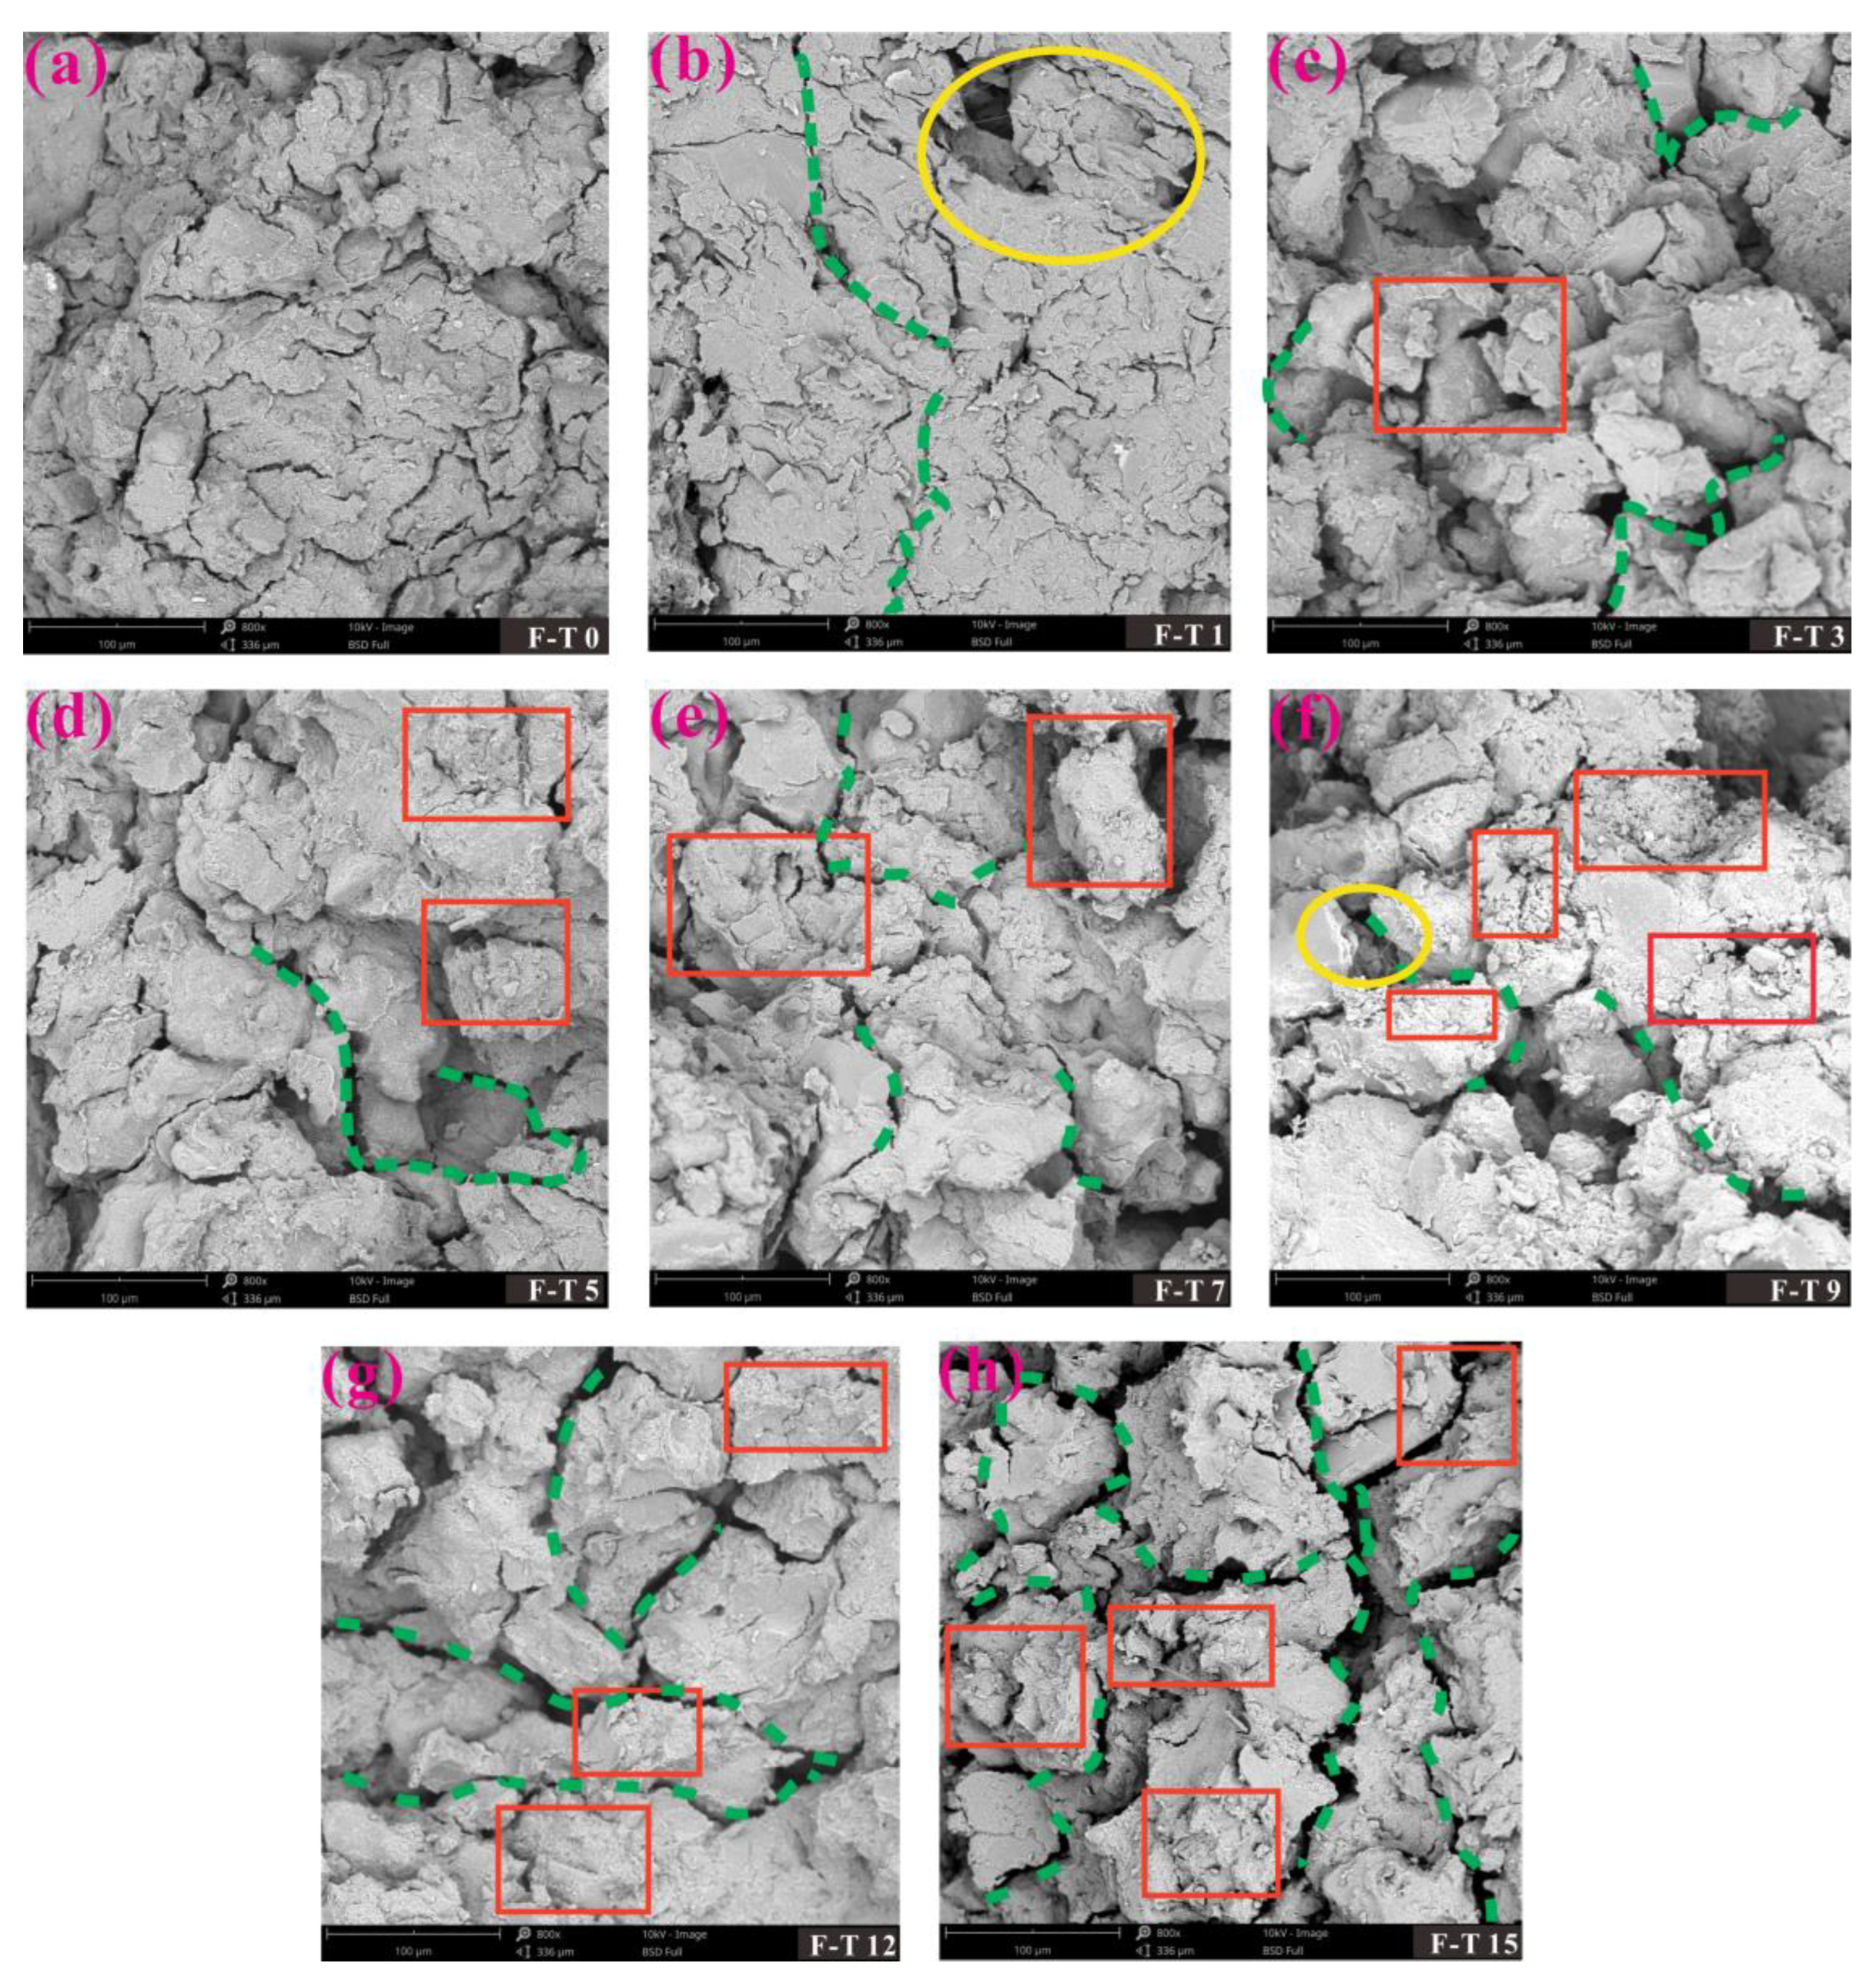
3.5. Influence of Freeze–Thaw Cycles on the Microstructure of the Soil Samples
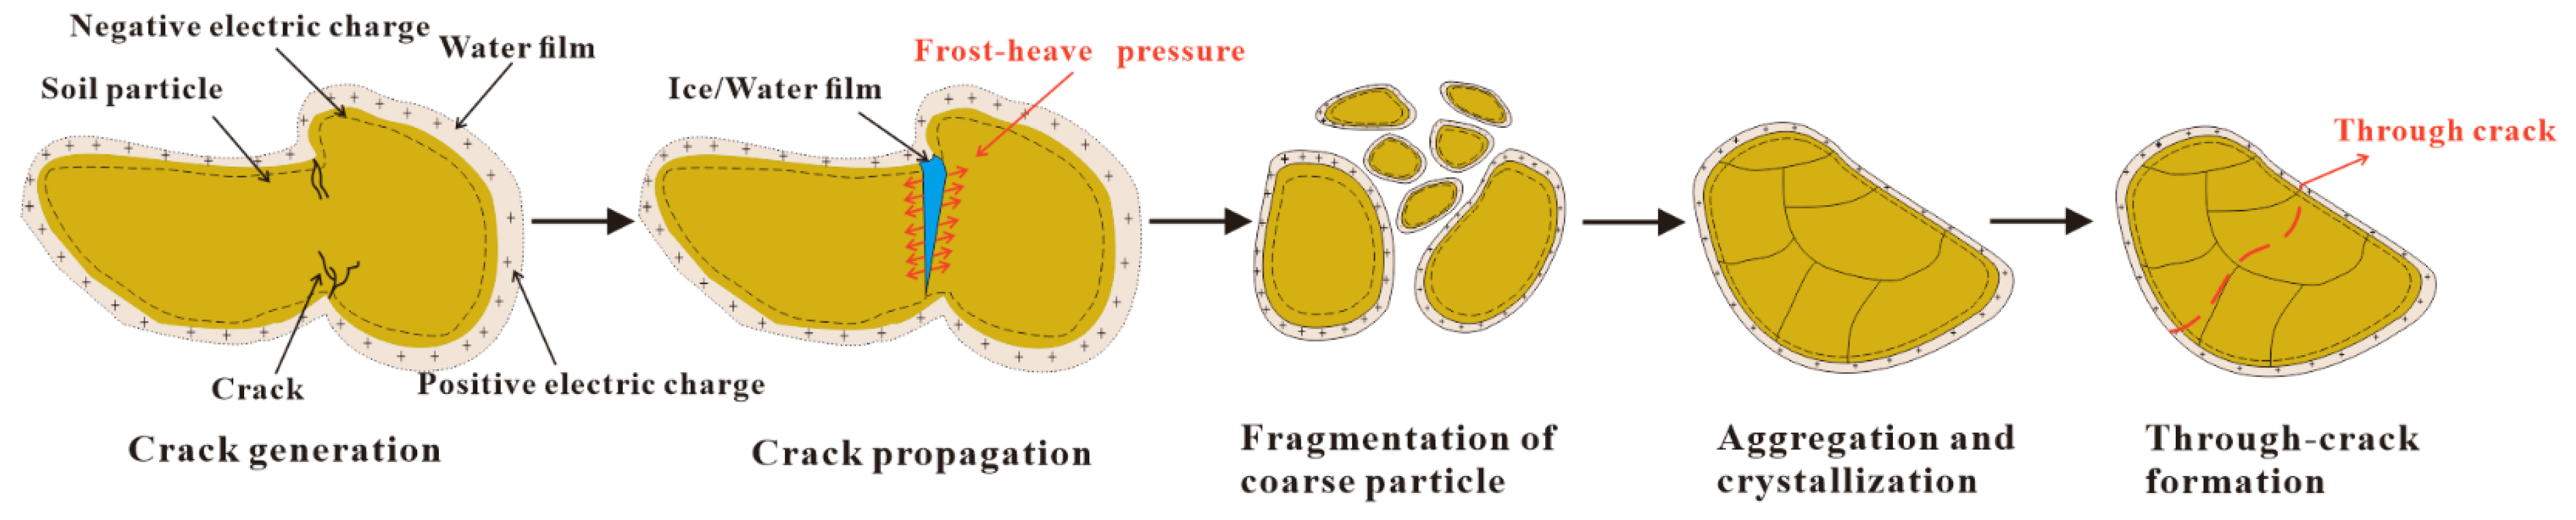
3.6. Mechanisms of Changes in the Microstructure of the Soil Samples
4. Conclusions
- (1)
- The dispersibility of the soil samples progressively increases with an increasing number of freeze–thaw cycles. Simultaneously, the corresponding increase in dispersion negatively affects the soil’s mechanical strength. Overall, these two variables exhibit a negative correlation.
- (2)
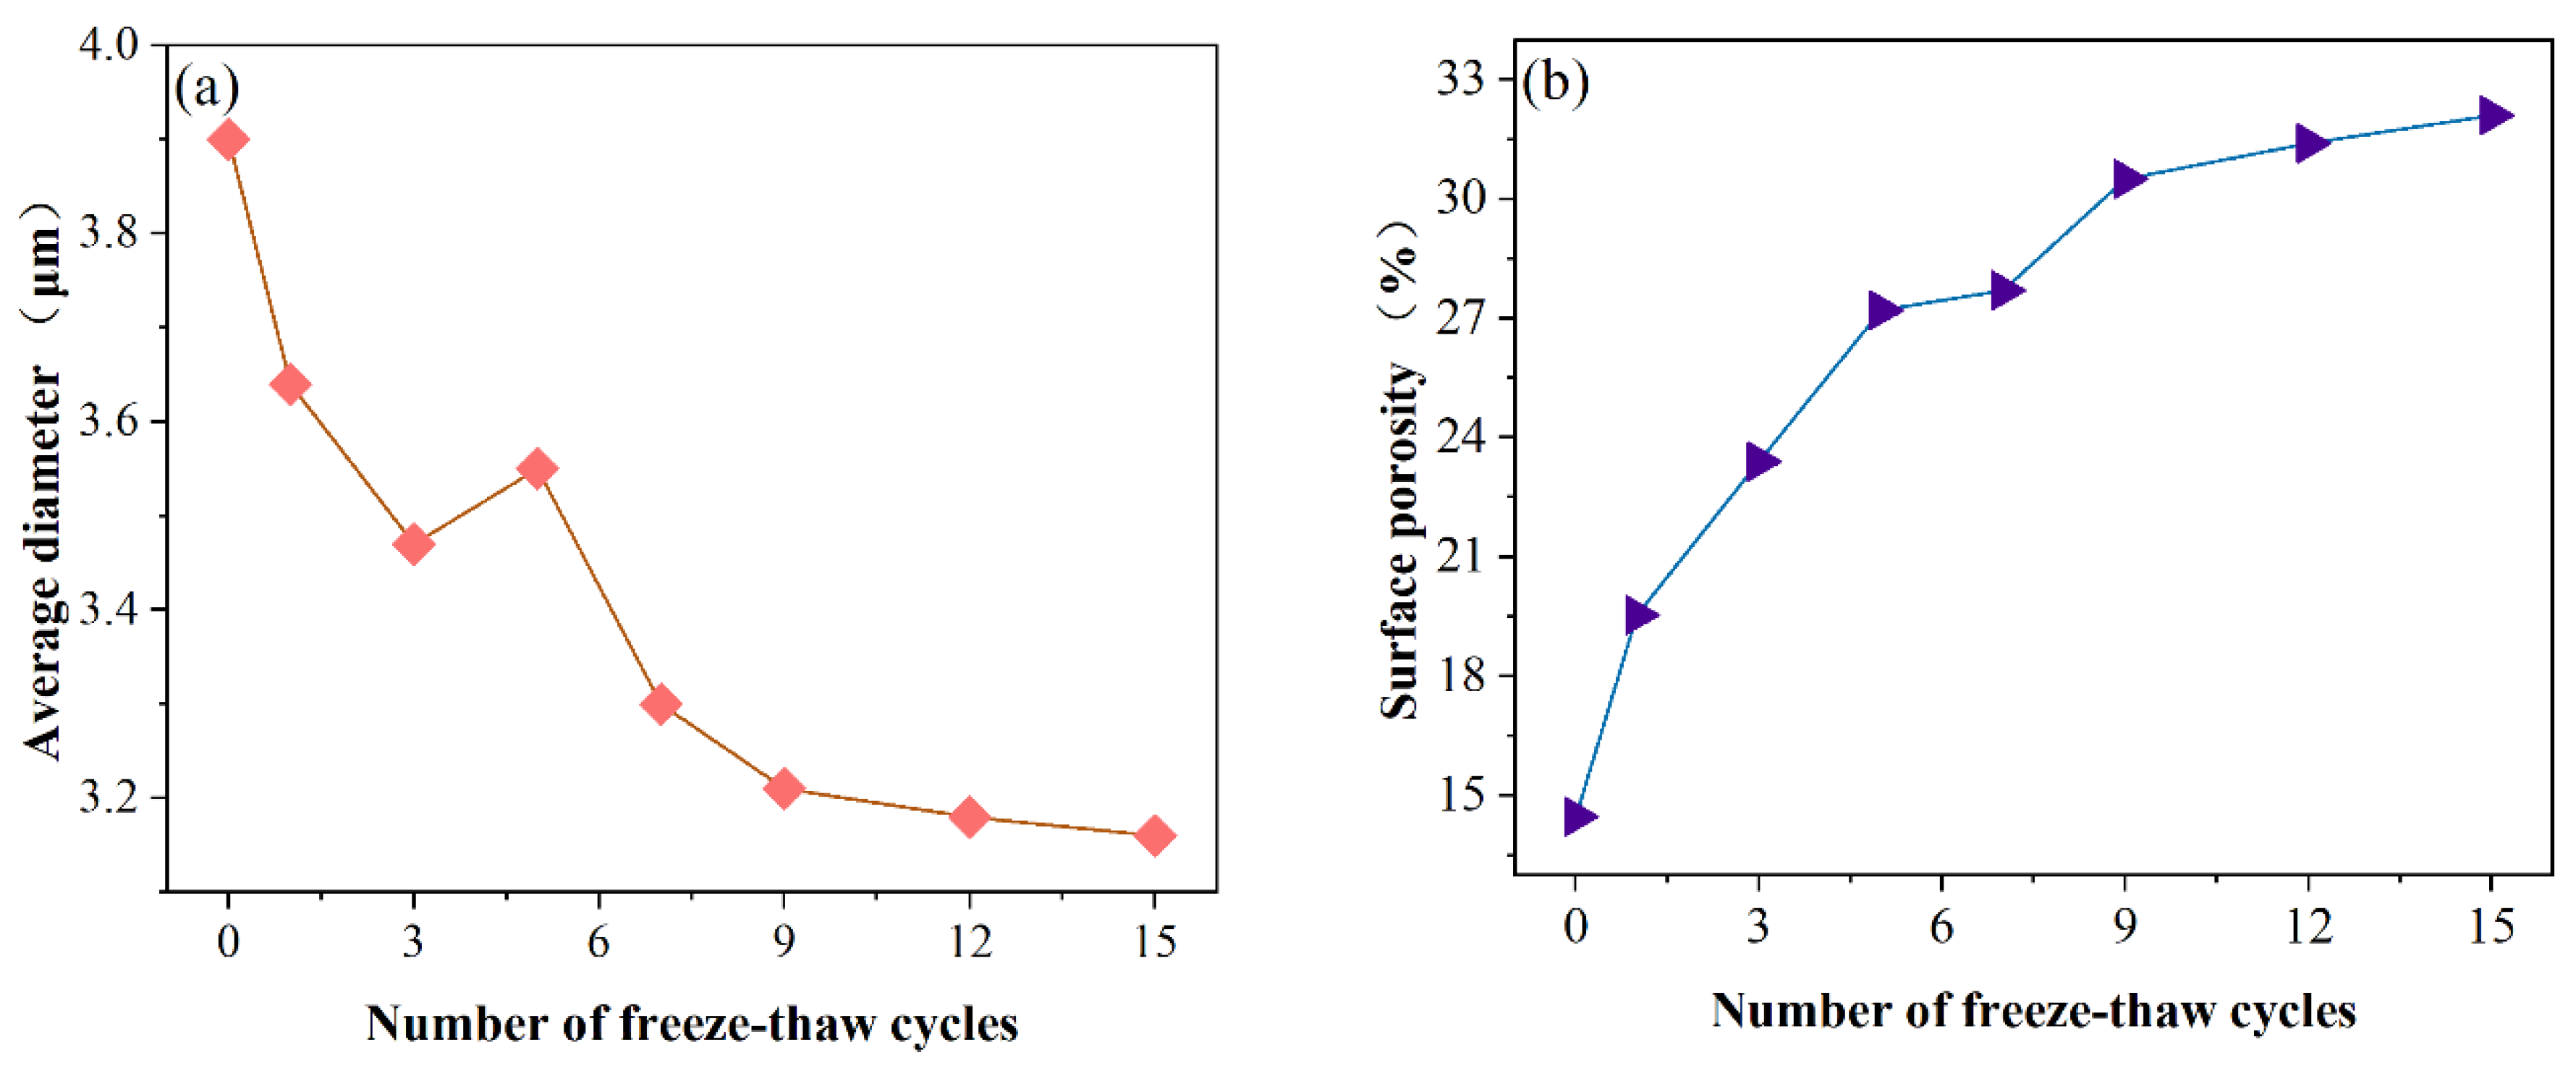
- With an increasing number of freeze–thaw cycles, the particle size distribution of the soil samples exhibits a general trend of fragmentation of large particles and gradual accumulation of smaller particles. The sand content decreases from 38.76% to 16.59%, and the clay content increases from 7.48% to 24.20%.
- (3)
- During the first nine freeze–thaw cycles, the reduction in strength is significant, with the unconfined compressive strength decreasing from 156.843 kPa to 76.961 kPa. After nine freeze–thaw cycles, the rate of decrease in strength slows down, and the unconfined compressive strength stabilizes at around 70 kPa. Furthermore, the c-value gradually decreases from 22.196 kPa in the unfrozen state to 7.997 kPa and then stabilizes. The φ-value starts at 7.514° in the unfrozen state, peaks at 9.514°, and gradually declines.
- (4)
- With increasing freeze–thaw cycles, new cracks continuously form, existing cracks expand, and the surface porosity increases from 14.47% in the unfrozen state to 32.10% after the 15th freeze–thaw cycle.
Supplementary Materials
Author Contributions
Funding
Institutional Review Board Statement
Informed Consent Statement
Data Availability Statement
Conflicts of Interest
References
- Calero, N.; Barrón, V.; Torrent, J. Water Dispersible Clay in Calcareous Soils of Southwestern Spain. CATENA 2008, 74, 22–30. [Google Scholar] [CrossRef]
- Zhang, J.; Wang, Q.; Wang, W.; Zhang, X. The Dispersion Mechanism of Dispersive Seasonally Frozen Soil in Western Jilin Province. Bull. Eng. Geol. Environ. 2021, 80, 5493–5503. [Google Scholar] [CrossRef]
- Wang, W.; Wang, Q.; Zhang, X.; Zhao, W.; Zhang, J. Analysis of the Frost Heaving Characteristics of Carbonate-Saline Soil in Western Jilin Province, China. Fresenius Environ. Bull. 2017, 26, 4170–4179. [Google Scholar]
- Zhang, Z.; Ma, W.; Feng, W.; Xiao, D.; Hou, X. Reconstruction of Soil Particle Composition During Freeze-Thaw Cycling: A Review. Pedosphere 2016, 26, 167–179. [Google Scholar] [CrossRef]
- Ghazavi, M.; Roustaie, M. The Influence of Freeze–Thaw Cycles on the Unconfined Compressive Strength of Fiber-Reinforced Clay. Cold Reg. Sci. Technol. 2010, 61, 125–131. [Google Scholar] [CrossRef]
- Chamberlain, E.J.; Gow, A.J. Effect of Freezing and Thawing on the Permeability and Structure of Soils. Dev. Geotech. Eng. 1979, 26, 73–92. [Google Scholar] [CrossRef]
- Qi, J. Influence of Freezing-Thawing on Soil Structure and Its Soil Mechanics Significance. Chin. J. Rock Mech. Eng. 2003, 22, 2690–2694. [Google Scholar]
- Sterpi, D. Effect of Freeze–Thaw Cycles on the Hydraulic Conductivity of a Compacted Clayey Silt and Influence of the Compaction Energy. Soils Found. 2015, 55, 1326–1332. [Google Scholar] [CrossRef]
- Hohmann-Porebska, M. Microfabric Effects in Frozen Clays in Relation to Geotechnical Parameters. Appl. Clay Sci. 2002, 21, 77–87. [Google Scholar] [CrossRef]
- Qi, J.; Vermeer, P.A.; Cheng, G. A Review of the Influence of Freeze-Thaw Cycles on Soil Geotechnical Properties: Freeze-Thaw and Soil Properties. Permafr. Periglac. Process. 2006, 17, 245–252. [Google Scholar] [CrossRef]
- Nagy, G.; Nagy, L.; Kopecskó, K. Examination of the Physico-Chemical Composition of Dispersive Soils. Period. Polytech. 2015, 60, 269–279. [Google Scholar] [CrossRef]
- Abbaslou, H.; Hadifard, H.; Ghanizadeh, A.R. Effect of Cations and Anions on Flocculation of Dispersive Clayey Soils. Heliyon 2020, 6, e03462. [Google Scholar] [CrossRef] [PubMed]
- Miller, R.D. Freezing Phenomena in Soils—ScienceDirect. Appl. Soil Phys. 1980, 16, 254–299. [Google Scholar] [CrossRef]
- Nixon, J.F.; Lem, G. Creep and Strength Testing of Frozen Saline Fine-Grained Soils. Can. Geotech. J. 1984, 21, 518–529. [Google Scholar] [CrossRef]
- Wijeweera, H.; Joshi, R.C. Creep Behavior of Saline Fine-Grained Frozen Soil. J. Cold Reg. Eng. 1993, 7, 77–89. [Google Scholar] [CrossRef]
- Roman, L.T. Influence of Chemical Compositions of Salts on Strength and Deformability of Frozen Saline Soils. Osn. Fundam. I Mekhanika Gruntov 1994, 6, 18–22. [Google Scholar]
- Sinitsyn, A.O.; Løset, S. Strength of Frozen Saline Silt under Triaxial Compression with High Strain Rate. Soil Mech. Found. Eng. 2011, 48, 196–202. [Google Scholar] [CrossRef]
- Li, K.; Geng, Y.; Li, Q.; Liu, C. Comprehensive Microstructural Characterization of Saline–Alkali Soils in the Yellow River Delta, China. Soil Sci. Plant Nutr. 2021, 67, 301–311. [Google Scholar] [CrossRef]
- Bieganowski, A.; Ryżak, M.; Sochan, A.; Barna, G.; Hernádi, H.; Beczek, M.; Polakowski, C.; Makó, A. Laser Diffractometry in the Measurements of Soil and Sediment Particle Size Distribution. In Advances in Agronomy; Elsevier: Amsterdam, The Netherlands, 2018; Volume 151, pp. 215–279. ISBN 978-0-12-815173-0. [Google Scholar]
- Shen, J.; Wang, Q.; Chen, Y.; Han, Y.; Zhang, X.; Liu, Y. Evolution Process of the Microstructure of Saline Soil with Different Compaction Degrees during Freeze-Thaw Cycles. Eng. Geol. 2022, 304, 106699. [Google Scholar] [CrossRef]
- Kong, B.; Dai, C.-X.; Hu, H.; Xia, J.; He, S.-H. The Fractal Characteristics of Soft Soil under Cyclic Loading Based on SEM. Fractal. Fract. 2022, 6, 423. [Google Scholar] [CrossRef]
- GB/T 50123–2019; Standard for Geotechnical Testing Method. China Planning Press: Beijing, China, 2019. Available online: https://max.book118.com/html/2020/1125/8075130021003021.shtm (accessed on 24 July 2023).
- ASTM D2487-11; Standard Practice for Classification of Soils for Engineering Purposes (Unified Soil Classification System) by Ignition Method. ASTM International: West Conshohocken, PA, USA, 2011. Available online: https://www.doc88.com/p-9989704493447.html (accessed on 24 July 2023).
- Zhang, X.-D.; Wang, Q.; Li, P.-F.; Wang, R.-Y. Research on Soil Dispersion of Qian’an Soil Forest. J. Northeast. Univ. Nat. Sci. 2015, 36, 1643–1647. [Google Scholar] [CrossRef]
- Zhang, J. Research on the Dispersion Mechanism of the Dispersive Seasonal Frozen Soil in the Western of Jilin Province. Ph.D. Thesis, Jilin University, Changchun, China, 2010. [Google Scholar]
- Wang, Q.; Liu, Y.; Liu, S.; Zhang, X. Evolution Law of the Properties of Saline Soil in Western Jilin Province Under Multi Field Effect. J. Northeast. Univ. Nat. Sci. 2017, 47, 807–817. [Google Scholar] [CrossRef]
- Rengasamy, P.; Greene, R.S.B.; Ford, G.W.; Mehann, A.H. Identification of Dispersive Behaviour and the Management of Red-Brown Earths. Aust. J. Soil Res. 1984, 22, 413–431. [Google Scholar] [CrossRef]
- Han, Y.; Wang, Q.; Xia, W.; Liu, J.; Wang, J.; Chen, Y.; Shen, J. Experimental Study on the Hydraulic Conductivity of Unsaturated Dispersive Soil with Different Salinities Subjected to Freeze-Thaw. J. Hydrol. 2020, 583, 124297. [Google Scholar] [CrossRef]
- ASTM D4647/D4647M-13; Standard Test Methods for Identification and Classification of Dispersive Clay Soils by the Pinhole Test. ASTM International: West Conshohocken, PA, USA, 2020. Available online: https://www.antpedia.com/standard/6610098.html (accessed on 24 July 2023).
- ASTM D6572-21; Standard Test Methods for Determining Dispersive Characteristics of Clayey Soils by the Crumb Test. ASTM International: West Conshohocken, PA, USA, 2021. Available online: https://www.scirp.org/reference/referencespapers.aspx?referenceid=2064058 (accessed on 24 July 2023).
- Fan, H.; Kong, L. Research on Dispersed Soil; China Water Resources and Hydropower Press: Beijing, China, 2012. [Google Scholar]
- Liu, J. Study on Changes in Particle Size Composition of Saline Soil under Freeze-Thaw Cycle. Master’s Dissertation, Jilin University, Changchun, China, 2021. [Google Scholar]
- Zorluer, I.; Icaga, Y.; Yurtcu, S.; Tosun, H. Application of a Fuzzy Rule-Based Method for the Determination of Clay Dispersibility. Geoderma 2010, 160, 189–196. [Google Scholar] [CrossRef]
- Xia, W.; Wang, Q.; Yu, Q.; Yao, M.; Sun, D.; Liu, J.; Wang, Z. Experimental Investigation of the Mechanical Properties of Hydrophobic Polymer-Modified Soil Subjected to Freeze–Thaw Cycles. Acta Geotech. 2023, 18, 3623–3642. [Google Scholar] [CrossRef]
- Cheng, S.; Wang, Q.; Wang, N.; Wang, J.; Han, Y. Study on Mechanical Properties of Saline Soil and Evaluation of Influencing Factors. J. Cold Reg. Eng. 2021, 35, 04021002. [Google Scholar] [CrossRef]
- Han, Y.; Wang, Q.; Wang, N.; Wang, J.; Zhang, X.; Cheng, S.; Kong, Y. Effect of Freeze-Thaw Cycles on Shear Strength of Saline Soil. Cold Reg. Sci. Technol. 2018, 154, 42–53. [Google Scholar] [CrossRef]
- Li, S.; Zhang, M.; Tian, Y.; Pei, W.; Zhong, H. Experimental and Numerical Investigations on Frost Damage Mechanism of a Canal in Cold Regions. Cold Reg. Sci. Technol. 2015, 116, 1–11. [Google Scholar] [CrossRef]
- Han, M.; Peng, W.; Ma, B.; Yu, Q.; Kasama, K.; Furukawa, Z.; Niu, C.; Wang, Q. Micro–Composition Evolution of the Undisturbed Saline Soil Undergoing Different Freeze–Thaw Cycles. Cold Reg. Sci. Technol. 2023, 210, 103825. [Google Scholar] [CrossRef]
- Li, M.; Chai, S.; Du, H.; Wang, C. Effect of Chlorine Salt on the Physical and Mechanical Properties of Inshore Saline Soil Treated with Lime. Soils Found. 2016, 56, 327–335. [Google Scholar] [CrossRef]


| Property | Values |
|---|---|
| Sand group (2–0.075 mm) | 15.90% |
| Silt group (0.075–0.005 mm) | 63.33% |
| Clay group (<0.005 mm) | 20.77% |
| Soil type information | lean clay (CL) |
| Property | Values |
|---|---|
| Liquid limit | 38.79% |
| Plastic limit | 18.59% |
| Plasticity index | 20.20 |
| Optimum water content | 16.76% |
| Maximum dry density | 1.730 g/cm3 |
| pH | 9.27 |
| Dispersion (from double hydrometer test) | 88.18% |
| SAR | 53.68 |
| Total soluble salt content | 0.146% |
| Na+ | 24.89 mmol/kg |
| HCO3− | 18.71 mmol/kg |
| CO32− | 2.60 mmol/kg |
| Ca2+ | 0.28 mmol/kg |
| Mg2+ | 0.15 mmol/kg |
| K+ | 0.12 mmol/kg |
| Number of F–T Cycles | Water Head (mm) | Duration at a Given Water Head (min) | Final Flow Rate (mL/s) | Turbidity of Water | Final Pore Diameter (mm) | Results |
|---|---|---|---|---|---|---|
| 0 | 50 | 5 | 2.00 | Turbid | 2.0 | D1 |
| 1 | 50 | 5 | 1.83 | Turbid | 2.4 | D1 |
| 3 | 50 | 5 | 1.67 | Turbid | 2.3 | D1 |
| 5 | 50 | 5 | 2.00 | Turbid | 3.5 | D1 |
| 7 | 50 | 5 | 2.03 | Turbid | 3.6 | D1 |
| 9 | 50 | 5 | 2.33 | Very turbid | 4 | D1 |
| 12 | 50 | 5 | 2.5 | Very turbid | 4.5 | D1 |
| 15 | 50 | 5 | 3.17 | Very turbid | 4.8 | D1 |
| Number of F–T Cycles | Mass of <5 μm Soil Particles Using Unconventional Methods (g) | Mass of <5 μm Soil Particles Using Conventional Methods (g) | Dispersion (%) |
|---|---|---|---|
| 0 | 23.20 | 26.31 | 88.18 |
| 1 | 28.76 | 30.92 | 93.02 |
| 3 | 32.50 | 33.40 | 97.31 |
| 5 | 31.86 | 33.42 | 95.34 |
| 7 | 31.82 | 33.08 | 96.19 |
| 9 | 29.74 | 30.92 | 96.19 |
| 12 | 30.40 | 34.95 | 86.98 |
| 15 | 33.21 | 36.41 | 91.21 |
Disclaimer/Publisher’s Note: The statements, opinions and data contained in all publications are solely those of the individual author(s) and contributor(s) and not of MDPI and/or the editor(s). MDPI and/or the editor(s) disclaim responsibility for any injury to people or property resulting from any ideas, methods, instructions or products referred to in the content. |
© 2023 by the authors. Licensee MDPI, Basel, Switzerland. This article is an open access article distributed under the terms and conditions of the Creative Commons Attribution (CC BY) license (https://creativecommons.org/licenses/by/4.0/).
Share and Cite
Zhang, S.; Xu, X.; Dong, X.; Lei, H.; Sun, X. Effects of Freeze–Thaw Cycles on the Mechanical Properties and Microstructure of a Dispersed Soil. Appl. Sci. 2023, 13, 9849. https://doi.org/10.3390/app13179849
Zhang S, Xu X, Dong X, Lei H, Sun X. Effects of Freeze–Thaw Cycles on the Mechanical Properties and Microstructure of a Dispersed Soil. Applied Sciences. 2023; 13(17):9849. https://doi.org/10.3390/app13179849
Chicago/Turabian StyleZhang, Shurui, Xin Xu, Xiaoqiang Dong, Haomin Lei, and Xun Sun. 2023. "Effects of Freeze–Thaw Cycles on the Mechanical Properties and Microstructure of a Dispersed Soil" Applied Sciences 13, no. 17: 9849. https://doi.org/10.3390/app13179849
APA StyleZhang, S., Xu, X., Dong, X., Lei, H., & Sun, X. (2023). Effects of Freeze–Thaw Cycles on the Mechanical Properties and Microstructure of a Dispersed Soil. Applied Sciences, 13(17), 9849. https://doi.org/10.3390/app13179849