Article

Product Styling Cognition Based on Kansei Engineering Theory and Implicit Measurement

1
School of Mechanical Engineering, Hefei University of Technology, Hefei 230009, China
2
College of Mechatronic Engineering, North Minzu University, Yinchuan 750021, China
3
Key Laboratory of Advanced Manufacturing Technology of Ministry of Education, Guizhou University, Guiyang 550025, China
*
Author to whom correspondence should be addressed.
Appl. Sci. 2023, 13(17), 9577; https://doi.org/10.3390/app13179577
Submission received: 25 July 2023 / Revised: 19 August 2023 / Accepted: 19 August 2023 / Published: 24 August 2023

Abstract

:
Effective product styling designs must increasingly address users’ emotional requirements. This study introduces a product styling design method combining electroencephalography (EEG) and eye tracking for multimodal measurement based on the Kansei engineering theory. The feasibility of determining a target image using a similarity calculation model is verified. An experimental paradigm based on implicit measures is presented for product styling cognition research. This paradigm involves determining the target image, sample selection, target image matching experiments, and product styling cognition experiments. Based on the combined EEG and eye-tracking measurements, insights into product-form cognition are deduced to provide a scientific basis for product-form innovation design. Notably, variations in event-related potential during user cognition of product styling are more evident in the product-styling perception phase than in the evaluation phase. In the styling perception phase, samples with “high match” with the target image elicit more pronounced EEG responses than those with “low match”. These findings demonstrate the viability of understanding product-form cognition through multimodal implicit measurements, addressing issues such as the pronounced subjectivity inherent in traditional methods. Furthermore, this approach provides a pioneering technique for Kansei engineering research and offers a methodology for multimodal implicit measurements of product innovation design.

Graphical Abstract

1. Introduction

In the contemporary landscape, design and innovation stand as the paramount themes [1]. Design is fundamentally the deliberate crafting of forms tailored to serve human needs [2], with the symbolic attributes of products being vital components of cognitive models. Given the intense market competition, products that resonate with and elicit positive emotional reactions from consumers hold a distinct edge [3]. Often, purchasing decisions hinge on emotional resonances, particularly those subtle sentiments bridging human–object interactions [4]. A harmonious alignment of Kansei cognitions between designers and users often underpins successful product designs [5]. The adeptness in discerning users’ Kansei needs for product styling design predicates the success of the design and influences consumers’ purchasing intent and overall satisfaction [6]. The 1990s witnessed the advent of neuroaesthetics, stemming from the confluence of rapid advancements in cognitive neuroscience and empirical aesthetic research. As product functionality differentials narrow, the emphasis on cognition and emotion-driven design increases [7]. Undoubtedly, product styling cognition is an essential aspect of cognition research and design practice. This study investigates neuroaesthetics in the innovative product-form design, employing electroencephalography (EEG) and eye tracking.
Evaluating consumer cognitions of product styling includes both explicit and implicit metrics. Explicit measurements are typically realized through self-reporting. In Kansei engineering, traditional product image design (perceptual design) research relies on explicit measurements of conscious processing, primarily using research methods such as interviews, questionnaires, and card sorting. Liu et al. [8] proposed a Kansei word selection method based on word evaluation frequency. However, online reviews are subjective and influenced by nonemotional factors, such as product packaging and delivery speed. Thus, the study did not consider actual implicit metrics. Gong et al. [9] combined design thinking and Kansei engineering to study the innovative design of bamboo penholders, utilizing questionnaires, expert interviews, and cluster analysis. The data on people’s cognition of product styling were established using the questionnaire. Ge et al. [10] developed an algorithmic model regarding consumer preferences based on color scales and Kansei engineering. The color evaluation of solid color shirts was realized using a five-level semantic difference scale. Zhang et al. [11] proposed a cognitive alignment method to reduce the cognitive differences between users and designers. Though the study explored the cognitive disparity between users and designers in product styling design, the relationship between product samples and image evaluation was determined using an explicit measurement (questionnaire). Liang et al. [12] used Kansei engineering theory to study automotive interior design and explore the relationship between sensory experiences, perceived values, and design elements. This investigation sourced its data from an online survey assessing product images. A survey of the field reveals that the majority of product design studies primarily employ explicit measurements.
Explicit measurements draw from extrinsic behavioral observations and introspective reflections of individuals. Notably, explicit methods encounter two primary challenges: (1) individuals often exhibit a reluctance to disclose their genuine thoughts and respond in a way that conforms to external expectations, particularly when their genuine views deviate from societal norms; (2) traditional methods rely on conscious introspection, and even when individuals are willing to express their genuine thoughts and attitudes, they cannot effectively express underlying motives, needs, and attitudes. The subconscious significantly influences product styling cognition. Thus, traditional approaches to product styling design can capture only conscious, explicit behaviors and cannot explore the nuances of unconscious cognitive processing. Consequently, traditional approaches also falter in discerning disparities between users’ cognition and action.
This study resolves the limitations of explicit measurements by using eye tracking and EEG implicit measurements. Implicit measurements capture psychological attributes without necessitating self-reporting, instead tapping into subconscious pathways [13]. Castiblanco Jimenez et al. systematically summarized physiological measurements such as skin conductance, EEG, heart rate, pupillometry, and respiratory rate, pointing out the expansive potential the physiological methods hold, especially in the domain of user engagement [14]. Bell et al. posited that physiological and neuroscientific techniques can advance consumer research by providing insights into subconscious mechanisms [15]. These techniques can help researchers understand the mechanisms of consumer behavior. Guo et al. used the event-related potentials (ERPs) of EEG signals to explore users’ preferences for smartphones [16]. Although some studies have utilized either EEG or eye tracking singularly to investigate product design, only a sparse number have combined these two approaches to explore product styling design [17,18]. Yang [19] posited that quantifying neural mechanisms through EEG signals has gained traction in EEG research. The integration of EEG with other biomonitoring techniques, such as eye tracking, can facilitate multi-indicator detection. Eye-tracking signals are behavioral data captured when a user is exposed to stimulation. Hsu et al. [20] used the eye-tracking technique to study chair design. Liu and Sogabe [21] demonstrated that eye tracking could be applied to research in Kansei engineering. Zhou et al. [22] indicated that the current evaluation methods for medical beds are subjective, emphasizing the need for objective tools. Merging EEG’s neural insights with eye tracking’s behavioral outputs can facilitate a deeper understanding of users’ emotional needs in product styling cognition. Studying the cognitive mechanisms of product styling from the perspective of implicit measurements is crucial for innovative product design. Previous studies have applied eye-tracking and EEG techniques to research areas such as emotion recognition, attention monitoring, and usability evaluation. However, few studies have combined EEG and eye-tracking methodologies to investigate product styling cognition.
From the subjective and objective perspectives, consumers’ product styling evaluation can be categorized into subjective evaluation, objective evaluation, and combined subjective–objective assessment. The subjective evaluation method provides a score based on the participant’s comprehension of product styling, inherently possessing subjective biases and limitations [23]. Considering the convenience of obtaining subjective evaluation data, approximately 80% of product designs based on Kansei engineering employ the subjective evaluation method. Future product design research is likely to pivot towards objective and subjective–objective evaluations, paving the way for intelligent design methodologies. EEG and eye-movement measurements offer objective metrics, presenting a more accurate and scientifically grounded alternative to subjective measurements. Therefore, this study utilizes implicit measurement methods to investigate users’ subconscious cognitive processes in product styling design.
The primary goals of this research are as follows:
(1)
To understand the dynamics of product styling cognition based on Kansei engineering and implicit measurements.
(2)
To elucidate the product styling cognition process employing EEG and eye-movement metrics.
(3)
To discern the disparities in EEG data across product styling evaluation and perception phases and delineate suitable experimental stages for styling cognition research.
(4)
To understand EEG and eye-movement patterns in product styling cognition through implicit measurements, thereby providing a new method for product innovation design.
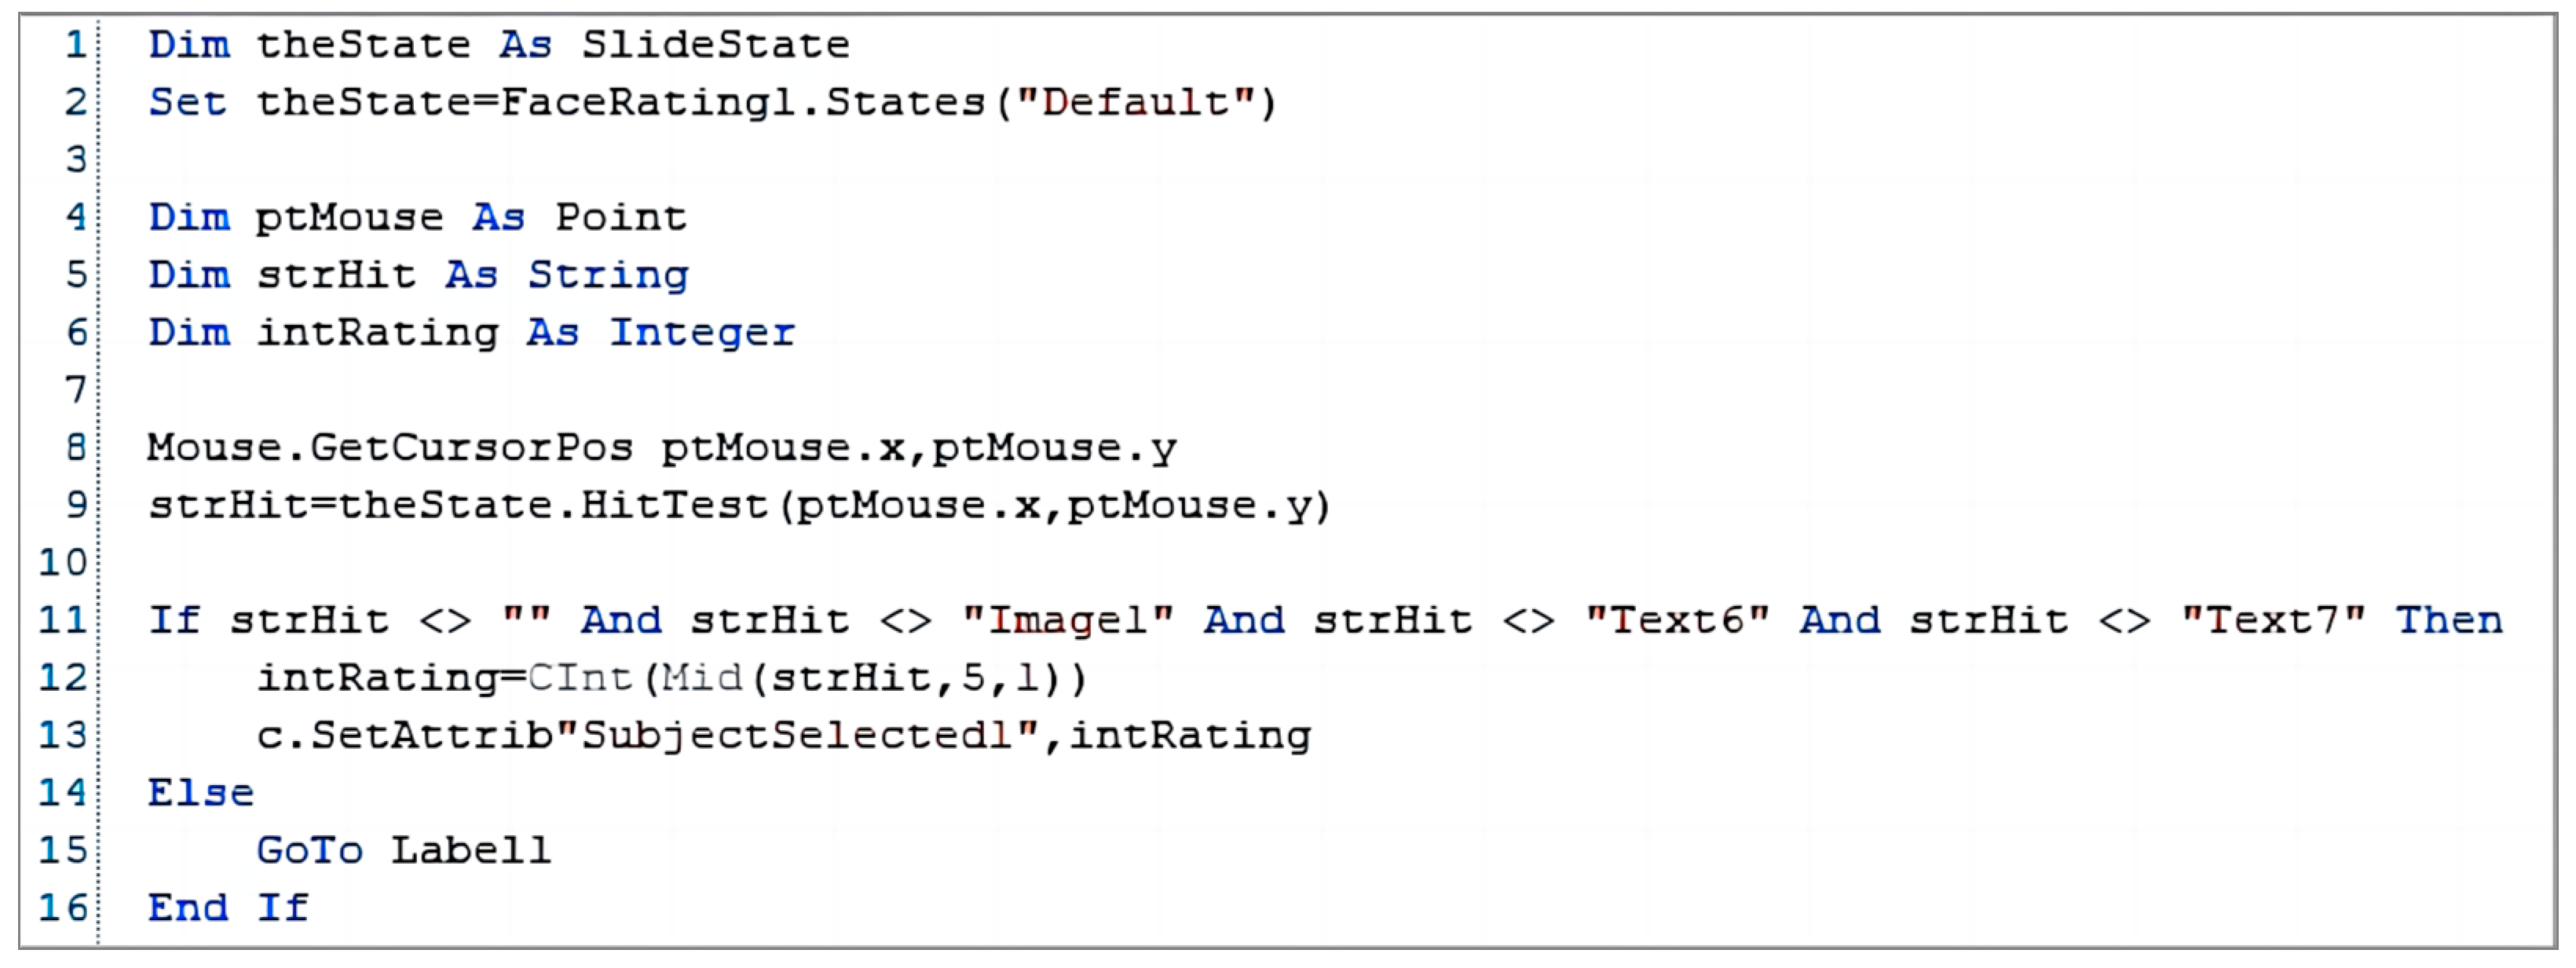
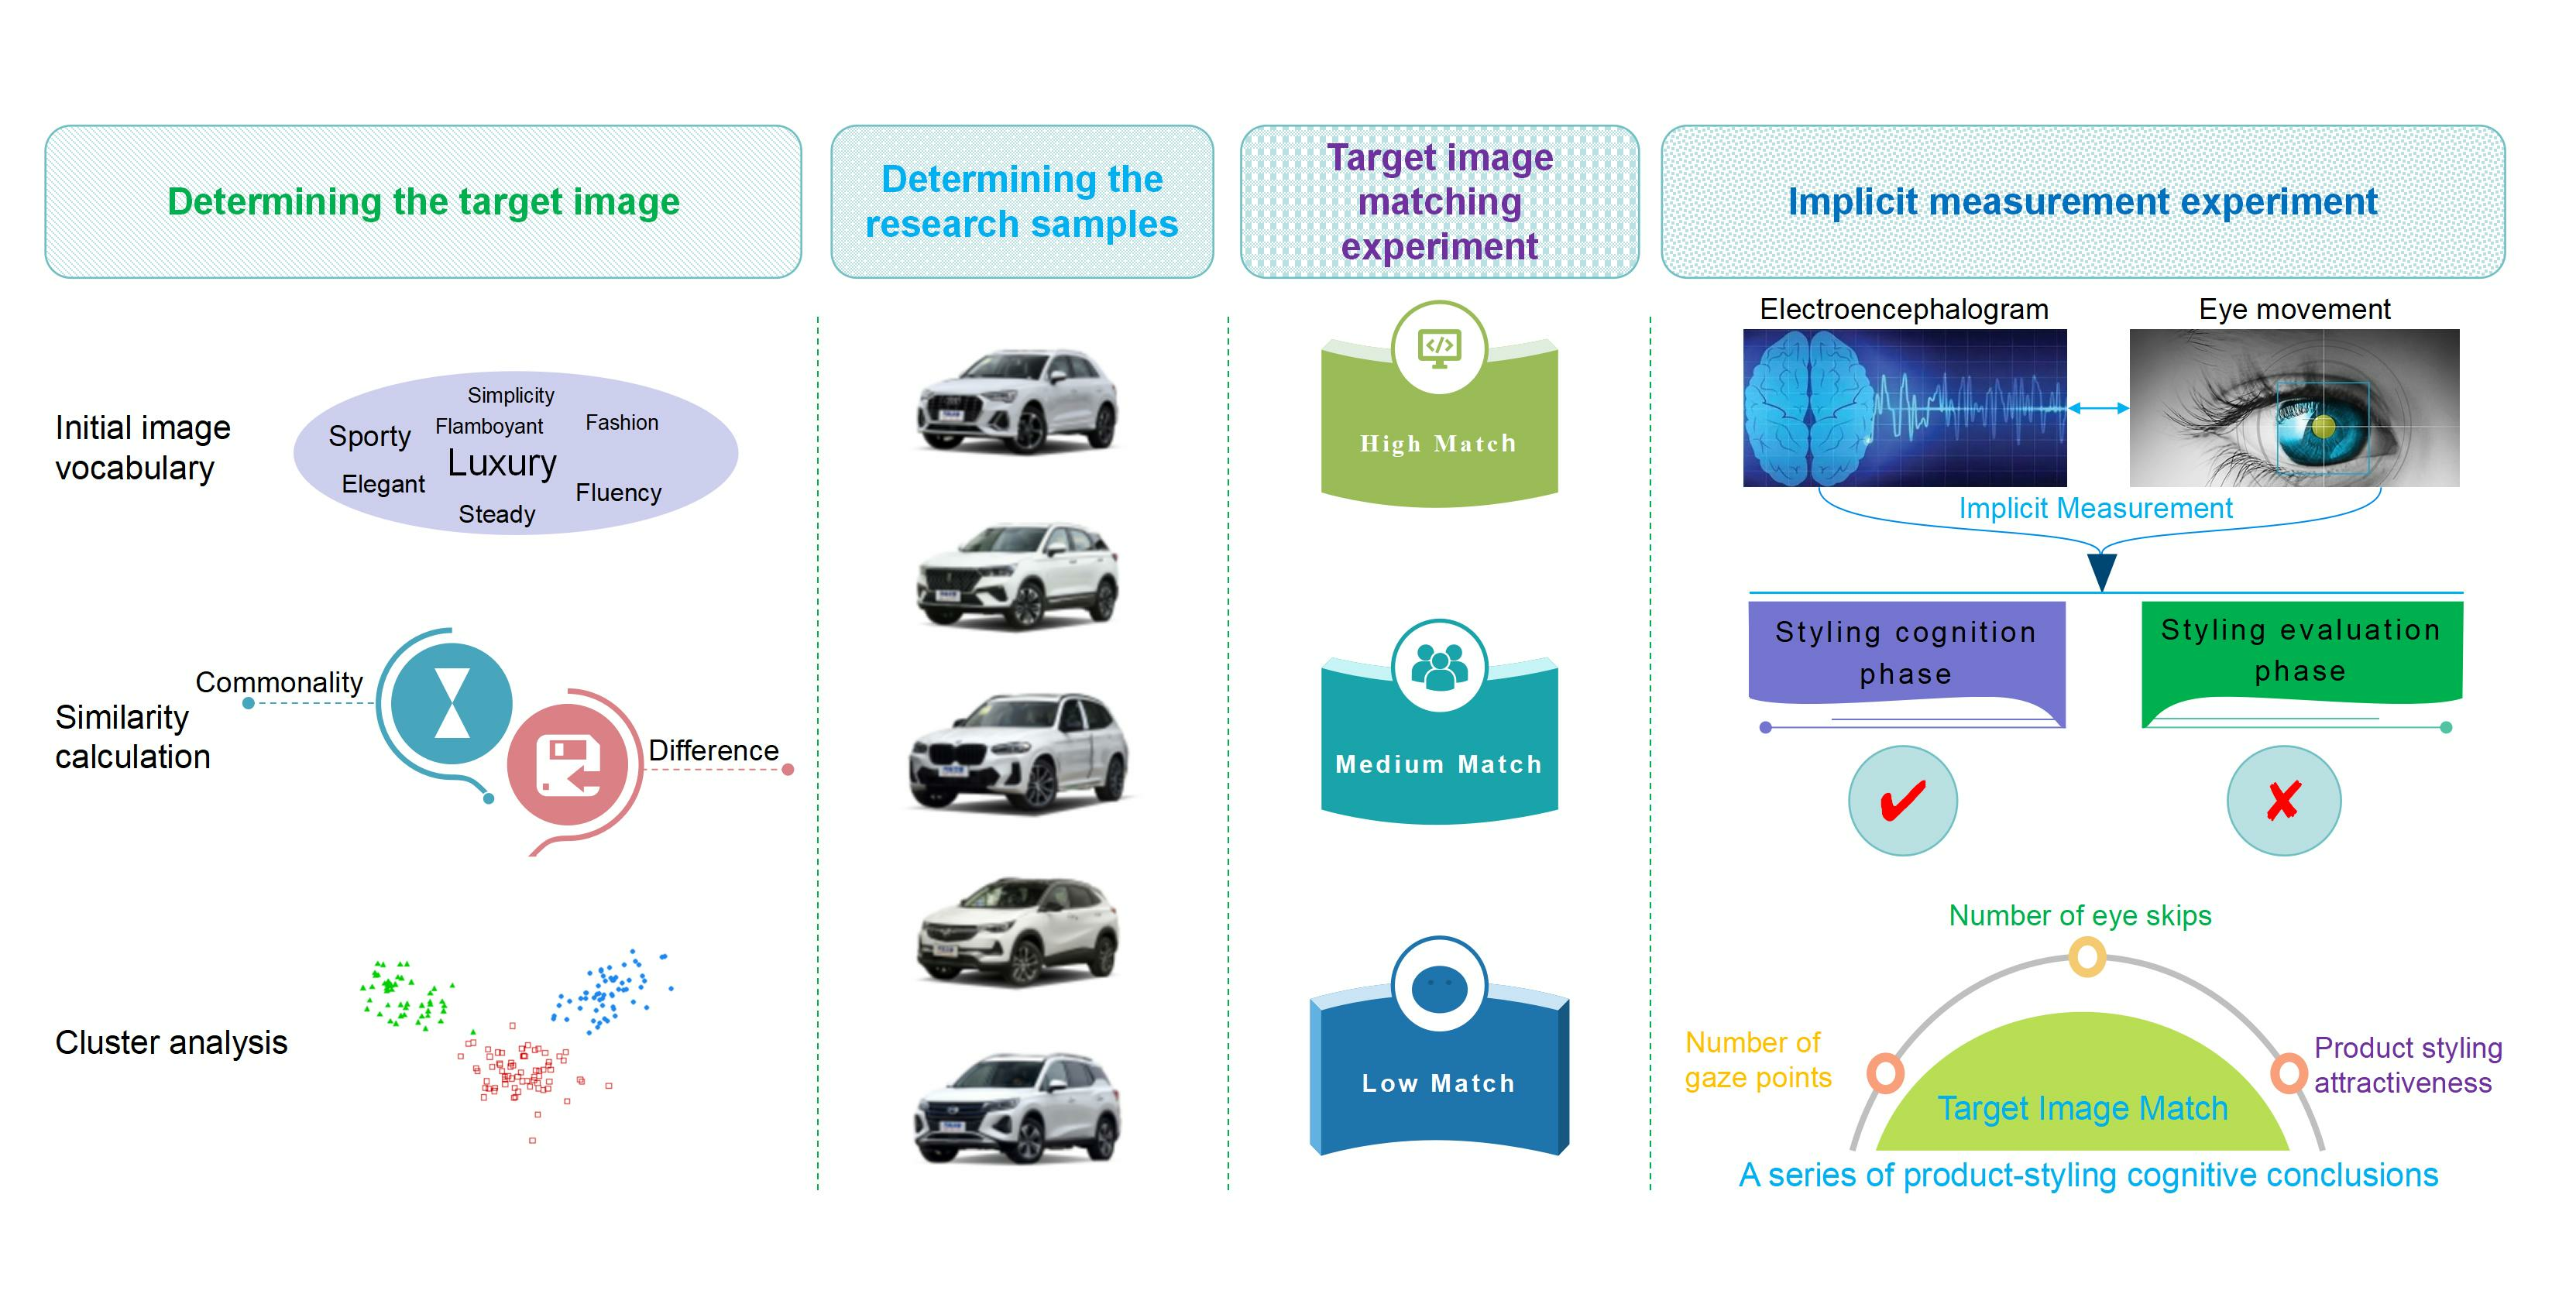
This study first discusses Kansei, Kansei engineering, image, and product image. It then proposes a method to determine the target image using an image lexical similarity calculation model and a cluster analysis algorithm; the method is substantiated by an example. A product styling target image matching experiment is conducted using E-Prime. Research samples are classified into three categories: “high match”, “medium match”, and “low match” relative to the target image. The experiments based on the combination of EEG and eye-tracking measurements are conducted to explore the mechanism of product styling cognition. Finally, the experimental data are analyzed, and the results are discussed. Thus, the study considers an implicit measurement method to study people’s cognition of product styling. Moreover, this study provides a new method for studying subconscious cognition of product styling and a new research tool for implementing Kansei engineering principles in product innovation design.
The main contributions of this research are as follows:
(1)
The connotations of Kansei, Kansei engineering, image, and product image are analyzed to establish the groundwork for subsequent Kansei engineering theory exploration. The patterns of neural activity and eye movements are analyzed to lay the foundation for this study.
(2)
A combined EEG and eye-tracking method for product styling image cognition research is proposed to overcome the limitations of traditional explicit measurements, such as high subjectivity.
(3)
A series of product-form cognitive conclusions based on the combined implicit measurement are drawn to provide a scientific basis for subsequent product-form innovation design.
(4)
A method for determining target images based on image vocabulary similarity calculation and K-means clustering analysis is validated through examples.
The remainder of this paper is organized as follows: Section 2 presents the analysis of the relevant theoretical foundations. Section 3 describes the experimental procedure. The experimental data are analyzed in Section 4. A discussion of the results is presented in Section 5. Finally, the conclusions are summarized in Section 6.

2. Related Theories

2.1. Kansei and Kansei Engineering

2.1.1. Kansei

Kansei refers to the sensory impressions that individuals derive from visual, tactile, and other sensory experiences. It often revolves around swift judgments based on initial perceptions without deep contemplation. Essentially, Kansei embodies the cognitive reactions of an individual’s sensory organs when interacting with objective entities. It represents the subjective feeling of consumers toward the objective material world. The Japanese publication “Guang Ci Yuan” defines Kansei as “the ability to intuit, to feel, and to sense; the ability to feel things; the emotional understanding and desire based on one’s bodily senses” [24]. According to the Japanese scholar Nagamaehi, “Kansei is the feeling or image that people have about things, the psychological expectation of things, and can be interpreted as the expression of people’s emotions such as perception, feeling, and impression of products” [25].

2.1.2. Kansei Engineering

Kansei engineering combines engineering and emotion, drawing on design science, psychology, cognition, and other related disciplines. This approach was introduced in 1970 by Professor Nagamachi of Hiroshima University, Japan, as “emotional technology”. Experts in different fields of study have understood the definition of Kansei engineering differently at different times. According to Su from the Lanzhou University of Technology, Kansei engineering is a theory and method applying engineering technology to explore the relationship between the emotional image of “people” and the design characteristics of “products”. Moreover, Kansei engineering aims to discern consumers’ feelings and needs for products and establish a new product development system oriented toward consumers’ needs [26]. According to the Japanese professor Nagamachi, Kansei engineering is a consumer-oriented product development technique that translates the consumers’ feelings about a product into design elements [25]. In conclusion, Kansei engineering applies relevant technologies and methods to study the relationship between human emotions and the design elements of products. Using this relationship as a basis, the consumers’ emotional expectations of the product are applied to the product innovation design.
The Kansei engineering framework provides an essential theoretical basis for product styling design. In the consumer-centered era, product styling design is a primary method of product innovation design [27], where product styling cognition is crucial. Kansei engineering is an essential theory in product innovation, costumes, graphics, and interactive design. Kansei engineering’s applications span diverse sectors, including car design [28], robot design [29], website design [30], baby cradle design [31], service design [32], and food development [33]. In the product innovation design based on Kansei engineering theory, regardless of the research methods used, clarifying the consumers’ cognition of product form is the ultimate goal of Kansei engineering research. Moreover, the consumers’ emotional demand for product form must be determined.

2.2. Product Image Design

2.2.1. Image

The ancient Chinese believed that image consists of “Yi” and “Xiang”, with “Yi” being the inner, abstract mind of a person and “Xiang” being the tangible, external aspects of an object. Image is defined in the Chinese dictionary “Ci-Hai” as an imaginative representation transformed from a memory representation or an existing perceptual image. In conclusion, the image embodies the relationship between the memory and the object as a whole, conceived in the cognitive realm by the observer, based on the sensory data provided by the object. Image serves as a fundamental cognitive unit: a conceptual manifestation generated within an individual due to external stimuli. Moreover, image represents the conscious activity of past sensations or experiences that are organized, analyzed, and presented to the mind.

2.2.2. Product Image

Product image is a sensory representation derived from people’s cognition, experiences, memories, and associations with a product through integration, summarization, and sorting [34]. Product image is generated based on consumer perceptions. Through its shape, lines, layout, color, texture, structure, and inner meaning given by the external cultural environment, a product forms a language to communicate with people. In a consumer-oriented market economy, any factor related to consumers should be incorporated into the design process. Exploring consumer satisfaction with product styling requires studying image perceptions and consumer preferences.
Product image design relies on human cognition, the external form of the product, and relevant technical tools to establish a correlative framework [35] between the product’s image and the design elements. Although product image design is part of product design, it focuses more on the consumers’ emotional needs.

2.3. EEG and Eye Tracking

2.3.1. EEG

The electroencephalogram is a reflection of the electrophysiological activity generated from postsynaptic potentials between brain cells, which can be observed on the surface of the cerebral cortex or scalp. EEG offers a noninvasive approach to capture and assess the brain’s electrical activity [36]. Presently, the EEG technique is the predominant method employed to measure brain waves due to its exceptional temporal resolution [37]. EEG activity in the cerebral cortex can be classified into evoked and spontaneous signals. Evoked EEG signals, also known as event-related potentials, stem from the higher-level functional activities of the brain [38,39]. In contrast, spontaneous EEG signals are recorded when the cerebral cortex is not under significant stimulation. The sensitivity of EEG signals to neural activity alterations enables the real-time observation of individual perceptual cognitive processes that cannot be discerned through explicit user measurements. Compared to traditional Kansei engineering methodologies, EEG can provide insight into users’ perceptual image cognitive processes on a millisecond scale. Emotions that elude measurement via traditional techniques, such as semantic differential questionnaires and self-reports, can be precisely captured using EEG. This enables an in-depth examination of users’ image cognition processes.

2.3.2. Eye Tracking

Eye tracking involves the utilization of specialized equipment to monitor and record the trajectories of eye movements. Typically, a participant is presented with a cognitive task, and their subsequent eye-movement patterns are recorded. By analyzing these patterns in real time, insights into fundamental cognitive processing mechanisms can be garnered under specific psychological contexts. Eye tracking has diverse applications, notably in fields such as psychology and neuroscience, facilitating investigations into the relationship between visual stimuli and behavioral responses based on information processing. The technique provides a quantitative assessment of dynamic visual behaviors and stands as a noninvasive tool to comprehend cognitive mechanisms.
Contemporary research in cognitive dual-process theory elucidates that human behavior is influenced by two distinct cognitive pathways. Implicit cognition is characterized by its intuitive, emotional, and automatic unconscious processing. While the outcomes of such thought processes can be consciously acknowledged, the underlying mechanisms generally remain unconscious. Conversely, explicit cognition is verbal and involves conscious processing, making both the process and its outcomes consciously accessible [40]. Eye-tracking and EEG assessments are intrinsically linked to visual cognitive processes. While EEG predominantly measures implicit cognition, eye-movement-based assessments consider both implicit and explicit cognitive mechanisms. Integrating eye tracking with EEG offers promising prospects for discerning and quantifying the visual aesthetics of products [41].

3. Materials and Methods

3.1. Determining Target Image Based on the Image Lexical Similarity Calculation Model

3.1.1. Determining the Initial Image Vocabulary

The target image refers to a consumer’s emotional needs regarding product styling; image adjectives are typically used to describe these emotional needs. This study collected the initial image vocabulary from the official websites of car companies, car magazines, and car e-commerce platforms. A total of 60 image-related words were collected. Subsequently, the collected vocabulary was screened to reduce the data analysis workload and avoid the influence of ambiguous words on product styling cognition [42]. Industrial design experts and professional designers were engaged to filter and supplement the collected vocabulary, eliminate semantically ambiguous words, and exclude words that did not reflect and express product styling [43]. Finally, 30 words were retained as initial image vocabulary, as listed in Table 1.

3.1.2. Image Vocabulary Similarity Calculation Based on Similarity Model

The similarity of image vocabulary is expressed as a numerical value in the range of [0, 1]. The similarity between image words is related to the commonality and difference between words: the higher the commonality, the higher the similarity; the higher the difference, the lower the similarity. Word-similarity computations are widely used in natural language processing [44], intelligent retrieval [45], data mining [46], and other fields. The image vocabulary similarity and lexical similarity calculations differ. Image vocabulary similarity emphasizes the differences in users’ perceptions of product styling. In contrast, lexical similarity is unrelated to Kansei engineering, design cognition, or user emotions.
“Tongyici Cilin”, a Chinese synonym dictionary, was expanded based on a computable Chinese dictionary developed by the Information Retrieval Research Laboratory at the Harbin Institute of Technology. The Chinese dictionary was compiled by Mei [47]. Moreover, Tongyici Cilin [48] classifies vocabulary into 5 levels: major, medium, minor, word groups, and atomic word groups, with 12 major, 95 medium, 1428 minor, 4026 word groups, and 17,797 atomic word groups. The first four levels represent abstract categories with no specific words or concepts, whereas the fifth level represents specific words or concepts.
Let two given image vocabularies be y1 and y2; k represents the number of nodes of the two image vocabularies between the root node O and the nearest common parent node K; j represents the number of nodes of the image vocabularies between the nearest common parent node K and the location of the image vocabularies; k + j = 5.
Let the distance from the nearest common parent node K to the y1 image vocabulary be Lc1 (y1, y2) and from the nearest common parent node K to the y2 image vocabulary be Lc2 (y1, y2). The distance of the y1 image vocabulary from the root node O to the nearest common parent node K is Lg1 (y1, y2), and the distance of the y2 image vocabulary from the root node O to the nearest common parent node K is Lg2 (y1, y2). Considering that Lc1 (y1, y2) is the same as Lc2 (y1, y2), let Lc (y1, y2) = Lc1 (y1, y2) = Lc2 (y1, y2). Similarly, let Lg (y1, y2) = Lg1 (y1, y2) = Lg2 (y1, y2).
The similarity between y1 and y2 image vocabularies is expressed as follows [23]:
s i m ( y 1 , y 2 ) = 2 L g ( y 1 , y 2 ) + α 2 L g ( y 1 , y 2 ) + 2 L c ( y 1 , y 2 ) + α + β ,
where α and β are the adjustment parameters (reflecting commonalities and differences, respectively) for the similarity between two image words of y1 and y2.
The number of paths through which each image vocabulary passed from root node O to the location of the vocabulary is five, and the weight of each path differs. Let the path weight from the root node to the vocabulary location be Q(r), r ϵ [1, 5], in order.
L g ( y 1 , y 2 ) = i = 1 k Q ( r ) .
L c ( y 1 , y 2 ) = i = k + 1 k + j Q ( r ) .
Let n be the number of nodes in the next level of the nearest common parent node of the two image vocabularies and m be the number of intervals between nodes in the next level of the nearest common parent node of the two image vocabularies.
β = m n Q ( k ) .
Therefore, the similarities between the two image vocabularies, y1 and y2, are as follows:
s i m ( y 1 , y 2 ) = 2 r = 1 k Q ( r ) + α 2 r = 1 k + j Q ( r ) + m n Q ( k ) + α .
The parameters Q(r) and α in the image vocabulary similarity calculation model are determined based on people’s cognition of the product styling. Therefore, the image vocabulary similarity calculation model is consistent with people’s cognition of product styling and has improved applicability. This study utilized the image vocabulary similarity calculation model to determine the similarity values. Figure 1 illustrates the developed image lexical similarity calculation platform [23]. This platform includes two functional modules: image vocabulary similarity calculation and cluster analysis.
The initial 30 image words listed in Table 1 were input to the image vocabulary similarity calculation module of the platform. The similarity data were obtained by computations based on the Tongyici Cilin image vocabulary similarity calculation algorithm. Examples of the similarity data are listed in Table 2, indicating that the similarity values of image words with greater differences are smaller, such as “rational” and “dynamic”.

3.1.3. Image Words Classification Based on Clustering Algorithm

Cluster analysis facilitates the categorization of image words. Words with similar meanings are grouped into the same category, while words with pronounced differences in meanings are segregated into distinct categories. Image vocabulary can be categorized using k-means clustering analysis. A representative image vocabulary was identified for each category to refine the design target. In addition, this study developed a cluster analysis module within the image vocabulary similarity calculation platform to perform the cluster analysis. The k-means clustering algorithm was used to classify the image vocabulary based on vocabulary similarity calculation data. Image lexical similarity data were obtained from previous similarity calculations.
Cluster analysis is a statistical method to classify a product’s image vocabulary, which is fundamental in data mining and classification. Cluster analysis relies on similarity, where words within a specific cluster exhibit greater resemblance to each other than to words in other clusters.
The k-means clustering method [49] is a hard clustering method comprising the following four steps:
(1)
Randomly select K image words from the N image words as the initial centroids.
(2)
For the remaining image words, compute their distances to the initial centroids and assign them to the class with the nearest centroid.
(3)
Recalculate the centroid for each derived class.
(4)
Iterate the second and third steps until the preset conditions are satisfied.
In the k-means cluster analysis method, all image vocabularies must be vectorized, and their centroid can be regarded as the vector center of n image vocabularies, which is calculated as follows:
u ( w ) = 1 w x w x ,
where the centroid distance from each image vocabulary in class k is denoted by RSSk as follows:
R S S k = x k x u ( w k ) 2 .
The sum of the centroid distances for all k classes is denoted by RSS as follows:
R S S = k = 1 k R S S k .
The stopping conditions for determining the target image vocabulary using cluster analysis include the following four types:
(i)
A predefined number of iterations is reached.
(ii)
All K centroids satisfy the convergence condition, i.e., the n-th computed n centroids do not change their positions at the (n + 1)-th iteration.
(iii)
The n image vocabularies achieve convergence, implying that the image vocabulary classification of the n-th computation is the same as that of the (n + 1)-th computation.
(iv)
The RSS value is less than a specific threshold value.
In product Kansei image design, cluster analysis can classify the image vocabulary and effectively determine the design target. The cluster analysis method can explore the underlying patterns within image vocabulary and provide techniques for data mining in product image design. The analysis can provide information such as initial cluster centers, cluster members, final cluster centers, distances to final cluster centers, analysis of variance, and the number of cases in each cluster. The classifications of the image vocabulary are presented in Table 3.
The significance test results for the clustering of the image words in Table 4 indicate that the significance of the word “flamboyant” is greater than 0.05. Thus, the word “flamboyant” was excluded from the subsequent target image determination. The significance values of the remaining words were less than 0.05, indicating that they satisfied the significance test requirements.
Determining target image: A questionnaire was used to determine the target image corresponding to each vocabulary category, representing the style of that category. To maximize the accuracy of determining the target image vocabulary in product styling design, the questionnaire was distributed, filled out, and collated using the Questionnaire Star online platform. The primary question posed was, “From the following words, please select one image word that best expresses automobile styling”. Through the collation, analysis, and statistics of the questionnaire results, the target images for car styling design were “atmospheric”, “fantasy”, “elegant”, and “sporty”. For the purpose of this study, “atmospheric” was selected as a representative target image.

3.2. Determining Research Samples

The research objects of this study were compact, general passenger cars, including sedans and sport utility vehicles. People can perceive the car styling image through the expressive, symbolic, and abstract characteristics of car styling.
The sample determination process was divided into three stages:
(1)
Collection of automobile styling photographs: this involved collecting photographs of vehicles from official car websites, automotive forums, and various online search platforms.
(2)
Similarity analysis: Design experts manually categorized the collected car photographs based on their perceived similarity. Thereafter, one photograph from each category was chosen to represent that particular category.
(3)
Screening and supplementation: This step involved a meticulous analysis of the categorized images by design professionals. Their assessments, based on color, perspective, and size considerations, resulted in the removal of unsuitable samples and the addition of alternative images when deemed necessary.
In this study, first, 100 car photographs were collected. In this process, white cars and cars with oblique 45° perspectives were selected to eliminate the errors due to different perspectives and colors. Moreover, we retained photographs of cars with moderate sizes and removed those with extremely large or small body sizes [50]. A similarity analysis by industrial design experts classified the 100 car photographs into 72 categories. A singular image from each of these categories was subsequently identified as a representative sample. Upon a thorough review, 60 of these automobile photographs were retained as the research samples for this study. The product research samples are presented in Table 5.
The panel of industrial design experts included five individuals: three men and two women. All were faculty members in industrial design at universities, with three of them possessing specific expertise in automobile design.

3.3. Product Styling Target Image Matching Experiment Utilizing E-Prime

3.3.1. Experiment Preparation and Participant Demographics

(1) Experiment preparation
E-Prime is a comprehensive experimental system used in behavioral psychology research. E-Prime provides a graphical user interface to the participants for experimental engagement. E-Prime can present text, pictures, and auditory stimuli in random or fixed sequences. This study conducted the product styling target image matching experiment using E-Prime to determine the mapping relationship between the research sample and the target image.
The experimental environment was configured before the experiment to ensure comfortable conditions for participants, and noise and lighting were controlled and managed. For uniformity, all car research samples had a consistent background hue, with photographs standardized to a resolution of 1280 × 1024 pixels and centrally positioned on the stimulus display screen.
The experiment aimed to determine product styling target image matching for the car study samples. The emphasis was on identifying research samples with the largest, moderate, and smallest target image evaluation values. Consequently, research samples for “high match”, “medium match”, and “low match” were generated, providing a basis for the subsequent study into the relationship between different target image matches and EEG or eye-tracking metrics.
(2) Participant demographics
A total of 26 university students with an average age of 20 were invited to participate in the experiment voluntarily. The participants had bare-eye or corrected vision of 1.0 or above and no symptoms such as color blindness or color weakness. All participants had a degree of familiarity with car styling.

3.3.2. Experimental Design

The car styling target image matching experiment was conducted using the E-Prime 2.0 software for image evaluation and data recording. The experiment used face-rating control to facilitate evaluation between the target image and research samples; this approach allowed the participants to assess product styling images, with E-Prime recording the image evaluation data. The method can establish mapping relationships between the product research samples and the target image evaluation. To enhance participant comprehension, the experimental guidelines were divided into two segments, utilizing both graphic and textual representations to improve the clarity and readability of the instructions.
In this experiment, 60 automobile research samples were evaluated for the target image. The experiment included 60 trials, which were divided into 5 phases. At the end of each phase, the participant could take a break, and the break time was not limited. After the break, the participant could press any key to continue the experiment. The experiment was conducted by invoking and presenting the car study sample (stimulus material) through a list control functionality of E-Prime. The experimental process for the product styling target image matching of the car research samples is illustrated in Figure 2.
The face-rating control in E-Prime was used to actualize the image evaluation function. By compiling inline code, mouse clicks were used to obtain and record values from a five-point Likert evaluation scale. The data were exported by adding an output channel. The inline program code is presented in Figure 3.

3.3.3. Experimental Implementation and Data Processing

Before starting the experiment, the E-Studio function in E-Prime 2.0 was opened, and the experiment program was executed. We briefed the participants on the experimental procedures and precautions. They then became familiar with the guidelines and comprehended the experimental processes. At the beginning of the experiment, the participants were required to perform an image-matching evaluation in the car styling evaluation interface according to the form style of the research samples. In this study, the experiment used a five-point Likert scale [51] with image ratings of 1, 2, 3, 4, and 5. In the case of “atmospheric”, “1”, “2”, “3”, “4”, and “5” indicate that the car styling was evaluated as “very un-atmospheric”, “relatively un-atmospheric”, “between un-atmospheric and atmospheric”, “relatively atmospheric”, and “very atmospheric”, respectively.
The recorded experimental data were saved, and the experimental equipment was powered down at the end of the experiment. The saved data files were exported using the E-Merge module in E-Prime. The image evaluation values of all the car research samples were compiled, summarized, and analyzed, and the car research samples were ranked using the image evaluation value. Three types of research samples were obtained based on the image evaluation value: “high match”, “medium match”, and “low match”. A subset of the research samples’ target-image-matching data is presented in Table 6.

3.4. Product Styling Cognition Experiments Based on Implicit Measurement

3.4.1. Experiment Preparation and Participant Demographics

(1) Preliminary Preparation
In the experiment, two computers were prepared. Computer 1 was a hardware platform for eye-tracking experiments, including experimental design, stimulus presentation, and statistical analysis of eye-tracking data. This computer functioned using a dual monitor setup to display interfaces for both the examiner and the participant separately. Computer 2 was a hardware platform for EEG experiments to capture, process, and analyze EEG data. Before the experiment, the spatial arrangements of the computer, monitor, eye-tracking device, and EEG equipment were adjusted. To improve the precision of measurements, the EEG device was positioned away from industrial electrical sources.
Informed consent forms, experimental precautions, and lists of the experimental examination items were prepared. Participants were required to complete the informed consent form before the experiment. This process allowed the research team to verify participant details, ensuring that the experiment complied with the guidelines set by the ethical review board and experiment design. The EEG experiment materials included a conductive paste, flat-head syringe, shampoo, towel, and hair dryer. To satisfy the specified electrode impedance, adequate conduction between the electrodes of the EEG device and the surface layer of the scalp was required. The conductive paste and flat-head syringe were employed to achieve the required electrode impedance.
(2) Experimental equipment
The experimental equipment used in this study included EEG and eye-tracking equipment. The EEG amplifiers (Brain Amp MR32), EEG signal recording software (Brain Vision Recorder 1.21), and EEG signal analysis software (Brain Vision Analyzer 2.2) were obtained from Brain Products (BP) company, Germany. The EEG system was equipped with 32 EEG channel electrodes. The sampling rate was set to 1000 Hz/channel, and electrode placements adhered to the 10–20 international standard.
A Tobii Pro X3-120 (Tobii, Sweden) eye-tracking device was used, and the sampling rate was set to 120 Hz. The accuracy was 0.5°, and the spatial resolution was 0.2°. The eye-tracking device was equipped with Tobii Pro Lab 1.194 software for data recording and analysis and Stimulus Presentation Tool 3 for stimulus presentation.
(3) Stimulus materials
The stimulus materials included the 60 car research samples collected previously. The experiments required mapping the areas of interest (AOI) on the study samples. The AOI is the primary region of the experimental stimulus relevant to the study. AOIs can be determined based on the study’s purpose. In this experiment, the entire car was segmented into AOIs.
(4) Participant demographics
A total of 28 university students were recruited (13 males and 15 females, aged 20–26 years). All participants were in good health, had no history of mental illness, and were right-handed; their visual or corrected visual acuity was normal. The participants were familiar with the product form and image vocabulary. They did not consume any stimulants, including sedatives, tranquilizers, alcohol, or coffee, during the 48 h window preceding the experiment. All of them voluntarily participated in the experiment and were rewarded financially at the end of the experiment.

3.4.2. Experimental Design

The experimental procedure included fitting an EEG cap, applying the conductive paste, checking impedance, calibrating the eye-tracking device, a pre-experiment, a resting interval, and formal experiments. The pre-experiment allows participants to familiarize themselves with the experimental procedure, comprehend its content, and address any concerns or disturbances. The eye-tracking device calibration ensured that data acquisition satisfied the accuracy requirements. Engaging in the pre-experiment helps minimize potential errors in EEG and eye movement data. The Tobii Pro Lab 1.194 software presented stimulus material and acquired eye-tracking data, and the Brain Vision Recorder 1.21 software acquired ERP data.
The pre-experiment included three preparatory tasks, two formal tasks, and one auxiliary task. The preparatory tasks included “experimental instruction”, a “close your eyes” instruction, and an “open your eyes” instruction. The formal tasks involved presenting the “red gaze point” and “study sample”. The red gaze point (the red plus sign in Figure 4) informs participants that a study sample will be presented immediately. This allows participants to increase their attention. The auxiliary task involved “resting”. The “study sample” presentation comprised two stages: perception and evaluation. The experimental process and the presentation time of each experimental interface are illustrated in Figure 4. The experimental procedure was the same for the formal experiment and pre-experiment, differing only in that the pre-experiment was presented 5 times and the formal experiment was presented 60 times for each research sample. Participants were allowed to take a break after an experimental period to avoid cognitive fatigue and experimental errors.
In the perception phase, participants viewed and comprehended the automobile study sample (stimulus material) in the context of the target imagery. For instance, they were required to understand the relevance of the automobile study sample to the target imagery, pondering the extent to which the automobile styling resonated with the feeling and visual expressed in the target image. During the subsequent evaluation phase, participants were instructed to rate the research sample based on its alignment with the target image.

3.4.3. Experimental Implementation

Before the experiments, we scheduled the experiment timings in coordination with the participants and reminded them of the precautions. The experimenter verified that participant details and conditions adhered to the experimental requirements before starting the experiment; if they had not been met, it would have necessitated selecting a different participant.
During the experiment, the participant was seated in the designated position. The data-acquisition cable from the EEG cap was connected to the EEG device amplifier, which in turn was linked to Computer 2. The EEG cap was fitted onto the participant’s head, and electrodes were mounted on the cap according to the international 10–20 electrode placement system. The conductive paste was introduced using a flat-tip syringe. The real-time electrode impedance was monitored, ensuring it remained below 5 kΩ [41] to meet the requirement. The eye-tracking device was connected to Computer 1 and calibrated using the Eye Tracker Manager 2.4.10 software; the relevant parameters were set, and the seat back angle and viewing distance were adjusted. Participants were informed of the experimental procedure and guidelines. The experiments were carried out in strict accordance with the experimental procedures. Figure 5 shows the scene of the combined EEG and eye-tracking experiments.

4. Results

4.1. EEG Signals

The EEG data were processed before determining the experimental results. The main processing steps were re-referencing, ocular correction [52], raw data inspection, filtering, segmentation [53], baseline correction, and superposition averaging [54]. The default reference electrode for the BP EEG device was located at the tip of the nose (FCz). However, in practice, the average value of the bicolor mastoid (TP9, TP10) was used as the reference electrode, a process known as re-referencing. The EEG-evoked potentials during the experiment were extremely weak and easily influenced by disturbances such as blinking, muscle activities, and heartbeat. Ocular correction was applied to mitigate the electromyographic effects resulting from eye movements or blinks. The raw data inspection step aimed to remove artifacts that arose either from the equipment or the movements of the participants. This step comprised settings that accounted for gradient changes between two sampling points, maximum absolute value of amplitude changes, maximum and minimum permissible voltage values, minimum permissible amplitude change within the set time period, and maximum permissible amplitude change within the set time period. Due to the susceptibility of EEG signals to noise, certain frequencies improbable for human generation were filtered. Considering the lowest and highest EEG signal frequencies of the brain, data in this experiment were processed using low-cutoff filtering (0.01 Hz), high-cutoff filtering (35 Hz), and notch filtering (50 Hz) to filter out interference signals. In this experiment, evoked potentials are EEG signal amplitude variations occurring over a period after the participant observes the product study sample. Segmentation was conducted based on the markers of events, and considering the cognitive process of the brain, this experiment was segmented according to the time range from −200 ms to 800 ms of the stimulus material presentation [55]. For each study sample, the pertinent EEG data spanned a timeframe of 1000 ms, beginning 200 ms prior to and ending 800 ms after sample presentation. Baseline correction was employed to counteract the effects of data drift on results. Typically, in EEG studies, pre-stimulus EEG activity serves as the baseline. By contrasting it with post-stimulus EEG activity, the EEG signals elicited by the stimulus can be analyzed. For instance, using the −200 ms to 800 ms EEG data, the segment from −200 ms to 0 ms functions as the baseline, with EEG data fluctuations from 0 ms to 800 ms being the focus of the study. To enhance both experimental precision and the quality of EEG signal analysis, multiple trials of either the same sample or samples of the same type were superimposed and then averaged [56]. Superimposing EEG data not only counteracts spontaneous potentials but also improves the evoked potential EEG signal’s analytical quality. Crucially, when superimposing EEG data, time-locking must be observed. Specifically, only EEG signals from identical timeframes across different trials of either the same or similar study samples by the same participant can be superimposed. The divisor in the EEG signal average was consistent with the number of trials presented for the study sample during segmentation.
The EEG topography generated using the participant EEG data is depicted in Figure 6. This was derived from the −200 ms to 800 ms range of stimulus presentation through the superimposed averaging of EEG signals. As shown in Figure 6, the energy intensity in users’ car styling cognition is notably higher in the frontal region, indicating that the frontal region predominantly governs product styling image cognition.
According to the 10–20 system for electrode distribution, the electrodes with the highest energy during the combined EEG and eye-tracking product styling cognition experiment were FP1, FP2, F7, and FT9. The results suggest that these electrodes are closely related to the user’s cognitive processing of product styling.
As discussed in Section 3.4.2, the experiment was divided into the automotive research sample perception and evaluation phases. Section 3.3.3 detailed the categorization of the 60 automobile research samples into 3 target image groups: “high match”, “medium match”, and “low match”. The EEG signals corresponding to the “high match” and “low match” study samples during the perception phase are illustrated in Figure 7. The red EEG waves are the EEG signals of the “high match” study samples. The black EEG waves represent the EEG signals of the “low match” study samples. During the perception stage, “high match” study samples elicit more pronounced EEG signals than “low match” samples.
Figure 8 shows the EEG signals triggered by “high match” and “low match” study samples in the evaluation phase. Here, red EEG signals are a product of the “high match” study samples, while black EEG signals originate from the “low match” samples. Notably, no evident correlation exists between EEG signal changes and target image matching during the evaluation phase of the automobile study samples.

4.2. Eye-Tracking Signals

The experimental results were analyzed using qualitative methods and quantitative eye-tracking index data to improve the accuracy of the analysis. The level of attention to a certain area can be analyzed using eye-tracking indicators such as hotspot maps and first entry time. In this study, the research samples were divided into three categories: “high match”, “medium match”, and “low match”, and the gaze, visit, and eye-skip data corresponding to the three categories were analyzed. Table 7 presents the eye-tracking index data of “gaze”, “visit”, and “eye skips” for each category.
As shown in Figure 9a, no significant difference exists in the total gaze time between the three sample categories. The total, average, and first visit times of the “high match” study samples were lesser than those of the “medium match” and “low match” study samples. Moreover, no significant differences were present in the total visit time between the “medium match” and “low match” samples. However, the average and first visit times of the study samples with different target image matching levels were significantly different; the average and first visit times of the “medium match” study samples were larger than those of the “low match” study samples.
Figure 9b reveals a descending pattern in the gaze and visit entry times of the study samples across the “high match”, “medium match”, and “low match” categories. Among study samples with identical target image matchings, the average gaze time was large for gaze entry, first gaze, and visit entry times. The data of different eye-tracking indexes indicate a consistent pattern for gaze and visit entry times, and the “low match” category has the shortest gaze and visit entry times compared to other match categories.
As shown in Figure 9c, the number of gaze points and eye skips for the “high match” samples were fewer than those for the “medium match” samples. Furthermore, the number of gaze points and eye skips for the “medium match” samples was fewer than that for the “low match” samples.

5. Discussion

5.1. Product Styling Image Cognition Based on EEG Signals

In this study, the research samples were classified into three categories, namely “high match”, “medium match”, and “low match”, according to the relationship between the image evaluations and the research samples. This study investigated the physiological and behavioral mechanisms influencing styling cognition across research samples with different degrees of image match. The participants’ physiological responses were gauged using EEG data, and their behavioral patterns were identified using eye-tracking data. We studied the intrinsic reasons for user cognition of product styling using EEG and eye-tracking data to provide theoretical underpinnings for product styling innovation design.
For different product styling image cognition, the electrodes with the highest energies were mainly FP1, FP2, F7, and FT9. These electrodes primarily span the occipital and left frontal area of the brain, indicating that these areas are fundamental for users’ cognition of product styling. In this study, the product styling image cognition experiment was divided into perception and evaluation phases. During the perception phase, the participants only focused on viewing the product study sample and perceiving it based on the target image vocabulary. Therefore, ERP signals evoked by participants in the perception stage in response to product styling can be considered more meaningful and insightful. The ERP signals from “high match” samples were more prominent than those from “low match” samples. This result indicates that “high match” samples evoked more intense brainwave signals than “low match” samples. During the evaluation phase, where the participants focused on evaluating and grading product forms, the primary emphasis extended beyond image perception of the product forms. Therefore, the differential between “high match” and “low match” samples in terms of ERP signal generation was not significant in the evaluation phase.

5.2. Product Styling Image Cognition Based on Eye-Tracking Signal

Upon evaluating the appeal and cognitive levels of the product study sample, distinct patterns in visual attention distribution emerged. A previous study reported that the gaze duration and number of gazes reflect an individual’s information-seeking behavior and gaze patterns [57]. The time for participants’ average gaze time upon a “high match” study sample was significantly shorter than that for “medium match” or “low match” samples. The lower number of gaze points for “high match” samples demonstrates the superior attractiveness of the corresponding products. For the “low match” samples, the participants’ hotspot maps and gaze trajectories were more dispersed across each functional area of the product compared to the “high match” samples. The numbers of gaze points and eye skips are specific reflections of the users’ attention and evaluation of the attractiveness of the product form. A smaller number of gaze points and eye skips indicate prolonged gaze durations and increased concentration, indicating that product styling is more attractive.

6. Conclusions

This study used a combined approach integrating eye-tracking and EEG techniques to investigate participants’ image cognition of differently matched product study samples. The salient findings are as follows:
(1)
The lexical similarity computation mode can be used to determine the target image in Kansei engineering.
(2)
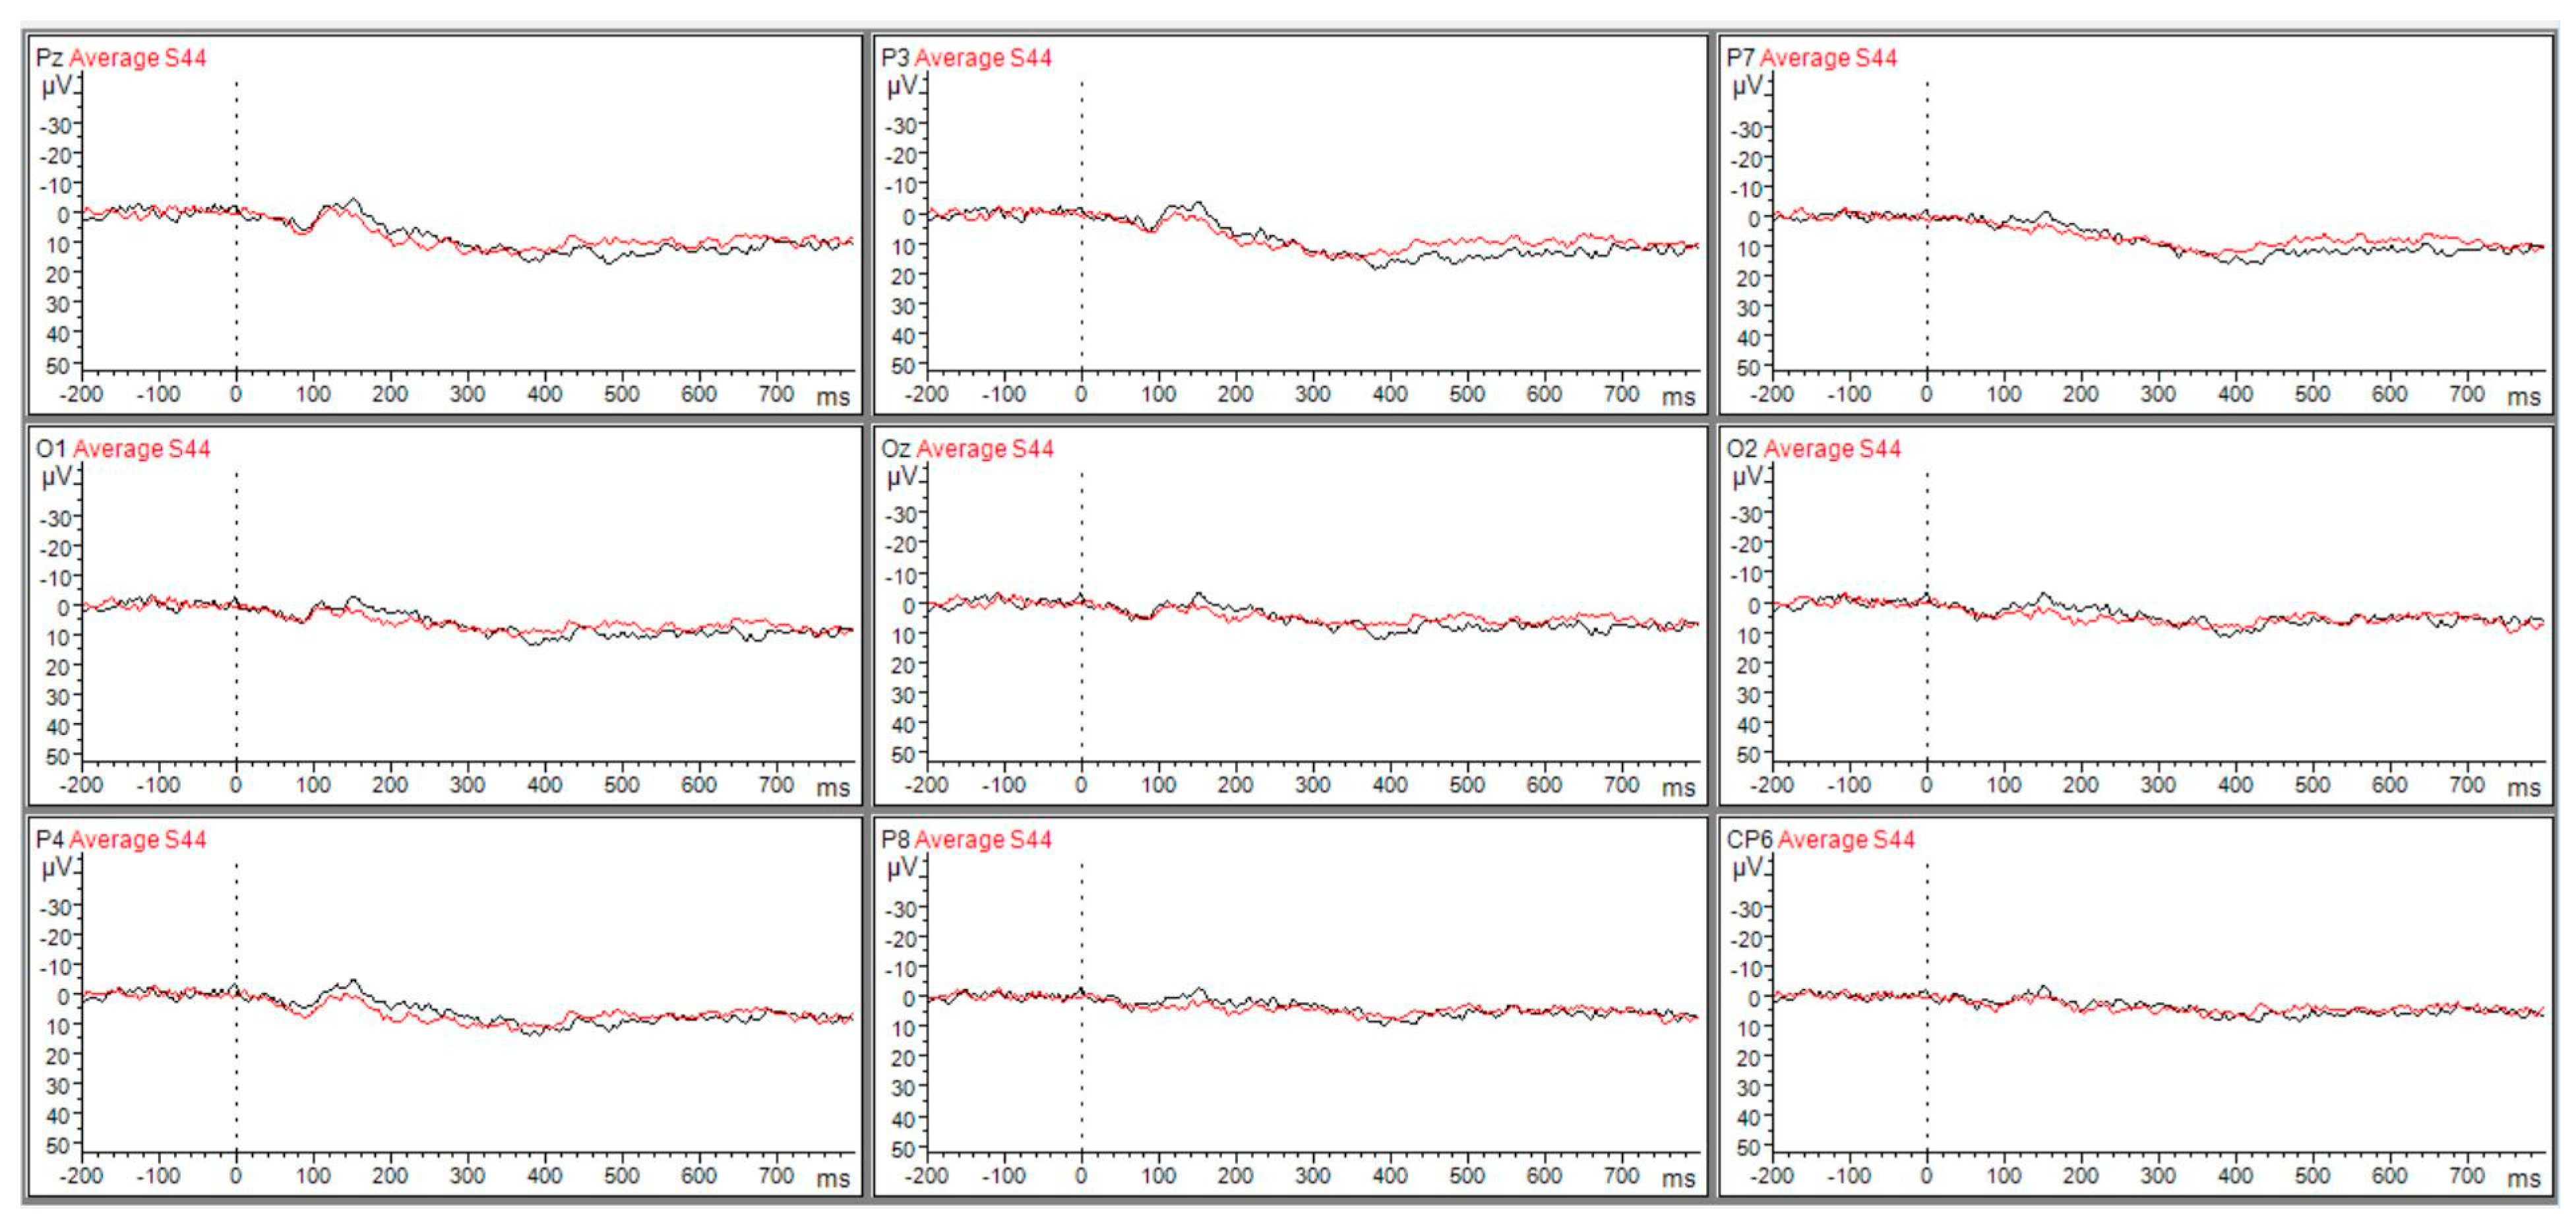
Compared with the product styling evaluation phase, the variability in ERP signals when assessing users’ cognition of product styling was more pronounced during the product styling perception phase. The results indicated that the product styling perception phase is appropriate for studying user cognition of product styling based on implicit measurements.
(3)
Samples exhibiting “high match” with the target image elicited more pronounced EEG than “low match” samples. Furthermore, the greater the variability between “high match” and “low match” samples, the more distinct the EEG signal variations.
(4)
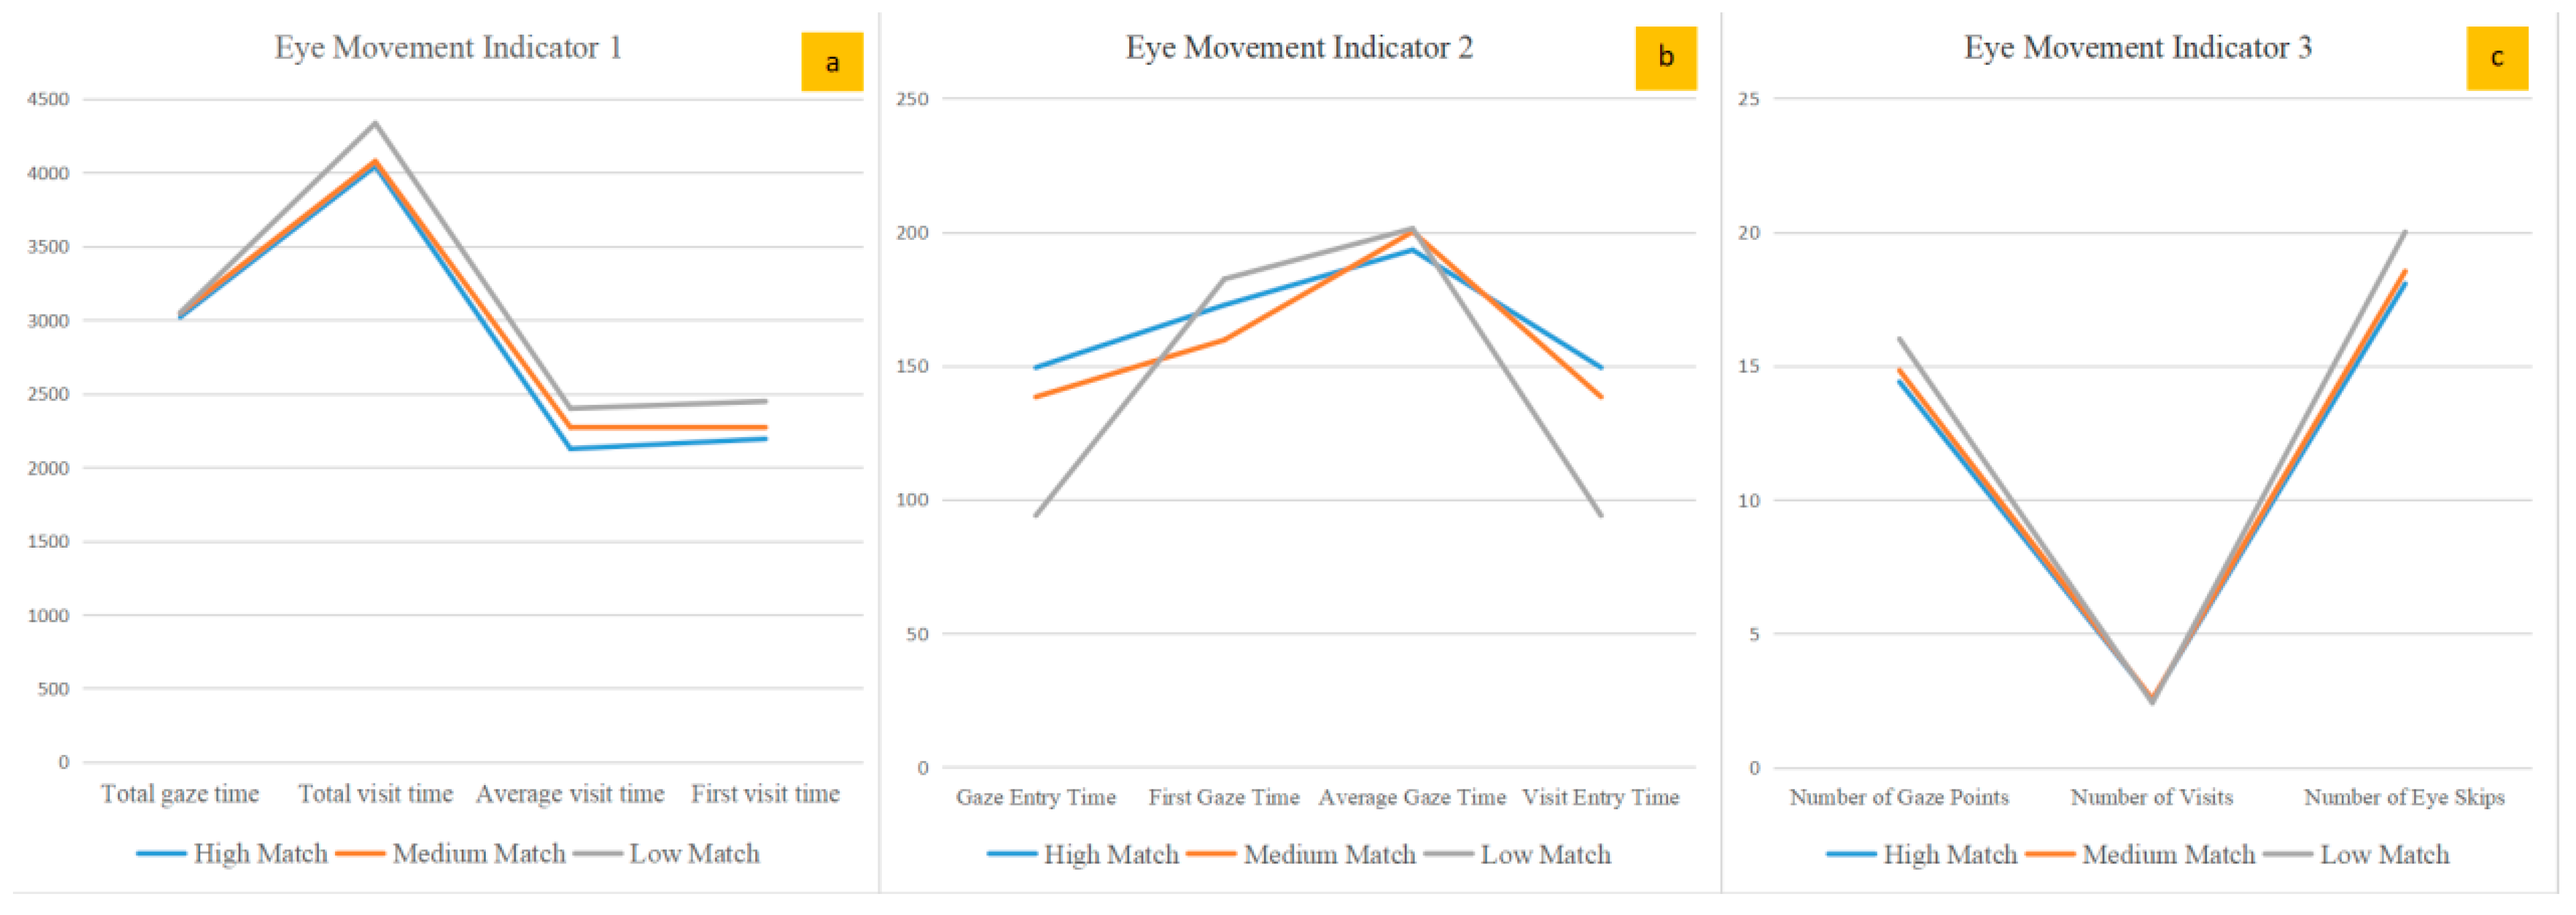
The number of gaze points and eye skips for “high match” samples was smaller than that for “medium match” samples. Similarly, the number of gaze points and eye skips for “medium match” samples was smaller than that for “low match” samples. A smaller number of gaze points and eye skips indicates extended user focus and heightened attention, suggesting that the product styling is more attractive.
For future innovative product styling designs, it would be prudent to monitor EEG signal variations in the frontal brain region during users’ product styling perceptions. A larger EEG signal amplitude in the frontal region signifies a higher match between product styling and the target image, translating to a more appealing product design. Conversely, a diminished EEG amplitude indicates a lower alignment between product styling and target image, suggesting reduced attractiveness of product styling. This method is applicable to styling design, styling research, and styling evaluation of different types of products, such as electronic and transportation products.
Furthermore, the results of eye-tracking experiments can offer invaluable insights for design evaluations and innovative product designs. Key eye-movement metrics such as total, average, and first visit times, along with gaze and visit entry times and the number of gaze points, serve as robust indicators. Elevated values of these metrics typically correlate with heightened or reduced alignment of the product design to the target image.
Nevertheless, this study has some limitations. Although a combined EEG and eye-tracking approach was used to study user cognition of product styling, the spatial resolution constraints of ERP limited the precise localization of brain functions. In the future, we will consider integrating functional magnetic resonance imaging (fMRI) with EEG and eye tracking to study product styling cognition, leveraging the superior spatial resolution of fMRI. Future work will also delve into product innovation design based on the combination of EEG responses, eye movements, heart rate, and facial expressions and a comparative analysis of the advantages and disadvantages of various measurement methods. While this study is limited to product styling image cognition, in the future, we will consider using physiological measurement tools to discern nuances in product color and material cognition.

Author Contributions

Conceptualization, Q.Z. and Z.L.; methodology, Q.Z. and B.Y.; validation, Q.Z. and C.W.; writing—original draft preparation, Q.Z.; writing—review and editing, C.W.; visualization, B.Y. All authors have read and agreed to the published version of the manuscript.

Funding

This research was funded by the Scientific Research Project of Ningxia Education Department, grant number NYG2022069; Ningxia Natural Science Foundation, grant numbers 2023AAC03288, 2021AAC03213; Ningxia Young Science and Technology Talent Support Project, grant number 21022000404; Ningxia Industrial Design Center, grant number SJZX_2020_GXT_01.

Institutional Review Board Statement

The study was conducted in accordance with the Declaration of Helsinki and approved by the Biomedical Research Ethics Review Committee of North Minzu University (protocol code: 2023-007; approval date: 12 May 2023).

Informed Consent Statement

Informed consent was obtained from all subjects involved in the study.

Data Availability Statement

The data used to support the findings of this study are available from the corresponding author upon request.

Conflicts of Interest

The authors declare no conflict of interest.

References

  1. Fjaellegaard, C.B.; Beukel, K.; Alkaersig, L. Designers as the determinants of design innovations. Creat. Innov. Manag. 2019, 28, 144–156. [Google Scholar] [CrossRef]
  2. Krippendorff, K.; Butter, R. Product Semantics—Exploring the Symbolic Qualities of Form; Departmental Papers (ASC); University of Pennsylvania: Philadelphia, PA, USA, 1984; pp. 3–9. [Google Scholar]
  3. Lopez, O.; Murillo, C.; Gonzalez, A. Systematic literature reviews in Kansei Engineering for product design—A comparative study from 1995 to 2020. Sensors 2021, 21, 6532. [Google Scholar] [CrossRef]
  4. Zhao, T.J.; Zhang, X.Y.; Zhang, H.C.; Meng, Y.F. A study on users’ attention distribution to product features under different emotions. Behav. Inf. Technol. 2023, 1–14. [Google Scholar] [CrossRef]
  5. Luo, S.J.; Zhang, Y.F.; Zhang, J.; Xu, J.H. A user biology preference prediction model based on the perceptual evaluations of designers for biologically inspired design. Symmetry 2020, 12, 1860. [Google Scholar] [CrossRef]
  6. Wang, Z.; Liu, W.; Yang, M.; Han, D. Product shape imagery design based on elliptical Fourier. Comput. Integr. Manuf. Syst. 2020, 26, 481–495. [Google Scholar] [CrossRef]
  7. Oh, K.; Park, K.I.; Kim, H.-C.; Kim, W.J.; Lee, S.-H.; Ji, Y.G.; Jung, J.-Y. Developing a user property metadata to support cognitive and emotional product design. J. Soc. e-Bus. Stud. 2016, 21, 69–80. [Google Scholar] [CrossRef]
  8. Liu, Z.; Wu, J.; Chen, Q.; Hu, T. An improved Kansei engineering method based on the mining of online product reviews. Alex. Eng. J. 2023, 65, 797–808. [Google Scholar] [CrossRef]
  9. Gong, X.; Guo, Z.; Xie, Z. Using Kansei engineering for the design thinking framework: Bamboo pen holder product design. Sustainability 2022, 14, 10556. [Google Scholar] [CrossRef]
  10. Ge, B.; Shaari, N.; Yunos, M.Y.M.; Abidin, S.Z. Group consumers’ preference recommendation algorithm model for online apparel’s colour based on Kansei engineering. Ind. Textila 2023, 74, 81–89. [Google Scholar] [CrossRef]
  11. Zhang, S.T.; Wang, S.J.; Zhou, A.M.; Liu, S.F.; Su, J.N. Cognitive matching of design subjects in product form evolutionary design. Comput. Intell. Neurosci. 2021, 2021, 8456736. [Google Scholar] [CrossRef]
  12. Liang, C.C.; Lee, Y.H.; Ho, C.H.; Chen, K.H. Investigating vehicle interior designs using models that evaluate user sensory experience and perceived value. AI EDAM-Artif. Intell. Eng. Des. Anal. Manuf. 2020, 34, 401–420. [Google Scholar] [CrossRef]
  13. Mei, Y.; Liu, Y. Application of implicit measurement in social and personality psychology studies. Adv. Psychol. 2018, 8, 131–138. [Google Scholar] [CrossRef]
  14. Castiblanco Jimenez, I.A.; Gomez Acevedo, J.S.; Marcolin, F.; Vezzetti, E.; Moos, S. Towards an integrated framework to measure user engagement with interactive or physica1 products. Int. J. Interact. Des. Manuf. 2022, 17, 45–67. [Google Scholar] [CrossRef]
  15. Bell, L.; Vogt, J.; Willemse, C.; Routledge, T.; Butler, L.T.; Sakaki, M. Beyond self-report: A review of physiological and neuroscientific methods to investigate consumer behavior. Front. Psychol. 2019, 9, 1655. [Google Scholar] [CrossRef]
  16. Guo, F.; Ding, Y.; Wang, T.; Liu, W.; Jin, H. Applying event related potentials to evaluate user preferences toward smartphone form design. Int. J. Ind. Ergon. 2016, 54, 57–64. [Google Scholar] [CrossRef]
  17. Yang, C.; Chen, C.; Tang, Z. An study of electroencephalography cognitive model of product image. J. Mech. Eng. 2018, 23, 126–136. [Google Scholar] [CrossRef]
  18. Hu, F.; Li, W. Advances in EEG-based design science research: Dimensions and methods. Zhuang Shi 2018, 2, 102–105. [Google Scholar] [CrossRef]
  19. Yang, C.; Peng, Y.; Tang, Z. Current status and trends of EEG research in the field of general design. Packag. Eng. 2020, 41, 64–75. [Google Scholar] [CrossRef]
  20. Hsu, C.-C.; Fann, S.-C.; Chuang, M.-C. Relationship between eye fixation patterns and Kansei evaluation of 3D chair forms. Displays 2017, 50, 21–34. [Google Scholar] [CrossRef]
  21. Liu, C.; Sogabe, H. The application of gaze heat maps in impression evaluation—Case study of Chinese college students evaluating historical souvenir stores in Japan. Int. J. Affect. Eng. 2020, 19, 67–77. [Google Scholar] [CrossRef]
  22. Zhou, Z.Y.; Cheng, J.X.; Wei, W.; Lee, L. Validation of evaluation model and evaluation indicators comprised Kansei engineering and eye movement with EEG: An example of medical nursing bed. Microsyst. Technol. 2021, 27, 1317–1333. [Google Scholar] [CrossRef]
  23. Zhang, Q.; Liu, Z.; Zhang, X.; Mu, C.; Lv, S. Target mining and recognition of product form innovation design based on image word similarity model. Adv. Math. Phys. 2022, 2022, 3796734. [Google Scholar] [CrossRef]
  24. Shinomura. Hiroshiken; Iwanami Shoten: Tokyo, Japan, 2018. [Google Scholar]
  25. Nagamachi, M. Kansei engineering and comfort. Int. J. Ind. Ergon. 1997, 19, 79–80. [Google Scholar] [CrossRef]
  26. Qiu, K.; Su, J.N.; Zhang, X.X.; Yang, W.J. Evaluation and balance of cognitive friction: Evaluation of product target image form combining entropy and game theory. Symmetry 2020, 12, 1398. [Google Scholar] [CrossRef]
  27. Lee, J.H.; Ostwald, M.J. Measuring cognitive complexity in parametric design. Int. J. Des. Creat. Innov. 2019, 7, 158–178. [Google Scholar] [CrossRef]
  28. Dong, Y.; Zhu, R.; Peng, W.; Tian, Q.; Guo, G.; Liu, W. A fuzzy mapping method for Kansei needs interpretation considering the individual Kansei variance. Res. Eng. Des. 2021, 32, 175–187. [Google Scholar] [CrossRef]
  29. Coronado, E.; Venture, G.; Yamanobe, N. Applying Kansei/affective engineering methodologies in the design of social and service robots: A systematic review. Int. J. Soc. Robot. 2021, 13, 1161–1171. [Google Scholar] [CrossRef]
  30. Abdi, S.J.; Greenacre, Z.A. An approach to website design for Turkish universities, based on the emotional responses of students. Cogent Eng. 2020, 7, 1770915. [Google Scholar] [CrossRef]
  31. Akgul, E.; Ozmen, M.; Sinanoglu, C.; Aydogan, E.K. Rough Kansei mining model for market-oriented product design. Math. Probl. Eng. 2020, 2020, 6267031. [Google Scholar] [CrossRef]
  32. Hartono, M. The modified Kansei Engineering-based application for sustainable service design. Int. J. Ind. Ergon. 2020, 79, 102985. [Google Scholar] [CrossRef]
  33. Schütte, S.; Marco-Almagro, L. Linking the Kansei food model to the general affective engineering model—An application on chocolate toffee fillings. Int. J. Affect. Eng. 2022, 21, 219–227. [Google Scholar] [CrossRef]
  34. Wang, Y.; Zhao, Q.X.; Chen, J.; Wang, W.W.; Yu, S.H.; Yang, X.Y. Color design decisions for ceramic products based on quantification of perceptual characteristics. Sensors 2022, 22, 5415. [Google Scholar] [CrossRef] [PubMed]
  35. Luo, S.J.; Fu, Y.T.; Korvenmaa, P. A preliminary study of perceptual matching for the evaluation of beverage bottle design. Int. J. Ind. Ergon. 2012, 42, 219–232. [Google Scholar] [CrossRef]
  36. Castiblanco Jimenez, I.A.; Gomez Acevedo, J.S.; Olivetti, E.C.; Marcolin, F.; Ulrich, L.; Moos, S.; Vezzetti, E. User engagement comparison between advergames and traditional advertising using EEG: Does the user’s engagement influence purchase intention? Electronics 2023, 12, 122. [Google Scholar] [CrossRef]
  37. Songsamoe, S.; Saengwong-ngam, R.; Koomhin, P.; Matan, N. Understanding consumer physiological and emotional responses to food products using electroencephalography (EEG). Trends Food Sci. Technol. 2019, 93, 167–173. [Google Scholar] [CrossRef]
  38. Ma, Y.; Jin, J.; Yu, W.; Zhang, W.; Xu, Z.; Ma, Q. How is the neural response to the design of experience goods related to personalized preference? An implicit view. Front. Neurosci. 2018, 12, 760. [Google Scholar] [CrossRef] [PubMed]
  39. Shang, Q.; Jin, J.; Pei, G.; Wang, C.; Wang, X.; Qiu, J. Low-order webpage layout in online shopping facilitates purchase decisions: Evidence from event-related potentials. Psychol. Res. Behav. Manag. 2020, 13, 29–39. [Google Scholar] [CrossRef] [PubMed]
  40. Evans, J.S.B.T. Dual-processing accounts of reasoning, judgment, and social cognition. Annu. Rev. Psychol. 2008, 59, 255–278. [Google Scholar] [CrossRef]
  41. Guo, F.; Li, M.; Hu, M.; Li, F.; Lin, B. Distinguishing and quantifying the visual aesthetics of a product: An integrated approach of eye-tracking and EEG. Int. J. Ind. Ergon. 2019, 71, 47–56. [Google Scholar] [CrossRef]
  42. Wu, L.; Gao, H.; Wang, K.-C.; Yang, C.-H. A green-IKE inference system based on grey neural network model for humanized sustainable feeling assessment about products. Math. Probl. Eng. 2020, 2020, 6391463. [Google Scholar] [CrossRef]
  43. Hsiao, S.W.; Liu, M.C. A morphing method for shape generation and image prediction in product design. Des. Stud. 2002, 23, 533–556. [Google Scholar] [CrossRef]
  44. Mohamed, M.; Oussalah, M. A hybrid approach for paraphrase identification based on knowledge-enriched semantic heuristics. Lang. Resour. Eval. 2020, 54, 457–485. [Google Scholar] [CrossRef]
  45. Yang, S.; Wei, R.; Guo, J.Z.; Tan, H.L. Chinese semantic document classification based on strategies of semantic similarity computation and correlation analysis. J. Web Semant. 2020, 63, 100578. [Google Scholar] [CrossRef]
  46. Rajabi, Z.; Valavi, M.R.; Hourali, M. A context-based disambiguation model for sentiment concepts using a bag-of-concepts approach. Cogn. Comput. 2020, 12, 1299–1312. [Google Scholar] [CrossRef]
  47. Mei, J.J. TongYiCi CiLin; Shanghai Dictionary Publishing House: Shanghai, China, 1983. [Google Scholar]
  48. Che, W.; Feng, Y.; Qin, L.; Liu, T. An open-source neural language technology platform for Chinese. arXiv 2021, arXiv:2009.11616. [Google Scholar]
  49. Li, Y.; Qi, J.F.; Chu, X.Q.; Mu, W.S. Customer segmentation using K-means clustering and the hybrid particle swarm optimization algorithm. Comput. J. 2023, 66, 941–962. [Google Scholar] [CrossRef]
  50. Wang, T.-S.; Yeh, Y.E. A study affective factor extraction using methodology for Kansei engineering. Int. J. Organ. Innov. 2015, 8, 206–217. [Google Scholar]
  51. Huang, Y.; Pan, Y. Discovery and extraction of cultural traits in intangible cultural heritages based on Kansei engineering: Taking Zhuang brocade weaving techniques as an example. Appl. Sci. 2021, 11, 11403. [Google Scholar] [CrossRef]
  52. Ding, M.; Ding, T.; Chen, X.; Shi, F. Using event-related potentials to identify user’s moods induced by product color stimuli with different attributes. Displays 2022, 74, 102198. [Google Scholar] [CrossRef]
  53. Wang, Y.; Yu, S.; Ma, N.; Wang, J.; Hu, Z.; Liu, Z.; He, J. Prediction of product design decision Making: An investigation of eye movements and EEG features. Adv. Eng. Inform. 2020, 45, 101095. [Google Scholar] [CrossRef]
  54. Yang, M.; Lin, L.; Chen, Z.; Wu, L.; Guo, Z. Research on the construction method of kansei image prediction model based on cognition of EEG and ET. Int. J. Interact. Des. Manuf. 2020, 14, 565–585. [Google Scholar] [CrossRef]
  55. Wang, J.; Wang, A.; Zhu, L.; Wang, H. The effect of product image dynamism on purchase intention for online aquatic product shopping: An EEG study. Psychol. Res. Behav. Manag. 2021, 14, 759–768. [Google Scholar] [CrossRef] [PubMed]
  56. Kalantari, S.; Cruz-Garza, J.; Xu, T.; Mostafavi, A.; Gao, E. Store layout design and consumer response: A behavioural and EEG study. Build. Res. Inf. 2023. [Google Scholar] [CrossRef]
  57. Pei, H.N.; Huang, X.Q.; Ding, M. Image visualization: Dynamic and static images generate users’ visual cognitive experience using eye-tracking technology. Displays 2022, 73, 102175. [Google Scholar] [CrossRef]
Figure 1. Platform of image lexical similarity calculation.
Applsci 13 09577 g001
Figure 2. Experimental process for the product styling target image matching of car research samples.
Applsci 13 09577 g002
Figure 3. Inline program code.
Applsci 13 09577 g003
Figure 4. Experimental process.
Applsci 13 09577 g004
Figure 5. Scene of the combined EEG and eye-tracking experiments.
Applsci 13 09577 g005
Figure 6. EEG topography of product styling image cognition.
Applsci 13 09577 g006
Figure 7. EEG signals elicited by different study samples during the perception phase.
Applsci 13 09577 g007
Figure 8. EEG signals elicited by different study samples during the evaluation phase.
Applsci 13 09577 g008
Figure 9. Changes in eye-tracking index data across the study samples.
Applsci 13 09577 g009
Table 1. Initial image vocabulary to describe car styling.
AtmosphericLuxurySimplicityFluencyElegant
ConciseExcellenceHardyFineFlamboyant
ExquisitePowerfulGraziosoSharpFantasy
FashionSmoothMovementSolemnClassic
TechnologySportySteadyBusinessSkillful
StrengthSpiritualityPrecisionGracefulModern
Table 2. Image vocabulary similarity data (partial).
SimilarityAtmosphericLuxurySimplicityFluencyElegantConciseExcellenceHardyFineFlamboyant
Atmospheric1.00000.39760.40920.40920.39760.39760.40920.39760.39760.5726
Luxury0.39761.00000.40330.40330.60020.56740.40330.59420.60020.3976
Simplicity0.40920.40331.00000.57700.40330.40330.57200.40330.40330.4092
Fluency0.40920.40330.57701.00000.40330.40330.59620.40330.40330.4092
Elegant0.39760.60020.40330.40331.00000.56870.40330.59270.59870.3976
Concise0.39760.56740.40330.40330.56871.00000.40330.56070.56600.3976
Excellence0.40920.40330.57200.59620.40330.40331.00000.40330.40330.4092
Hardy0.39760.59420.40330.40330.59270.56070.40331.00000.59570.3976
Fine0.39760.60020.40330.40330.59870.56600.40330.59571.00000.3976
Flamboyant0.57260.39760.40920.40920.39760.39760.40920.39760.39761.0000
Table 3. Image vocabulary classification.
Classification 1Classification 2Classification 3Classification 4
AtmosphericFantasyGraziosoLuxury
SimplicityFashionMovementElegant
FluencyTechnologySportyConcise
ExcellenceClassicModernHardy
FlamboyantBusiness Fine
PowerfulStrength Exquisite
Sharp Smooth
Solemn Precision
Steady Graceful
Skillful
Spirituality
Table 4. Significance test for clustering analysis of image words.
Image VocabularyClusteringErrorFSignificance
Mean SquareFreedomMean SquareFreedom
Technology0.091830.00142664.55480.0000
Solemn0.079530.01922611.00060.0001
Fantasy0.211230.0192264.14160.0159
Atmospheric0.165430.01182613.98540.0000
Classic0.242730.01602615.15460.0000
Grazioso0.165630.0118262.20570.1114
Precision0.004630.00212635.14510.0000
Flamboyant0.348830.00992614.02570.0000
Movement0.063530.0155264.11180.0163
Concise0.232030.00642636.44040.0000
Business0.065530.00102663.78040.0000
Excellence0.152930.01352611.29480.0001
Skillful0.168930.01192614.18280.0000
Strength0.136430.01112612.32000.0000
Spirituality0.167530.01192614.11360.0000
Hardy0.252730.00592643.02830.0000
Sharp0.258630.00572611.24930.0001
Elegant0.154930.01382645.20600.0000
Fashion0.116730.01132610.31210.0001
Simplicity0.150330.01342611.25450.0001
Fluency0.154330.01372611.28590.0001
Smooth0.244230.00602640.42510.0000
Powerful0.154630.01382611.22470.0001
Modern0.004930.0021262.27940.0430
Luxury0.258830.00572645.25390.0000
Steady0.211230.01922611.00060.0001
Fine0.348830.00992635.14510.0000
Exquisite0.309830.00992631.29100.0000
Graceful0.257930.00572645.00620.0000
Sporty0.064030.0155264.12570.0161
Table 5. Product research samples.
Sample 1Sample 2Sample 3Sample 4Sample 5Sample 6Sample 7Sample 8
Applsci 13 09577 i001Applsci 13 09577 i002Applsci 13 09577 i003Applsci 13 09577 i004Applsci 13 09577 i005Applsci 13 09577 i006Applsci 13 09577 i007Applsci 13 09577 i008
Sample 9Sample 10Sample 11Sample 12Sample 13Sample 14Sample 15Sample 16
Applsci 13 09577 i009Applsci 13 09577 i010Applsci 13 09577 i011Applsci 13 09577 i012Applsci 13 09577 i013Applsci 13 09577 i014Applsci 13 09577 i015Applsci 13 09577 i016
Sample 17Sample 18Sample 19Sample 20Sample 21Sample 22Sample 23Sample 24
Applsci 13 09577 i017Applsci 13 09577 i018Applsci 13 09577 i019Applsci 13 09577 i020Applsci 13 09577 i021Applsci 13 09577 i022Applsci 13 09577 i023Applsci 13 09577 i024
Sample 25Sample 26Sample 27Sample 28Sample 29Sample 30Sample 31Sample 32
Applsci 13 09577 i025Applsci 13 09577 i026Applsci 13 09577 i027Applsci 13 09577 i028Applsci 13 09577 i029Applsci 13 09577 i030Applsci 13 09577 i031Applsci 13 09577 i032
Sample 33Sample 34Sample 35Sample 36Sample 37Sample 38Sample 39Sample 40
Applsci 13 09577 i033Applsci 13 09577 i034Applsci 13 09577 i035Applsci 13 09577 i036Applsci 13 09577 i037Applsci 13 09577 i038Applsci 13 09577 i039Applsci 13 09577 i040
Sample 41Sample 42Sample 43Sample 44Sample 45Sample 46Sample 47Sample 48
Applsci 13 09577 i041Applsci 13 09577 i042Applsci 13 09577 i043Applsci 13 09577 i044Applsci 13 09577 i045Applsci 13 09577 i046Applsci 13 09577 i047Applsci 13 09577 i048
Sample 49Sample 50Sample 51Sample 52Sample 53Sample 54Sample 55Sample 56
Applsci 13 09577 i049Applsci 13 09577 i050Applsci 13 09577 i051Applsci 13 09577 i052Applsci 13 09577 i053Applsci 13 09577 i054Applsci 13 09577 i055Applsci 13 09577 i056
Sample 57Sample 58Sample 59Sample 60
Applsci 13 09577 i057Applsci 13 09577 i058Applsci 13 09577 i059Applsci 13 09577 i060
Table 6. Research samples’ target-image-matching data (partial).
“Low match”
Sample NumberSample 3Sample 13Sample 29Sample 56Sample 28
Sample PicturesApplsci 13 09577 i061Applsci 13 09577 i062Applsci 13 09577 i063Applsci 13 09577 i064Applsci 13 09577 i065
Evaluation Value1.321.431.521.521.65
“Medium match”
Sample NumberSample 44Sample 51Sample 21Sample 33Sample 36
Sample PicturesApplsci 13 09577 i066Applsci 13 09577 i067Applsci 13 09577 i068Applsci 13 09577 i069Applsci 13 09577 i070
Evaluation Value2.682.682.72.72.7
“High match”
Sample NumberSample 37Sample 39Sample 15Sample 38Sample 8
Sample PicturesApplsci 13 09577 i071Applsci 13 09577 i072Applsci 13 09577 i073Applsci 13 09577 i074Applsci 13 09577 i075
Evaluation Value3.483.523.653.653.83
Table 7. Eye-tracking index data of the study samples.
Study Sample ClassificationTotal Gaze Time (s)Total Visit Time (s)Average Visit Time (s)First Visit Time (s)
High Match3019404121242192
Medium Match3046407622702267
Low Match3049433323982446
Study Sample ClassificationGaze Entry Time (s)First Gaze Time (s)Average Gaze Time (s)Visit Entry Time (s)
High Match149173193149
Medium Match138160200138
Low Match9418220194
Study Sample ClassificationNumber of Gaze PointsNumber of VisitsNumber of Eye Skips
High Match14318
Medium Match15319
Low Match16220
Disclaimer/Publisher’s Note: The statements, opinions and data contained in all publications are solely those of the individual author(s) and contributor(s) and not of MDPI and/or the editor(s). MDPI and/or the editor(s) disclaim responsibility for any injury to people or property resulting from any ideas, methods, instructions or products referred to in the content.

