Article

Investigation and Spatial Distribution of Hard Ticks by Geographical Information System (GIS) in the Region of Istria, Croatia

by
Maja Cvek
1,2,†,
Dalibor Broznić
3,†,
Darja Puškadija
1,2,
Boris Blagonić
4,
Ivana Kirin
2,
Emina Pustijanac
5,
Nediljko Landeka
2,
Aleksandar Stojanović
2,
Mateja Ožanič Bučar
6 and
Dijana Tomić Linšak
7,8,*
1
Faculty of Medicine, University of Rijeka, Braće Branchetta 20, 51000 Rijeka, Croatia
2
Teaching Institute of Public Health of the Region of Istria, Nazorova 23, 52100 Pula, Croatia
3
Department for Medical Chemistry, Biochemistry and Clinical Chemistry, Faculty of Medicine, University of Rijeka, Braće Branchetta 20, 51000 Rijeka, Croatia
4
Geogrupa Ltd. Pula, Epulonova 21, 52100 Pula, Croatia
5
Faculty of Natural Sciences, Juraj Dobrila University of Pula, Zagrebačka 30, 52100 Pula, Croatia
6
Department for Health Sciences, Faculty of Health Sciences, University of Novo Mesto, Na Loko 2, 8000 Novo Mesto, Slovenia
7
Department for Health Ecology, Faculty of Medicine, University of Rijeka, Braće Branchetta 20, 51000 Rijeka, Croatia
8
Department for Scientific and Teaching Activity, Teaching Institute of Public Health County of Primorje-Gorski Kotar, Krešimirova 52a, 51000 Rijeka, Croatia
*
Author to whom correspondence should be addressed.
These authors share first authorship.
Appl. Sci. 2023, 13(16), 9483; https://doi.org/10.3390/app13169483
Submission received: 16 July 2023 / Revised: 14 August 2023 / Accepted: 17 August 2023 / Published: 21 August 2023
(This article belongs to the Section Environmental Sciences)

Abstract

:
Ticks are significant vectors of pathogens in human and veterinary medicine and have been identified as (re)emerging health threats. The primary objective of this study was to collect new data on the fauna of hard ticks within the region of Istria with a focus on spatial distribution using a geographical information system (GIS). All tick specimens were collected over three years (2020–2023), and this research included all 41 self-government units of Istria and Brijuni Islands National Park. Ticks were collected using the flagging/dragging method and manually from hosts (humans, domestic, or wild animals). In addition, morphological identification using tick keys was performed. The obtained data were used to create maps and feed models and to predict risk assessments. Collected data reveal the predominant presence of Ixodes ricinus, accounting for (n = 446) or 48.1% of the tick population. Rhipicephalus sanguineus (Ixodida: Ixodidae) follows with (n = 253) or 27.23%, and Hyalomma marginatum represents (n = 136) or 14.64% of the tick species collected using the host method in the region. Tick–host relationships are complex and influenced by a range of ecological and environmental factors. The results of this research will contribute to a better understanding, identification, and prediction of the changes in their geographic ranges and help in the prevention and control of zoonosis transmitted to humans by ticks. The obtained results mapped using GIS support the first study on the spatial distribution of ticks in the region of Istria in Croatia.

1. Introduction

Ticks are parasitic arthropods belonging to the order Acarina (mites), which is part of the class Arachnida (spiders) within the large knee of Arthropoda. They are divided into three families: Ixodidae (ticks or hard ticks); Argasidae (house ticks or soft ticks); and Nuttalliellidae [1]. Ticks are obligate hematophagous ectoparasites of mammals, birds, and reptiles, and some pose significant risks to both animals and humans [2]. Pathogens transmitted by ticks, such as bacteria, viruses, rickettsia, and protozoa, cause most vector-borne diseases, such as tick-borne encephalitis (TBE), anaplasmosis, babesiosis, rickettsiosis, borreliosis, and ehrlichiosis. These diseases are often reported in different regions of Europe [3]. In recent years, the spread of tick-borne diseases has been expanding, posing a potential risk to natural ecosystems [4]. The increased occurrences of some diseases have been highly connected with climate change and human behaviour [5,6]. Therefore, animal reservoirs play an important role in public health and reinforce the urgent need for a global One Health approach to prevent and adequately address many complex problems at the human–animal–environment interface [7]. Ticks that transmit diseases within the Republic of Croatia belong to the Ixodidae family, with a high predominance of the ordinary tick or Ixodes ricinus (Acari: Ixodidae) and the brown dog tick or Rhipicephalus sanguineus (Ixodida: Ixodidae) [8]. They are effective transmitters of pathogenic organisms due to the relatively slow feeding process of the host, which enables them to suck up a large number of pathogenic organisms through the blood. Blood feeding at least once during each development stage allows them to acquire and transmit various tick-borne diseases. Besides the high reproductive potential, they also show high degrees of survival [9]. Ixodes ricinus is commonly known as the castor bean tick or sheep tick. It is widely distributed across Europe and is the most widespread tick species in the Republic of Croatia. Its population is often present in northern parts of Croatia [8]. Its life cycle lasts two to four years, and it undergoes incomplete transformation, which includes four stages (egg, six-legged larva, eight-legged larva, and adult form) [10]. Immature forms are present on small rodents, while adult forms attack larger mammals (sheep, cows, and humans). Ixodes ricinus is known to be the primary vector for several diseases in humans, including Lyme disease (LD) and tick-borne meningoencephalitis (TBM) [11]. It is typically found in wooded areas and grasslands [1]. Rhipicephalus sanguineus (Ixodida: Ixodidae) or the brown dog tick, prevails in the coastal areas of Croatia. However, it also occurs in urban environments, preferring warmer and more humid areas [12]. It is a specific ectoparasite of dogs but can also parasitize other mammals. It is a vector of various diseases, such as canine ehrlichiosis, babesiosis, and Mediterranean spotted fever (MSF) [13]. Hyalomma marginatum (Ixodida: Ixodidae) is a species of tick commonly referred to as the ornate cow tick or the marginate tick. It is known for its distinct ornate appearance and is typically found in grasslands and open habitats [1]. These tick species are associated with the transmission of various diseases, including Crimean–Congo haemorrhagic fever [14].
Understanding the spatial distribution of ticks in a specific region is crucial for assessing the risk of tick-borne diseases. In addition, a well-posed research question can provide insight into the ecological impact of tick populations within Istria County. Examining the spatial distribution of ticks according to gender and developmental stage can reveal patterns in tick life cycles, feeding preferences, and host interactions. This information is valuable for understanding the ecological dynamics of tick–host interactions, potential wildlife impacts, and overall ecosystem health [15]. Previous studies or surveillance efforts may have identified the presence of certain tick species [13] and tick-borne diseases in Istria County [1]. However, the detailed spatial distribution of these tick species and their abundance according to gender and developmental stage might not have been thoroughly investigated. Many European countries lack spatial data on vector distribution and activity. Therefore, due to data gaps, continental-scale mapping is very difficult. Therefore, there is a clear need for better tick surveillance across Europe to improve public and veterinary risk assessments and to ensure better prevention of tick-borne diseases [16]. The geographical information system (GIS) provides perfect tools for modelling the spatial occurrence of zoonosis vectors in space and time, and ticks are ideal examples due to their close ties with the ecosystem [17]. This study was conducted to determine the occurrence of ticks in the region of Istria and their prevalence on humans and different animal hosts, including pets as well as domestic and wild animals. Two different sampling techniques were performed to obtain the relevant information: the combined flagging/dragging method and the collection of specimens from hosts. The main goal was to study the spatial distribution of ticks using GIS and their morphological identification using tick keys within the region of Istria. Landscape pattern analysis, spatial maps, and statistical analysis comprise a powerful set of tools for predicting the future occurrence of tick-borne diseases in Croatia and worldwide.

2. Materials and Methods
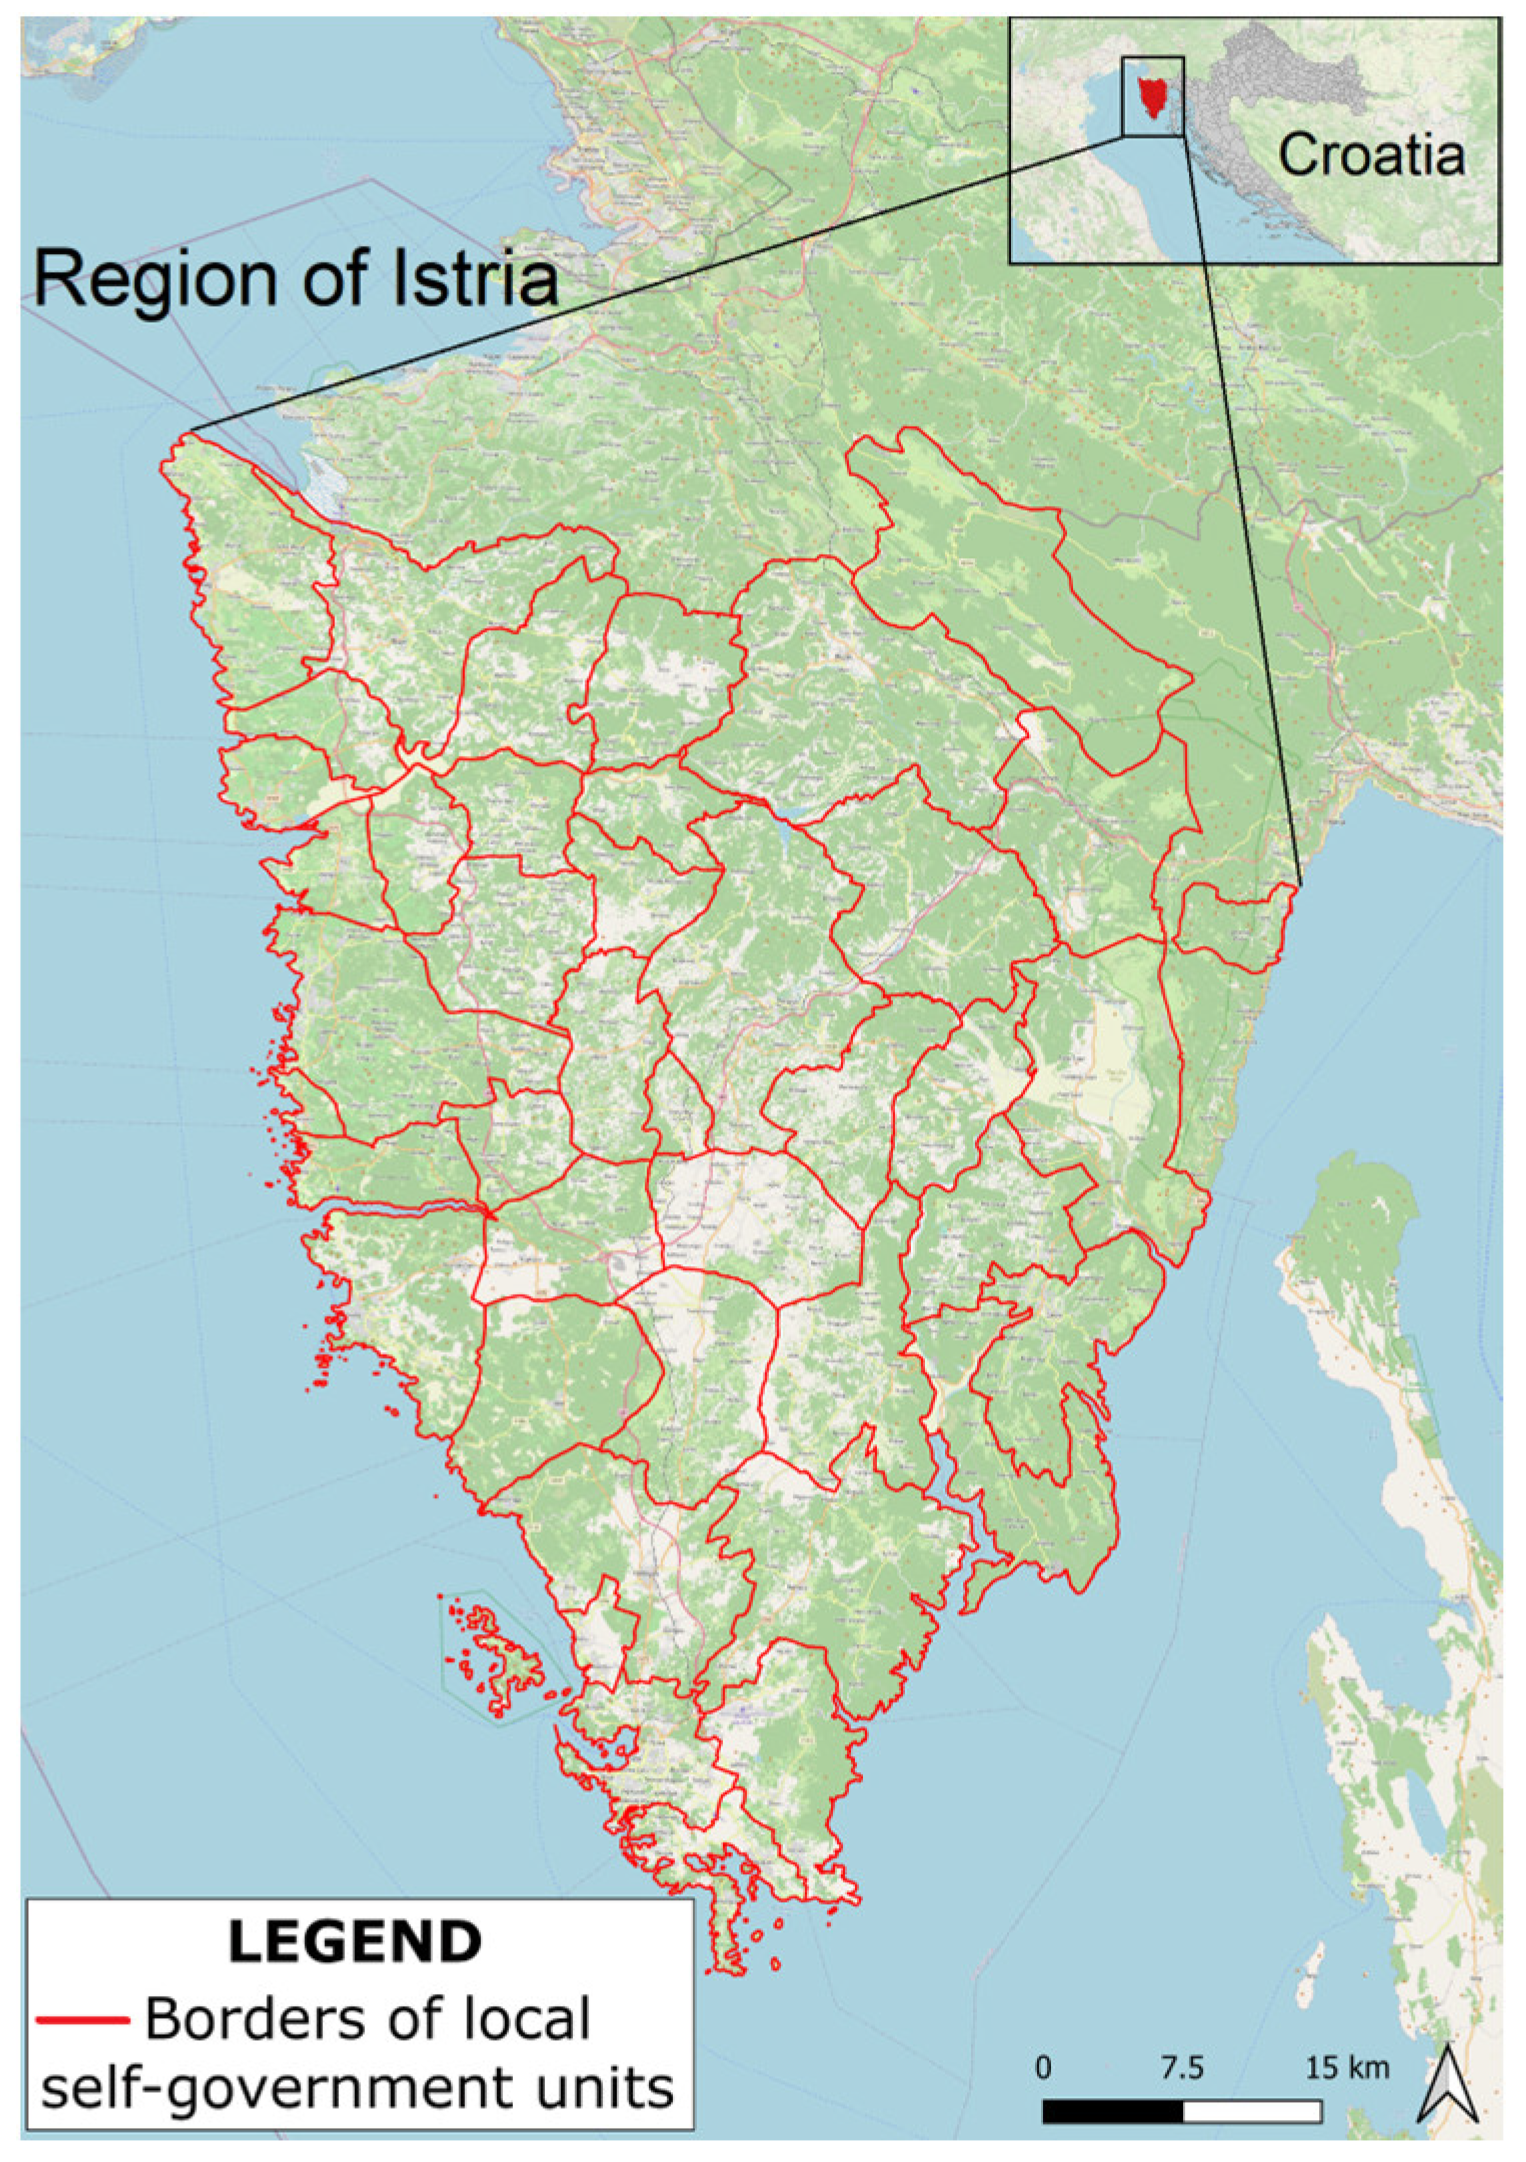
2.1. Study Area

The region of Istria is the largest Adriatic peninsula, located in the most western part of Croatia. It is surrounded by the sea on three sides and a northern border towards the mainland. It is formed by the line between the Bay of Milj (Muggia) in the immediate vicinity of Trieste and the Gulf of Preluka in the immediate vicinity of Rijeka. The area is located between 45°35′ N; 13°43′ E and 45°21′ N; 14°99′ E, and it extends to the south in the shape of a triangle on the Adriatic Sea (44°45′ N; 13°55′ E). (Figure 1). According to the last population census (2021), the region of Istria has a total area of 2813 km2, with 195,237 inhabitants living in 10 cities and 31 municipalities [18]. Along the coast of Istria, the dominant climate is Mediterranean, which, due to the cold air flowing from the mountains and the proximity of the Alps, gradually changes towards the interior and becomes continental. Geographically, Istria is usually divided into three parts: Red Istria (west coast), where red-brown soil predominates; Grey Istria (central Istria) due to the grey clay soil; and White Istria (the slopes of the mountain Učka on the eastern part of the peninsula) because of the stony soil.

2.2. Sampling Procedures

The tick specimens (n = 2218) were collected during a period of three years (2020–2023) and were collected within all 41 self-government units of Istria and Brijuni Islands National Park. An established tick population in any area is usually defined by the annual recurring presence of all active tick stages (larvae, nymphs, and adults) during the months when ticks are usually active. Therefore, some locations, regardless of the sampling method, were repeatedly sampled during this study. The performed sampling techniques were as follows: combined flagging/dragging method and collection of specimens from hosts [19].

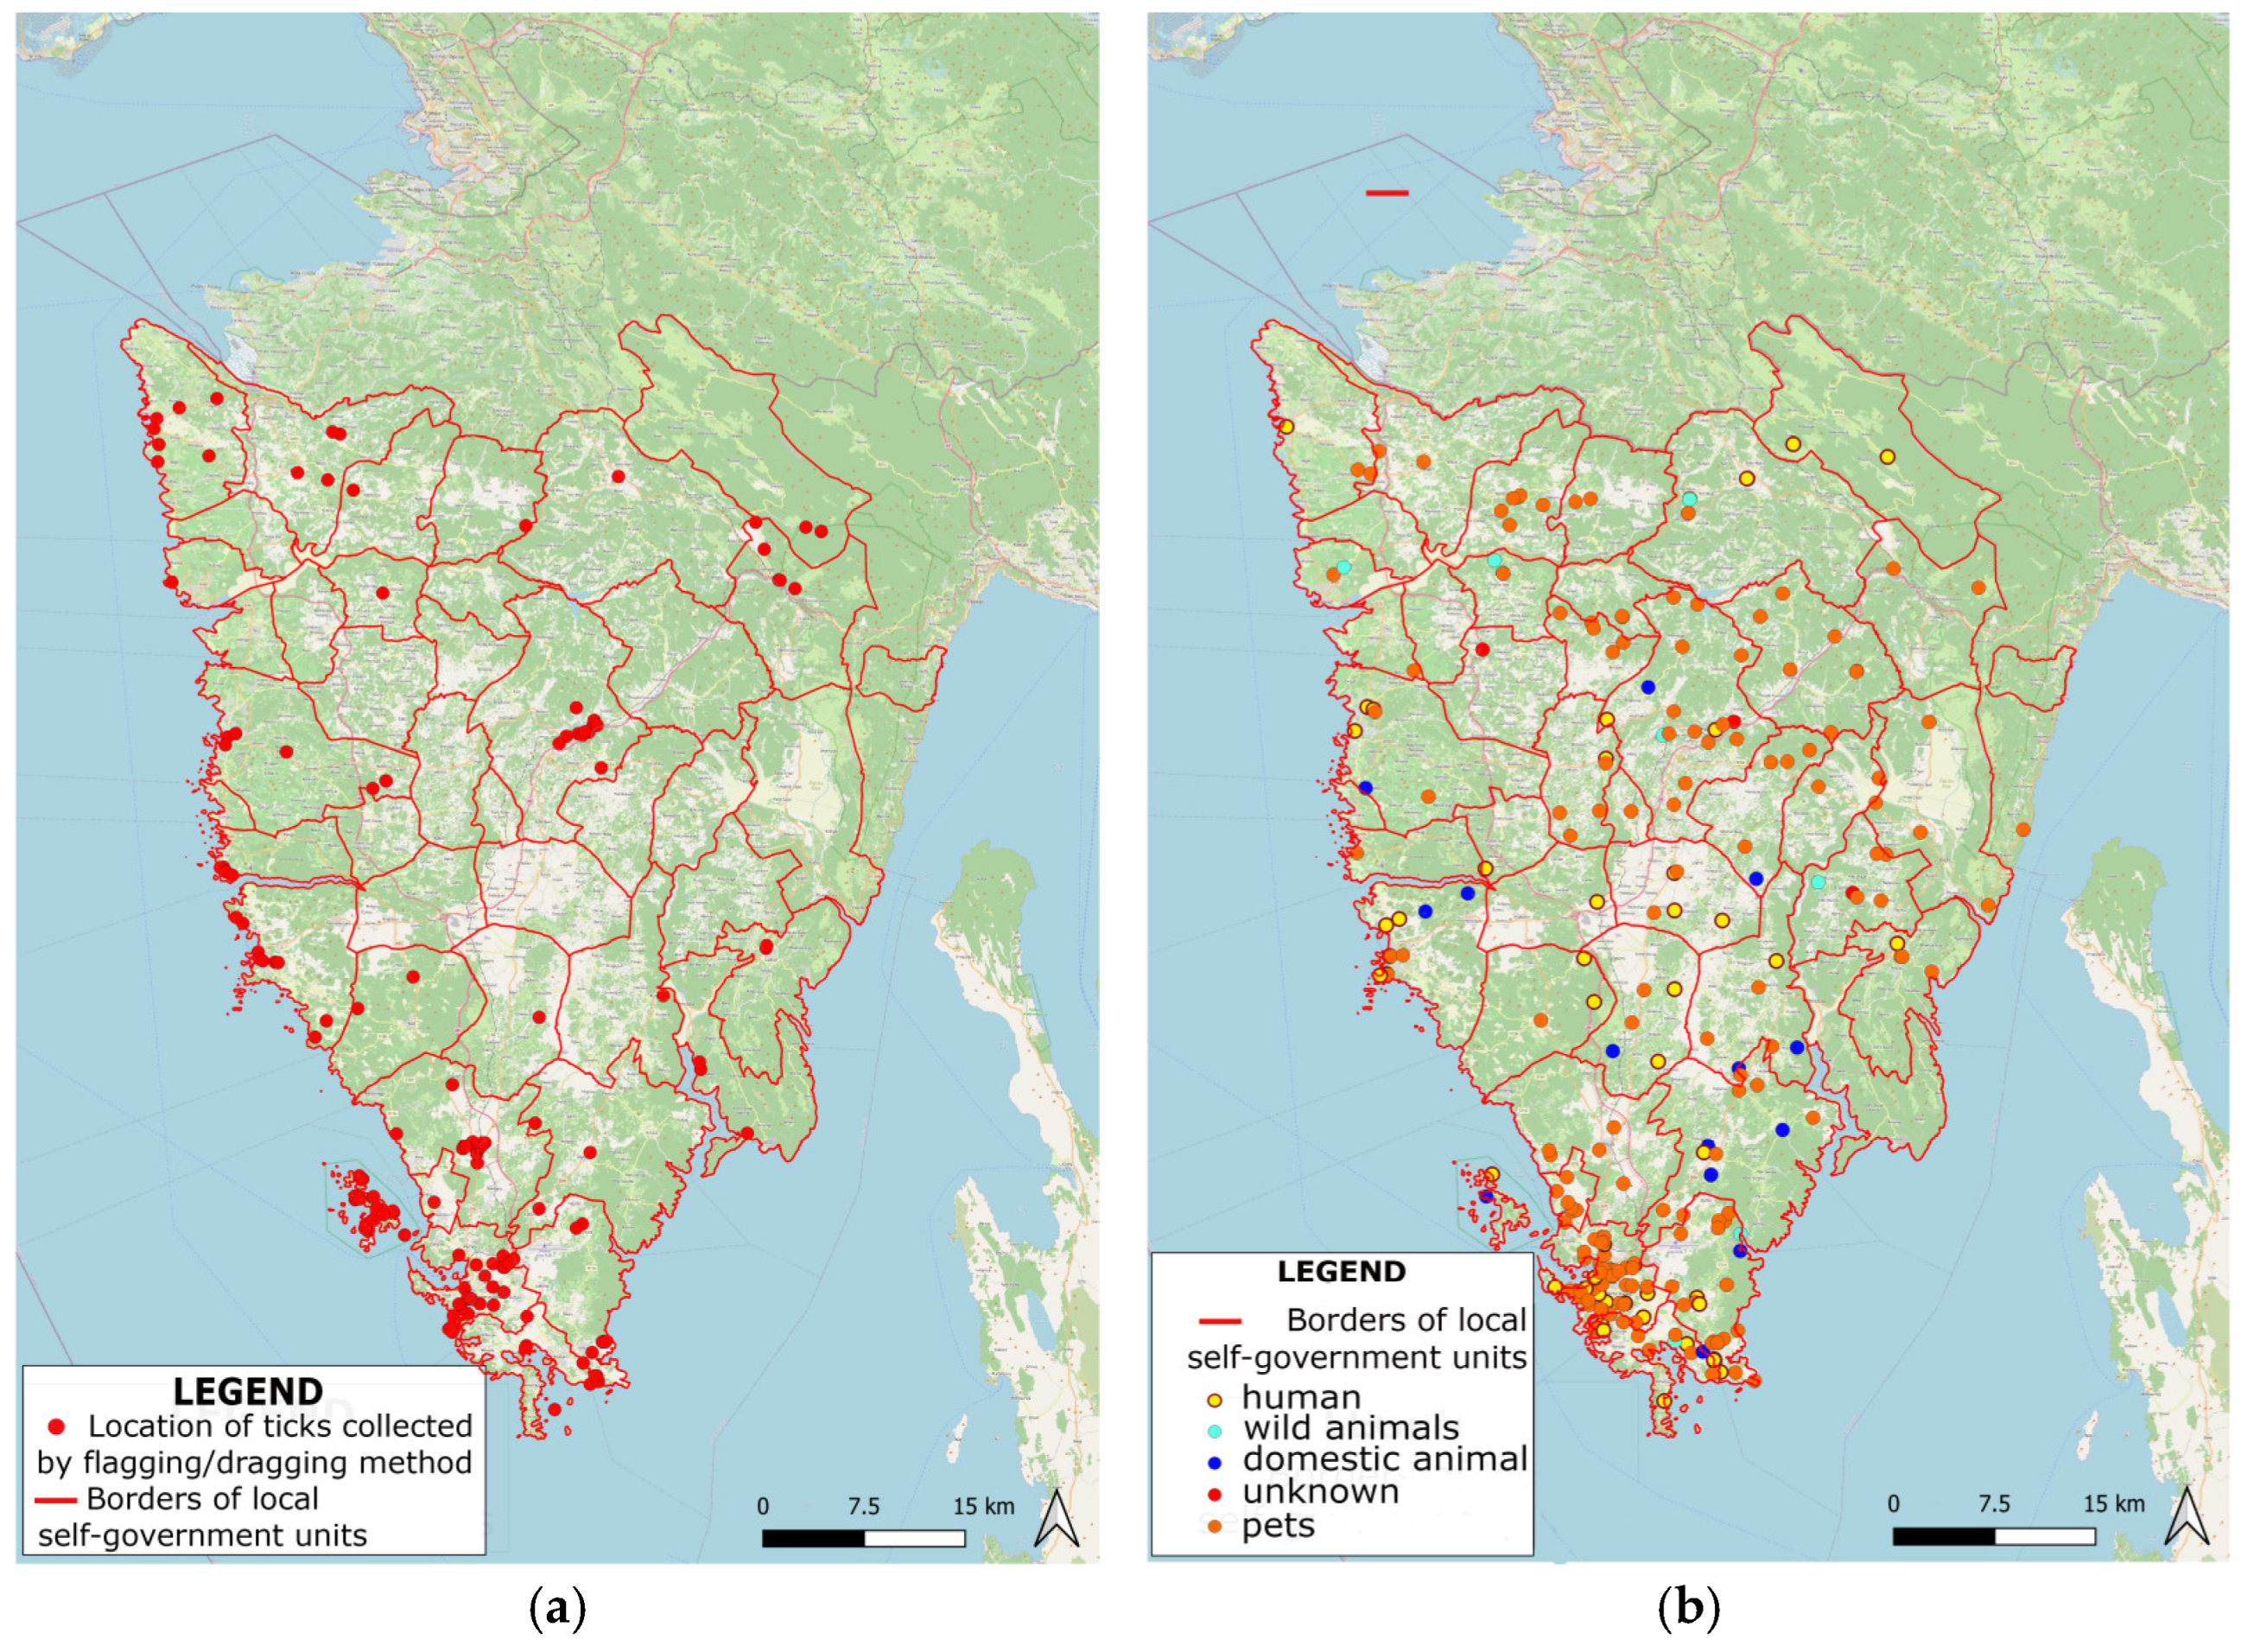
2.2.1. Flagging/Dragging Method

The flagging/dragging method [19] was always performed in the morning and never in the rain. Each sampling flag consisted of a 1 m2 piece of white cotton flannel attached to a 1.5 m wooden dowel. The dowel was used to stir up the leaves, litter, and low vegetation, followed by the pulling of the cotton flannel flag. Different types of habitats were chosen for sampling using this method, including urban parks, recreational areas, picnic areas, uncultivated lands, Brijuni Islands National Park, and forest areas of the region of Istria (total number of habitats: 114). Collected ticks were adequately stored in the polyvinyl-chloride test tubes, carefully marked on the outside, and transported to the laboratory in the shortest possible time via appropriate coordination.

2.2.2. Animal/Human Host Method

In order to comprehensively collect ticks from all parts of Istria and those found in nature, interesting and useful information can also be discovered from ticks found on certain animal hosts. Therefore, cooperation with veterinarians, foresters, cattle breeders, and hunters was established in order to collect ticks from different animals (pets, domestic and wild animals) from their predilection sites (where ticks prefer to feed) [19]. Ticks were also collected from the wild animals at the National Park Brijuni Zoo, where they live freely throughout the island. In addition, through education organized by the Public Health Institute of the region of Istria, citizens were informed about the possibilities of delivering ticks as they are more likely to be exposed during outdoor activities. Ticks were collected using good-quality steel forceps, counted at the site, stored in a clean plastic container, and transported to the laboratory in a temperature-controlled chamber (+4 °C).

2.2.3. Morphological Determination of Hard Ticks
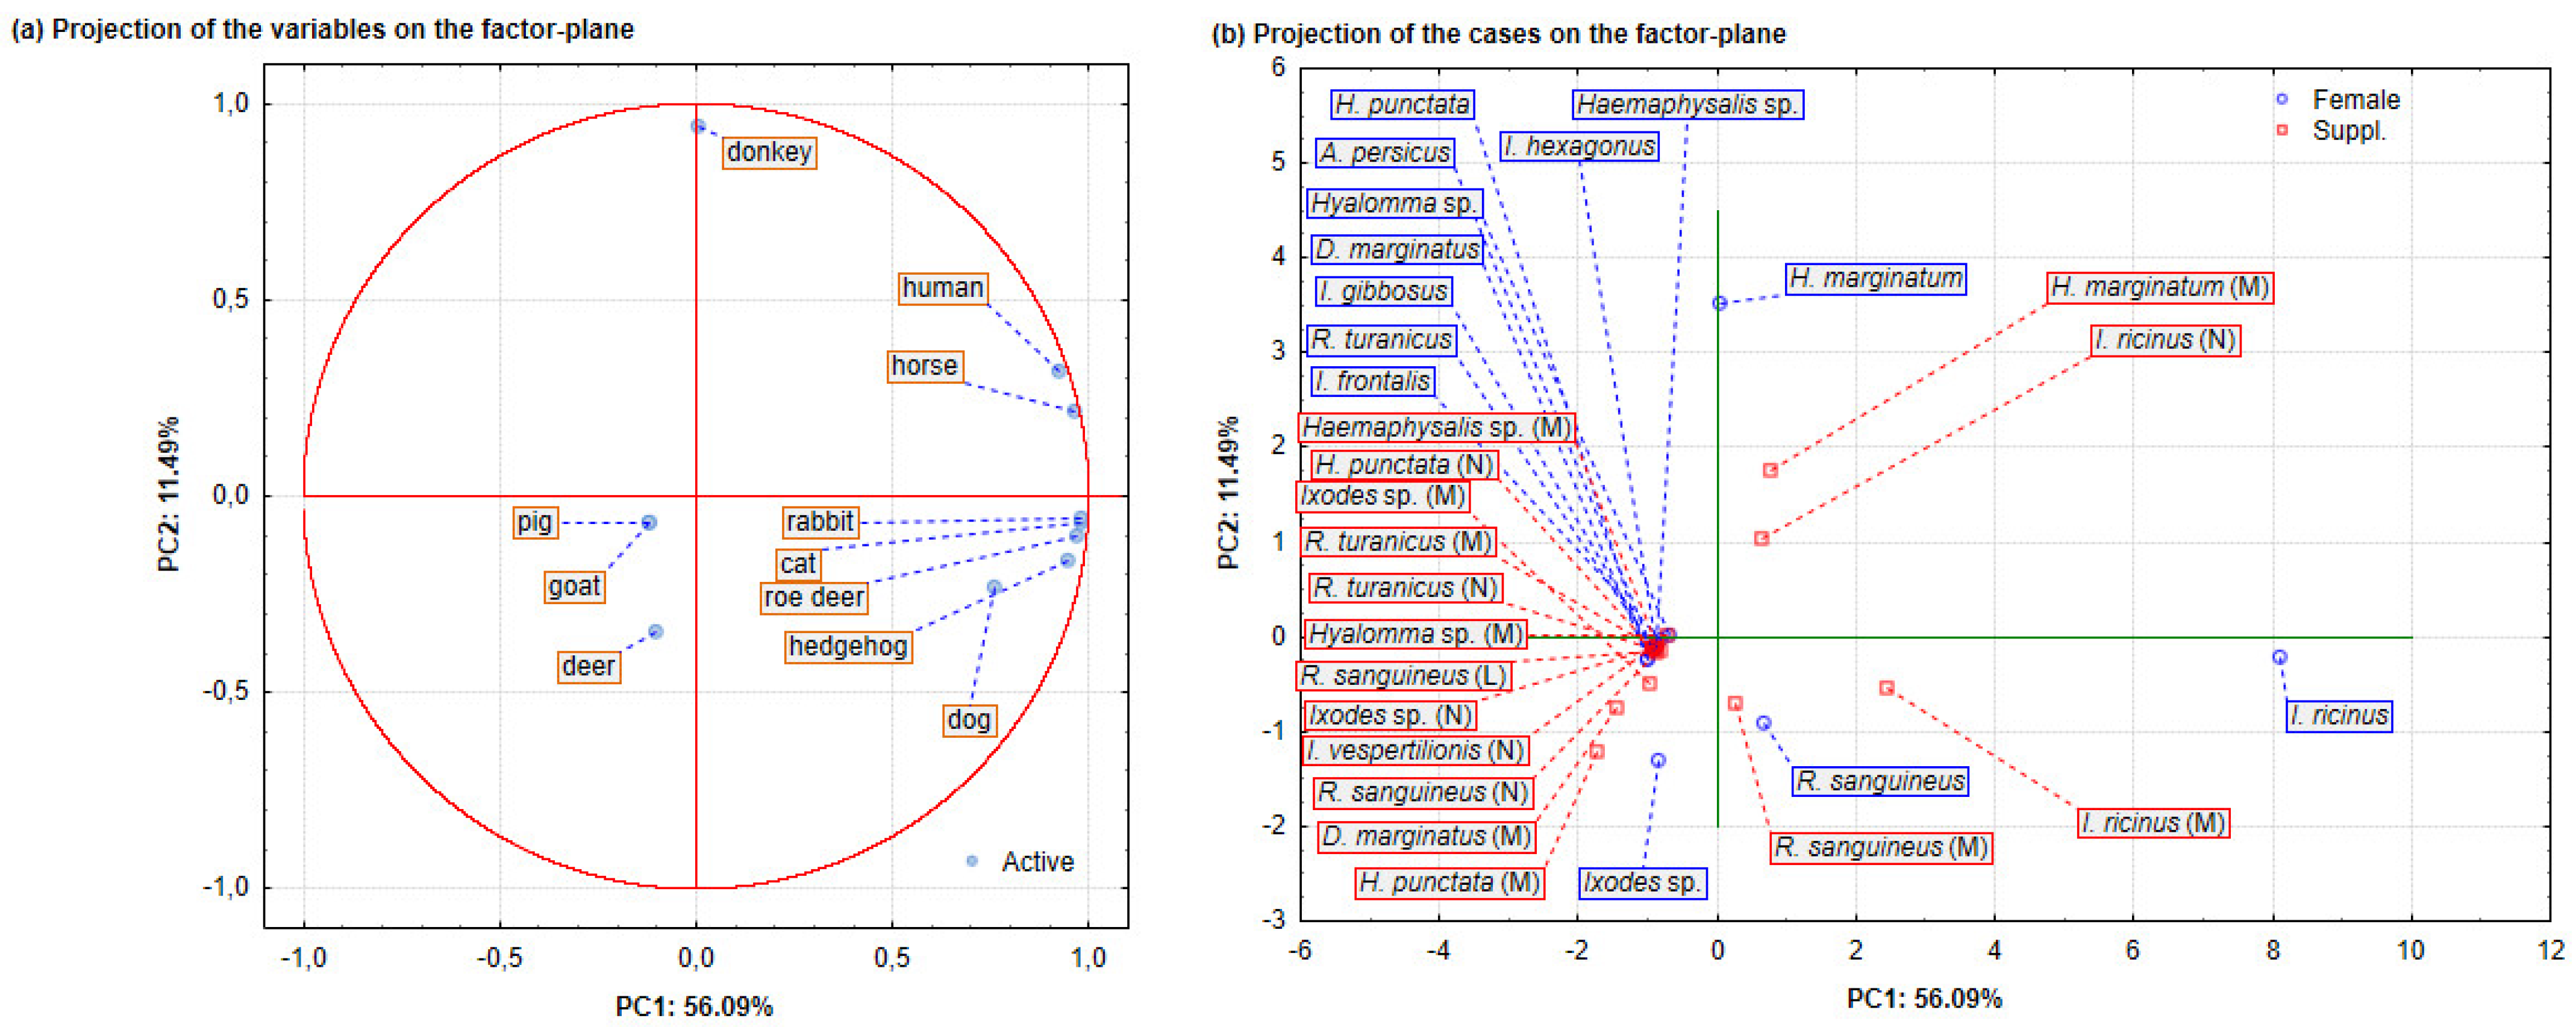
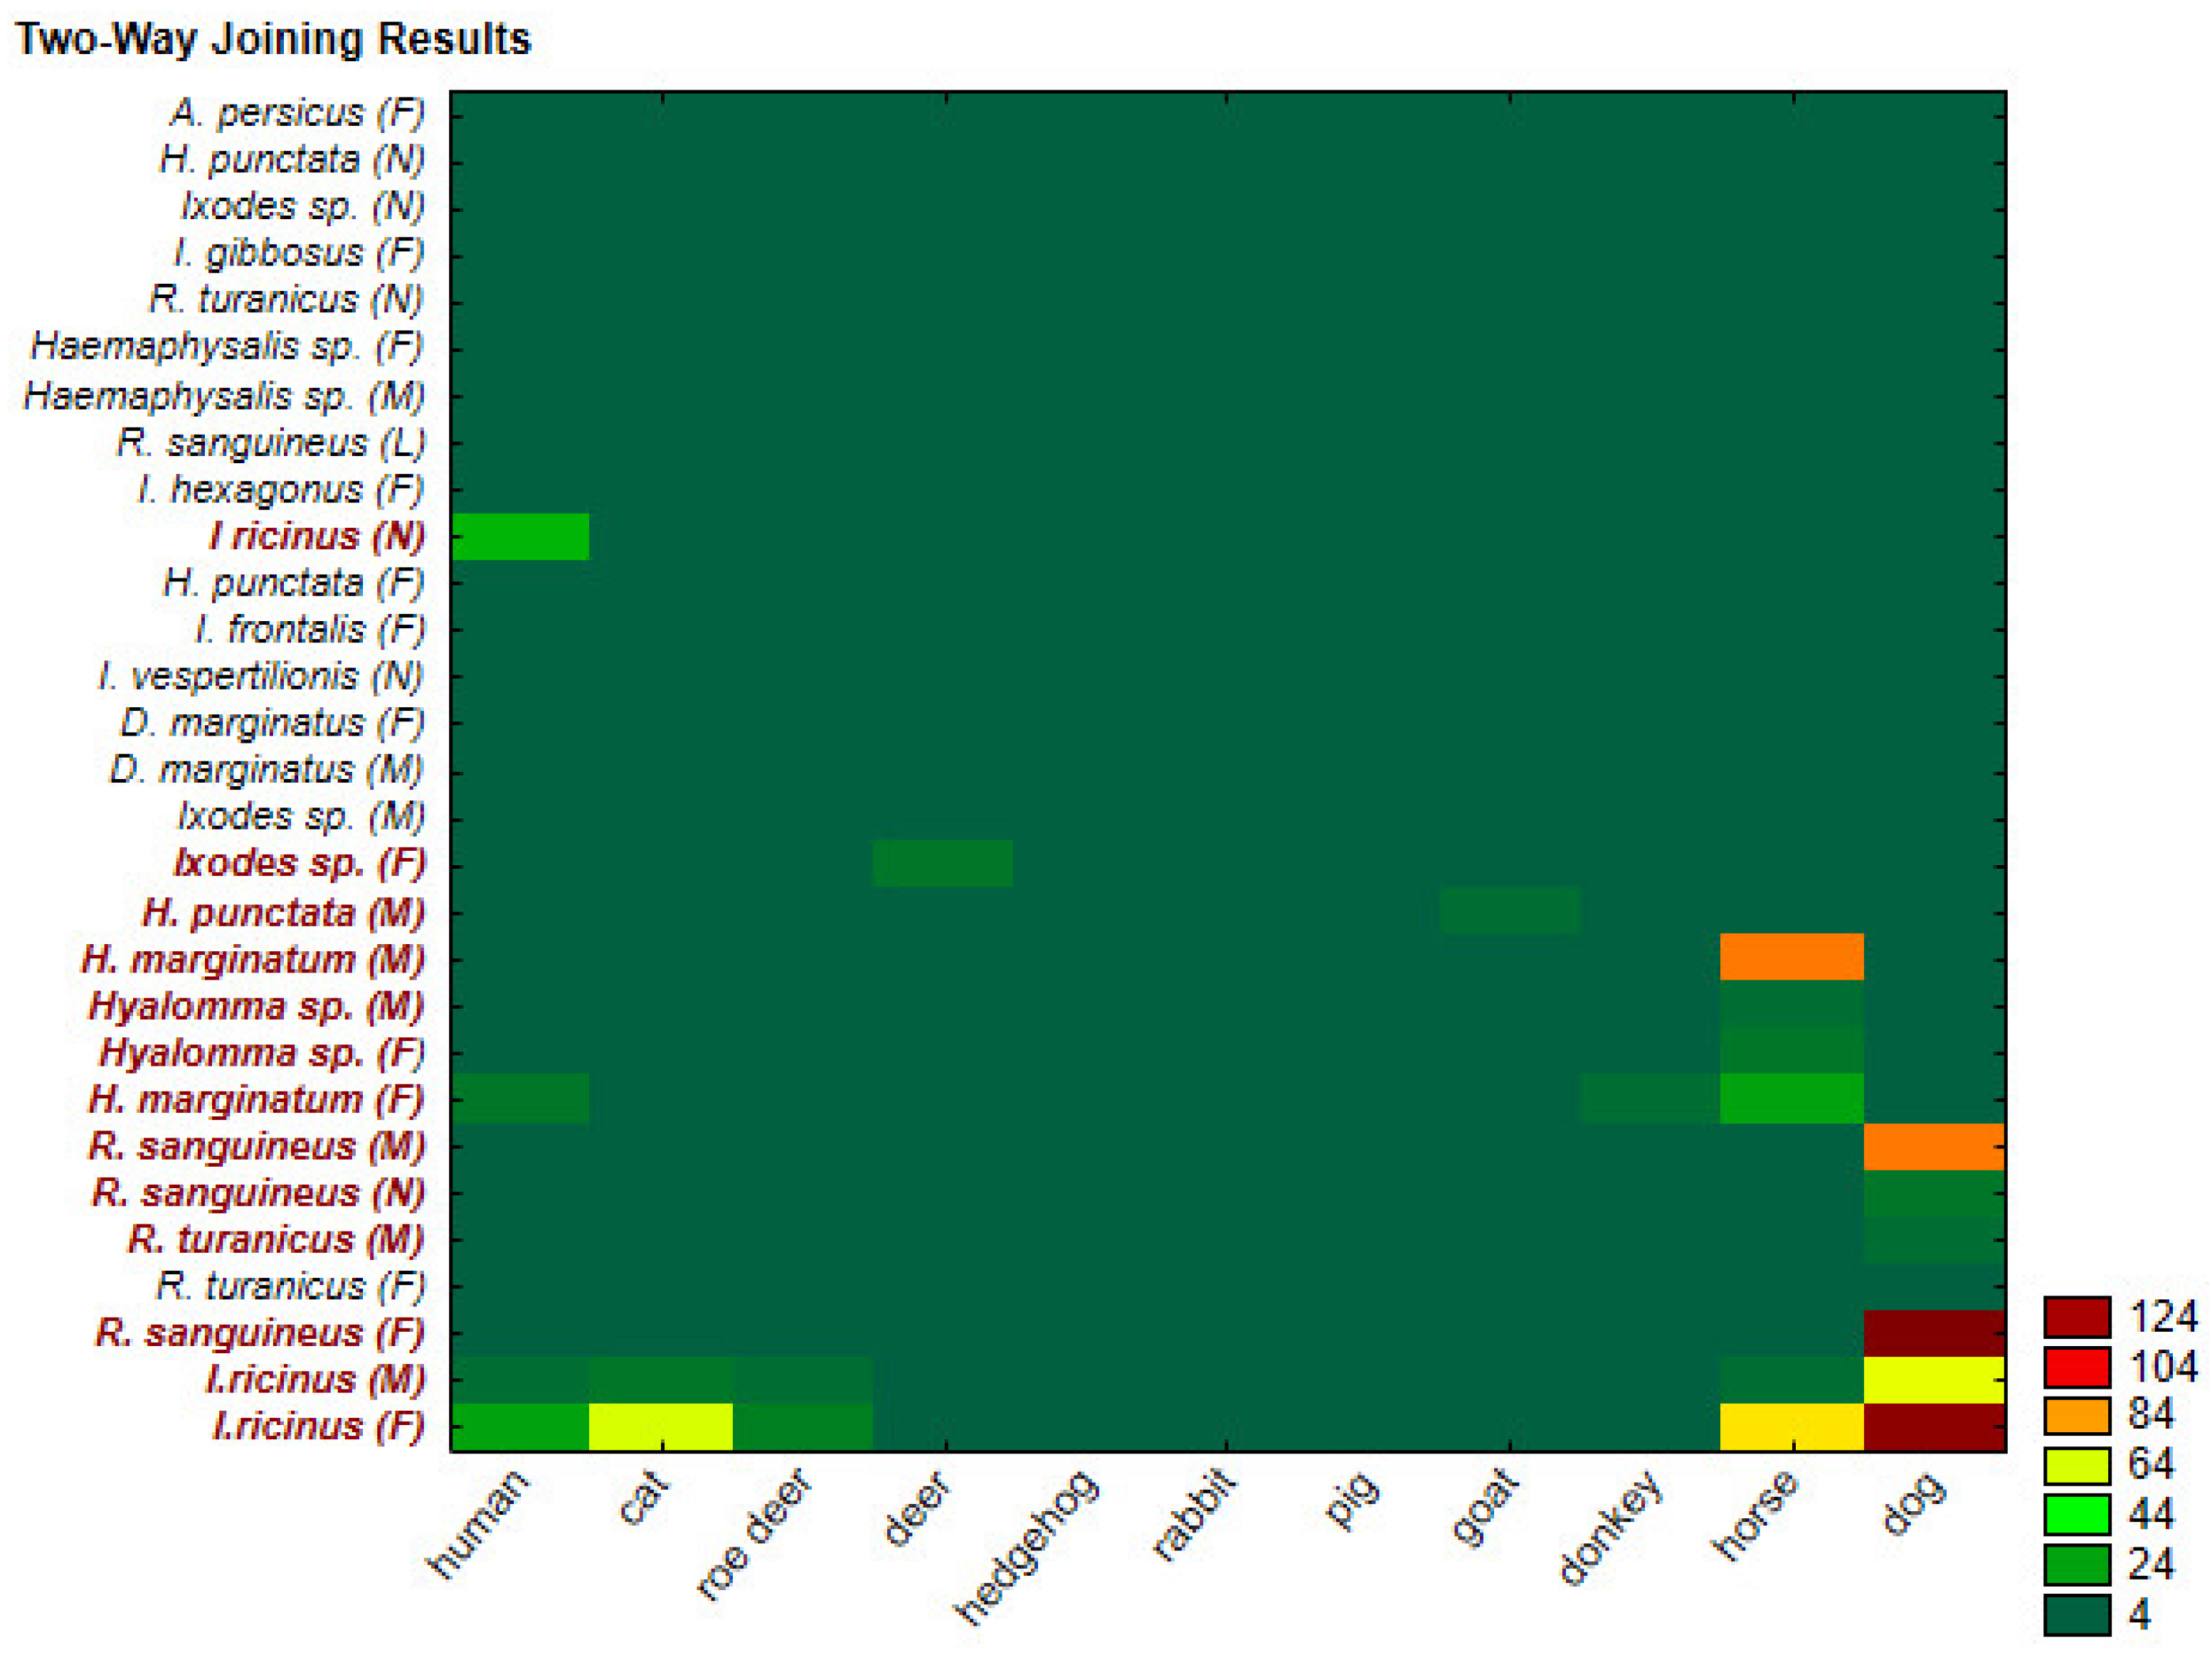
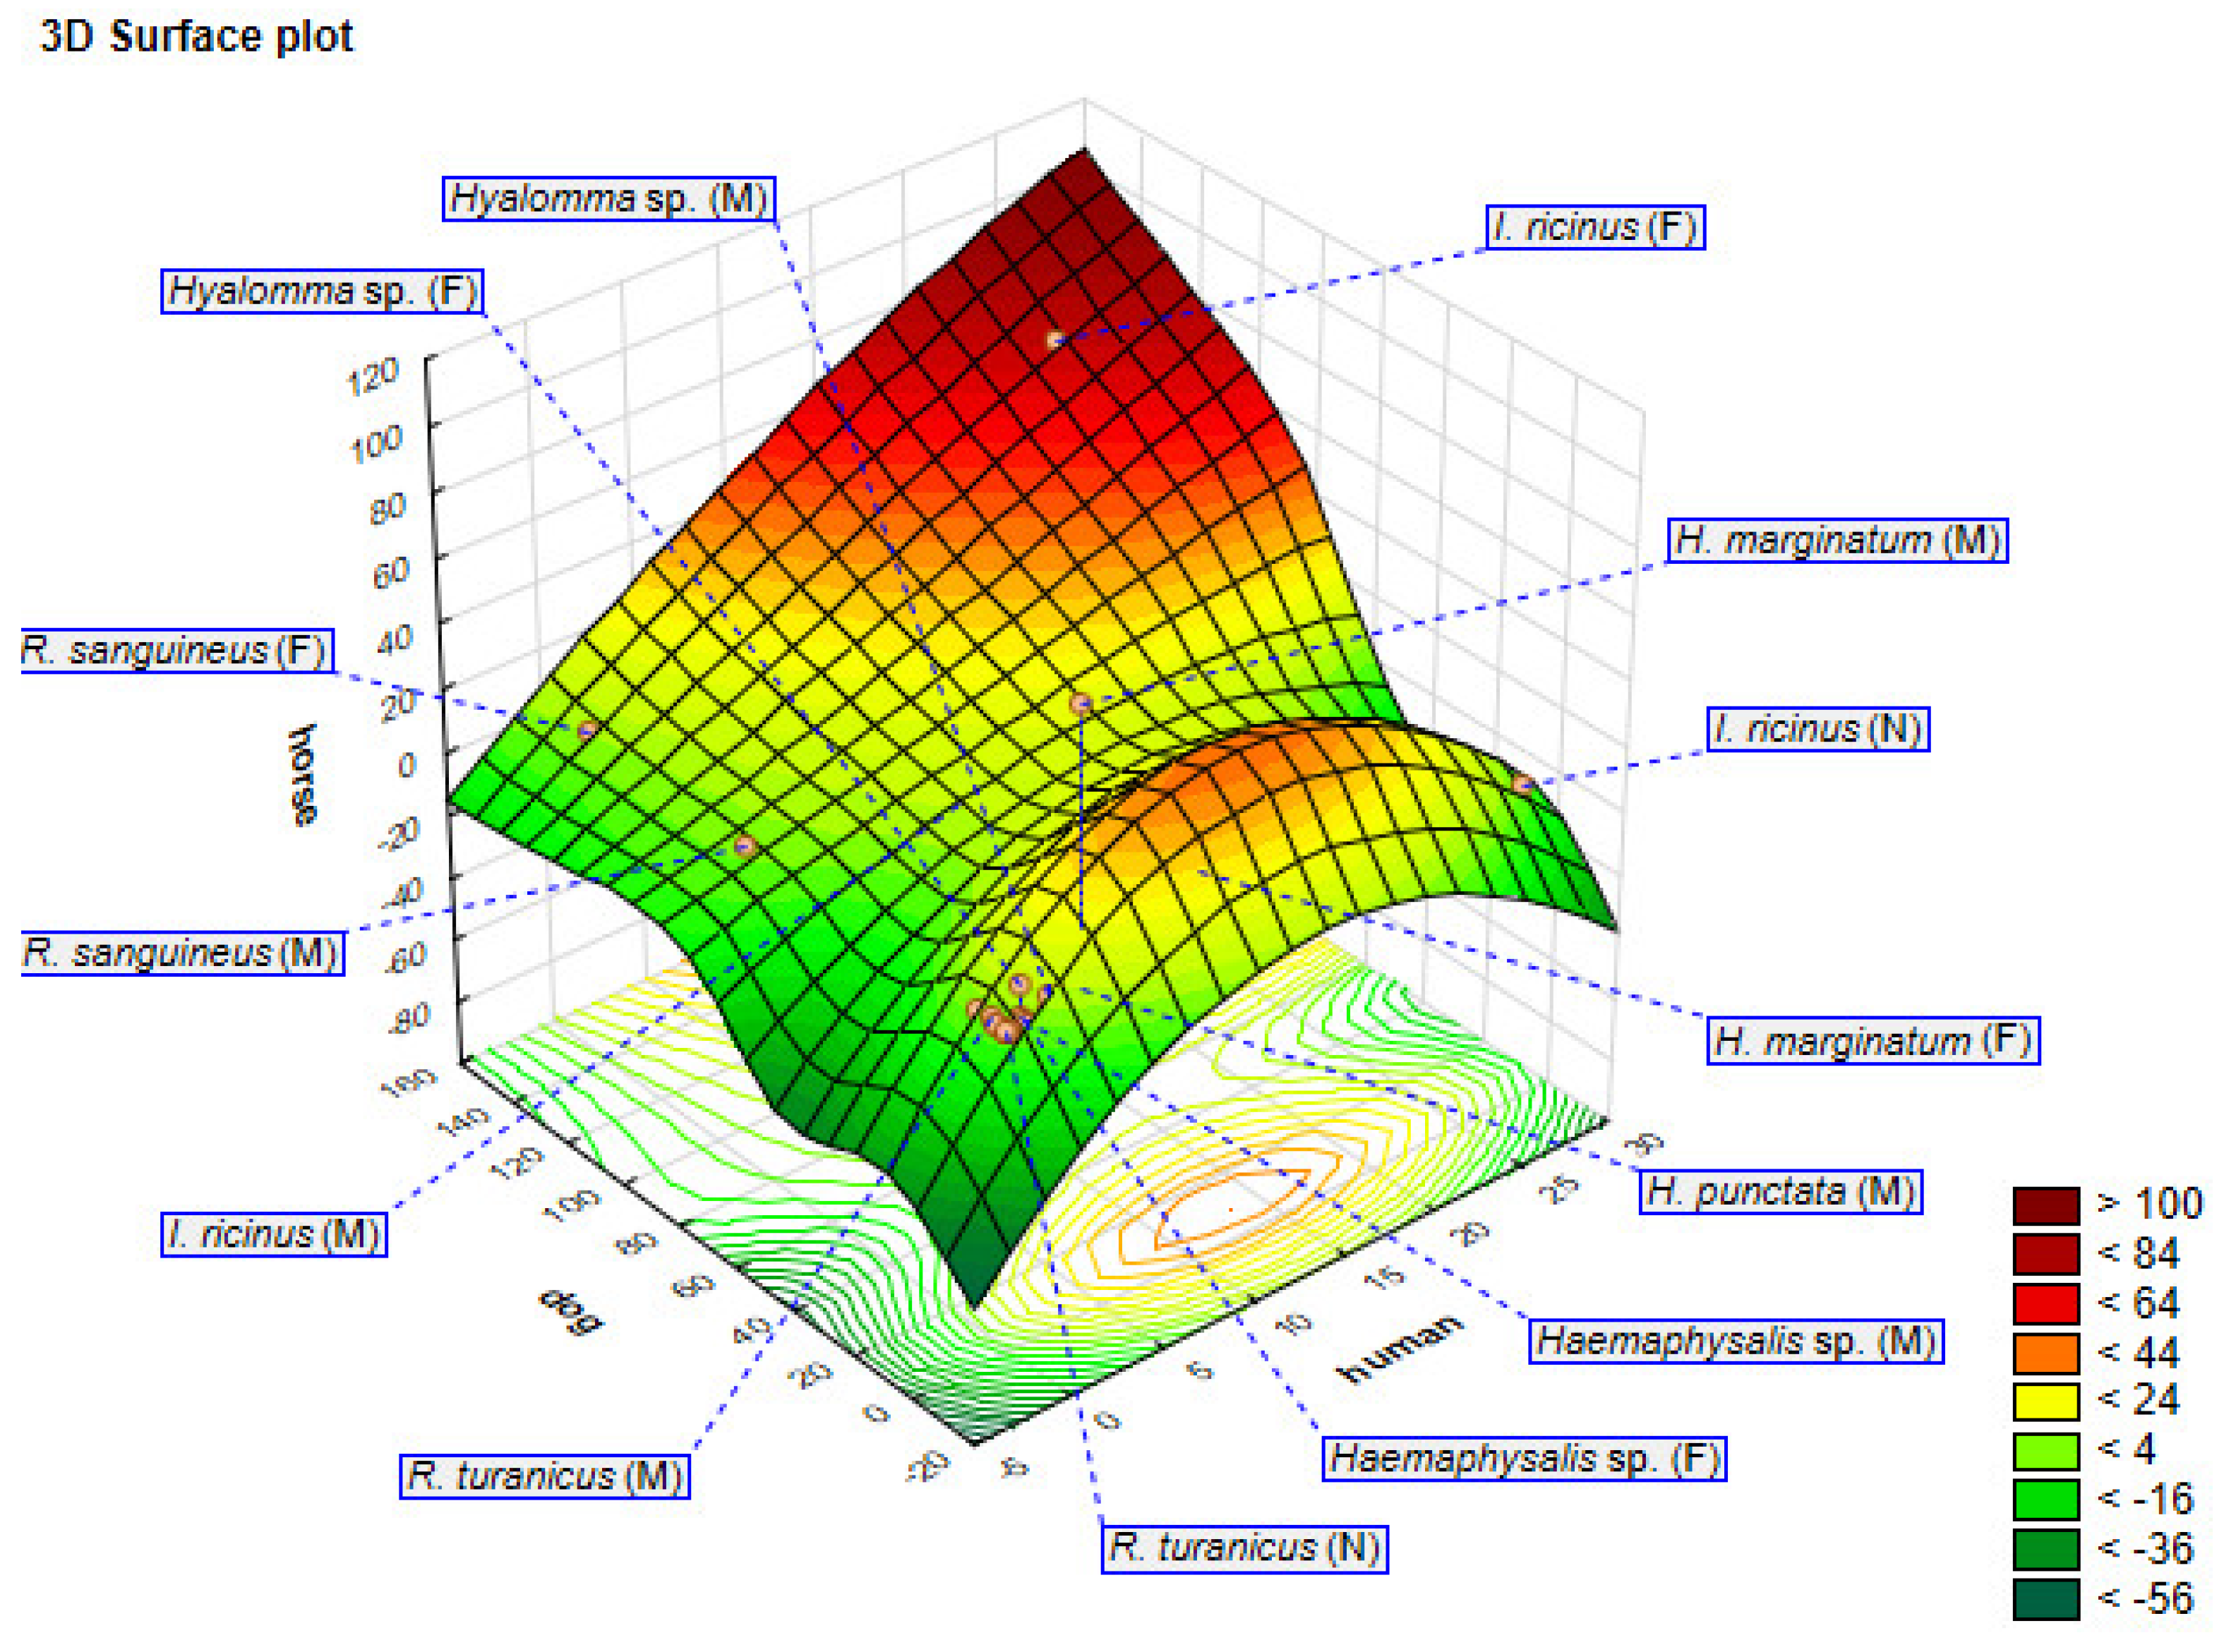
At the laboratory, all specimens were photographed with a digital camera (Olympus SC50, Munster, Germany), followed by determination of gender and developmental stage under a digital magnifying glass (Olympus SZX9, Munster, Germany). All samples were preserved at −80 °C for further analysis. The collected tick samples were determined according to morphological features using the keys for determining tick species [20].

2.3. Data Analysis

To analyse the distribution of tick species collected from different hosts according to gender and developmental stage, the principal component analysis (PCA) method was used [21]. The PCA was performed using software package Statistica® v. 14.0 (StatSoft Inc., Tulsa, OK, USA) at a significance level of p < 0.05. For the spatial distribution of ticks, QGIS version 3 software (QGIS, Gossao, Switzerland) was used.

3. Results and Discussion

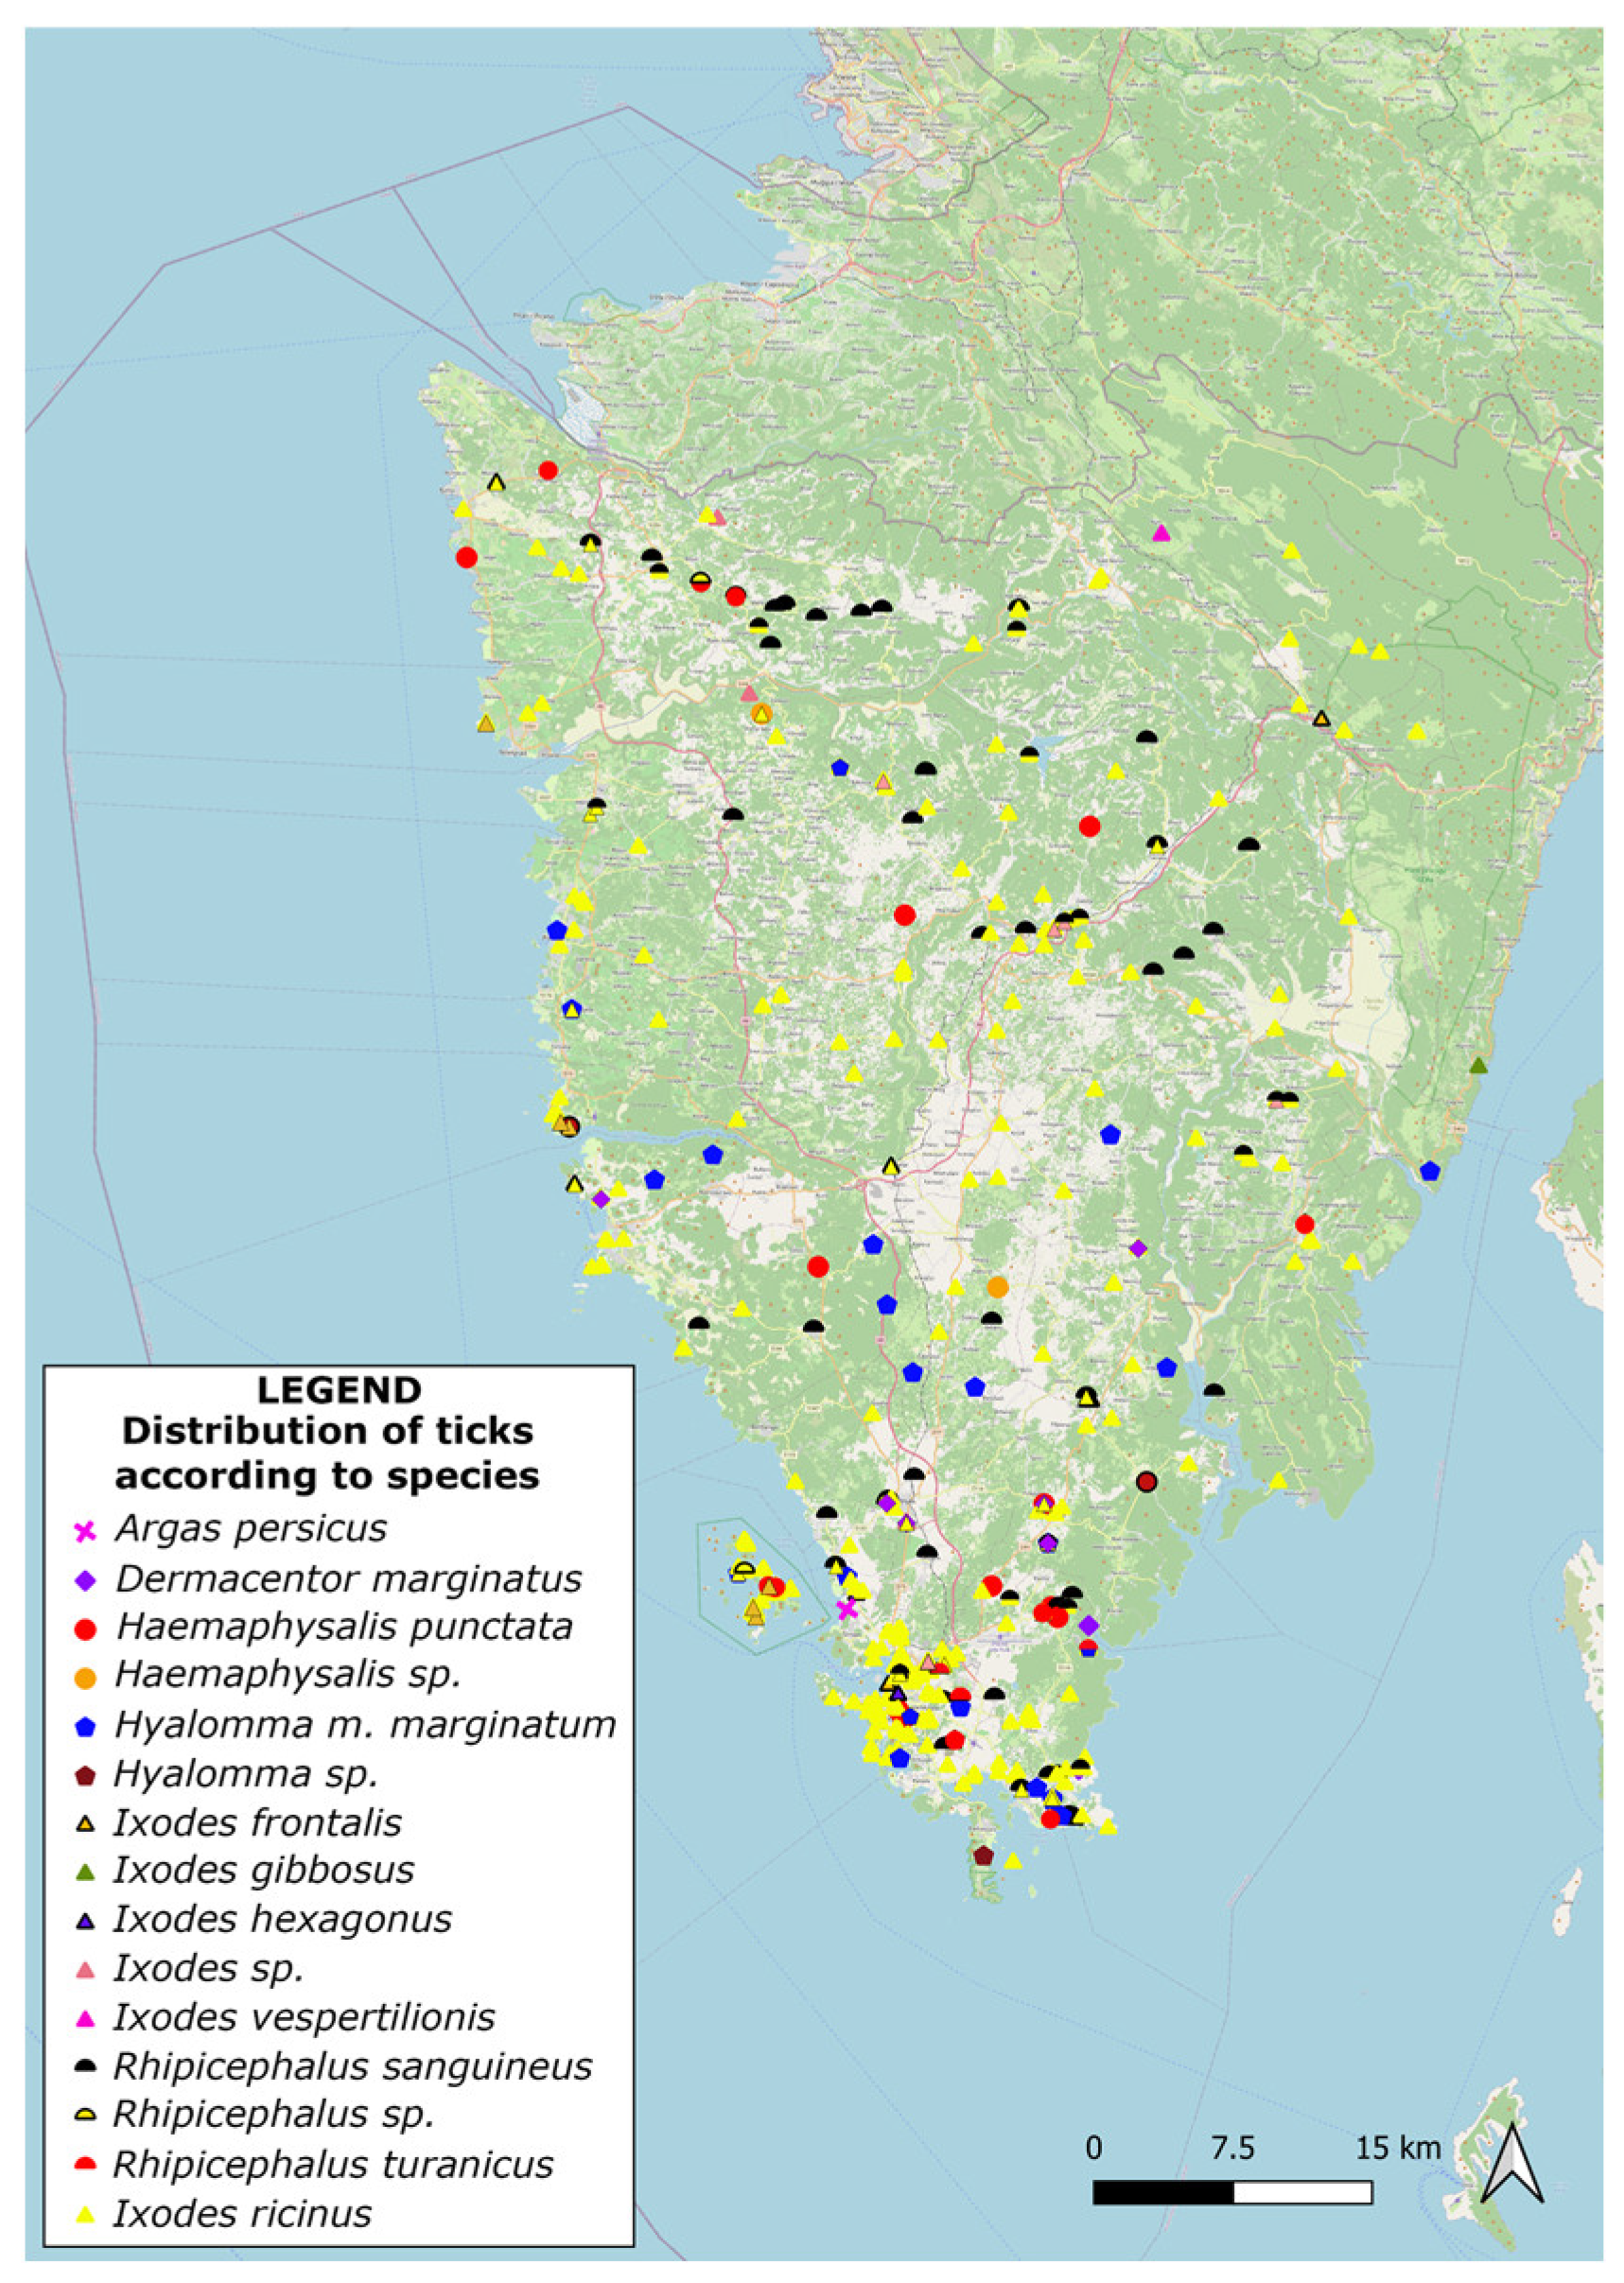
Spatial Distribution and Morphological Identification of Hart Ticks

The total number of ticks collected via both sampling methods is presented in Table 1.
Furthermore, GIS mapping was used to visualize the distribution of ticks collected with the flagging/dragging method across the region of Istria (Figure 2a). With this method, a total of 1289 ticks were collected at 116 locations, while at 41 locations, ticks were not found. Data presented using GIS also allow for the integration of tick distribution with other relevant spatial datasets, such as human population density, land use, or animal host distribution. Therefore, besides the mentioned collecting method, ticks collected using the animal/human host method are presented in Figure 2b.
Map representation via GIS allows for the visualization of the spatial distribution of the collected ticks. By georeferencing the sampling locations and overlaying them as tick abundance data, GIS can generate thematic maps that clearly and intuitively illustrate the distribution patterns. These visual representations enable the identification of hotspots, areas of high tick density, and spatial variations across the study area. Spatial analysis can reveal patterns and relationships between tick distribution and environmental factors such as land cover, vegetation type, climate data, or topography [17]. By using this mapping method, public health authorities and vector control agencies can focus their efforts on implementing interventions, such as targeted pesticide applications, public awareness campaigns, or habitat modifications in specific areas [22]. This integrated analysis can offer insights into the potential risk factors of tick-borne diseases and help prioritize surveillance efforts. Advances in mapping via GIS, with concluded progress in spatial and space–time modelling, also provided other investigations conducted in Iran and Colorado, USA, showing new opportunities to prevent and control emerging vector-borne diseases [23,24]. All collected ticks were subsequently identified to the species level and categorized according to gender or developmental stage (e.g., larvae, nymphs, and adults). The determined tick species collected using the flagging/dragging method are presented in Table 2.
Each species was identified using special identification keys, and tick samples that could not be determined to the species level were determined to the genus level. The presence of multiple tick species indicates the diversity of ticks in the study area. It is very important to mention that tick populations often consist of males and females, with potential differences in behaviour, feeding preferences, and disease transmission. Therefore, gender distribution data can help assess the relative abundance of males and females within each tick species, providing insights into the tick population dynamics [25]. Moreover, understanding gender distribution can provide insights into reproductive activity, such as the potential for tick population growth and expansion. Furthermore, collected data can also be valuable for studying mating behaviours and interactions between male and female ticks within a species [26]. The developmental stage distribution data can indicate the relative abundance of each stage within each tick species and may provide insights into the seasonal activity patterns and host preferences of a particular tick species known to primarily transmit diseases during specific developmental stages (e.g., nymph stage) [11]. The data on the distribution of tick species collected using the dragging/flagging method indicate that this sampling technique effectively captures a representative sample of the tick population in the region of Istria. Valuable information for researchers and public health authorities can be used to understand the local tick ecology and the associated risks of tick-borne diseases. Mapped information on the spatial distribution of different tick species abundance within the region of Istria is presented in Figure 3.
As ticks are living organisms with particular environmental requirements depending on their species, understanding their global distribution often requires using species statistical models [27,28].
Therefore, the distribution of tick species according to gender and developmental stage collected using different host methods was analysed via principal component analysis (PCA) (n = 929). Cattell’s scree test was used to determine the number of principal components (PCs) to be retained in the analysis. The results of the PCA analysis are presented as projections of the variables (hosts) and cases (active case variable: gender/development; labelling variable: tick species) on the factor plane. According to the mentioned test, four main components (PC1, PC2, PC3, and PC4) were retained in the analysis, which explains 87.38% of the total variance. The PC1 explains 56.09% of the total variance, the PC2 explains 11.49%, the PC3 explains 9.94%, and the PC4 explains 9.85%. Figure 4a shows the distribution of tick species according to gender and developmental stage collected using different host methods represented via principal component analysis (PCA) (n = 929) with two main components (PC1 and PC2). Most of the analysed variables (of human, horse, rabbit, cat, roe deer, hedgehog, and dog) are located in the first and second quadrants and define the positive side of the main component PC1 (right side of PC1), while variables (of pig, goat, and deer) are distributed in the fourth quadrant and define the negative side of the principal component PC1 (left side of PC1). The variable donkey is located exactly at the transition from the second to the third quadrant. In order to clarify the involvement of individual variables in the definition of the principal components model, the following parameters were used: associated eigenvectors corresponding to values of the variables (Figure 4a and Table 3) and the variable importance (Table 3).
Analysing the eigenvector values, it is evident that seven variables define the main component PC1 (Table 3). The variables human (0.37), dog (0.31), cat (0.42), hedgehog (0.38), rabbit (0.44), roe deer (0.39), and horse (0.39) show a positive effect in the definition of the component PC1. The variable donkey defines the main component PC2 with a positive correlation intensity (0.84). In the definition of the PC3, only the variable deer (0.76) is present. Component PC4 is defined by a positive effect of the variable goat (0.71) and a negative effect of the variable pig (−0.71).
Similar behaviour in the definition of the main components as eigenvectors was also obtained using the analysis of the corresponding values for individual variables (Table 3).
It was noticeable that the dominant role in the model definition has the variables cat (0.16), rabbit (0.16), and horse (0.15), while the variable dog is the variable that contributes the least (0.09). In the definition of PC2, the variable donkey (0.70) is of significant importance, while the variable deer defines PC3 (0.58), and the same importance in the definition of PC4 is shown with goats and pigs (0.50). Factor scores based on correlations (tick species) represented via PCA (n = 929) are shown in Figure 4b and Table 4. The active case variable of gender/development and the labelling variable of tick species were used, while the code of the active cases was female (F). Analysing these results presented on the PC1 and PC2 principal components graph, it is evident that the tick species Ixodes ricinus (Acari: Ixodidae) (F, M, and N), Rhiphycephalus sanguineus (Ixodida: Ixodidae) (F and M), and Hyalomma marginatum (Ixodida: Ixodidae) (M) are distributed on the right of PC1. Furthermore, the Ixodes ricinus (Acari: Ixodidae) (F) is placed in the first quadrant of the factor plane together with the variables rabbit, cat, roe deer, and hedgehog, leading to the assumption that this tick species was dominant among these hosts. In the same quadrant, there are also the tick species Ixodes ricinus (M) and Rhiphycephalus sanguineus (Ixodida: Ixodidae) (M and F), which are the most abundant tick species found on dogs. Likewise, on the right side of the factor plane, but in the second quadrant, are Ixodes ricinus (N) and Hyalomma marginatum (M) together with the variables human and horse, which leads to the conclusion that the mentioned tick species are present in higher numbers in these hosts.
The tick species Hyalomma marginatum (Ixodida: Ixodidae) (F) is located in the transition area of the left and right sides of the factor plane, where the presence of variable donkey was observed, which indicates that this tick is the most abundant in this host. On the left side of the main component PC1, in the fourth quadrant, are the species Ixodes sp. (M and F), Haemaphysalis punctata, and Dermacentor marginatus (Ixodida: Ixodidae). Ixodes sp. (M and F) is the dominant species on deer, while Haemaphysalis punctata (Ixodida: Ixodidae) and Dermacentor marginatus (Ixodida: Ixodidae) prevailed on goats and pigs, respectively. As stated previously, the dominant role in the definition of PC1 is shown by the active case variables (Table 3) horse (0.44) and cat (0.42), where the most common tick species (and labelling variable) was Ixodes ricinus (F and M) with factor scores of 3.26 and 0.98, respectively (Table 4). The species with a factor score of 3.13, which is the most intense in the PC2 definition, is Hyalomma marginatum (F), which is the dominant tick species in donkeys (0.84). The contribution of variable deer in the definition of the PC3 is also evident and amounts to 0.76, where Ixodes sp. was found to be the most intense tick species (factor score of 2.65). The tick species Haemaphysalis punctata (M) and Dermacentor marginatus (M), with factor scores of 14.70 and 7.35, define PC3, and they were the predominant tick species on goats and pigs, with variable contributions of 0.71 and −0.71, respectively.
The relationships between individual tick species and their hosts were also analysed using cluster two-way joining analysis, and the results are shown in Figure 5.
In the graph, the dependence of tick species (y-axis) and hosts (x-axis) with different colours, from dark green to dark brown, are shown. Certain numerical values within 4 and 124 correspond to specific colours. Our analysis enables the grouping or clustering of data to be displayed simultaneously rather than successively in rows and columns. The most important advantage of such a simultaneous approach is that it is possible to determine the connections between two sets of data. The main goal of the clustering method is data reduction with a minimal loss of information. Categorical predictor/criterion data were used as the target information, which consists of the number of interactions, which is implied by predicting the data input based on categorical row (tick host) and column (tick species) variables. The model is based on the use of correlation analysis of 29 (tick species) × 11 (hosts) dependencies according to the data matrix of the situation obtained from the analysis of the tick species identification of an individual host. The results are presented graphically in a “heat map”. The analysis reveals strong associations of the host dog (cluster of 11 rows) with the tick species Ixodes ricinus (F) and Rhiphycephalus sanguineus (F) (first and third cluster of the column), with a score of 124. Furthermore, strong clusters are observed between the host dog (cluster of 11 rows) and the tick species Rhiphycephalus sanguineus (M) (seventh cluster of the column) as well as between the host horse (cluster of 10 rows) and the tick species Hyalomma marginatum (M) (11th cluster of the column) with a score of 84. The remaining clusters had weaker associations. Therefore, they were not explained in more detail.
In addition, the dependence of the most represented tick species on three hosts (human, dog, and horse) is shown as a three-dimensional (3D) surface plot obtained using PCA (Figure 6).
Three-dimensional surface and contour plots represent a response surface with one or more simple maxima. The x-, y-, and z-axes of the plot represent hosts (dog, horse, and human) with the responses between the tick host and tick species shown in different colours that range from lighter to darker, along with the numerical values of the responses (from <–56 to >100). With higher response values, the dependence also increases. Based on the obtained response, it can be concluded that Ixodes ricinus (F) is the most represented tick species on the analysed hosts because the data are grouped in the dark-coloured area (from 84 to 100), representing the maximum values on the 3D surface plot. Combining these datasets, statistical analyses, and spatial distributions via GIS, the results provide a comprehensive understanding of the complex interactions between ticks, hosts, and the environment.
As ticks can feed on many different animals, every species has a unique reservoir competence and ability to carry and transmit pathogens. Therefore, the presence of different food sources might affect disease incidences [29,30]. Furthermore, it is reasonable to assume that if certain types of ticks are present on specific hosts, the possibility of pathogen transmission and the occurrence of a specific disease is greater [31]. Tick–host relationships are influenced by a variety of ecological and environmental factors [32]. Understanding these factors is crucial for comprehending the dynamics of tick populations, their interactions with hosts, and the transmission of tick-borne diseases. Some potential ecological and environmental factors that can influence tick–host relationships are vegetation and habitat types, climate and temperature, host availability and abundance, land use, and human activities [33,34,35]. Tick–host relationships are complex and influenced by a wide range of ecological and environmental factors [36]. For future generations, there is an important goal to achieve an understanding of the mechanisms used by tick-borne pathogens to persist in natural systems for a long time. Furthermore, it is important to study the significance of the non-systemic transmission of infections through co-feeding ticks on some host species [37]. This kind of transmission is considered crucial for the persistence of some infections, notably the tick-borne encephalitis virus complex [38]. As presented in this study, modelling certain parameters and the spatial distribution of ticks can be very useful for authorities to make decisions for prevention methods and/or control programs [39]. Among all of the ticks collected with the host method, Ixodes ricinus, Rhiphycephalus sanguineus, and Hyalomma marginatum showed significant prevalence within the studied area. The fact that the distribution of tick species remains consistent regardless of the sampling method suggests that the relative abundance of the mentioned species is relatively stable in the area.

4. Conclusions

In conclusion, based on the data collected with the host method, the tick species distribution in the region of Istria reveals the predominant presence of Ixodes ricinus, Rhipicephalus sanguineus, and Hyalomma marginatum. A similar distribution of tick species was obtained using the flagging/dragging method. These findings indicate a significant prevalence of these three tick species within the region of Istria. The consistency of these results across different sampling methods, including the dragging flagging method, suggests that the relative abundance of these tick species remains stable in the area. These results are valuable for researchers and public health authorities as they work towards understanding the local tick ecology and the associated risks of tick-borne diseases. During this study, we encountered the following limitations and challenges: sampling biases, tick behaviour, variation in tick life stages, influence of hosts, and others. By acknowledging and addressing these limitations, this study’s results can contribute to a better understanding of tick spatial distribution. Continuous monitoring and appropriate preventive measures are crucial to manage the risks posed by these tick species. Awareness campaigns, targeted interventions, and personal protective measures can help mitigate the transmission of tick-borne diseases. Additionally, ongoing research and surveillance efforts are necessary to monitor any changes in tick populations and their associated pathogens in this region. The data collected within this study and presented via GIS remain a powerful tool for analysing and understanding the spatial distribution of ticks in the region of Istria. Statistical analysis and spatial distribution can help in the visualization, integration, and analysis of various datasets, aid in the identification of high-risk areas, and inform effective tick control and disease prevention measures.

Author Contributions

M.C.: investigation, conceptualization, writing, and original draft preparation; D.B.: conceptualization, writing, data curation, software, and editing; D.P.: investigation and visualization; B.B.: formal GIS analysis; I.K.: validation and formal analysis; E.P.: methodology, validation, and formal analysis. N.L.: investigation, methodology, conceptualization, and supervision; A.S. funding and supervision; M.O.B.; writing, reviewing, and supervision; D.T.L.: conceptualization, writing, reviewing, editing, and supervision. All authors have read and agreed to the published version of the manuscript.

Funding

This study was supported by a grant from the University of Rijeka, Croatia (grant no. Uniri-biomed-18-155-1304), and was conducted as an investigation for the purpose of obtaining a doctoral dissertation.

Institutional Review Board Statement

This work did not require institutional ethical review or approval.

Informed Consent Statement

Not applicable.

Data Availability Statement

Raw data were generated at the Teaching Institute of Public Health of Istria County. Derived data supporting the findings of this study are available from the corresponding author (DTL) on request. We agree with the full transparency of the data if needed. For raw data related to this article, please contact M.C. at [email protected].

Acknowledgments

The authors would like to thank the staff of the Teaching Institute of Public Health of the Region of Istria, Croatia, for their help in sampling and laboratory analysis.

Conflicts of Interest

The authors declare no conflict of interest.

References

  1. Mulić, R.; Petković, B.; Klismanić, Z.; Jerončić, I. Tick-borne diseases in the Republic of Croatia. Lijec. Vjesn. 2011, 133, 89–95. [Google Scholar] [PubMed]
  2. De la Fuente, J.; Estrada-Pena, A.; Venzal, J.M.; Kocan, K.M.; Sonenshine, D.E. Overview: Ticks as vectors of pathogens that cause disease in humans and animals. Front. Biosci. 2008, 13, 6938–6946. [Google Scholar] [CrossRef] [PubMed]
  3. Boulanger, N.; Boyer, P.; Talagrand-Reboul, E.; Hansmann, Y. Ticks and tick-borne diseases. Med. Mal. Infect. 2019, 49, 87–97. [Google Scholar] [CrossRef] [PubMed]
  4. Ogden, N. Changing geographic ranges of ticks and tick-borne pathogens: Drivers, mechanisms and consequences for pathogen diversity. Front. Cell. Infect. Microbiol. 2013, 3, 46. [Google Scholar] [CrossRef] [PubMed]
  5. Estrada-Pena, A.; Ayllón, N.; Fuente, J. Impact of climate trends on tick-borne pathogen transmission. Front. Physiol. 2012, 3, 64. [Google Scholar] [CrossRef] [PubMed]
  6. Randolph, S.E.; Rogers, D.J. Fragile transmission cycles of tick-borne encephalitis virus may be disrupted by predicted climate change. Proc. R. Soc. B Biol. Sci. 2000, 267, 1741–1744. [Google Scholar] [CrossRef] [PubMed]
  7. Gebreyes, W.A.; Dupouy-Camet, J.; Newport, M.J.; Oliveira, C.J.; Schlesinger, L.S.; Saif, Y.M.; Kariuki, S.; Saif, L.J.; Saville, W.; Wittum, T.; et al. The global One Health paradigm: Challenges and opportunities for tackling infectious diseases at the human, animal, and environment interface in low-resource settings. PLoS Negl. Trop. Dis. 2014, 8, e3257. [Google Scholar] [CrossRef]
  8. Romanović, M.; Mulić, R.; Ropac, D. Doprinos poznavanju medicinski važnih člankonožaca na otocima i priobalju Republike Hrvatske. Entomol. Croat. 1999, 4, 71–80. [Google Scholar]
  9. Nava, S.; Gugliemone, A.A.; Mangold, A.J. An overview of systematic and evolution of ticks. Front. Biosci. 2009, 14, 2857–2877. [Google Scholar] [CrossRef]
  10. Richter, B. Medicinska Parazitologija; A.B.D. Merkur: Zagreb, Croatia, 2002; pp. 145–151. [Google Scholar]
  11. Golubić, D.; Rijepkema, S.; Tkalec-Malkovec, N.; Ružić, E. Epidemiologic, ecologic and clinical characteristics of Lyme borreliosis in Northwest Croatia. Acta Med. Croat. 1998, 1, 7–13. [Google Scholar]
  12. Eisen, L.; Lane, R.S. Vectors of Borelia burgdorferi sensu lato. In Lyme Borreliosis Biology, Epidemiology and Control; Gray, J., Kahl, O., Lane, R.S., Stanek, G., Eds.; Cabi Publishing: Wallingford, UK, 2002; p. 91. [Google Scholar]
  13. Krčmar, S. Hard ticks (Acari, Ixodidae) of Croatia. Zookeys 2012, 19–57. [Google Scholar] [CrossRef] [PubMed]
  14. Borčić, B.; Kaić, B.; Kralj, V. Some epidemiological data on TBE and Lyme borreliosis in Croatia. Zentralbl. Bakteriol. 1999, 289, 540–547. [Google Scholar] [CrossRef] [PubMed]
  15. Léger, E.; Vourc’h, G.; Vial, L.; Chevillon, C.; McCoy, K.D. Changing distributions of ticks: Causes and consequences. Exp. Appl. Acarol. 2013, 59, 219–244. [Google Scholar] [CrossRef] [PubMed]
  16. European Centre for Disease Prevention and Control; European Food Safety Authority. Field Sampling Methods for Mosquitoes, Sandflies, Biting Midges and Ticks—VectorNet Project 2014–2018; ECDC: Stockholm, Sweden; EFSA: Parma, Italy, 2018. [Google Scholar]
  17. Daniel, M.; Kolár, J.; Zeman, P. GIS tools for tick and tick-borne disease occurrence. Parasitology 2004, 129, S329–S352. [Google Scholar] [CrossRef] [PubMed]
  18. Croatian Bureau of Statistics. First Digital Census of Population 2021. Available online: https://dzs.gov.hr/en (accessed on 15 May 2023).
  19. Newman, B.C.; Sutton, W.B.; Wang, Y.; Schweitzer, C.J.; Moncayo, A.C.; Miller, B.T. A standardized method for the construction of a tick drag/flag sampling approach and evaluation of sampling efficacy. Exp. Appl. Acarol. 2019, 79, 433–446. [Google Scholar] [CrossRef]
  20. Estrada-Peña, A.; Bouattour, A.; Camicas, J.L.; Walker, A.R. Ticks of Domestic Animals in the Mediterranean Region. A Guide to Identification of Species; University of Edinburgh: Edinburgh, UK, 2003; revised 2014; ISBN 8-4962141-84 2004. [Google Scholar]
  21. Cattell, R.B. The Scree Test for the Number of Factors. Multivar. Behav. Res. 1966, 1, 245–276. [Google Scholar] [CrossRef] [PubMed]
  22. Baldwin, H.; Landesman, W.J.; Borgmann-Winter, B.; Allen, D. A Geographic Information System Approach to Map Tick Exposure Risk at a Scale for Public Health Intervention. J. Med. Entomol. 2022, 59, 162–172. [Google Scholar] [CrossRef]
  23. Sarani, M.S.; Sedaghat, M.M.; Zakieh, T.; Abdoreza, S.M.; Abbas, Z. Distribution of Hard Ticks Using Geographical Information System (GIS) in Mountainous Areas of East Golestan Province, Iran. In Proceedings of the Global Conference on Entomology, Chiang Mai, Thailand, 5–9 March 2011. [Google Scholar]
  24. Eisen, L.; Eisen, R.J. Using geographic information systems and decision support systems for the prediction, prevention, and control of vector-borne diseases. Annu. Rev. Entomol. 2011, 56, 41–61. [Google Scholar] [CrossRef]
  25. Rosà, R.; Pugliese, A. Effects of tick population dynamics and host densities on the persistence of tick-borne infections. Math. Biosci. 2007, 208, 216–240. [Google Scholar] [CrossRef]
  26. Randolph, S.E.; Green, R.M.; Peacey, M.F.; Rogers, D.J. Seasonal synchrony: The key to tick-borne encephalitis foci identified by satellite data. Parasitology 2000, 121, 15–23. [Google Scholar] [CrossRef]
  27. Requena-García, F.; Cabrero-Sañudo, F.; Olmeda-García, S.; González, J.; Valcárcel, F. Influence of environmental temperature and humidity on questing ticks in central Spain. Exp. Appl. Acarol. 2017, 71, 277–290. [Google Scholar] [CrossRef] [PubMed]
  28. Estrada-Peña, A. Climate, niche, ticks, and models: What they are and how we should interpret them. Parasitol. Res. 2008, 103, S87–S95. [Google Scholar] [CrossRef] [PubMed]
  29. Ostfeld, R.S.; Keesing, F. Biodiversity and the dilution effect in disease ecology. Ecology 2000, 82, 609. [Google Scholar]
  30. Schmidt, K.A.; Ostfeld, R.S. Biodiversity and disease risk: The case of Lyme disease. Conserv. Biol. 2001, 14, 722. [Google Scholar]
  31. Giudice, K.L.; Ostfeld, R.S.; Schmidt, K.A.; Keesing, F. The ecology of infectious disease: Effects of host diversity and community composition on Lyme disease risk. Proc. Natl. Acad. Sci. USA 2003, 100, 567. [Google Scholar] [CrossRef]
  32. Wikel, S.K. Ticks and Tick-Borne Infections: Complex Ecology, Agents, and Host Interactions. Vet. Sci. 2018, 5, 60. [Google Scholar] [CrossRef]
  33. Pfäffle, M.; Littwin, N.; Muders, S.V.; Petney, T.N. The ecology of tick-borne diseases. Int. J. Parasitol. 2013, 43, 1059–1077. [Google Scholar] [CrossRef]
  34. Baneth, G. Tick-borne infections of animals and humans: A common ground. Int. J. Parasitol. 2014, 44, 591–596. [Google Scholar] [CrossRef]
  35. Dantas-Torres, F.; Chomel, B.B.; Otranto, D. Ticks and tick-borne diseases: A One Health perspective. Trends Parasitol. 2012, 28, 437–446. [Google Scholar] [CrossRef]
  36. Wikel, S.K. Ticks and tick-borne pathogens at the cutaneous interface: Host defences, tick countermeasures, and a suitable environment for pathogen establishment. Front. Microbiol. 2013, 4, 337. [Google Scholar] [CrossRef]
  37. Labuda, M.; Jones, L.D.; Williams, T.; Danielova, V.; Nuttal, P.A. Efficient transmission of tick-borne encephalitis virus between cofeeding ticks. J. Med. Entomol. 1993, 30, 295. [Google Scholar] [CrossRef]
  38. Randolph, S.E.; Gern, L.; Nuttal, P.A. Co-feeding ticks: Epidemiological significance for tick-borne pathogen transmission. Parasitol. Today 1996, 12, 472. [Google Scholar] [CrossRef]
  39. Zannou, O.M.; Ouedraogo, A.S.; Biguezoton, A.S.; Abatih, E.; Coral-Almeida, M.; Farougou, S.; Yao, K.P.; Lempereur, L.; Saegerman, C. Models for Studying the Distribution of Ticks and Tick-Borne Diseases in Animals: A Systematic Review and a Meta-Analysis with a Focus on Africa. Pathogens 2021, 10, 893. [Google Scholar] [CrossRef]
Figure 1. Geographic location of the sampling area in the region of Istria, Croatia.
Applsci 13 09483 g001
Figure 2. Distribution of ticks collected using (a) flagging/dragging method and (b) animal/human host method across the region of Istria.
Applsci 13 09483 g002
Figure 3. Spatial distribution of different tick species collected using flagging/dragging and animal/human host methods within the region of Istria.
Applsci 13 09483 g003
Figure 4. Distribution of tick species according to gender and developmental stage collected using different host methods represented via principal component analysis (PCA) (n = 929) with two main components (PC1 and PC2). Projections of (a) the analysis variables (hosts) and (b) cases (active cases variable: gender/development; labelling variable: tick species) on the factor plane.
Applsci 13 09483 g004
Figure 5. Distribution of the tick species in all hosts represented using cluster (two-way joining) analysis.
Applsci 13 09483 g005
Figure 6. Three-dimensional surface plot showing the distribution of the most widespread tick species in three hosts (human, dog, and horse) represented using principal component analysis (PCA).
Applsci 13 09483 g006
Table 1. Total number of ticks collected using different sampling methods in the region of Istria from 2020 to 2023.
Sampling Method
Animal HostHuman HostFlagging/Dragging Method
Domestic animalsPetsWild animalsUnknown901289
horses211dogs470wild boars24
pigs5rabbits3
donkeys11cats80hedgehogs5
goats7roe deer25
deer16
234550514901289
Total: 2218
Table 2. Determined tick species collected using flagging/dragging method distributed according to gender or developmental stage.
SpeciesGender/Development StageNo.
Dermacentor marginatusM2
F1
Haemaphysalis punctataM16
F8
N14
Haemaphysalis sp.N1
Haemaphysalis sulcataF1
Hyalomma m. marginatumF3
Ixodes frontalisF4
N26
Ixodes ricinusM41
F148
N800
L148
Ixodes sp.M2
F2
N23
Ixodes vespertilionisF1
Rhiphicephalus sanguineusM6
F3
N20
Rhiphicephalus sp.N19
M—male; F—female; N—nymph; L—larva1289
Table 3. Eigenvector spreadsheets and variable contribution of active case variables (hosts) represented via principal component analysis (PCA) (n = 929).
VariableEigenvectors SpreadsheetVariable Contributions
PC1PC2PC3PC4PC1PC2PC3PC4
human0.370.28−0.01−0.000.140.080.000.00
dog0.31−0.21−0.05−0.000.090.040.000.00
cat0.42−0.06−0.01−0.000.160.000.000.00
hedgehog0.38−0.15−0.05−0.000.140.020.000.00
rabbit0.39−0.05−0.02−0.000.160.000.000.00
roe deer0.39−0.090.080.000.150.010.010.00
deer−0.04−0.310.760.000.000.100.580.00
goat−0.05−0.06−0.430.710.000.000.180.50
horse0.440.190.030.000.150.040.000.00
pig−0.05−0.06−0.43−0.710.000.000.180.50
donkey0.000.840.200.000.000.700.040.00
Table 4. Factor scores based on correlations (tick species) represented using principal component analysis (PCA) (n = 929). Active case variable: gender/development. Labelling variable: tick species. Code for active cases: female (F). Supplementary cases are highlighted.
Tick SpeciesGender/DevelopmentPC1PC2PC3PC4
Argas persicusF−0.37−0.11−0.01−0.00
Haemaphysalis punctataM−0.70−1.07−8.8214.70
Haemaphysalis punctataF−0.40−0.22−1.482.45
Haemaphysalis punctataN−0.37−0.11−0.01−0.00
Haemaphysalis sp.M−0.35−0.08−0.01−0.00
Haemaphysalis sp.F−0.35−0.07−0.01−0.00
Hyalomma marginatumM0.311.57−1.09−2.45
Hyalomma marginatumF0.023.130.710.00
Hyalomma sp.M−0.290.01−0.01−0.00
Hyalomma sp.F−0.270.010.00−0.00
Ixodes ricinusM0.98−0.49−0.05−0.00
Ixodes ricinusF3.26−0.18−0.09−0.00
Ixodes ricinusN0.260.93−0.06−0.00
Ixodes sp.M−0.40−0.440.860.00
Ixodes sp.F−0.33−1.162.650.00
Ixodes sp.N−0.37−0.11−0.01−0.00
Ixodes gibbosusF−0.37−0.11−0.01−0.00
Ixodes hexagonusF−0.35−0.11−0.01−0.00
Ixodes frontalisF−0.33−0.03−0.01−0.00
Ixodes vespertilionisN−0.35−0.07−0.01−0.00
Rhiphycephalus sanguineusM0.11−0.62−0.18−0.00
Rhiphycephalus sanguineusF0.27−0.81−0.23−0.00
Rhiphycephalus sanguineusN−0.35−0.14−0.02−0.00
Rhiphycephalus sanguineusL−0.33−0.130.01−0.00
Dermacentor marginatusM−0.59−0.66−4.41−7.35
Dermacentor marginatusF−0.40−0.22−1.48−2.45
Rhiphycephalus turanicusM−0.36−0.12−0.01−0.00
Rhiphycephalus turanicusF−0.37−0.12−0.02−0.00
Rhiphycephalus turanicusN−0.37−0.11−0.01−0.00
M—male; F—female; N—nymph; L—larva.
Disclaimer/Publisher’s Note: The statements, opinions and data contained in all publications are solely those of the individual author(s) and contributor(s) and not of MDPI and/or the editor(s). MDPI and/or the editor(s) disclaim responsibility for any injury to people or property resulting from any ideas, methods, instructions or products referred to in the content.

