
Design and Optimization of the Bi-Directional U-Ribbed Stiffening Plate–Concrete Composite Bridge Deck Structure


Abstract
:1. Introduction
2. Research Background
3. Structural Design and Optimization
3.1. Optimization of Element Partitioning
3.2. Design and Optimization of Structures
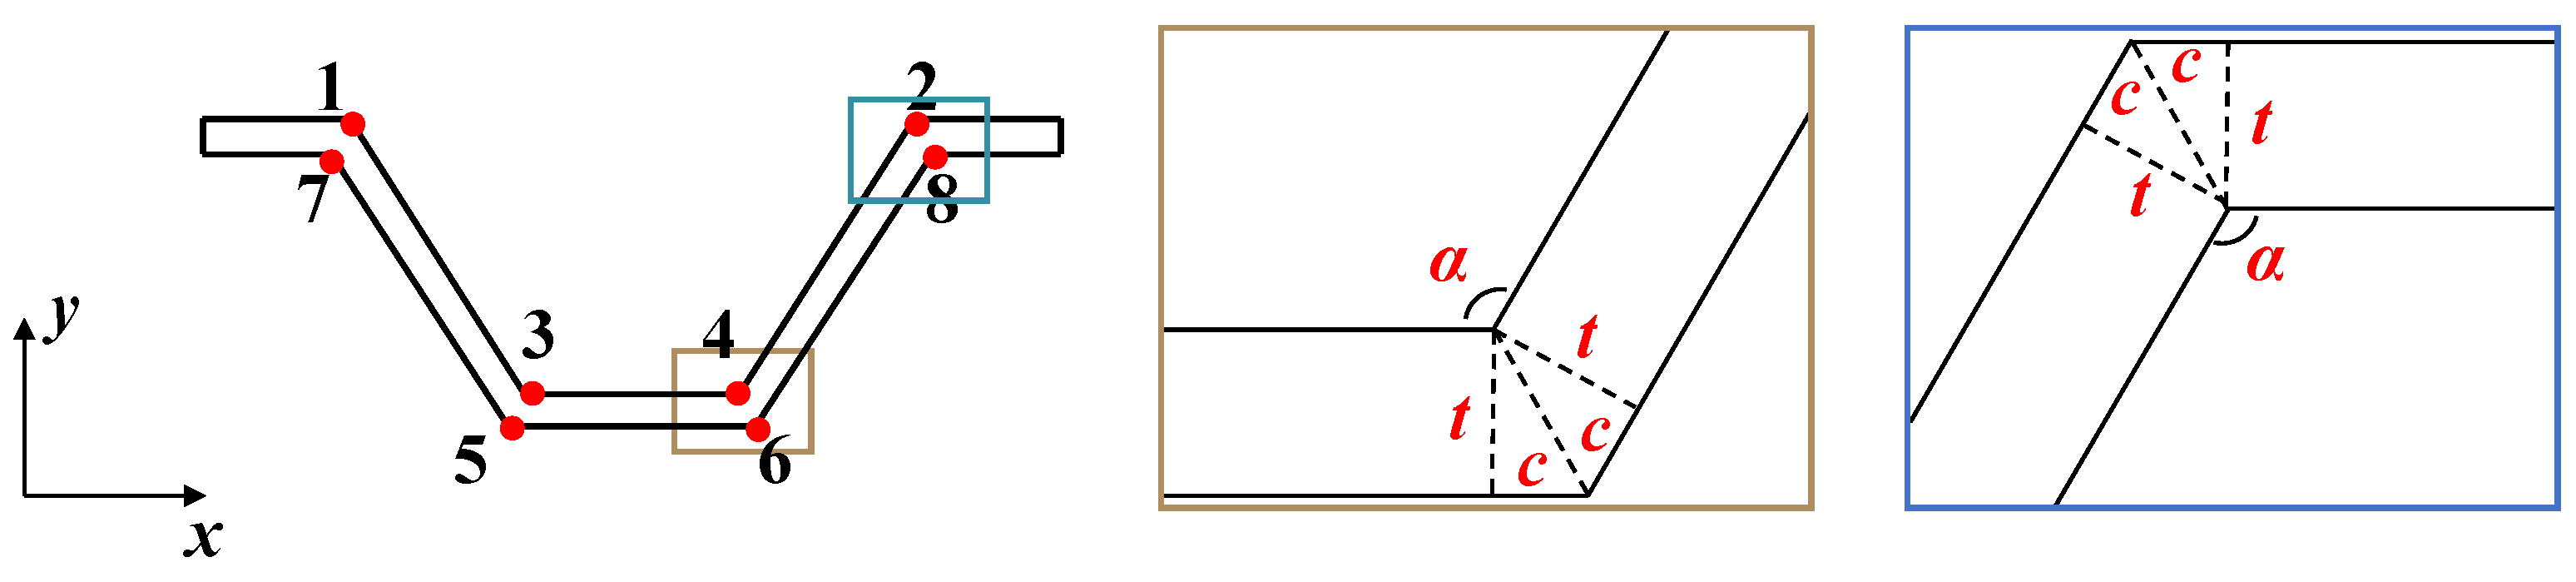
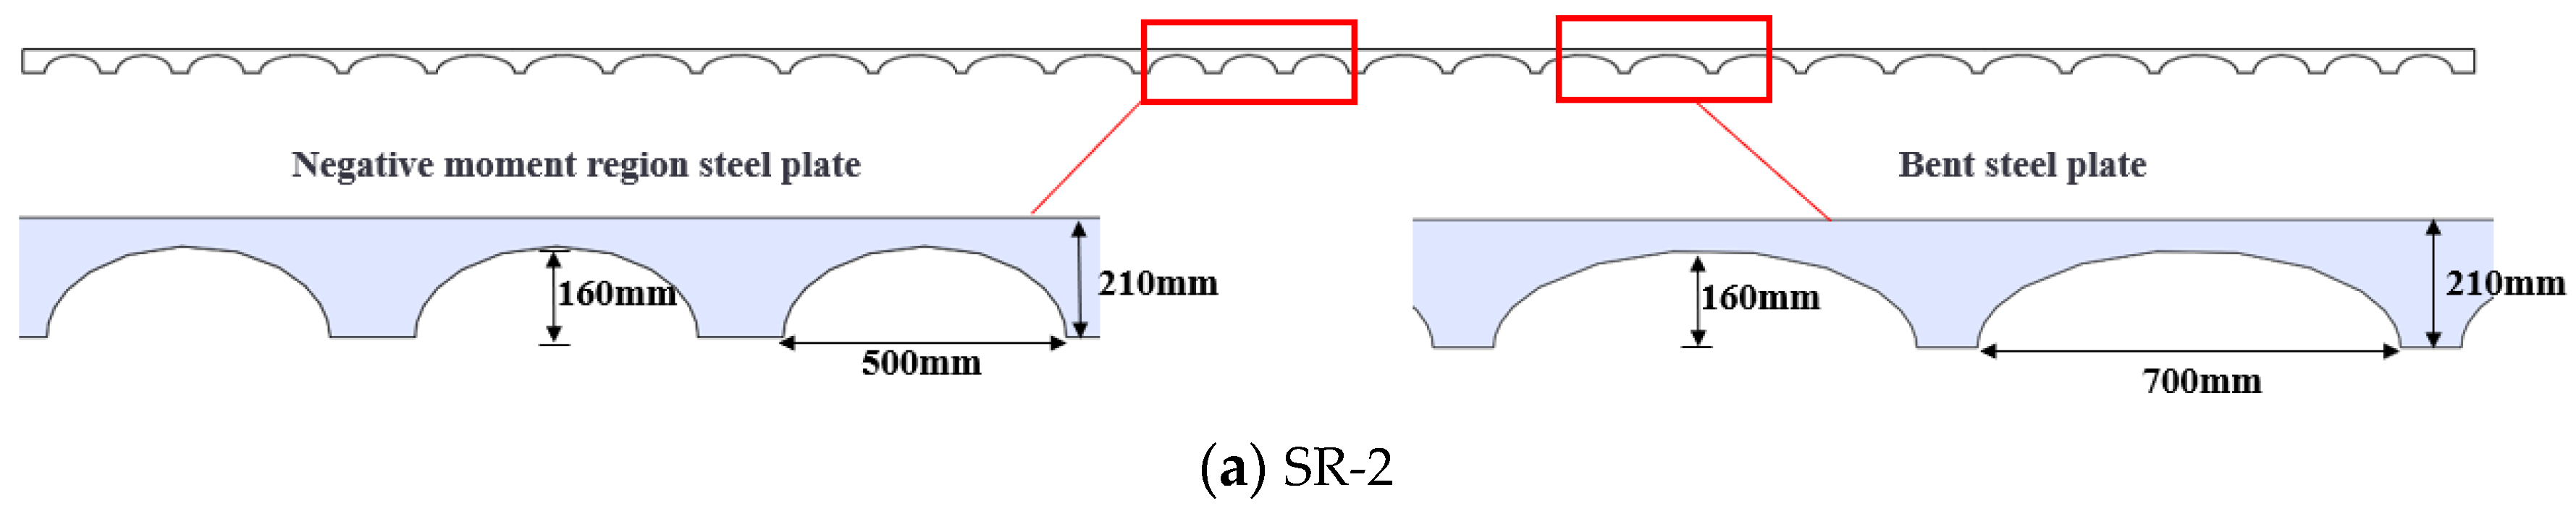
3.3. BUSP Design
4. Parametric Study by Computational Analysis
4.1. Computation Model
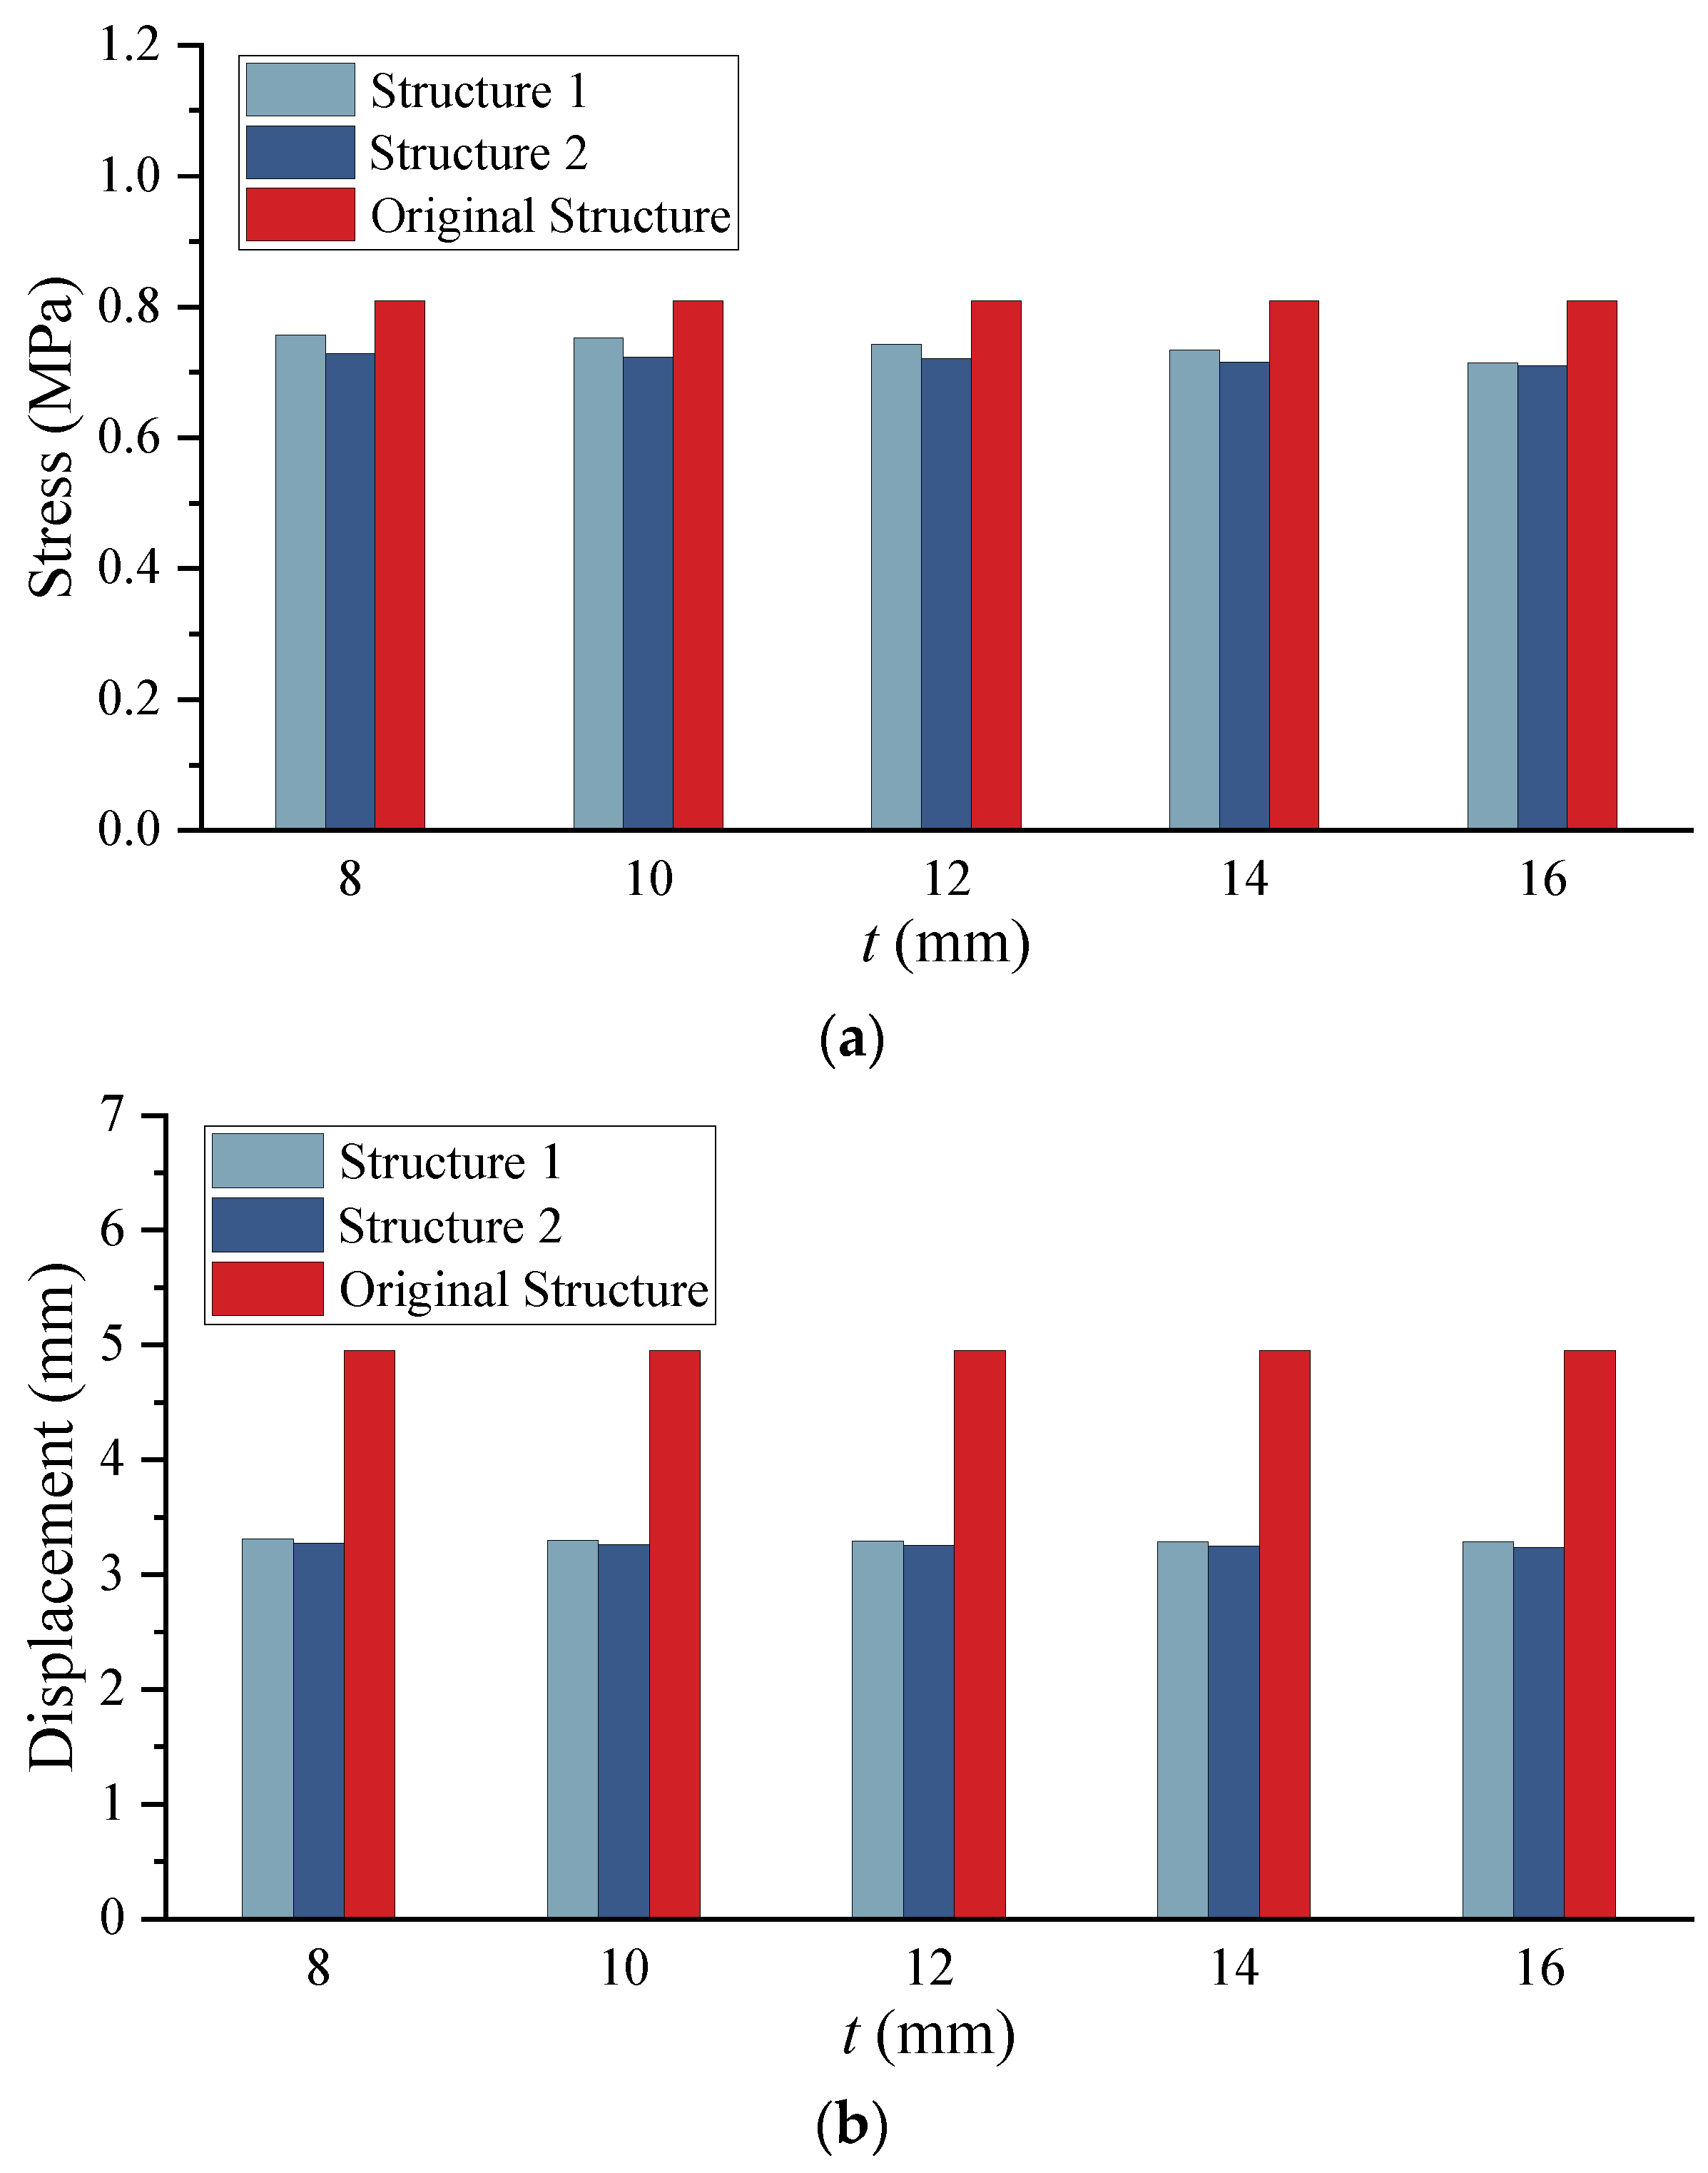
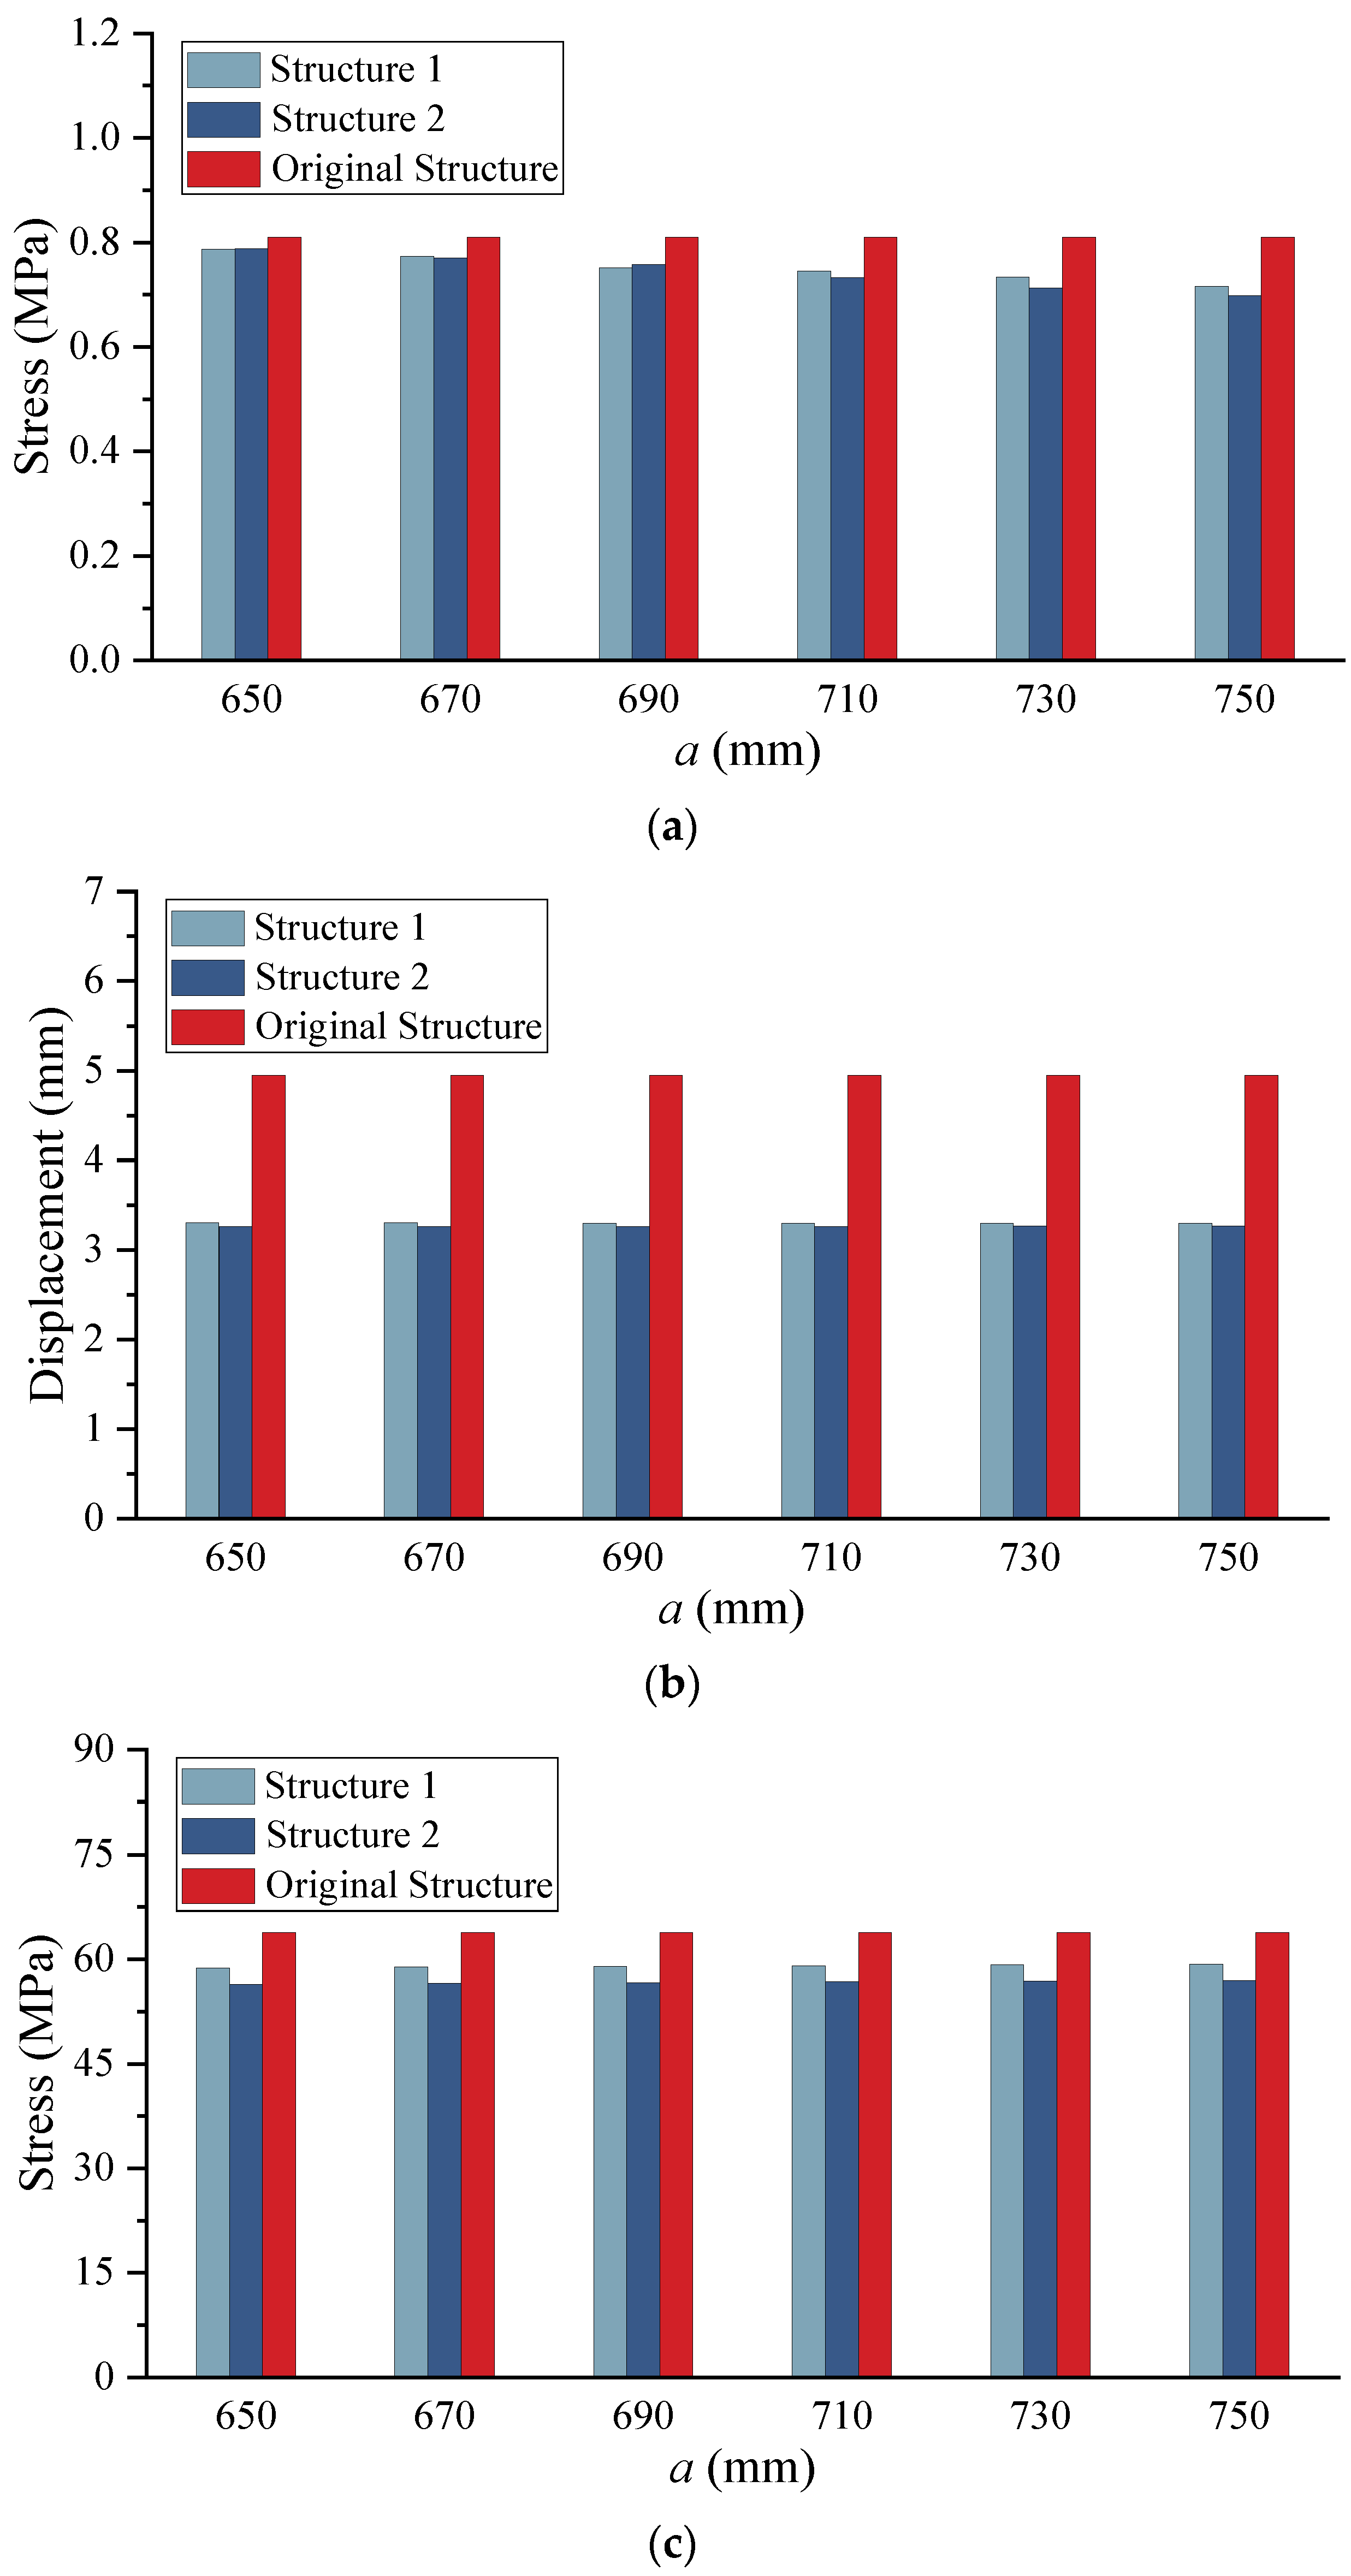
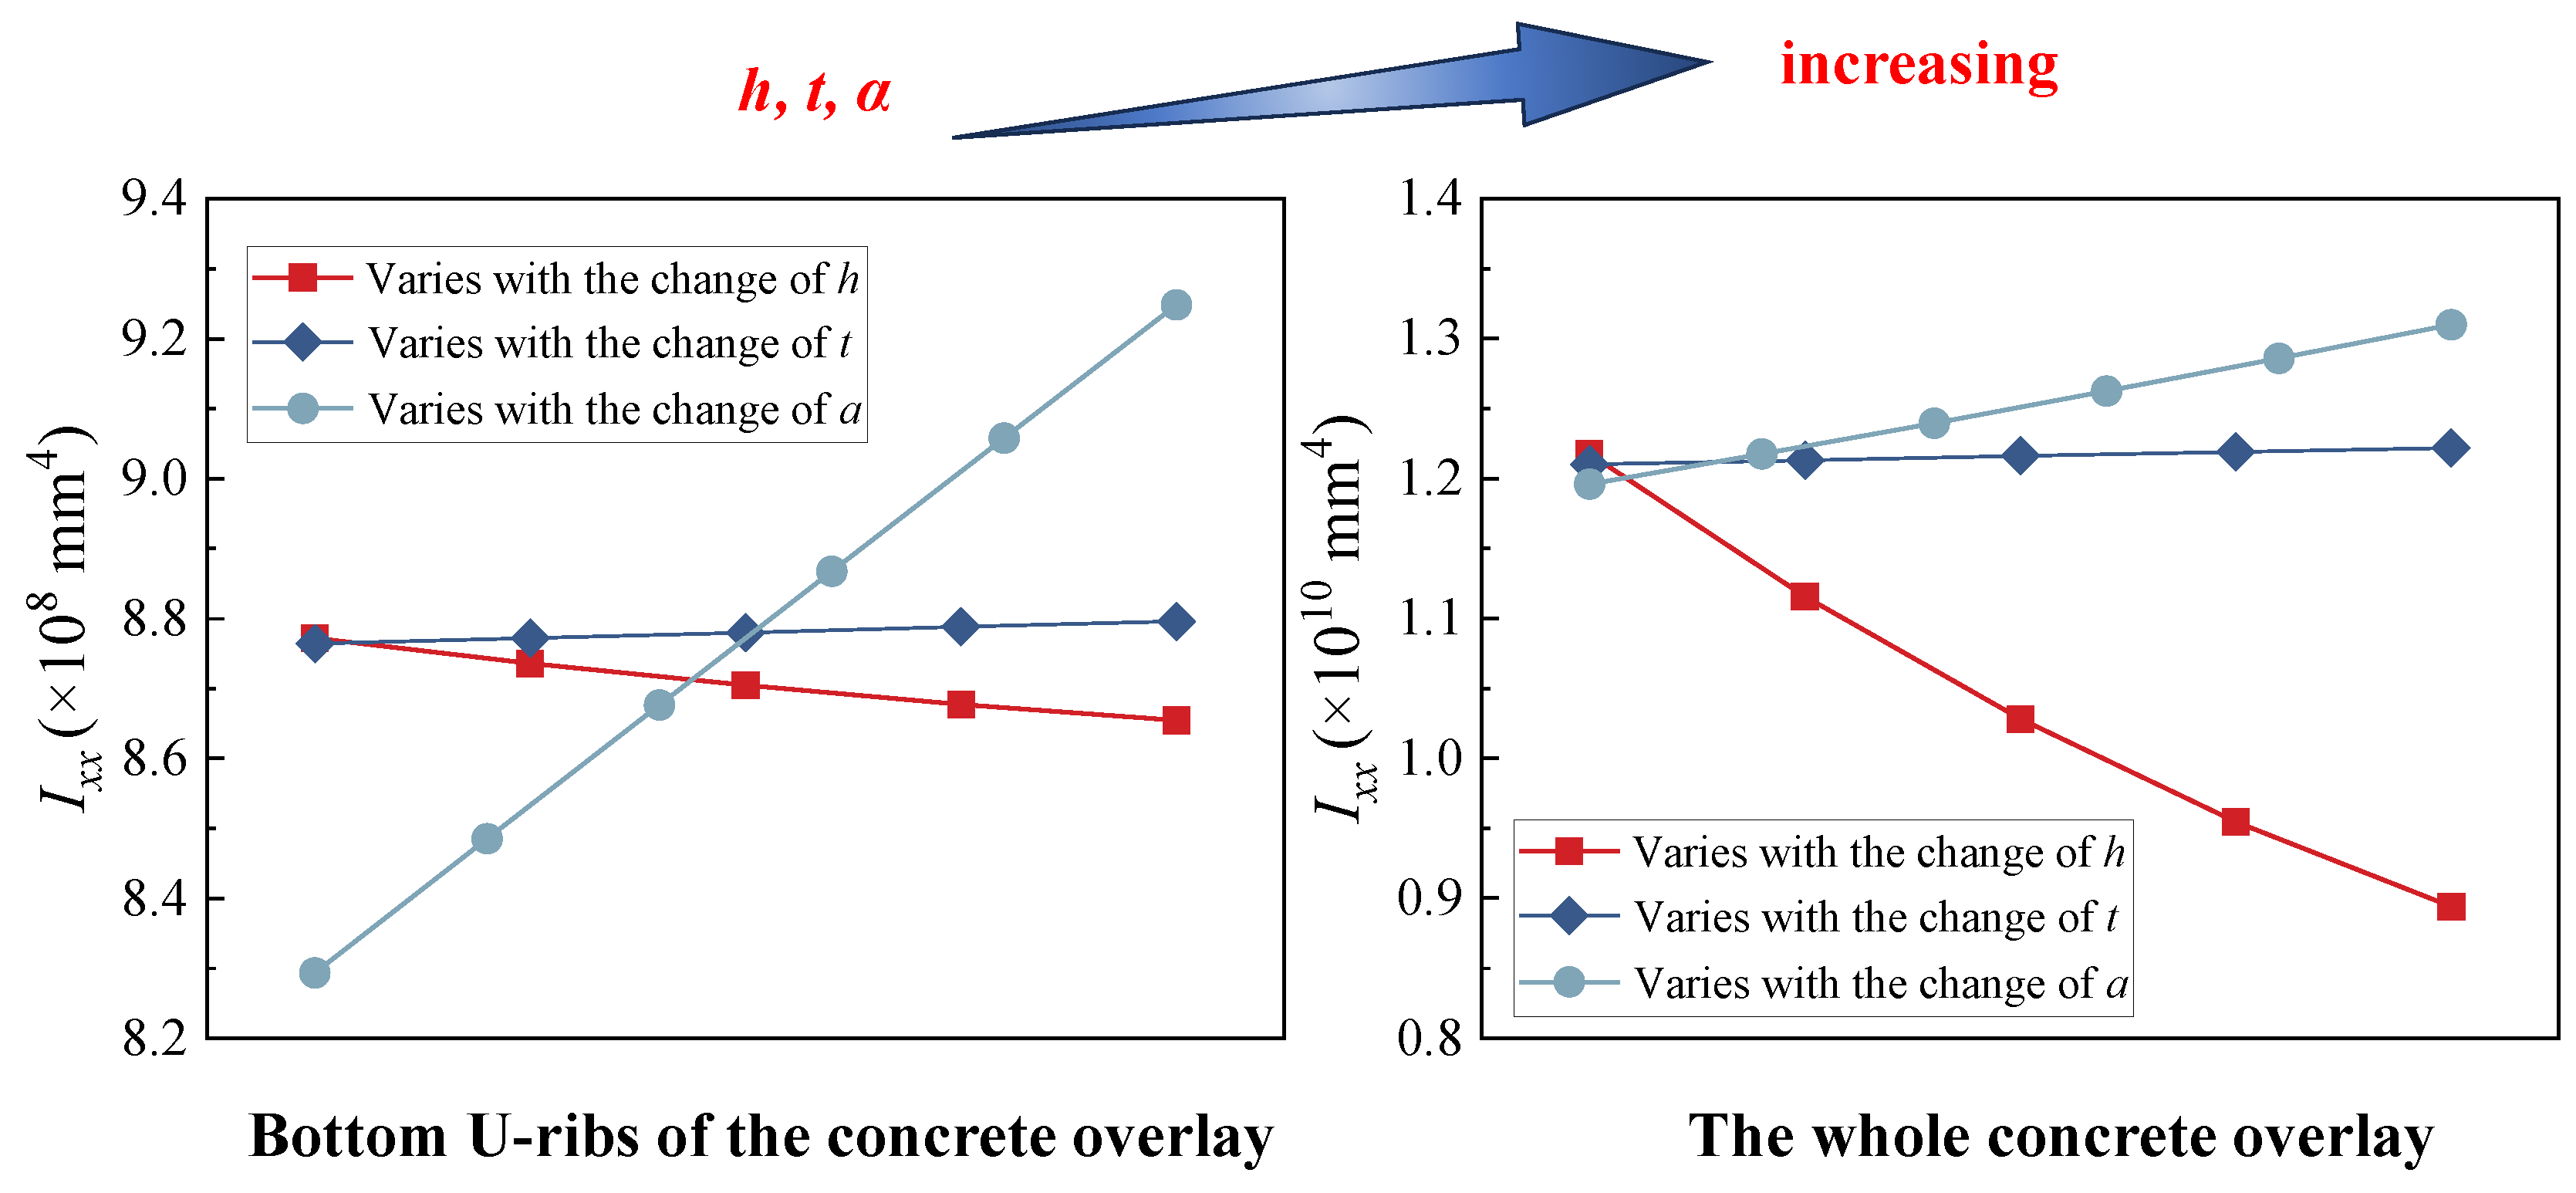
4.2. Influence of Single Parameters , , and
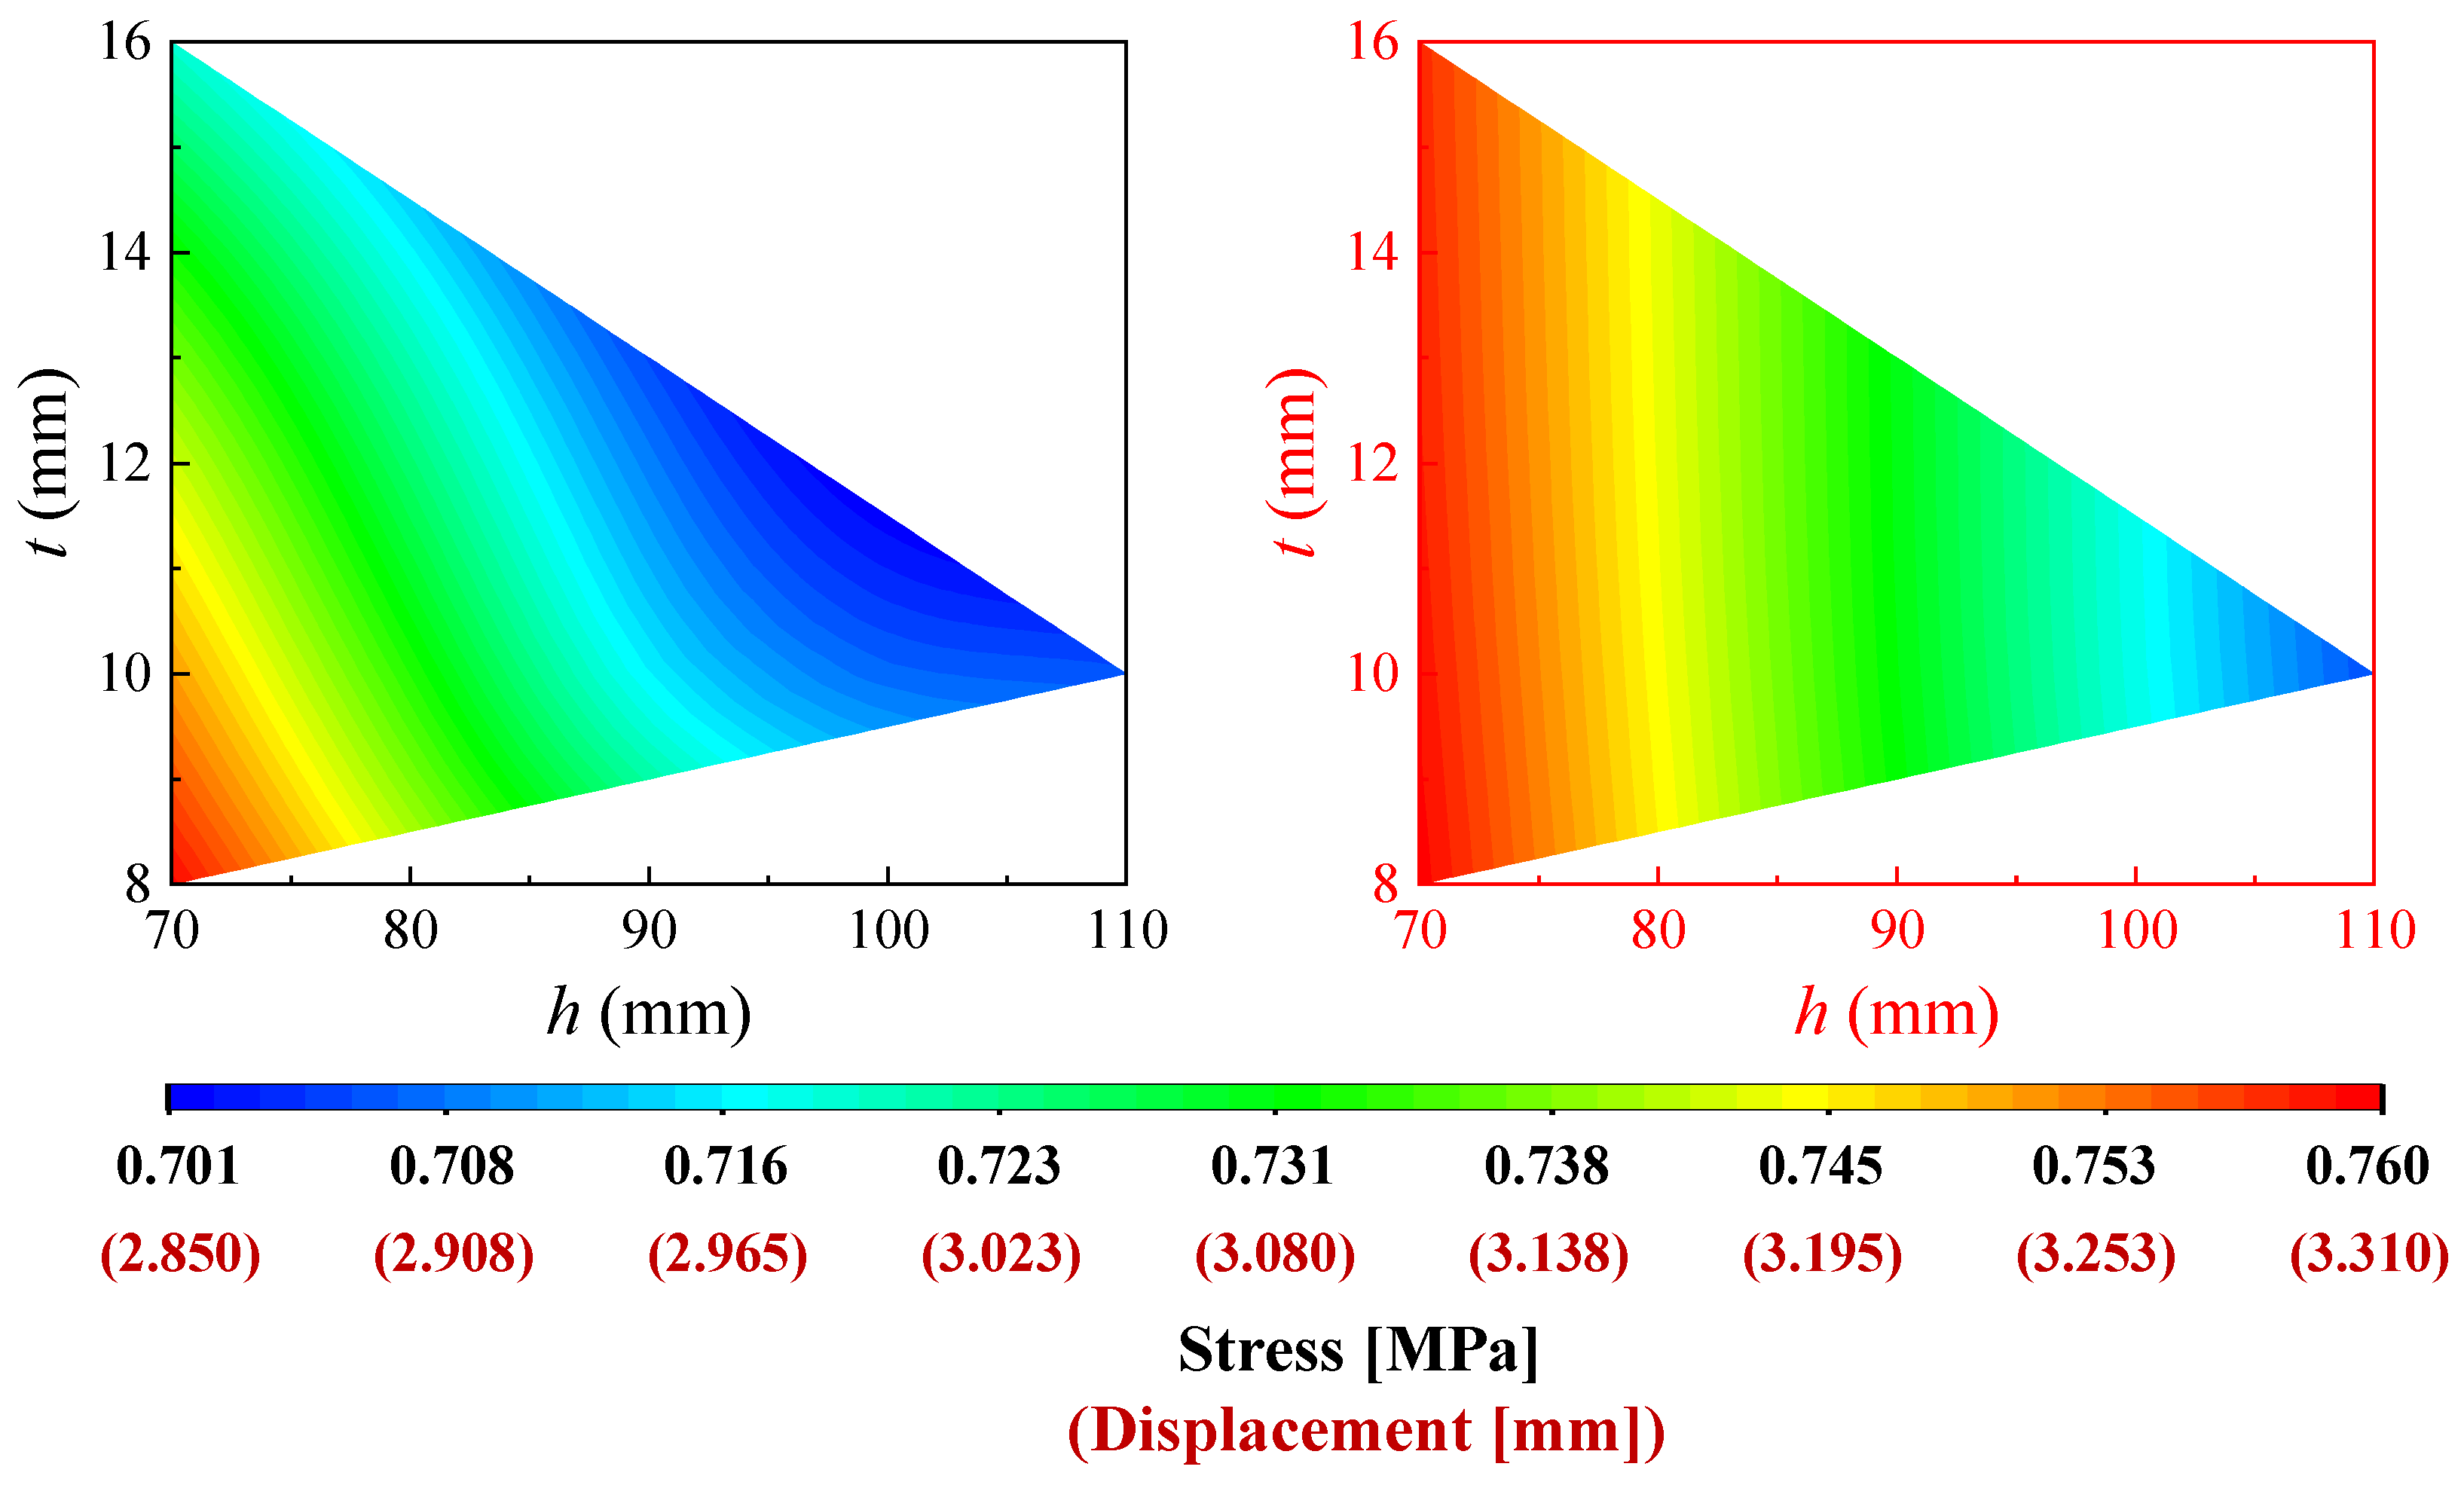
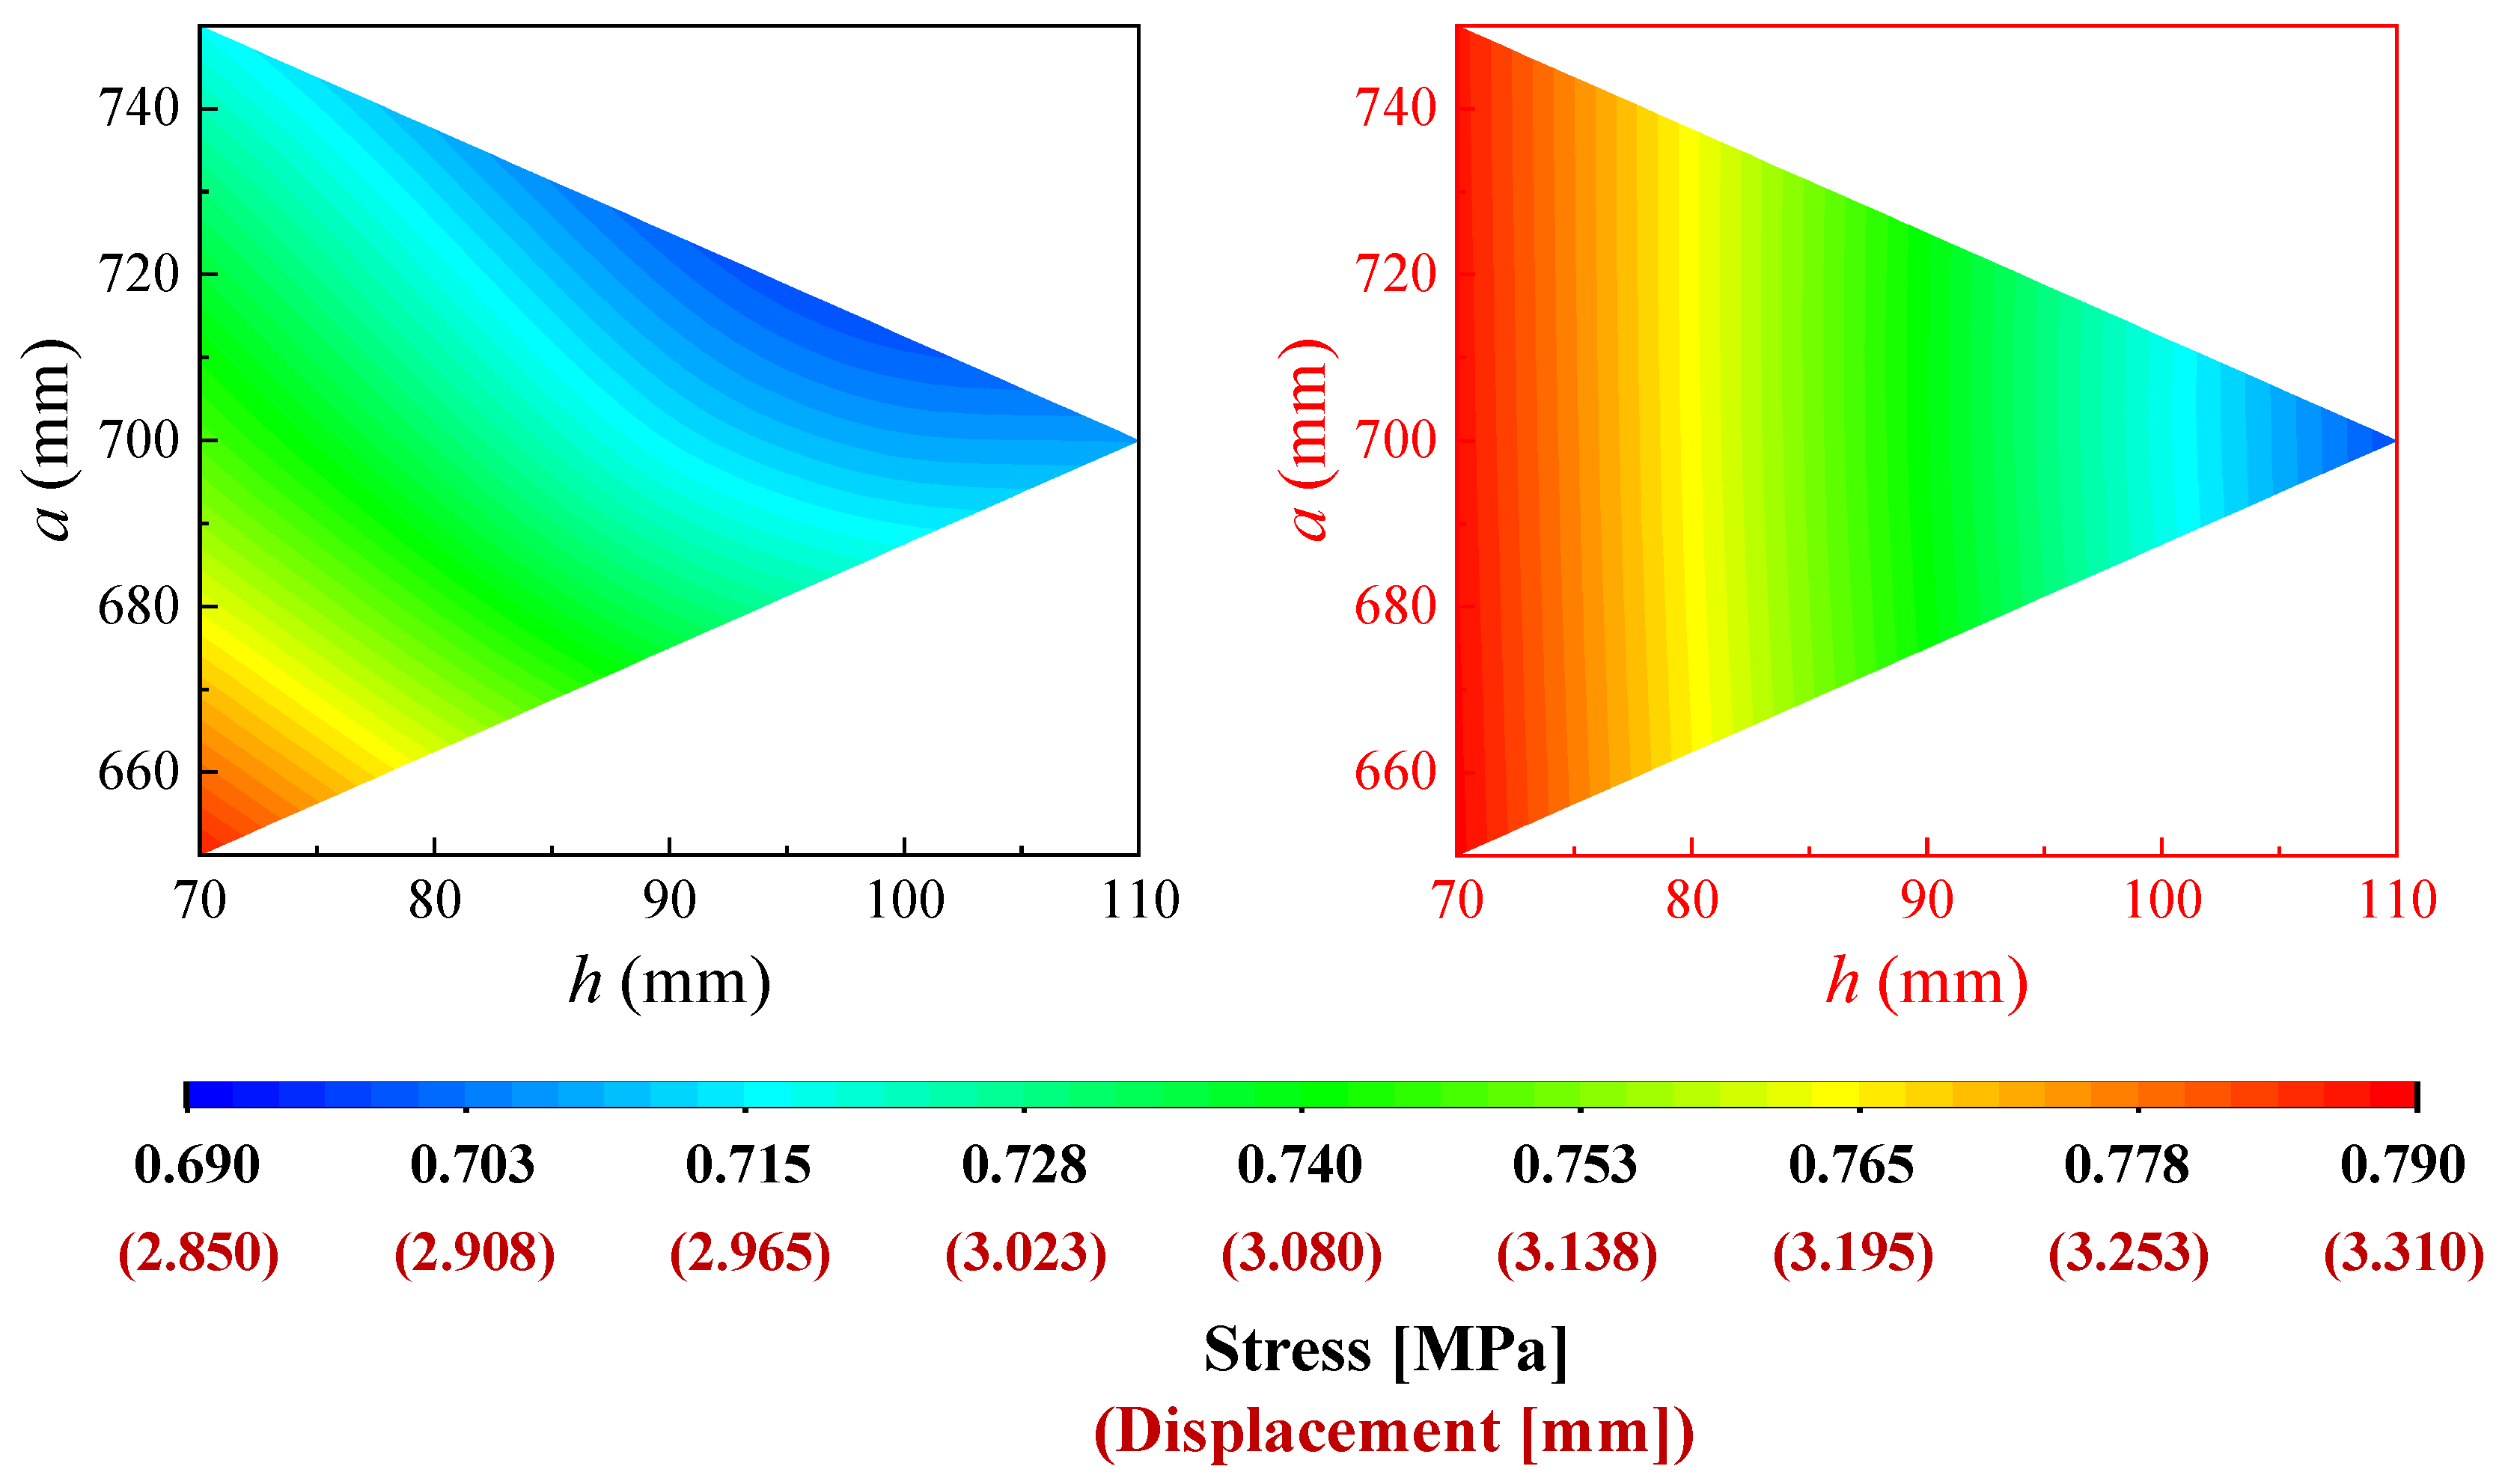
4.3. Coupled Effect of Two or More Parameters in , , and
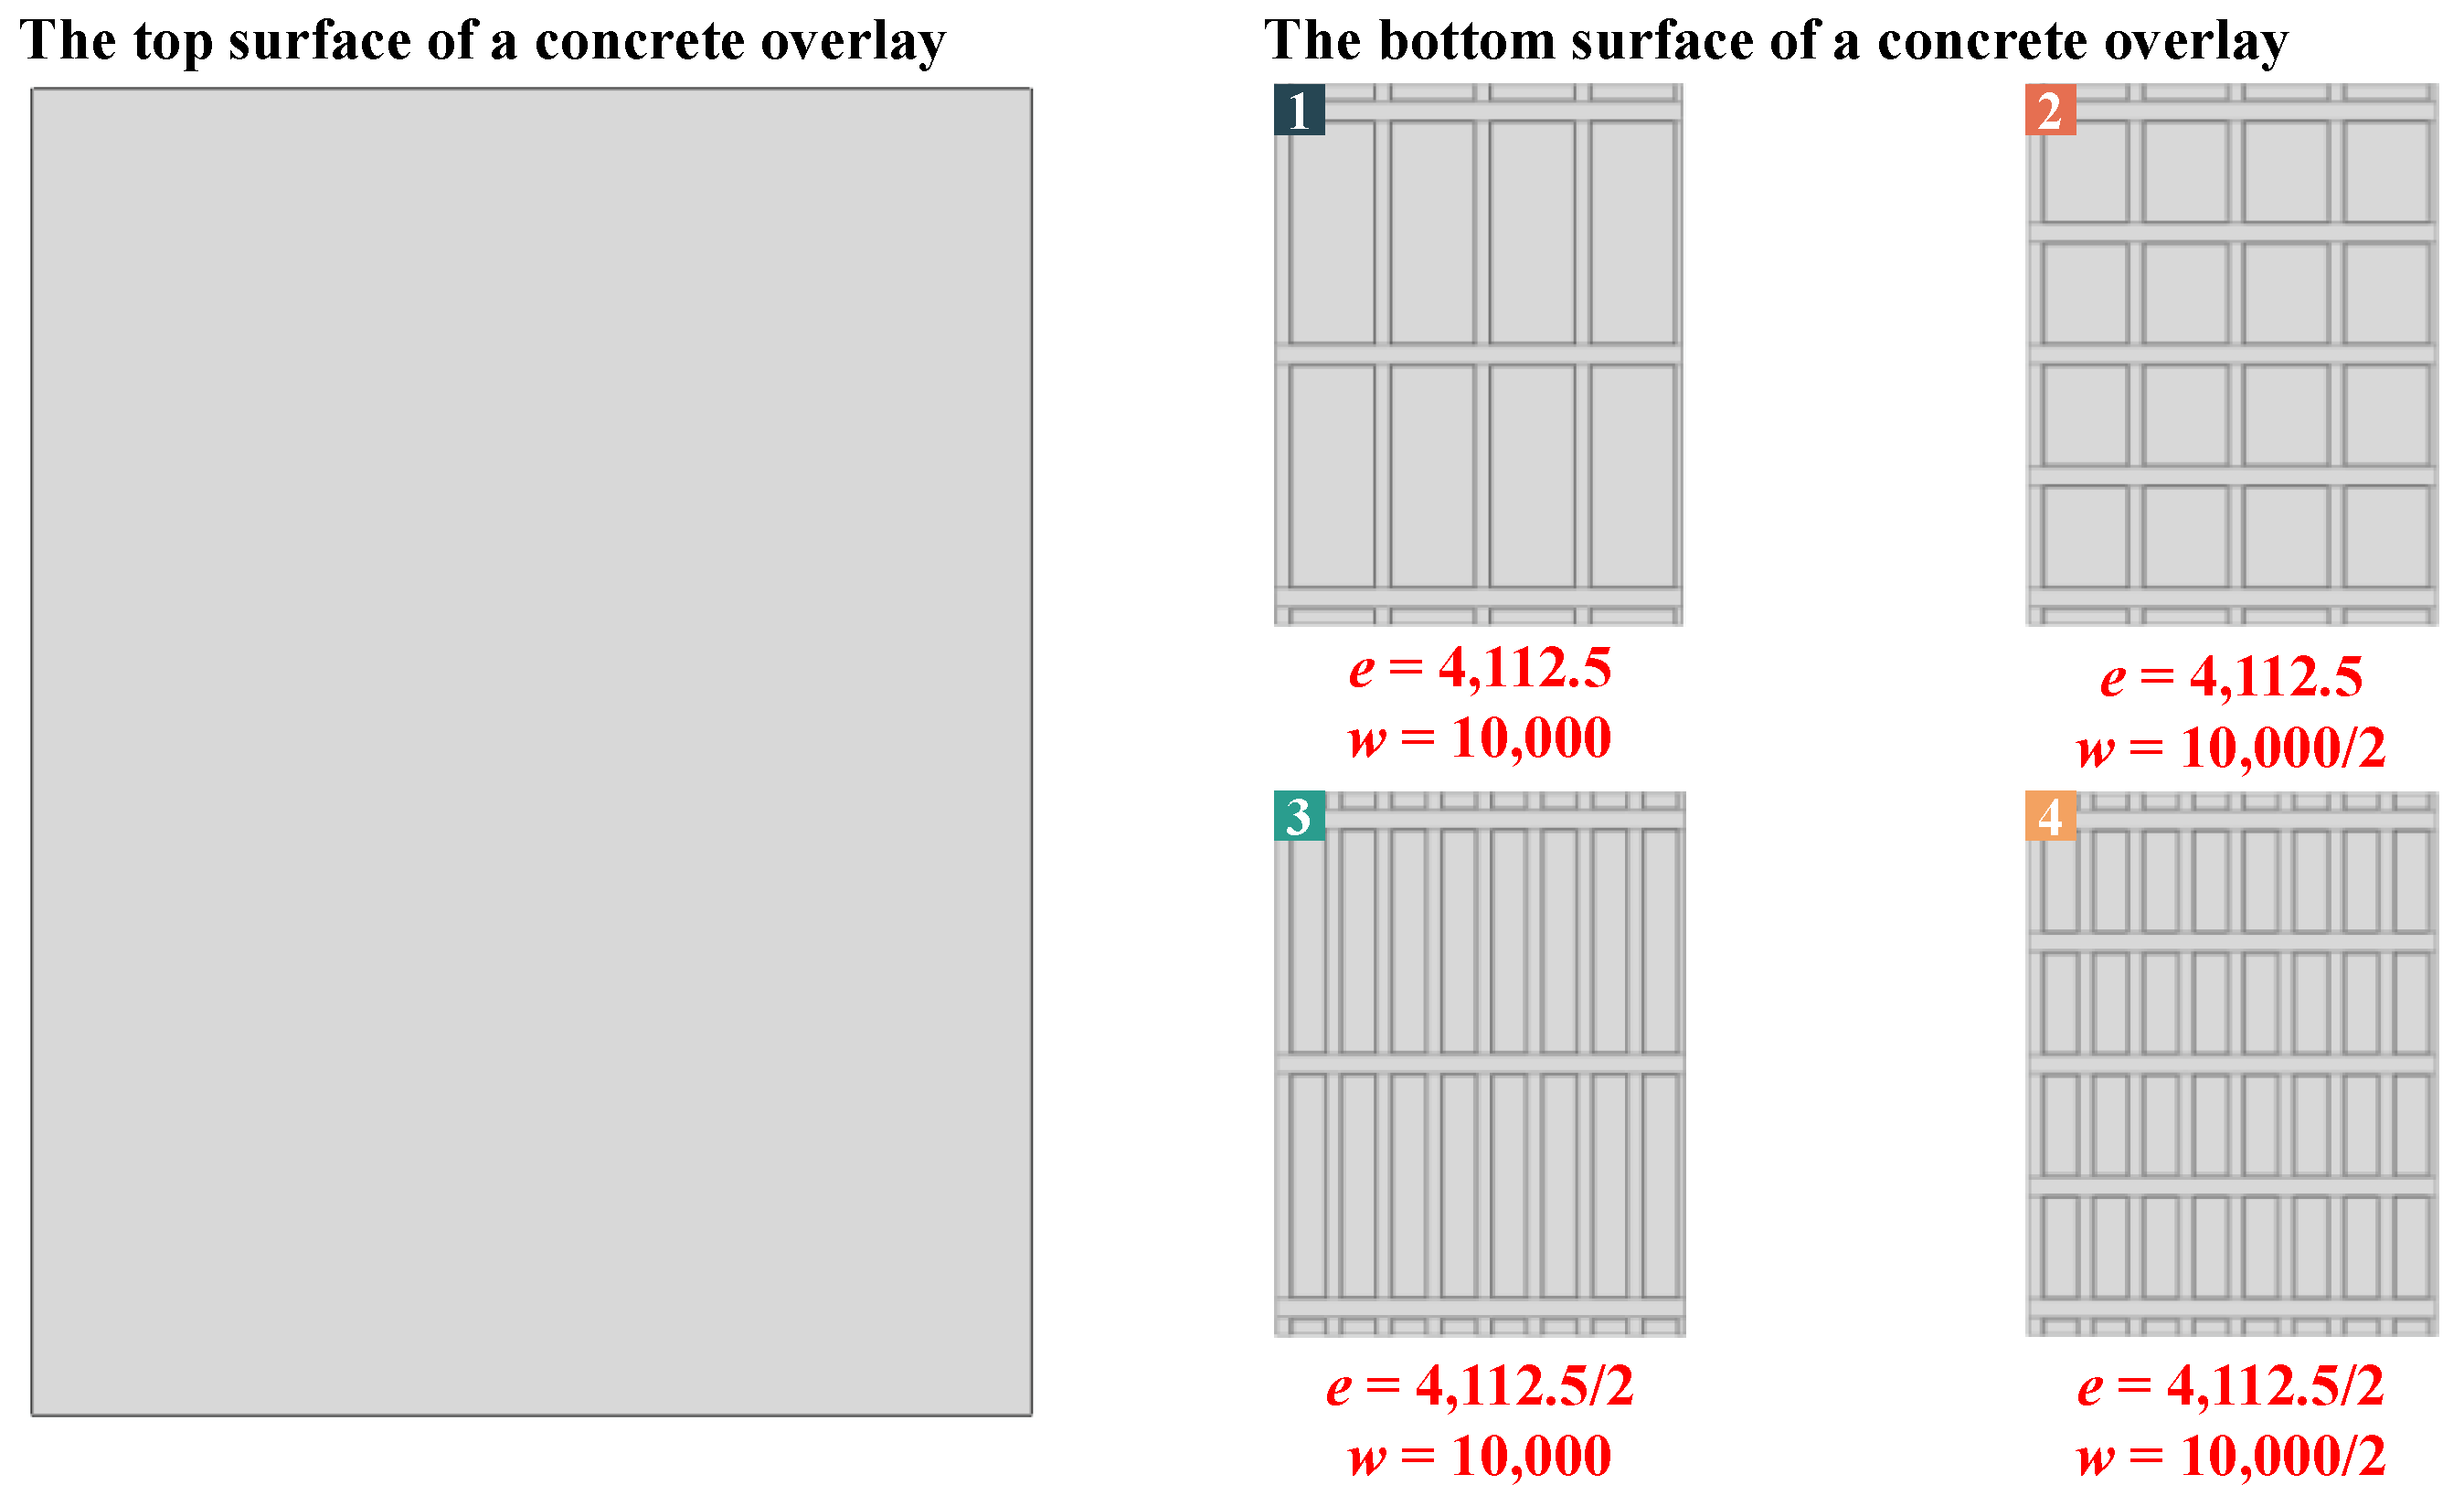
4.4. Influence of Spacing Parameters ( and )
- (a)
- The maximum tensile stress occurs at the mid-span of the bridge, which can be attributed to the peak bending moment experienced at this location.
- (b)
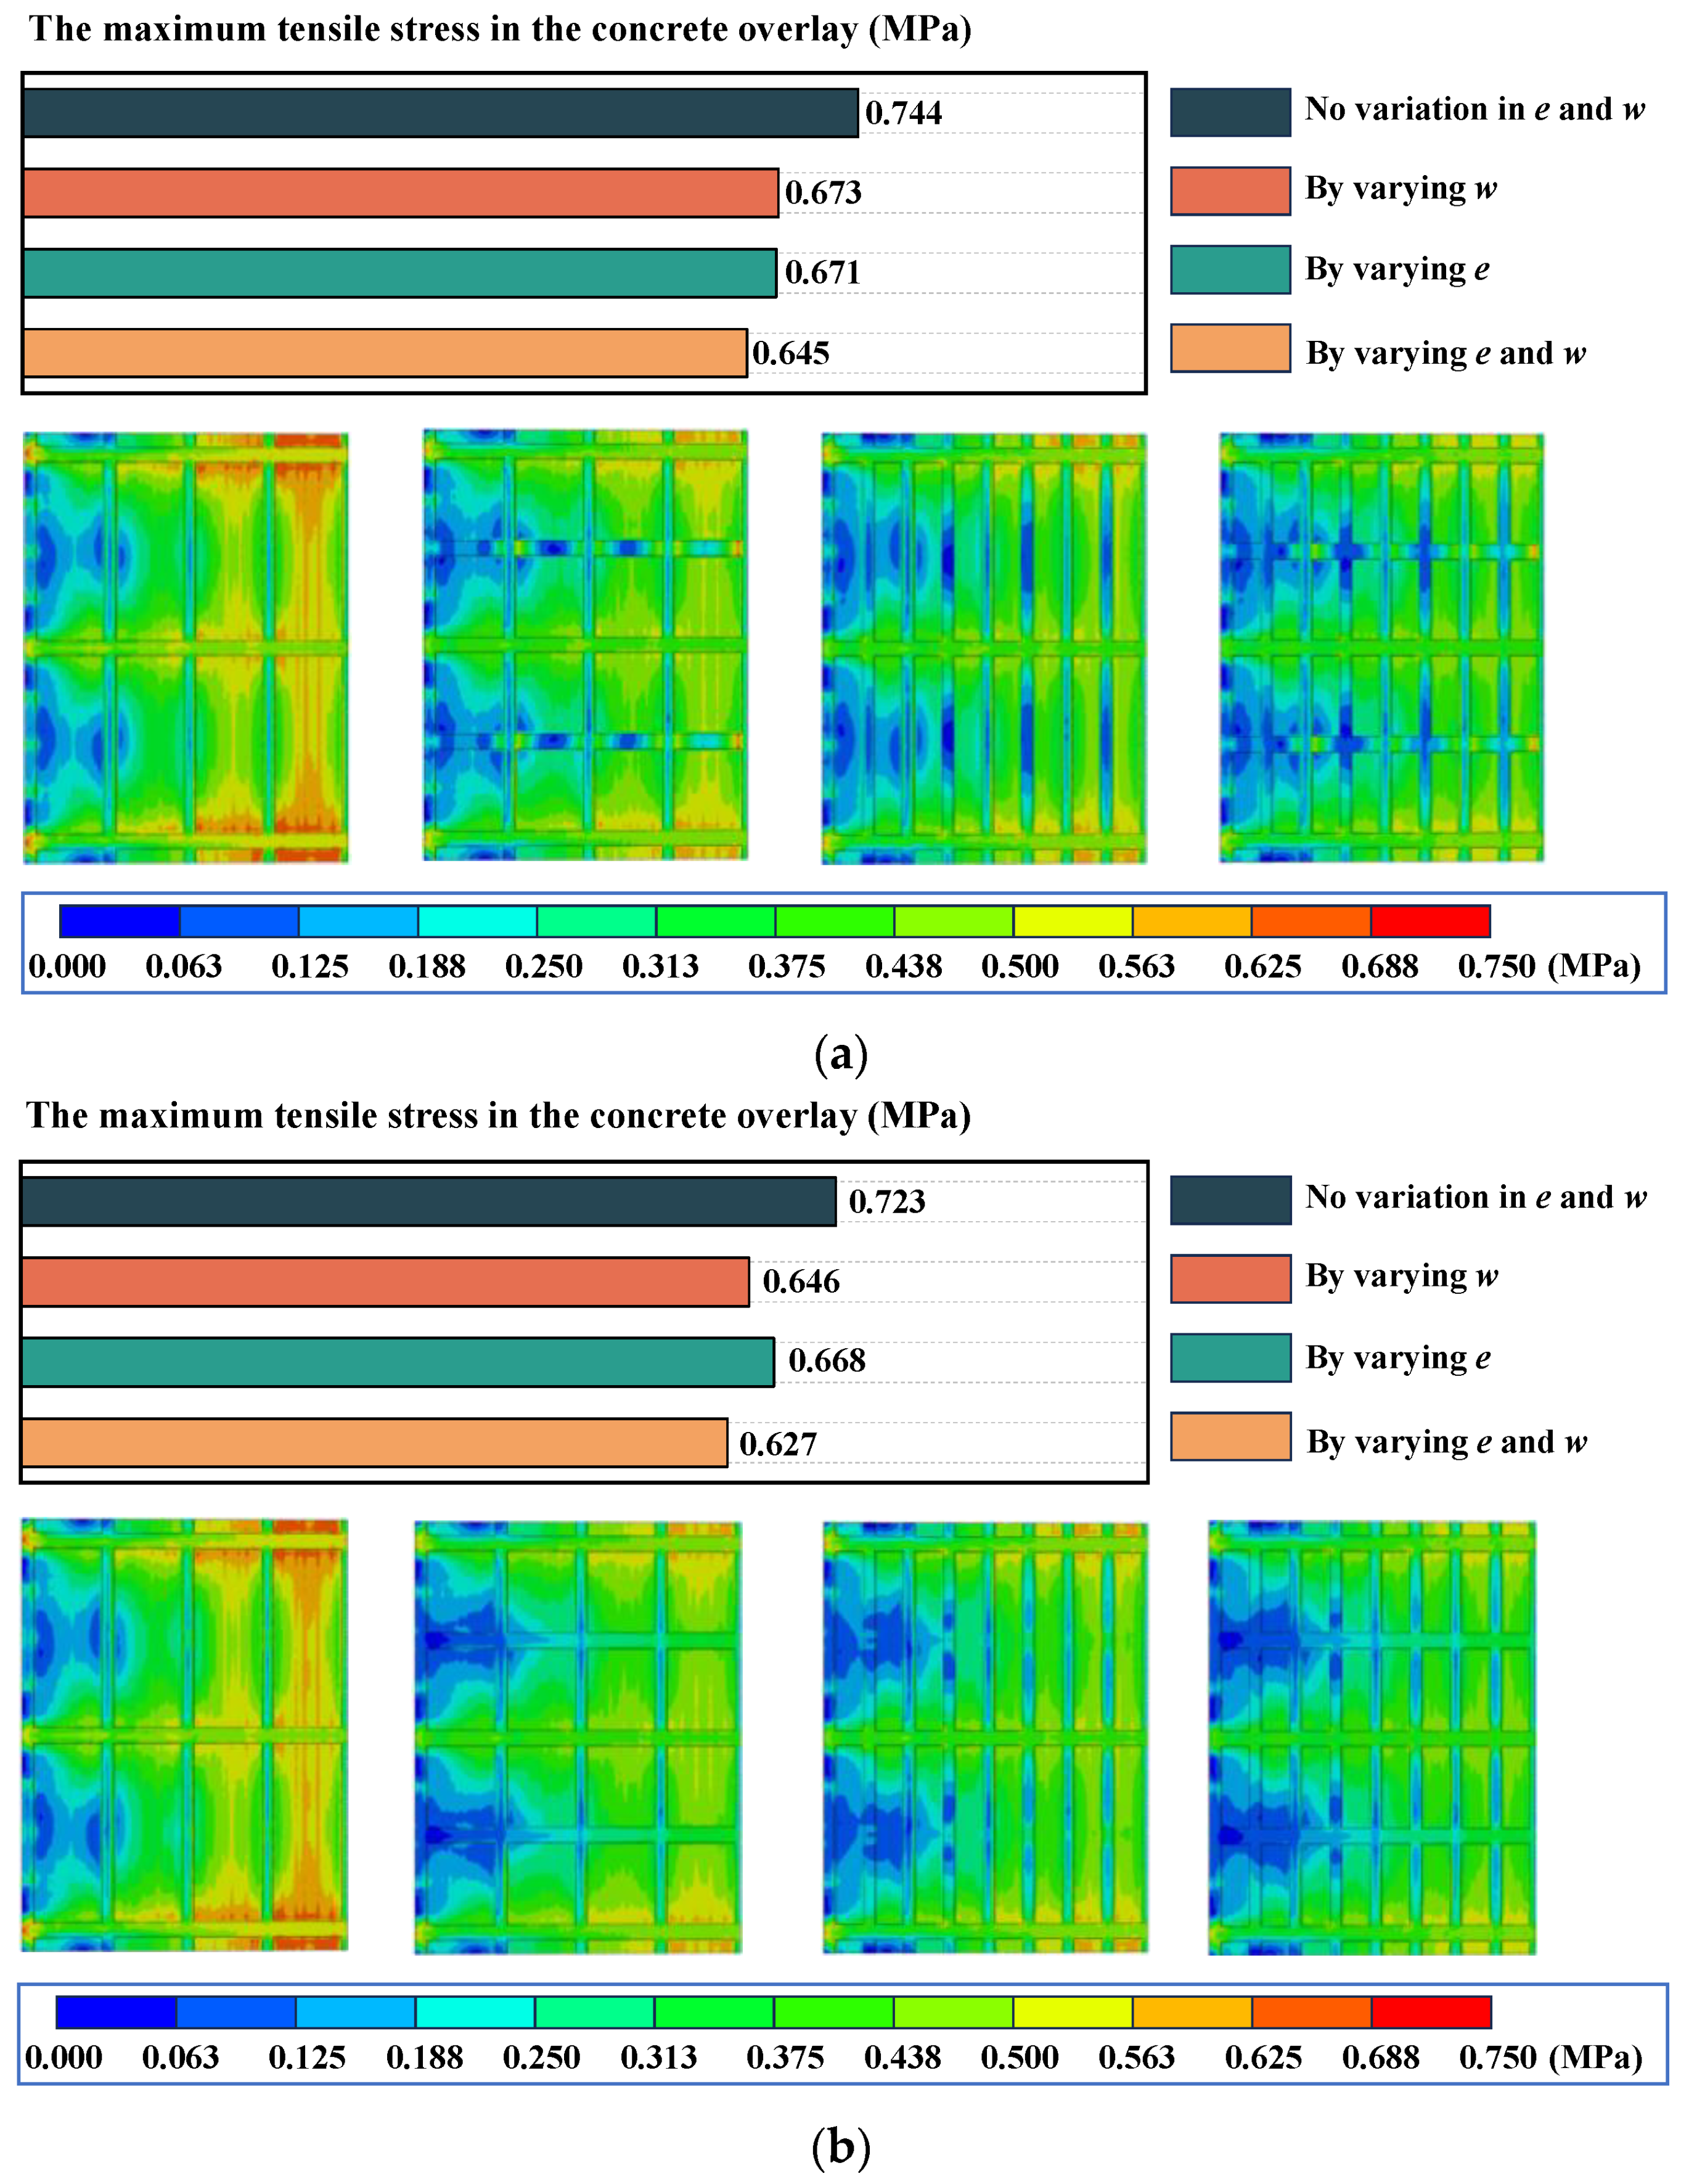
- Keeping the values of parameters and constant, the original BUSP design shows that the maximum tensile stress in the concrete overlays for both Structure 1 and Structure 2 is located outside the U-rib stiffening region.
- (c)
- Concerning Structure 1, altering parameter , i.e., increasing the number of transverse U-ribs, results in a shift of the maximum tensile stress towards the added transverse U-ribs. However, changes in parameter mainly affect the magnitude of the maximum tensile stress, while its location remains similar to the original BUSP design.
- (d)
- For Structure 2, variations in parameters and primarily impact the magnitude of stress rather than its distribution. This distinction is primarily due to the support provided by the secondary beams in the crossbeam system of Structure 2 to the newly added transverse U-ribs, leading to different characteristics when compared to Structure 1.
5. Conclusions
- To achieve cast-in-place construction for the concrete structure of the bridge deck while maintaining the amount of steel used, thin steel plates were added to the original structure, and the crossbeam system was simplified. Finite element (FE) analysis demonstrated that the improved structure exhibited higher panel stiffness compared to the original design. Furthermore, the application of BUSP further increased the stiffness of the concrete overlay. Compared to the original design, it respectively reduced the maximum vertical displacement of the concrete overlay and the maximum tensile stress by 10.27% and 29.69%.
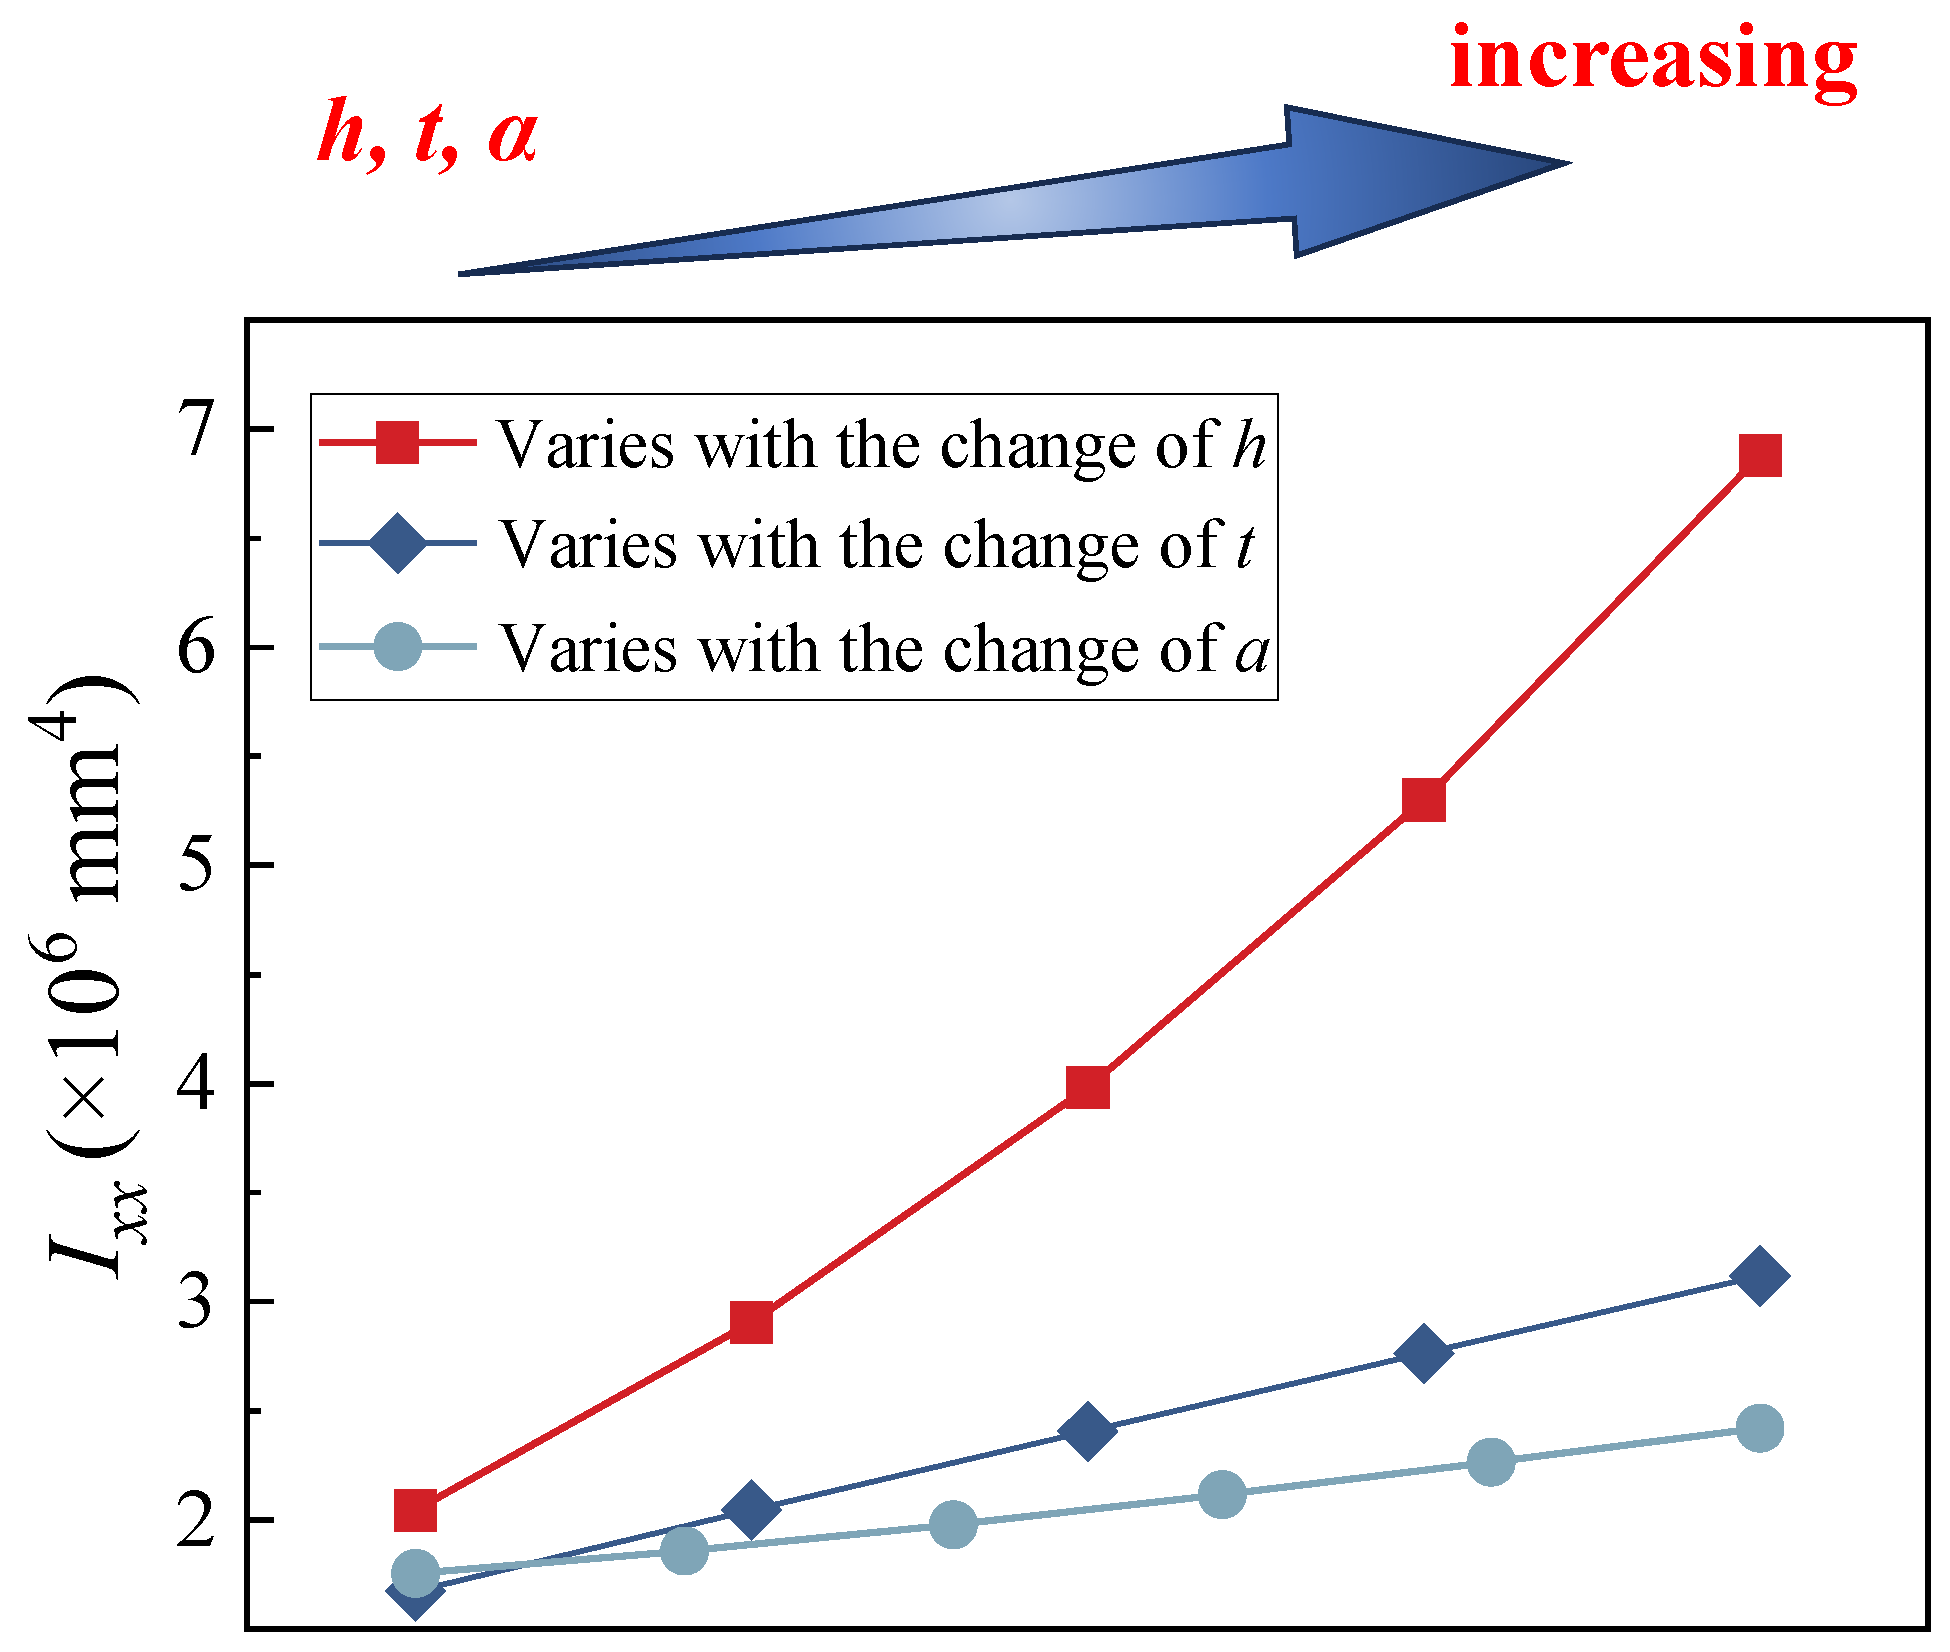
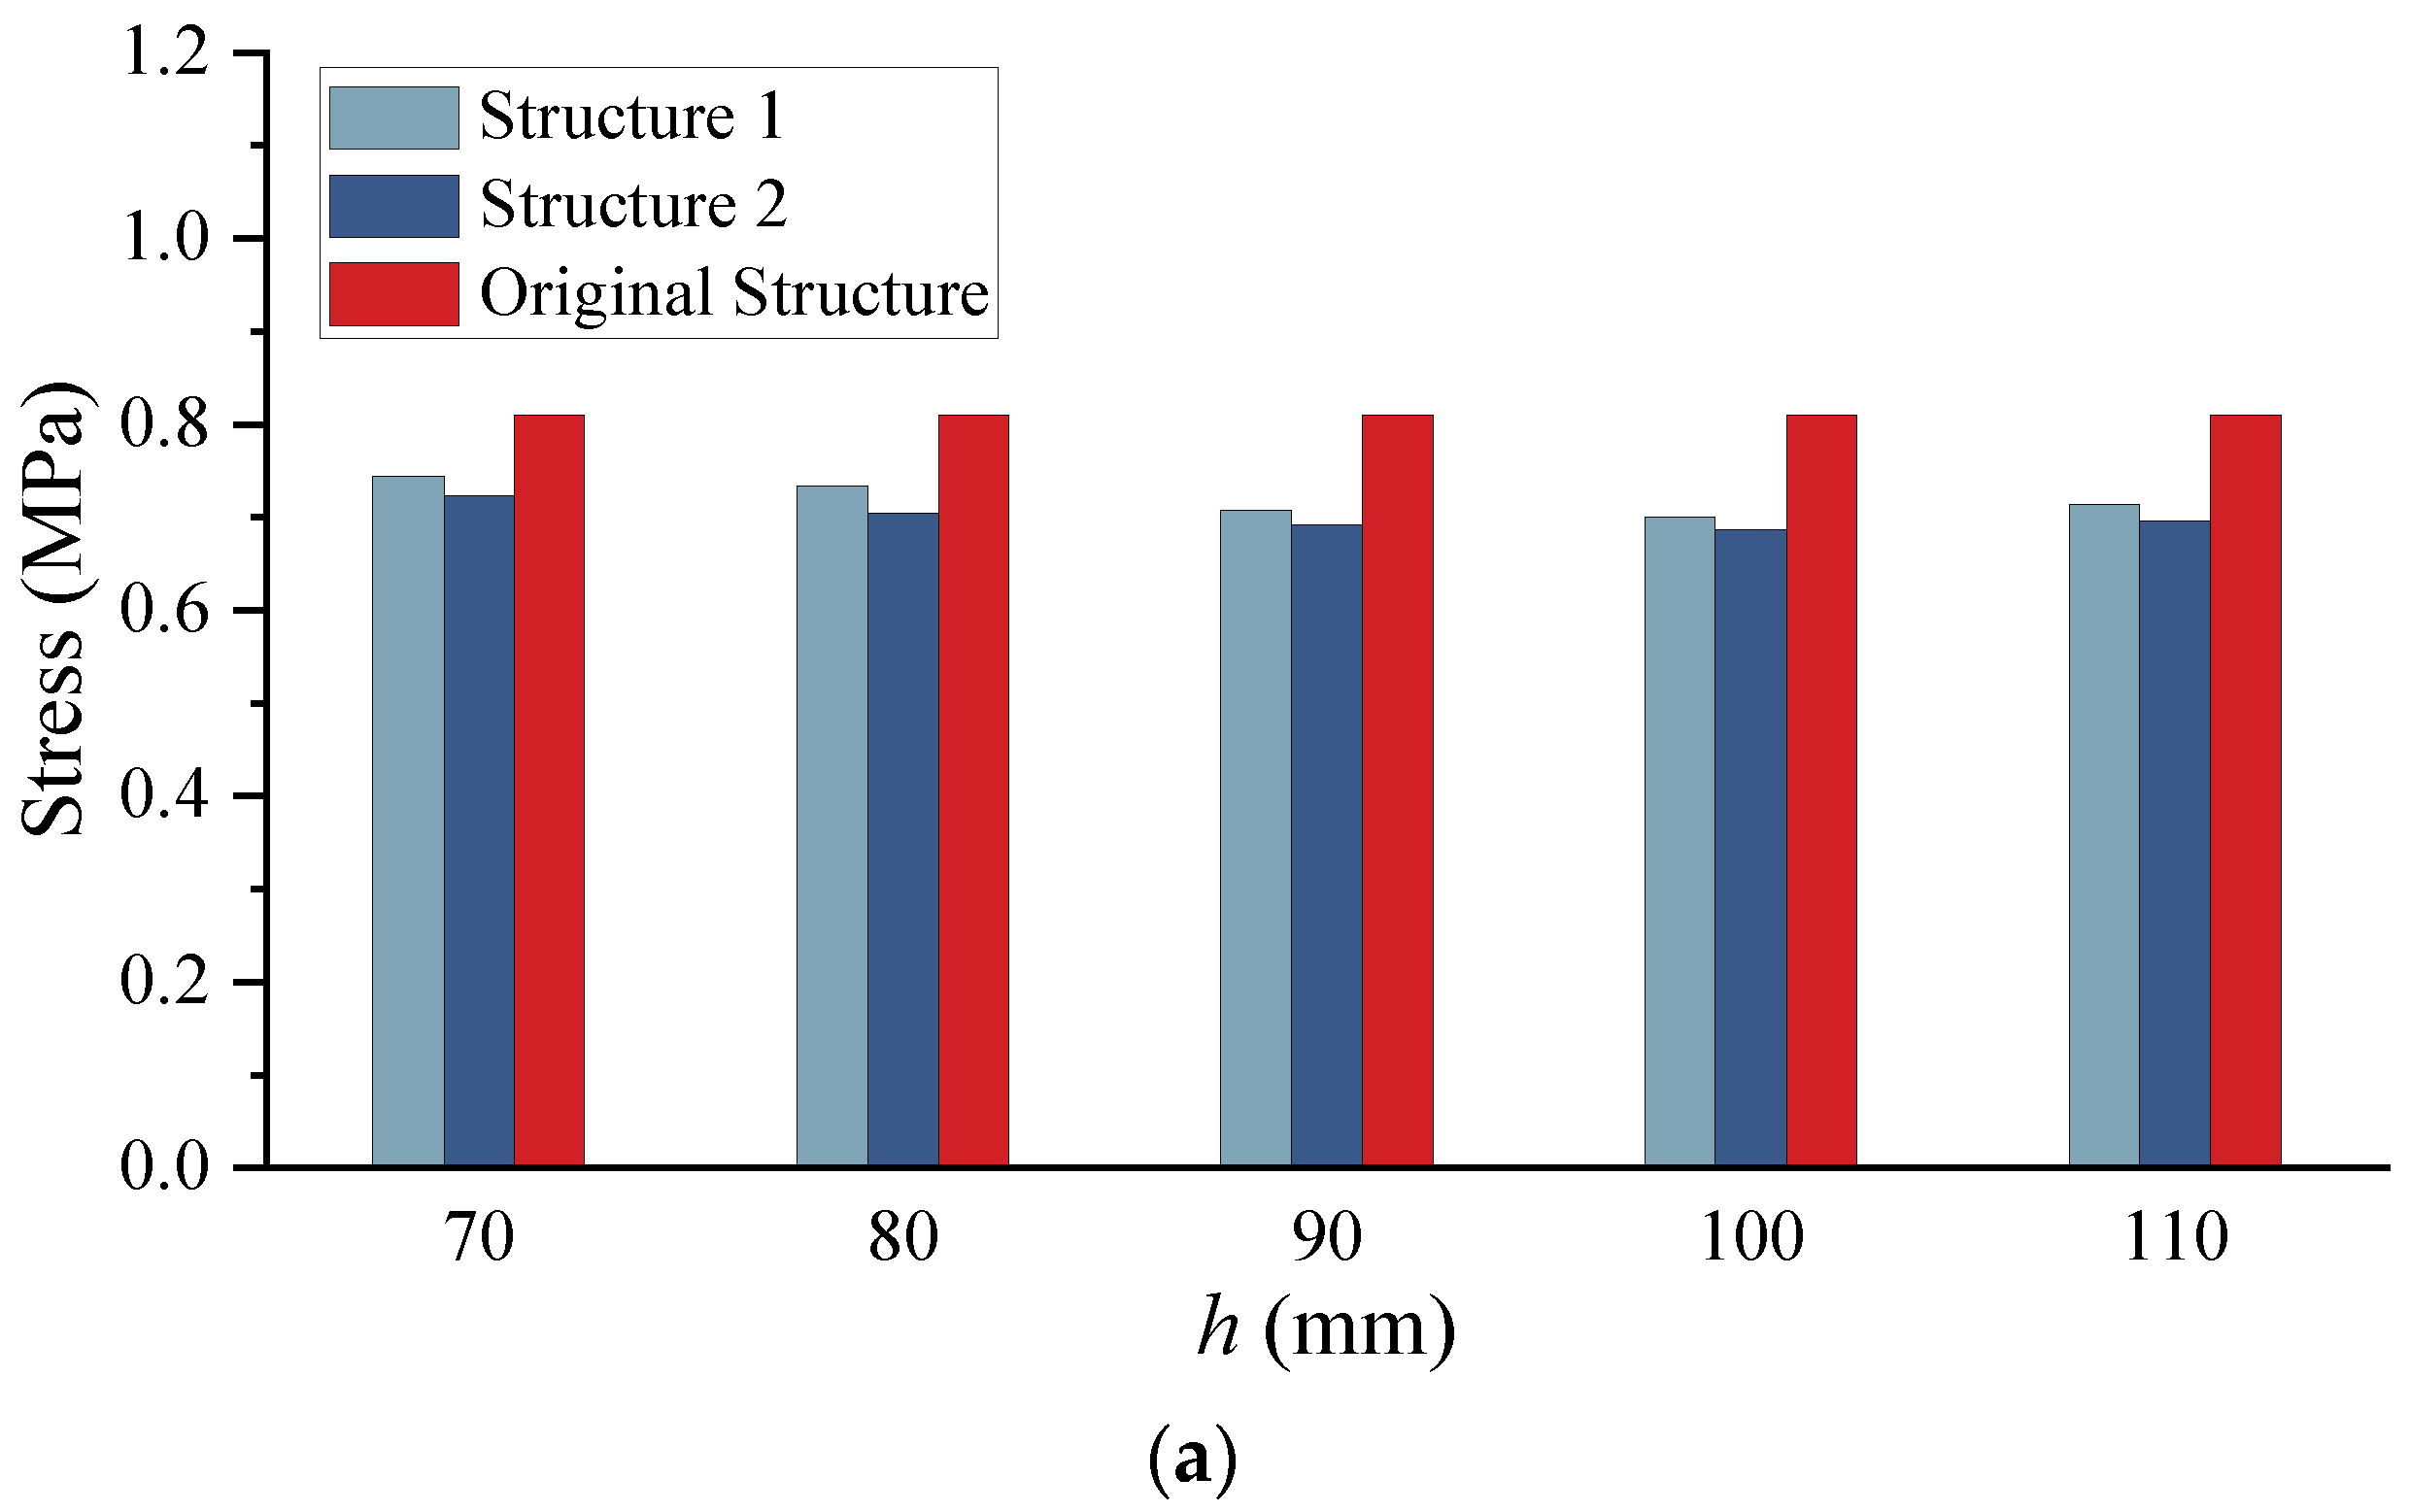
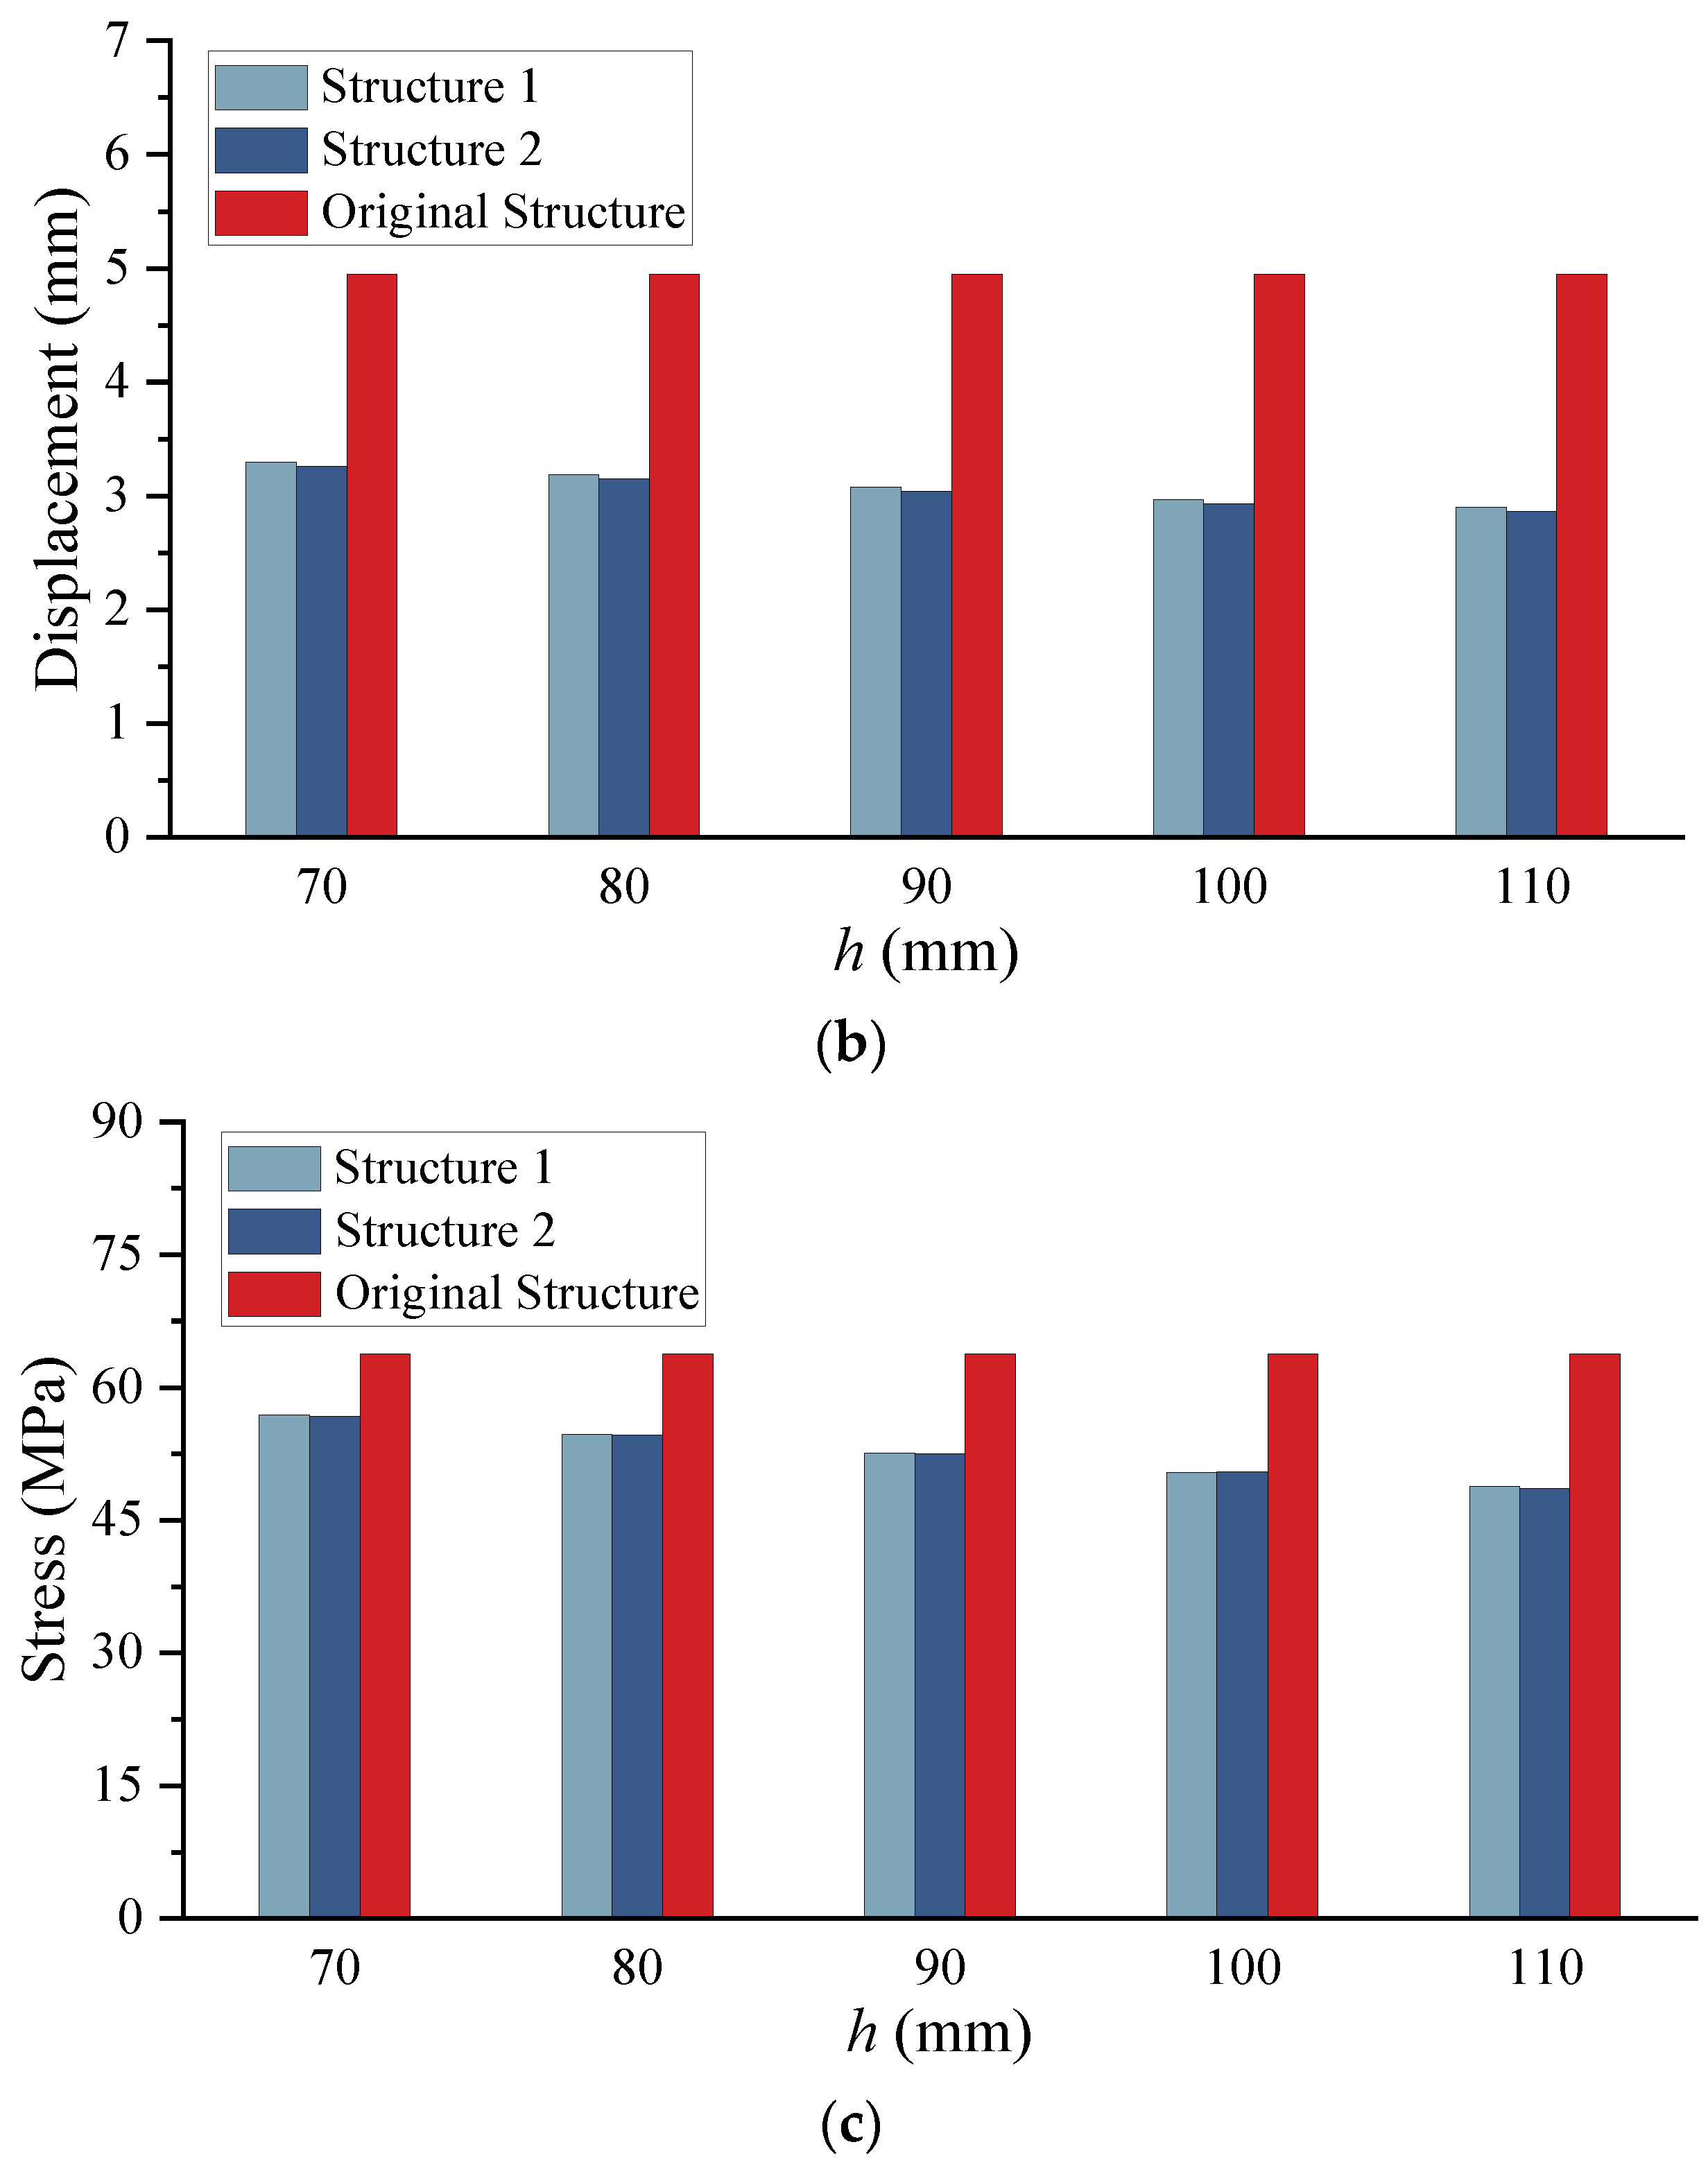
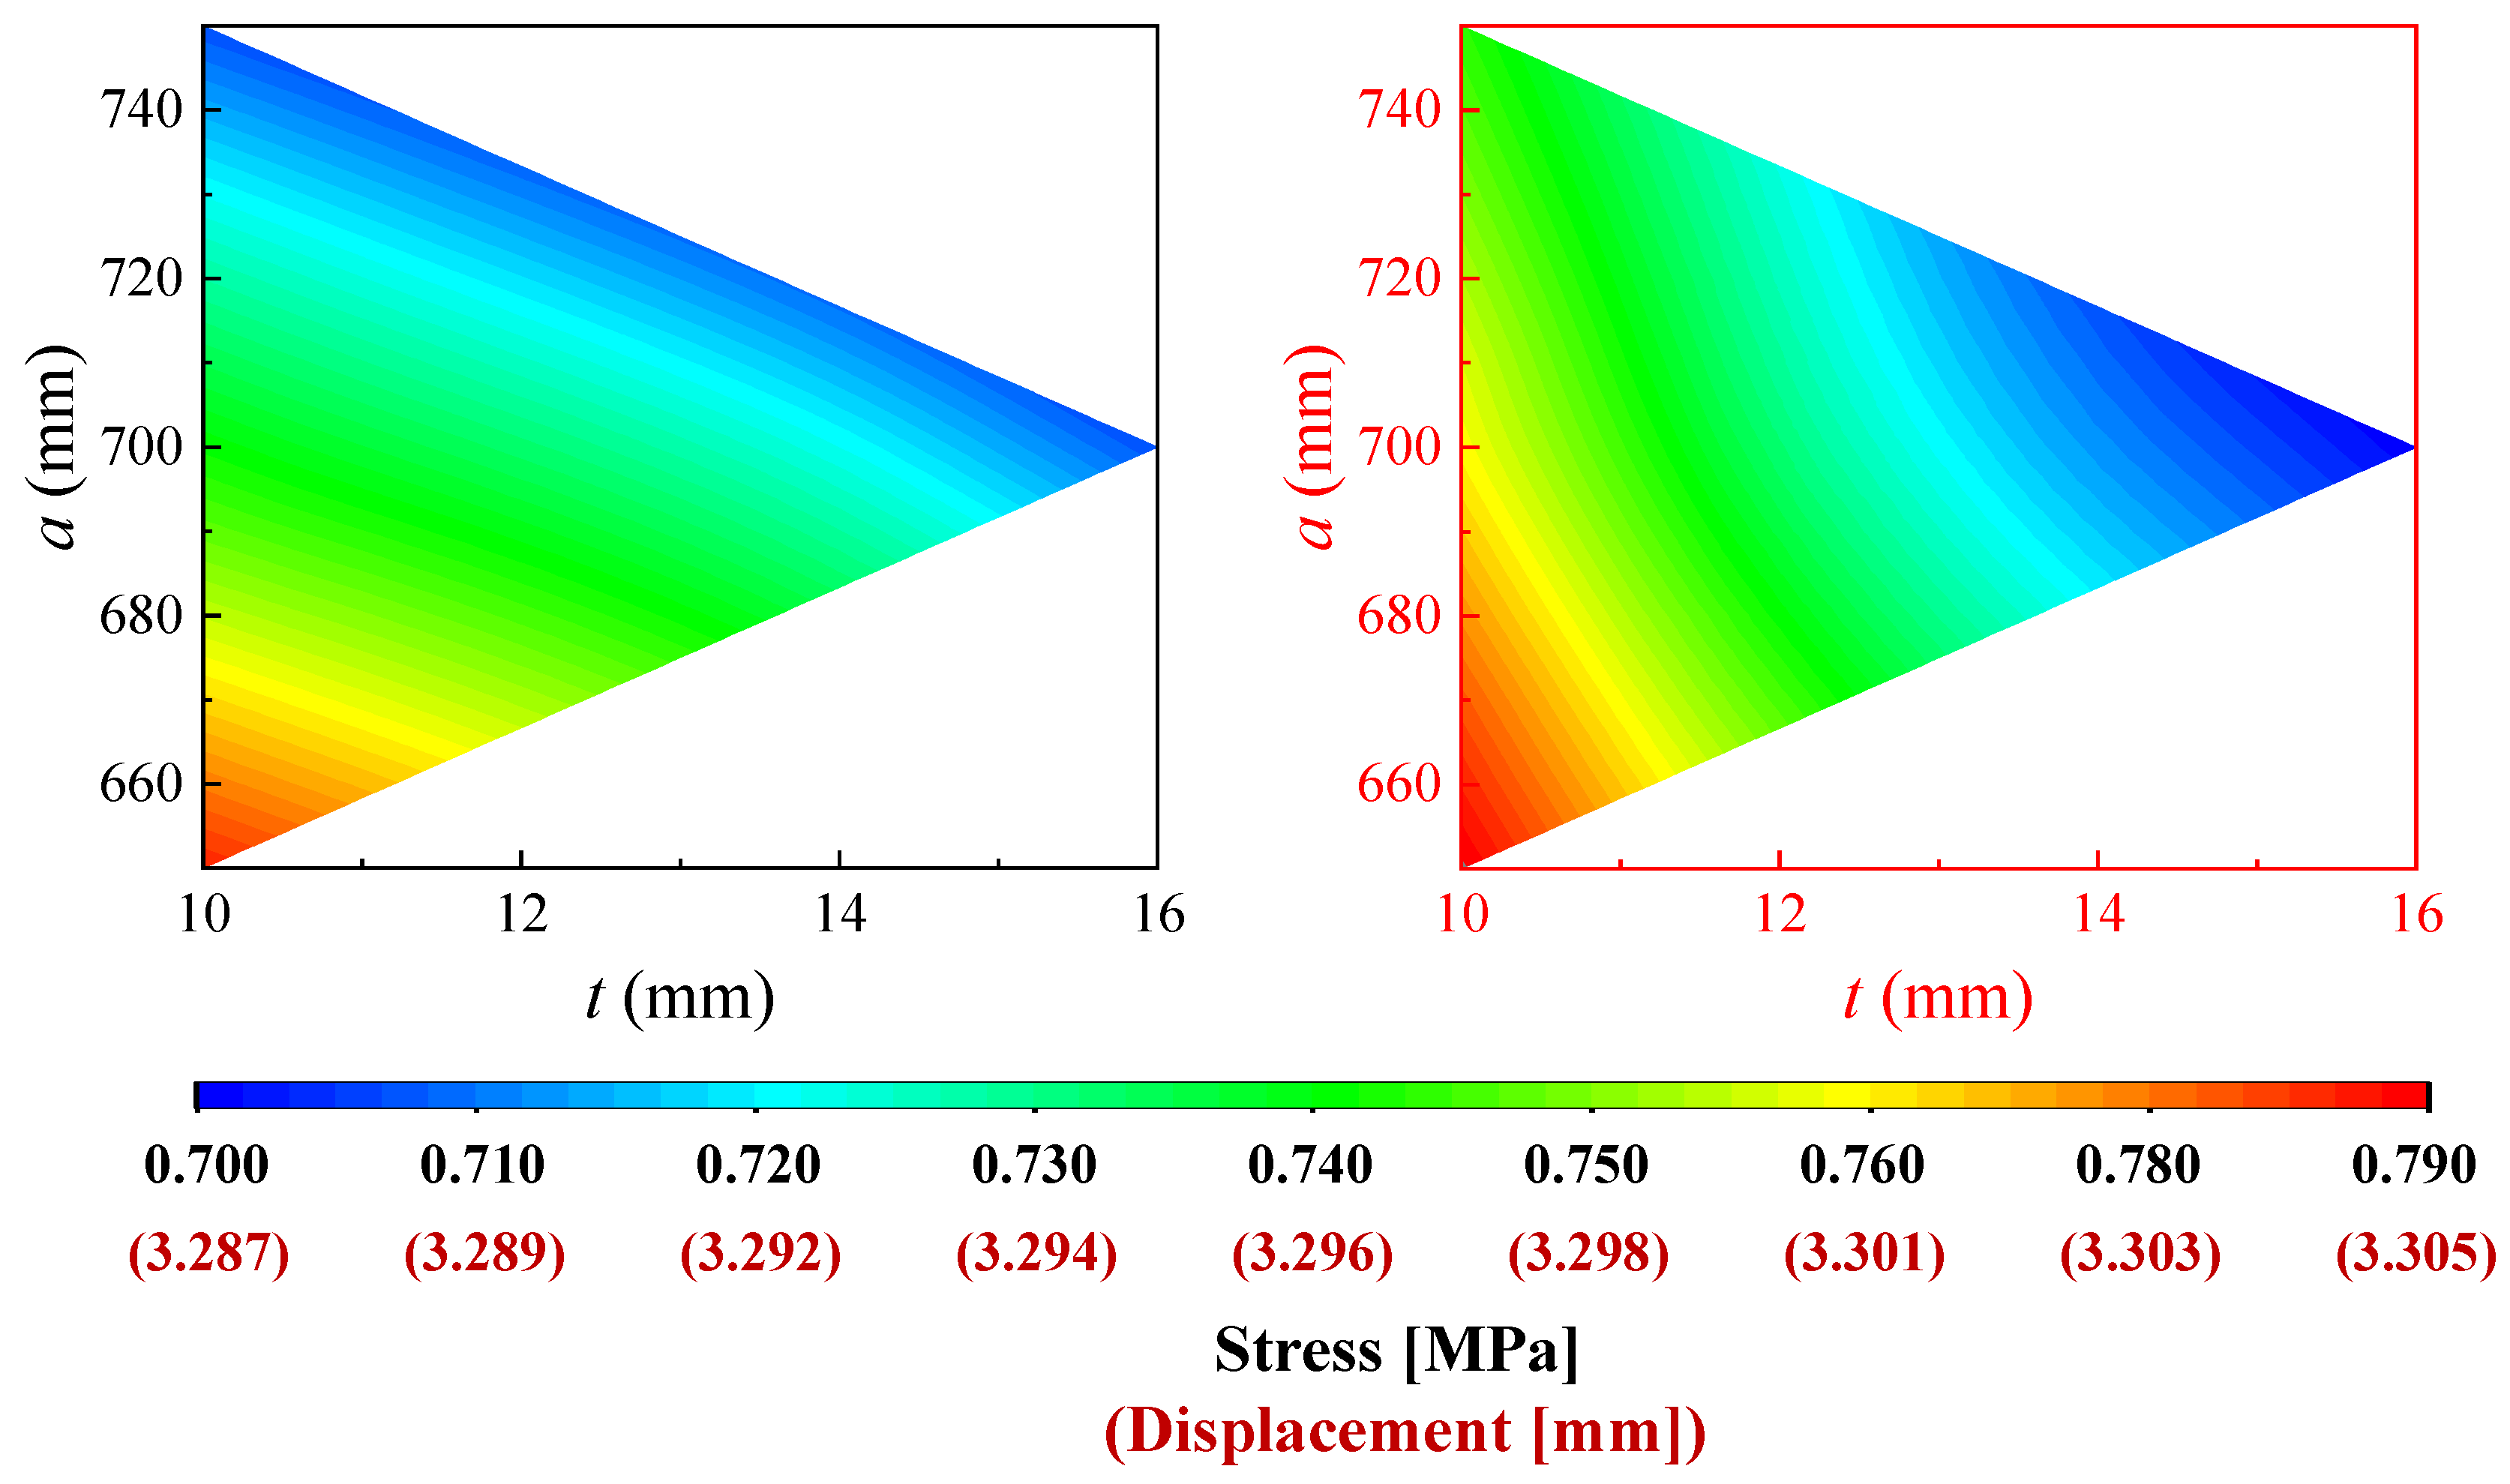
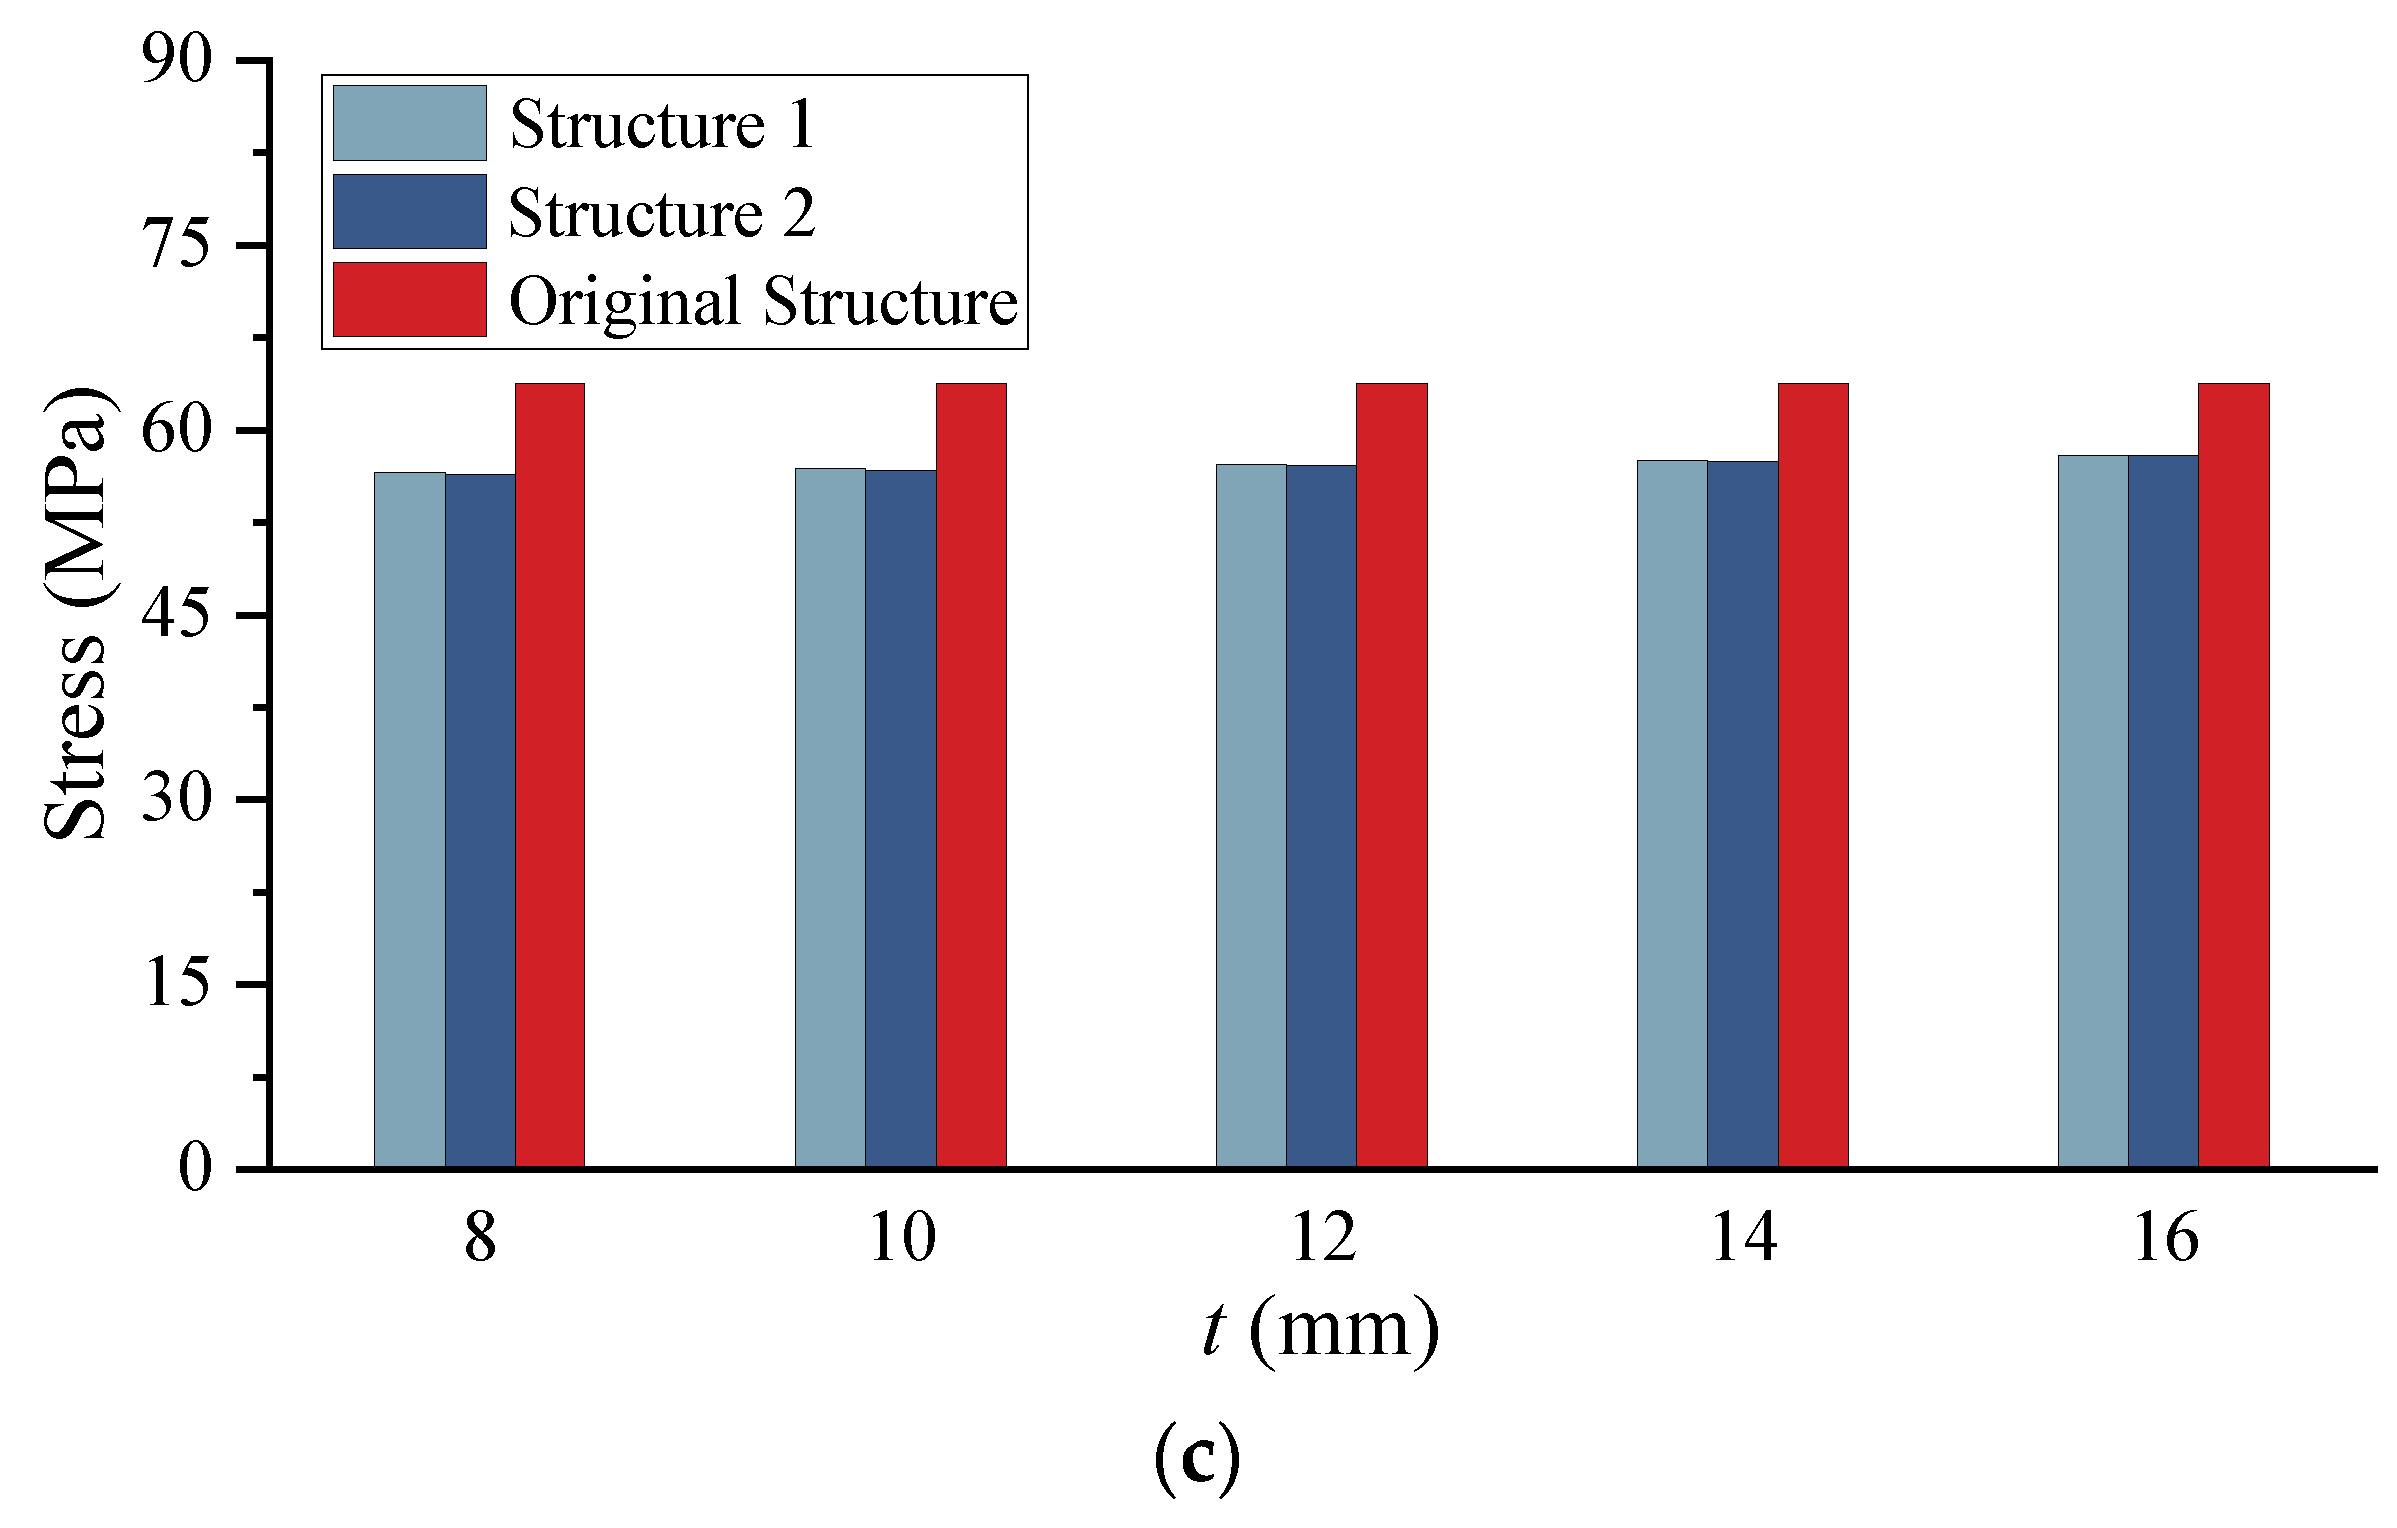
- When considering size parameters (, , and ) of a single U-rib of BUSP, it was observed that both the maximum tensile stress and maximum vertical displacement of the concrete overlay decrease with increasing and . Additionally, for values not exceeding 100 mm, stress and displacement also decrease with increasing . Compared to the original design, adjusting values of these three size parameters can reduce the maximum tensile stress of the concrete overlay by 15%. However, considering the quantities of steel and concrete used, adjusting the value can be considered the most effective method for enhancing the mechanical performance of BUSP.
- By examining combinations of the three parameters (, , and ), their influence on the maximum tensile stress and maximum vertical displacement of the concrete overlay was compared. The research findings indicate that parameter has the greatest impact on the stress of the concrete overlay, while parameter has the greatest impact on vertical displacement.
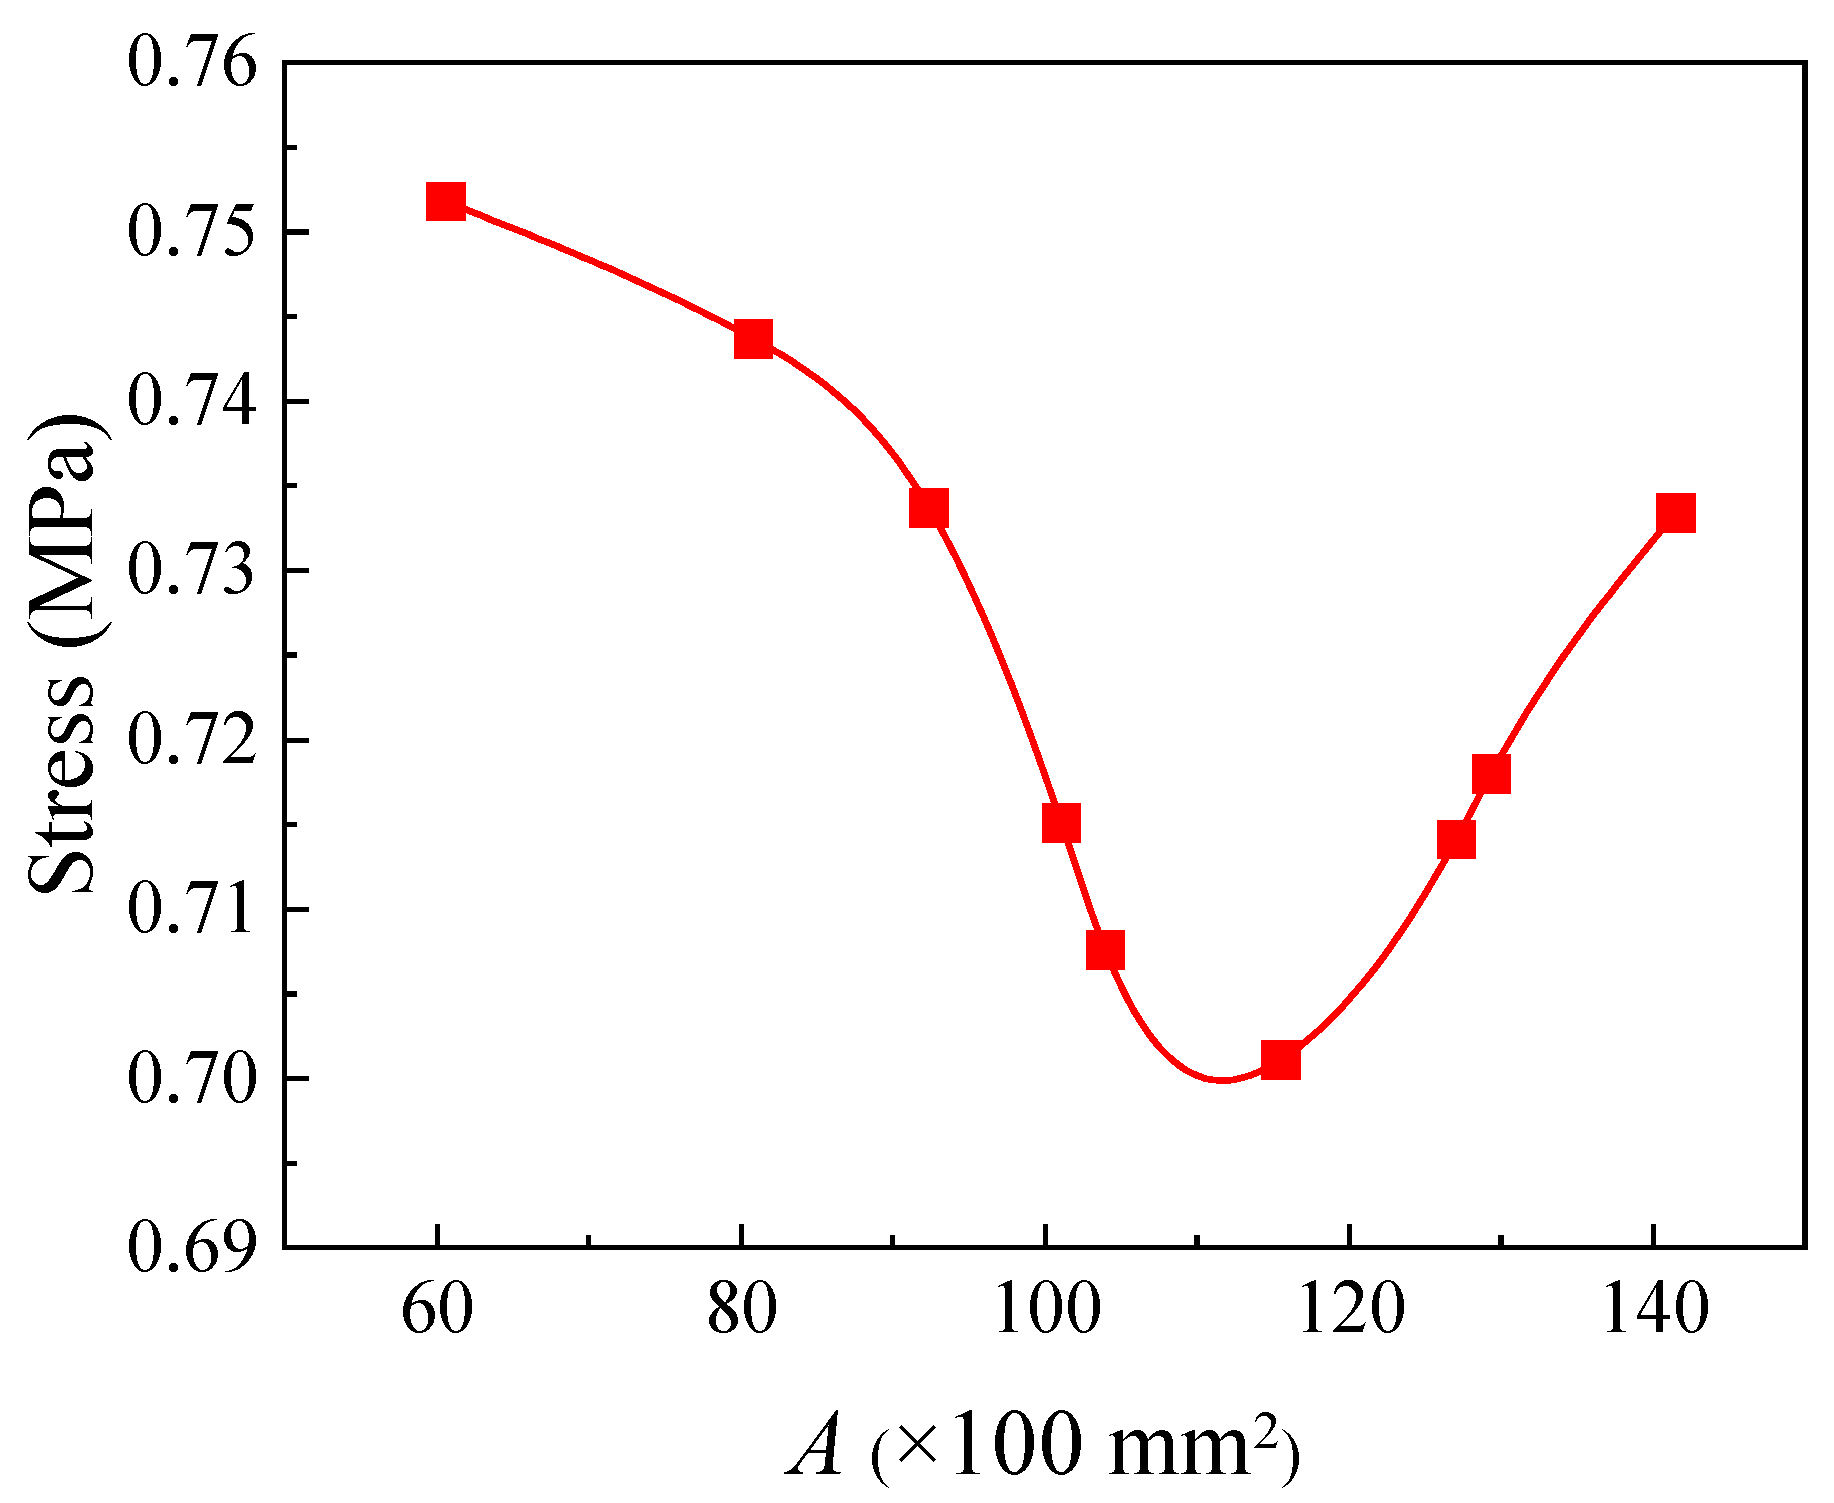
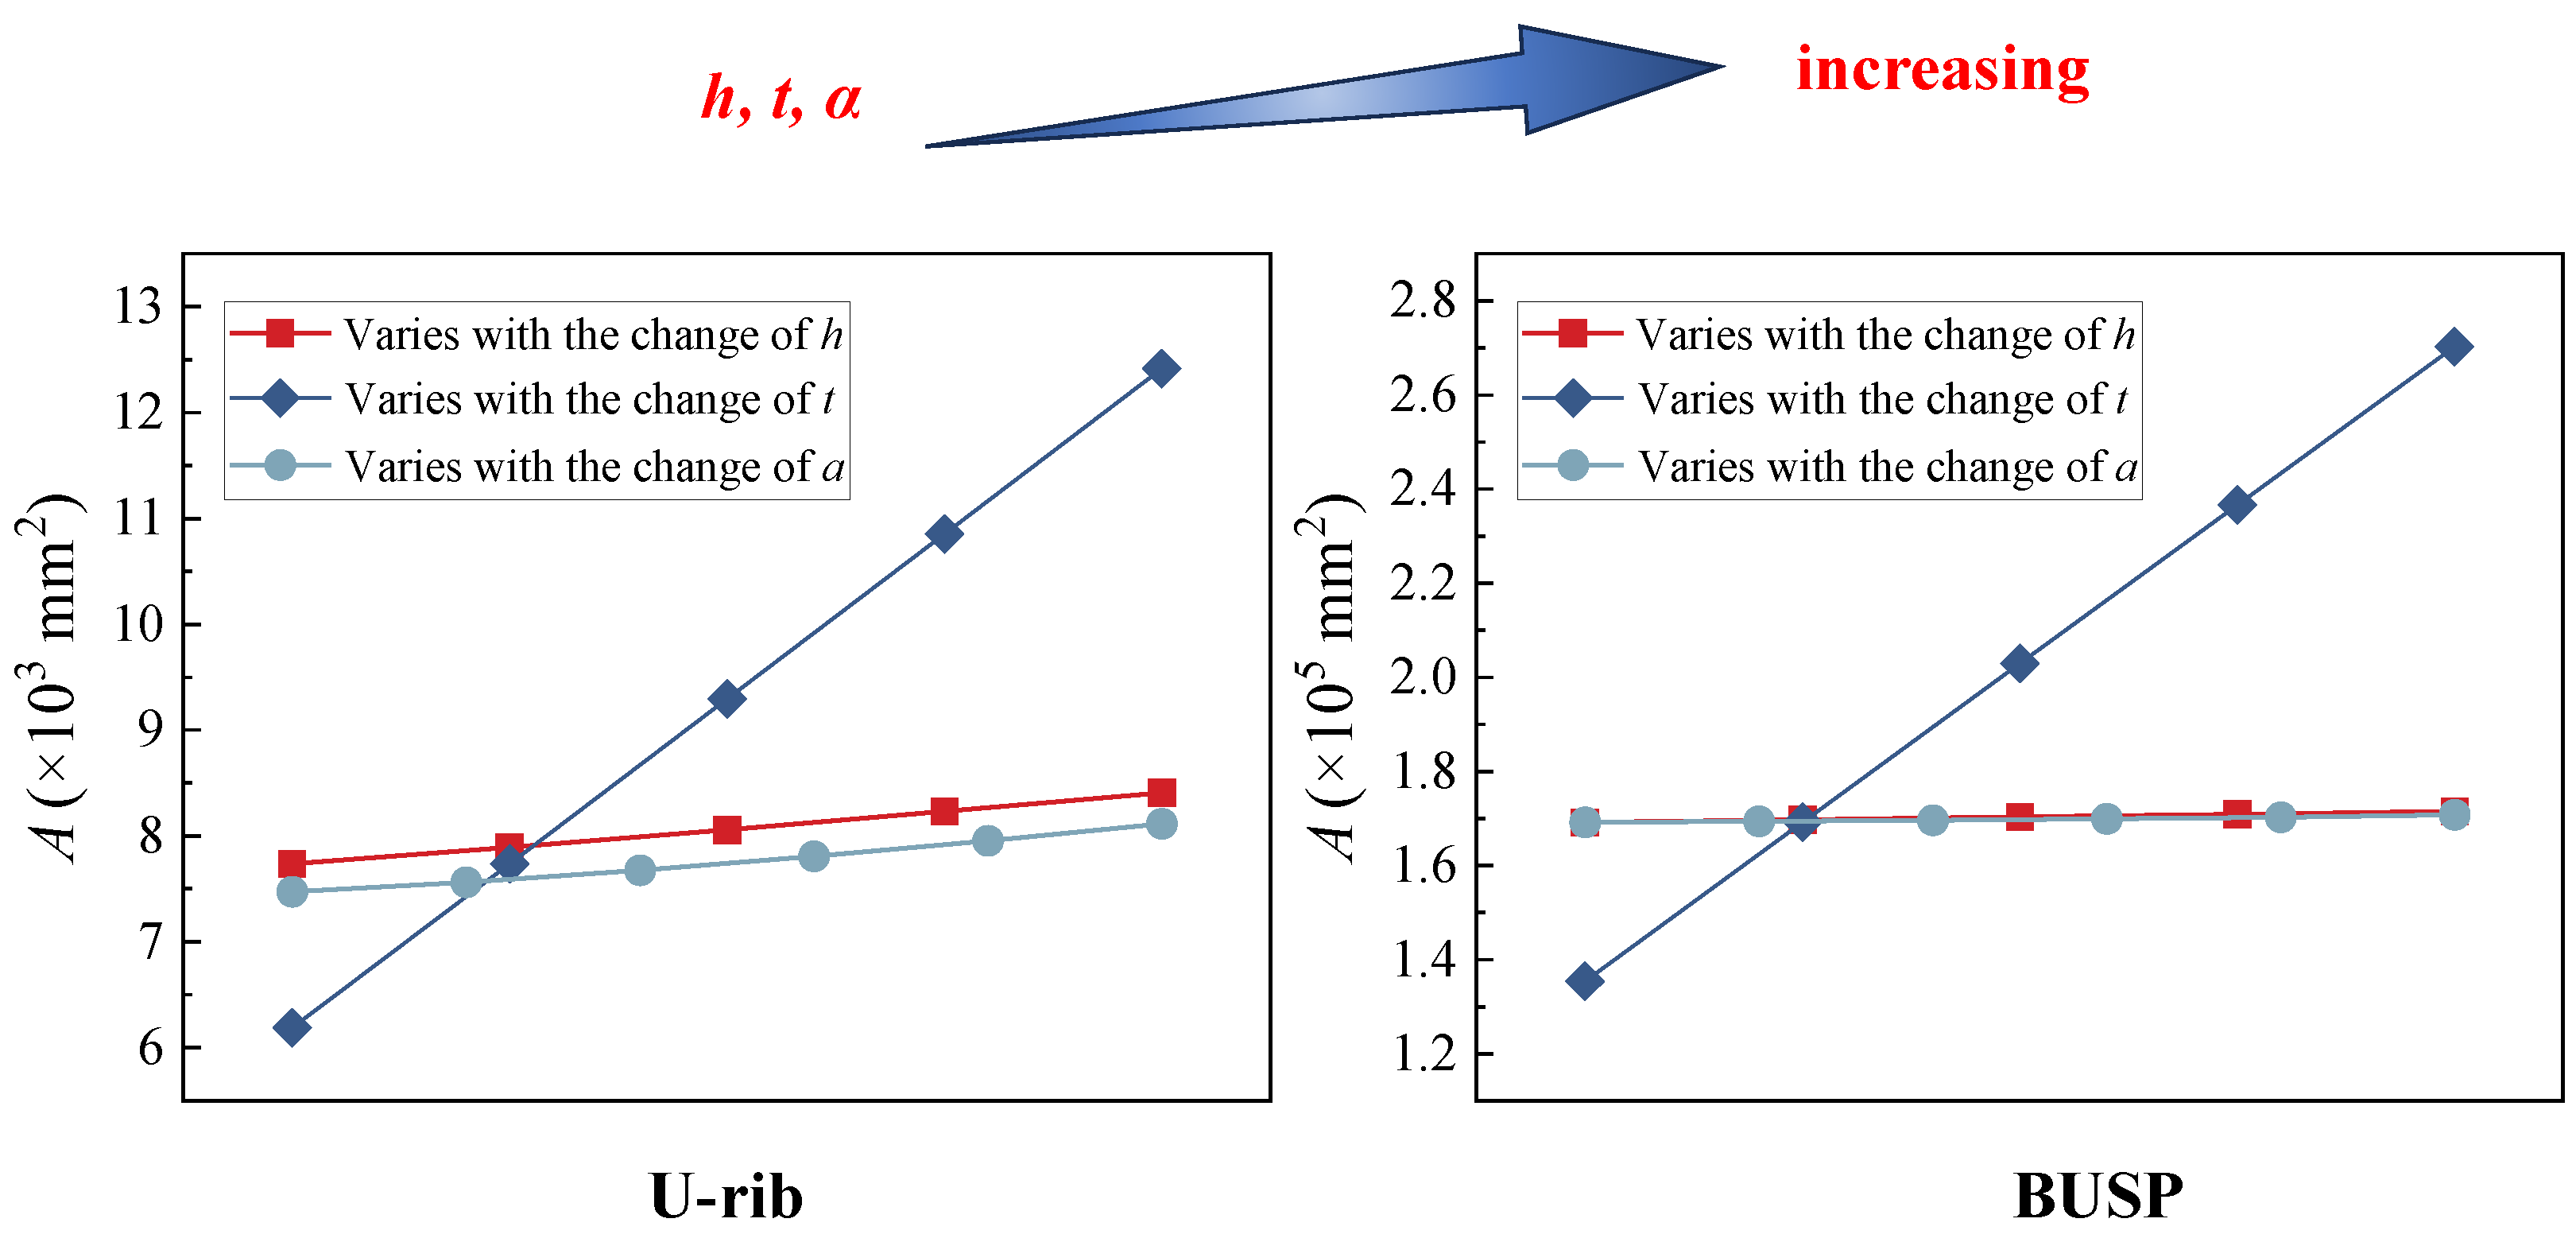
- To investigate the combined effects of parameters , , and , the parameter , representing the area of the BUSP, was introduced. The results revealed that the minimum tensile stress of the concrete overlay is achieved when the value of is approximately 11,000 mm2.
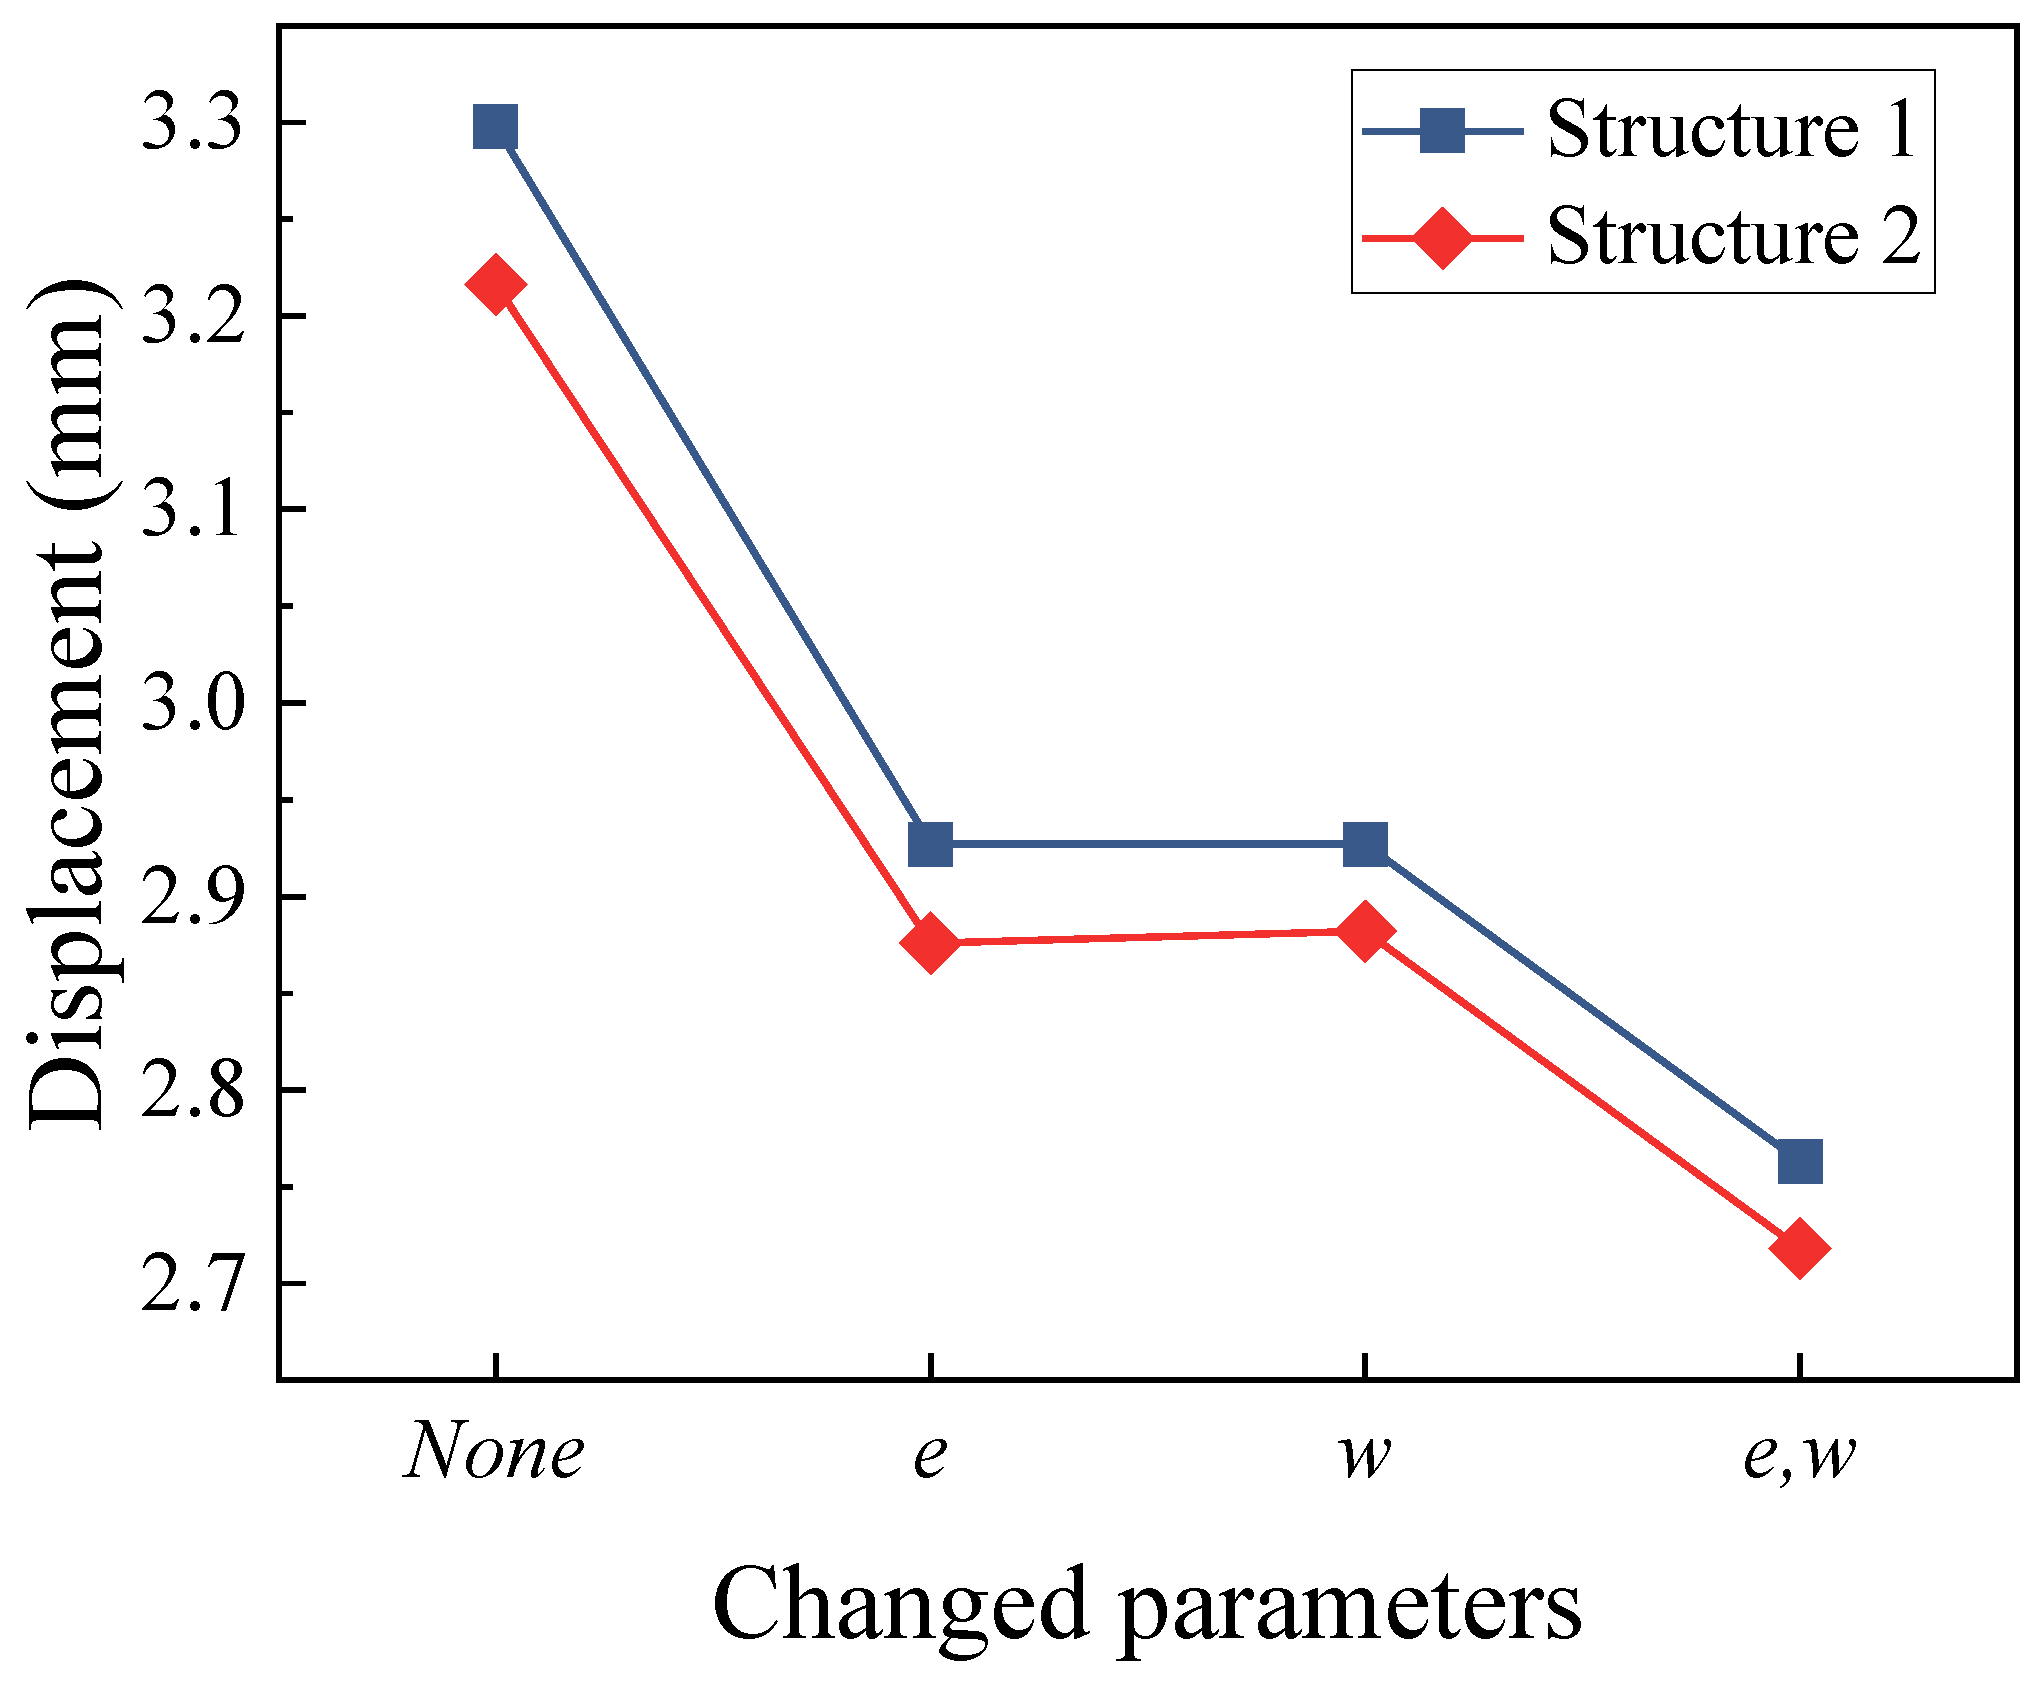
- Reducing spacing parameters ( and ) can also enhance the mechanical performance of the BUSP. When only reducing the value of either or by half, the maximum vertical displacement and tensile stress of the concrete overlay can be reduced by approximately 10%. Furthermore, when simultaneously reducing the values of both and , the reduction magnitude can reach 15% or more. However, this improvement comes at the expense of increased construction difficulty and material expenses, as it requires the addition of extra U-ribs in the transverse or longitudinal direction of the bridge.
- These findings contribute to a better understanding of the mechanical behavior of BUSP and offer insights for optimizing its design parameters to enhance its performance while considering construction feasibility and cost-effectiveness.
Author Contributions
Funding
Institutional Review Board Statement
Informed Consent Statement
Data Availability Statement
Acknowledgments
Conflicts of Interest
References
- Kong, F.; Huang, P.; Han, B.; Wang, X.; Liu, C. Experimental study on behavior of corrugated steel-concrete composite bridge decks with MCL shape composite dowels. Eng. Struct. 2021, 227, 111399. [Google Scholar] [CrossRef]
- Li, F.; Liu, B.; Sun, H.; He, W.; Wang, X. A novel corrugated steel plate-rubberized concrete composite slab: Properties and application opportunities. Structures 2022, 43, 1492–1502. [Google Scholar] [CrossRef]
- Nie, J.; Wang, J.; Gou, S.; Zhu, Y.; Fan, J. Technological development and engineering applications of novel steel-concrete composite structures. Front. Struct. Civ. Eng. 2019, 13, 1–14. [Google Scholar] [CrossRef]
- Zhang, H.-S.; Zhao, Y.; Ruan, J.; Nie, X.; Fan, J.-S.; Liu, Y.-F. Experiment study on temperature field and effect on steel-concrete composite bridge towers. Structures 2023, 50, 937–953. [Google Scholar] [CrossRef]
- Zhang, Z.; Liu, Y.; Liu, J.; Xin, G.; Long, G.; Zhang, T. Experimental study and analysis for the long-term behavior of the steel–concrete composite girder bridge. Structures 2023, 51, 1305–1327. [Google Scholar] [CrossRef]
- Briseghella, B.; Fa, G.; Aloisio, A.; Pasca, D.; He, L.; Fenu, L.; Gentile, C. Dynamic characteristics of a curved steel–concrete composite cable-stayed bridge and effects of different design choices. Structures 2021, 34, 4669–4681. [Google Scholar] [CrossRef]
- Du, H.; Pan, J.; Shen, H.; Dong, J. Numerical Analysis of Flexural Behavior of Prestressed Steel-Concrete Continuous Composite Beams Based on BP Neural Network. Comput. Intell. Neurosci. 2022, 2022, 5501610. [Google Scholar] [CrossRef]
- Uy, B.; Craine, S. Static flexural behaviour of externally post-tensioned steel-concrete composite beams. J. Adv. Struct. Eng. 2004, 7, 1–20. [Google Scholar] [CrossRef]
- Ding, J.; Li, Y.; Xing, W.; Ren, P.; Kong, Q.; Yuan, C. Mechanical properties and engineering application of single-span steel-concrete double-sided composite beams. J. Build. Eng. 2021, 40, 102644. [Google Scholar] [CrossRef]
- Sebastian, W.M.; McConnel, R.E. Nonlinear FE analysis of steel-concrete composite structures. J. Struct. Eng. 2000, 126, 662–674. [Google Scholar] [CrossRef]
- Cheng, Z.; Zhang, Q.; Bao, Y.; Deng, P.; Wei, C.; Li, M. Flexural behavior of corrugated steel-UHPC composite bridge decks. Eng. Struct. 2021, 246, 113066. [Google Scholar] [CrossRef]
- Sun, G.; Wang, Y.; Yang, J.; Chen, S.; Liu, H.; Zhao, J. Lightweight design method of orthotropic steel bridge deck with U-ribs based on multi-objective optimization. Ain Shams Eng. J. 2023, 102464. [Google Scholar] [CrossRef]
- Zhang, Q.; Bu, Y.; Li, Q. Review on fatigue problems of orthotropic steel bridge deck. China J. Highw. Transp. 2017, 30, 14–30. [Google Scholar] [CrossRef]
- Deng, E.-F.; Zhang, Z.; Zhang, C.-X.; Tang, Y.; Wang, W.; Du, Z.-J.; Gao, J.-P. Experimental study on flexural behavior of UHPC wet joint in prefabricated multi-girder bridge. Eng. Struct. 2023, 275, 115314. [Google Scholar] [CrossRef]
- Hattori, M.; Tateishi, K.; Hanji, T.; Shimizu, M. Fatigue strength evaluation by measurable stresses for root cracks in U-ribs to deck welded joints of orthotropic steel decks. Weld World 2023, 67, 2273–2282. [Google Scholar] [CrossRef]
- Wu, W.; Kolstein, H.; Veljkovic, M. Fatigue resistance of rib-to-deck welded joint in OSDs, analyzed by fracture mechanics. J. Constr. Steel Res. 2019, 162, 105700. [Google Scholar] [CrossRef]
- Cheng, X.; Fisher, J.W.; Prask, H.J.; Gnäupel-Herold, T.; Yen, B.T.; Roy, S. Residual stress modification by post-weld treatment and its beneficial effect on fatigue strength of welded structures. Int. J. Fatigue 2003, 25, 1259–1269. [Google Scholar] [CrossRef]
- Cui, C.; Zhang, Q.; Luo, Y.; Hao, H.; Li, J. Fatigue reliability evaluation of deck-to-rib welded joints in OSD considering stochastic traffic load and welding residual stress. Int. J. Fatigue 2018, 111, 151–160. [Google Scholar] [CrossRef]
- Shi, Z.; Yang, S.; Pu, Q.; Zhang, Y. Fatigue performance of orthotropic steel decks in long-span cable-stayed steel-box girder railway bridges. J. Bridge Eng. 2019, 24, 04019035. [Google Scholar] [CrossRef]
- Chen, S.; Huang, Y.; Gu, P.; Wang, J.-Y. Experimental study on fatigue performance of UHPC-orthotropic steel composite deck. Thin Walled Struct. 2019, 142, 1–18. [Google Scholar] [CrossRef]
- Fu, Z.; Wang, Y.; Ji, B.; Jiang, F. Effects of multiaxial fatigue on typical details of orthotropic steel bridge deck. Thin Walled Struct. 2019, 135, 137–146. [Google Scholar] [CrossRef]
- Zhu, Z.; Li, J.; Chen, X.; Carpinteri, A. Stress behaviors of rib-to-deck double-sided weld detail on orthotropic steel deck. J. Constr. Steel Res. 2021, 187, 106947. [Google Scholar] [CrossRef]
- Liu, Y.; Chen, F.; Lu, N.; Wang, L.; Wang, B. Fatigue performance of rib-to-deck double-side welded joints in orthotropic steel decks. Eng. Fail. Anal. 2019, 105, 127–142. [Google Scholar] [CrossRef]
- Luo, P.; Zhang, Q.; Bao, Y.; Bu, Y. Fatigue performance of welded joint between thickened-edge U-rib and deck in orthotropic steel deck. Eng. Struct. 2019, 181, 699–710. [Google Scholar] [CrossRef]
- Zhang, Z.; Tian, C.-K.; Deng, E.-F.; Peng, X.; Hu, H.-Y.; Li, F.-R. Fatigue performance and optimal design of corrugated steel–concrete composite bridge deck. Structures 2023, 48, 427–437. [Google Scholar] [CrossRef]
- Ji, B.; Liu, R.; Chen, C.; Maeno, H.; Chen, X. Evaluation on root-deck fatigue of orthotropic steel bridge deck. J. Constr. Steel Res. 2013, 90, 174–183. [Google Scholar] [CrossRef]
- Shao, X.; Yi, D.; Huang, Z.; Zhao, H.; Chen, B.; Liu, M. Basic performance of the composite deck system composed of orthotropic steel deck and ultrathin RPC layer. J. Bridge Eng. 2013, 18, 417–428. [Google Scholar] [CrossRef]
- Yuan, Y.; Wu, C.; Jiang, X. Experimental study on the fatigue behavior of the orthotropic steel deck rehabilitated by UHPC overlay. J. Constr. Steel Res. 2019, 157, 1–9. [Google Scholar] [CrossRef]
- Shemirani, A.B. Experimental and numerical studies of concrete bridge decks using ultra high-performance concrete and reinforced concrete. Comput. Concr. 2022, 29, 407–418. [Google Scholar]
- Kim, H.-Y.; Jeong, Y.-J. Experimental investigation on behaviour of steel–concrete composite bridge decks with perfobond ribs. J. Constr. Steel Res. 2006, 62, 463–471. [Google Scholar] [CrossRef]
- Machacek, J.; Cudejko, M. Longitudinal shear in composite steel and concrete trusses. Eng. Struct. 2009, 31, 1313–1320. [Google Scholar] [CrossRef]
- Li, Y.; Liu, Y.; Liu, R. Finite element analysis on axial compressive behaviors of high-performance steel stiffened plates in bridge application. Int. J. Steel Struct. 2019, 19, 1624–1644. [Google Scholar] [CrossRef]
- Oh, C.-K.; Hong, K.-J.; Bae, D.; Do, H.; Han, T. Analytical and experimental studies on optimal details of orthotropic steel decks for long span bridges. Int. J. Steel Struct. 2011, 11, 227–234. [Google Scholar] [CrossRef]
- Chen, Z.-Y.; Li, C.-X.; He, J.; Xin, H.-H. Retrofit fatigue cracked diaphragm cutouts using improved geometry in orthotropic steel decks. Appl. Sci. 2020, 10, 3983. [Google Scholar] [CrossRef]


| Materials | Structures | Young’s Modulus (GPa) | Poisson’s Ratio | Type of Meshes | Size of Meshes (mm) |
|---|---|---|---|---|---|
| Concrete | Concrete overlay | 34.5 | 0.2 | C3D8R | 150 |
| Steel | Rebar | 206 | 0.3 | Truss | 150 |
| PBL shear connectors | 206 | 0.3 | C3D8R | 150 | |
| Stiffening rib | 206 | 0.3 | C3D8R | 150 | |
| Steel beam | 206 | 0.3 | C3D8R | 150 |
| Scheme | Stress (MPa) | Displacement (mm) | Material Consumption | |||
|---|---|---|---|---|---|---|
| Concrete | Steel | Concrete | Steel | Concrete (m3) | Steel (t) | |
| Original Scheme | 1.28 | 63.81 | 4.95 | 7.01 | 92.96 | 161.50 |
| Optimization Scheme | 0.91 | 56.77 | 4.15 | 6.45 | 74.37 | 162.81 |
| Amplitude of Variation (%) | −28.91 | −11.03 | −16.16 | −7.99 | −20.00 | 0.81 |
| Scheme | Stress (MPa) | Displacement (mm) | Material Consumption | |||
|---|---|---|---|---|---|---|
| Concrete | Steel | Concrete | Steel | Concrete (m3) | Steel (t) | |
| Original Scheme | 1.28 | 63.81 | 4.95 | 7.01 | 92.96 | 161.50 |
| BUSP Solution | 0.90 | 56.88 | 3.87 | 6.29 | 75.16 | 163.51 |
| Amplitude of Variation (%) | −29.69 | −10.86 | −21.82 | −10.27 | −19.15 | 1.24 |
| Parameters | Meaning |
|---|---|
| The height of the U-rib | |
| The opening width of the U-rib | |
| The bottom width of the U-rib | |
| The thickness of the steel plate | |
| The angle between the side and bottom edges of the U-rib | |
| The spacing between longitudinal U-ribs | |
| The spacing between transverse U-ribs |
| Node Number | x (mm) | y (mm) |
|---|---|---|
| 1 | ||
| 2 | ||
| 3 | ||
| 4 | ||
| 5 | ||
| 6 | ||
| 7 | ||
| 8 |
Disclaimer/Publisher’s Note: The statements, opinions and data contained in all publications are solely those of the individual author(s) and contributor(s) and not of MDPI and/or the editor(s). MDPI and/or the editor(s) disclaim responsibility for any injury to people or property resulting from any ideas, methods, instructions or products referred to in the content. |
© 2023 by the authors. Licensee MDPI, Basel, Switzerland. This article is an open access article distributed under the terms and conditions of the Creative Commons Attribution (CC BY) license (https://creativecommons.org/licenses/by/4.0/).
Share and Cite
Wei, D.; Liao, J.; Liu, J.; Gao, Y.; Huang, F. Design and Optimization of the Bi-Directional U-Ribbed Stiffening Plate–Concrete Composite Bridge Deck Structure. Appl. Sci. 2023, 13, 9340. https://doi.org/10.3390/app13169340
Wei D, Liao J, Liu J, Gao Y, Huang F. Design and Optimization of the Bi-Directional U-Ribbed Stiffening Plate–Concrete Composite Bridge Deck Structure. Applied Sciences. 2023; 13(16):9340. https://doi.org/10.3390/app13169340
Chicago/Turabian StyleWei, Dingchao, Jingwen Liao, Jianjun Liu, Yingjie Gao, and Fanglin Huang. 2023. "Design and Optimization of the Bi-Directional U-Ribbed Stiffening Plate–Concrete Composite Bridge Deck Structure" Applied Sciences 13, no. 16: 9340. https://doi.org/10.3390/app13169340
APA StyleWei, D., Liao, J., Liu, J., Gao, Y., & Huang, F. (2023). Design and Optimization of the Bi-Directional U-Ribbed Stiffening Plate–Concrete Composite Bridge Deck Structure. Applied Sciences, 13(16), 9340. https://doi.org/10.3390/app13169340