Article

Optimizing Design and Operational Parameters for Enhanced Mixing and Hydrodynamics in Bubbling Fluidized Bed Gasifiers: An Experimental and CFD-Based Approach

1
School of Chemical & Materials Engineering (SCME), National University of Sciences and Technology (NUST), H-12, Islamabad 44000, Pakistan
2
School of Mechanical & Manufacturing Engineering (SMME), National University of Sciences and Technology (NUST), H-12, Islamabad 44000, Pakistan
*
Author to whom correspondence should be addressed.
Appl. Sci. 2023, 13(16), 9317; https://doi.org/10.3390/app13169317
Submission received: 12 June 2023 / Revised: 2 July 2023 / Accepted: 8 July 2023 / Published: 16 August 2023
(This article belongs to the Special Issue Experimental and Computational Fluid Dynamics)

Abstract

:
An experimental investigation of hydrodynamics of gas-solid flow is carried out by engaging different designs of air distributor plates. An analysis of three different plates, i.e., perforated, 45° slotted and novel hybrid plate, revealed the difference in pressure drop and minimum fluidization velocities (Umf) for varying input operational variables. Umf is found to be lowest for perforated and highest for 45° slotted plate, whereas pressure drop is found to be highest for 45° slotted plate and lowest for novel hybrid distributor plate. The bubbles rise velocity ratio (Umf,b/Umf,f) is noticed minimum for 45° slotted plate due to relatively larger bubbles originating from the bigger slot openings and maximum for perforated distributor plate owing to smaller bubbles with dominant axial rise. Furthermore, the bed height rise ratio (h/L) is observed as a minimum for perforated distributor and maximum for 45° slotted plate due to larger bubbles through 45° slots rupturing the bed surface, causing more bed expansion. Furthermore, CFD analysis is also carried out to observe the insight flow dynamics using the distributor plates. The simulations use a two-fluid model (TFM) and K-Epsilon turbulence models. CFD model shows promising results in agreement with the experimental results. CFD results revealed that the lower portion enhanced lateral dispersion/mixing of solid particles due to 45° angular openings of an air inlet. In contrast, the perforated plate exhibited a straight upward motion of small air bubbles, causing no radial/lateral mixing. CFD results for the hybrid plate show the mixed axial as well as lateral mixing of solids by revealing velocity distribution; therefore, the novel hybrid plate is found to be an optimum distributor plate due to its lowest pressure drop, adequate Umf, intermediary bed height rise ratio and moderate bubble rise velocity ratio across the bed.

1. Introduction

Fluidized bed gasification is an appropriate technique to convert various biomass wastes into valuable energy. Therefore, it is essential to understand the mass transfer and heat distribution between the phases to make an efficient design of a fluidized bed gasifier. Bubbling fluidized bed gasifiers are known for better heat and mass transfer characteristics between phases. However, there are challenges related to properly mixing biomass within the fluidization zone to eliminate the dead zones, which may lead to hot spot formation during gasification [1]. As a result of the removal of hotspots, the reaction rate within the fluidized bed increased manifold, resulting in the improved efficiency of the gasifier [2]. Mixing is a critical factor that significantly influences heat and mass transfer in fluidized bed gasifiers. Mixing quality in the fluidized bed is greatly influenced by geometric parameters such as gas distributor plate design, the fluidization column’s size and shape, the gasifying agent’s entry point, biomass (feed) and secondary air [3]. Moreover, operational factors such as gas flow distribution, particle size, particle velocity distribution and bed aspect ratio also influence the operational efficiency of the gasifier as a whole [4,5,6,7].
In order to enhance the operational efficiency of the gasifier, a thorough understanding of independent or input operational variables such as particle size, initial bed height ratio, and superficial air velocity range, as well as dependent/output variables such as pressure drop, minimum fluidization velocity, bubble rise velocity, bubble dynamics within fluidization zone, and bed height rise, on overall hydrodynamics of gasifier is essential. Moreover, the parameters mentioned above have a coupled effect on the gasifier’s hydrodynamics with the geometric parameter variations. Therefore, geometric parameters must be included in the optimization process to understand the influence of operational parameters on overall hydrodynamics. In this regard, it was studied that particle size affected pressure drop, which eventually influenced solid-gas fluidization behavior [8]. However, it is not practical to study only the effect of variation in particle size since geometric factors also affect the fluidization behavior, like distributor plate design. For example, the earlier slugging and higher pressure drops were promoted by coarse particles as compared to smaller particles, producing larger bubbles. It was also observed that fluidization quality is enhanced when the average particle size and segregation are reduced [9,10]. These observations were also perceived by variation in the distributor plate’s hole size and shape, stating that the emerging bubble size increases with bigger holes of the distributor plate [11]. Therefore, changing the distributor plate along with particle size might significantly affect the hydrodynamic characteristics of a gasifier.
Similarly, changing the initial bed height ratio alone increased pressure drop and minimum fluidization velocity [12]. However, variations in the distributor plate design and changes in the initial bed height ratio may result in drastic changes in biomass/inert material mixing behavior. Hence, the overall hydrodynamics of the gasifier may be optimized by effectively using operational and geometric characteristics. Heat and mas transfer within a fluidized bed of bubbling fluidized bed is also affected by operational parameters such as biomass particle diameter, initial bed temperature, steam to biomass (S/B) ratio, inlet gas flow rate, and feed position, which influence the production of H2 and CH4 [13]. More computational efforts have also been carried out to investigate the drag model, equivalence ratio (ER), and fluidization number (FN) effect on the gas-solid flow dynamics of biomass gasification using the CFD-DEM model. The parametric study revealed slight CO and H2 concentration decreases by increasing FN by fixing the Er value at 0.27 [14,15]. Hydrodynamic characteristics of dual fluidized bed gasifier have been investigated with cold model gasifier by Yau-Pin Chyou et al. The authors revealed that the bed material circulation exceeded the design value indicating the system has a comfortable safety factor in its engineering design—however, the pressure distribution aligned with the published literature [16].
Gas distribution and bed materials are also prime parameters in a fluidized bed gasifier. Various geometric and operational parameters like the distributor design, gas flow rate and solid density were also evaluated via CFD study. Bed expansion ratio, gas and solid velocities distribution above the distributor plate, pressure drop across the distributor plate, distributor-to-bed pressure drop ratio and solid volume fraction have been examined. A distributor plate’s perforated area and open area ratio greatly influenced uniform fluidization and overall bed pressure drop. It was also investigated in the early 90 s that the same open area ratio of different distributor plates did not influence bubble size [17]. However, different numbers and sizes of holes significantly alter the growth and size of bubbles [17].
Moreover, bed material properties and gas flow rate strongly impact the hydrodynamics of solid-gas fluidized beds [18]. Gas flow pattern primarily depends on different designs of gas flow distributors, which are mainly divided into static and rotating distributor plates. Based on the air entering direction, these distributor plates are categorized into perforated plates [19], slotted or inclined plates [20], and bubble cap distributors [21]. Previously, distributor plate rotation improved the redial dispersion by reducing high-concentration zones in fluidized beds [22]. It was concluded that uniform fluidization could be achieved by rotating distributors as compared with the static distributor. A comparative study of perforated and bubble cap distributor plates was carried out to analyze the flow pattern of the bottom area of a fluidized bed. The solid transfer rate from dense to free board area was higher at lower superficial gas velocity for perforated distributors [21]. In another study, it was found that the diameter of the reactor has a slighter effect on the performance of the gasifier. However, efficiency, heating value and carbon conversion were enhanced while increasing bed height [23].
Proper mixing reduces the operational cost of the industrial fluidization phenomenon. Air distributor plate design affects the mixing and performance of fluidized bed gasifiers. Enhancement in mixing was investigated using a slotted distributor plate. It was found that the distributor with 45° inclined slots improved the circulation rate, which critically enhanced the mixing [24]. In the case of a slotted distributor, entrained gas produces two velocity components: horizontal and vertical. The horizontal velocity component induces swirling motion in the bed, while the vertical component causes fluidization [25,26]. Mixing of gas-solid was numerically analyzed and a comparative analysis of swirl distributor plate (SDP) with conventional distributor plate (CDP) was also conducted. CDP achieved better gas-solid mixing as compared with SDP [27]. Multizone circulatory bed reactors (MZCR) simulations have been carried out by Ghasem et al. to investigate the oscillatory behavior of the reactor temperature, which is essential to design and install suitable temperature control within a reactor [28]. In another computational study, pressure drop and mixing patterns have been studied using three distributor plates: perforated plate, 90° slotted plate and 45° slotted plate. The pressure drop was the maximum in the case of the perforated distributor plate due to the smaller open area ratio. At the same time, it was found that the pressure drop in the case of a 90° slotted plate was 7% and 4% lesser than the perforated and 45° slotted plate, respectively. A wider open area in a straight-slotted plate developed a smaller velocity head. The distributor 45° slotted plate exhibited a higher pressure drop than the 90° slotted plate due to the longer path length of the slots [29]. In a fluidized bed gasifier, to check the hydrodynamics of gas-solid mixtures and particles—gas and particle-particle contact mechanisms, four different perforated plate distributors with rectangular and triangular arrangements with different holes and pitches were studied. As a result of the bubble formation, pressure drop and superficial velocity, the type D distributor, i.e., triangular, was the best distributor among the other types [30].
All the discussion above is related to geometric as well as operational parameters and there is a need to introduce a novel distributor plate that not only enhances the lower portion mixing phenomena by swirling pattern but also optimizes the pressure drop and minimum fluidization velocity as well for a range of operational parameters to improve gasifier operational efficiency. It is frequently perceived in fluidized bed literature that the distributor pressure drop may be relatively high for uniform fluidization due to numerous smaller holes. However, such a configuration might cause lower portion agglomeration and poor lateral dispersion of solid particles. Therefore, there is a need to design an optimum configuration of the distributor plate, which provides the axial flow of solids for uniform fluidization and assists in lateral particle movement resulting in swirling flow. Sik Hwang et al. performed CFD simulations to predict the reaction characteristics, heat and mass transfer within a spouted fluidized bed gasifier. They revealed the findings that with increasing inlet cross-sectional area to reactor area (Am/A), gas species (CO, H2, and CH4) and the lower heating value (LHV) is gradually rising [31]. In this paper, geometric and operational parameters have been studied experimentally and computationally to depict the hydrodynamics of bubbling fluidized bed gasifiers. Firstly, different distributor plates have been tested experimentally with the variations of operational parameters to observe the output fluidization parameters, i.e., bed pressure drop, bed height rise ratio, minimum fluidization velocity (Umf) and bubble rise velocity ratio for each distributor plate. Afterward, CFD analysis was also carried out to explore the inside flow dynamics of gas-solid flow patterns using different distributor plates. It was found through a comparative study that among all three types of distributor plates, the novel hybrid distributor plate is found to be the most optimum distributor plate employed for a vast range of operational parameters due to its lowest pressure drop, intermediate minimum fluidization velocity and combination of air bubble flow pattern such as axial as well as radial within shallow and deep beds for enhance mixing of particles.

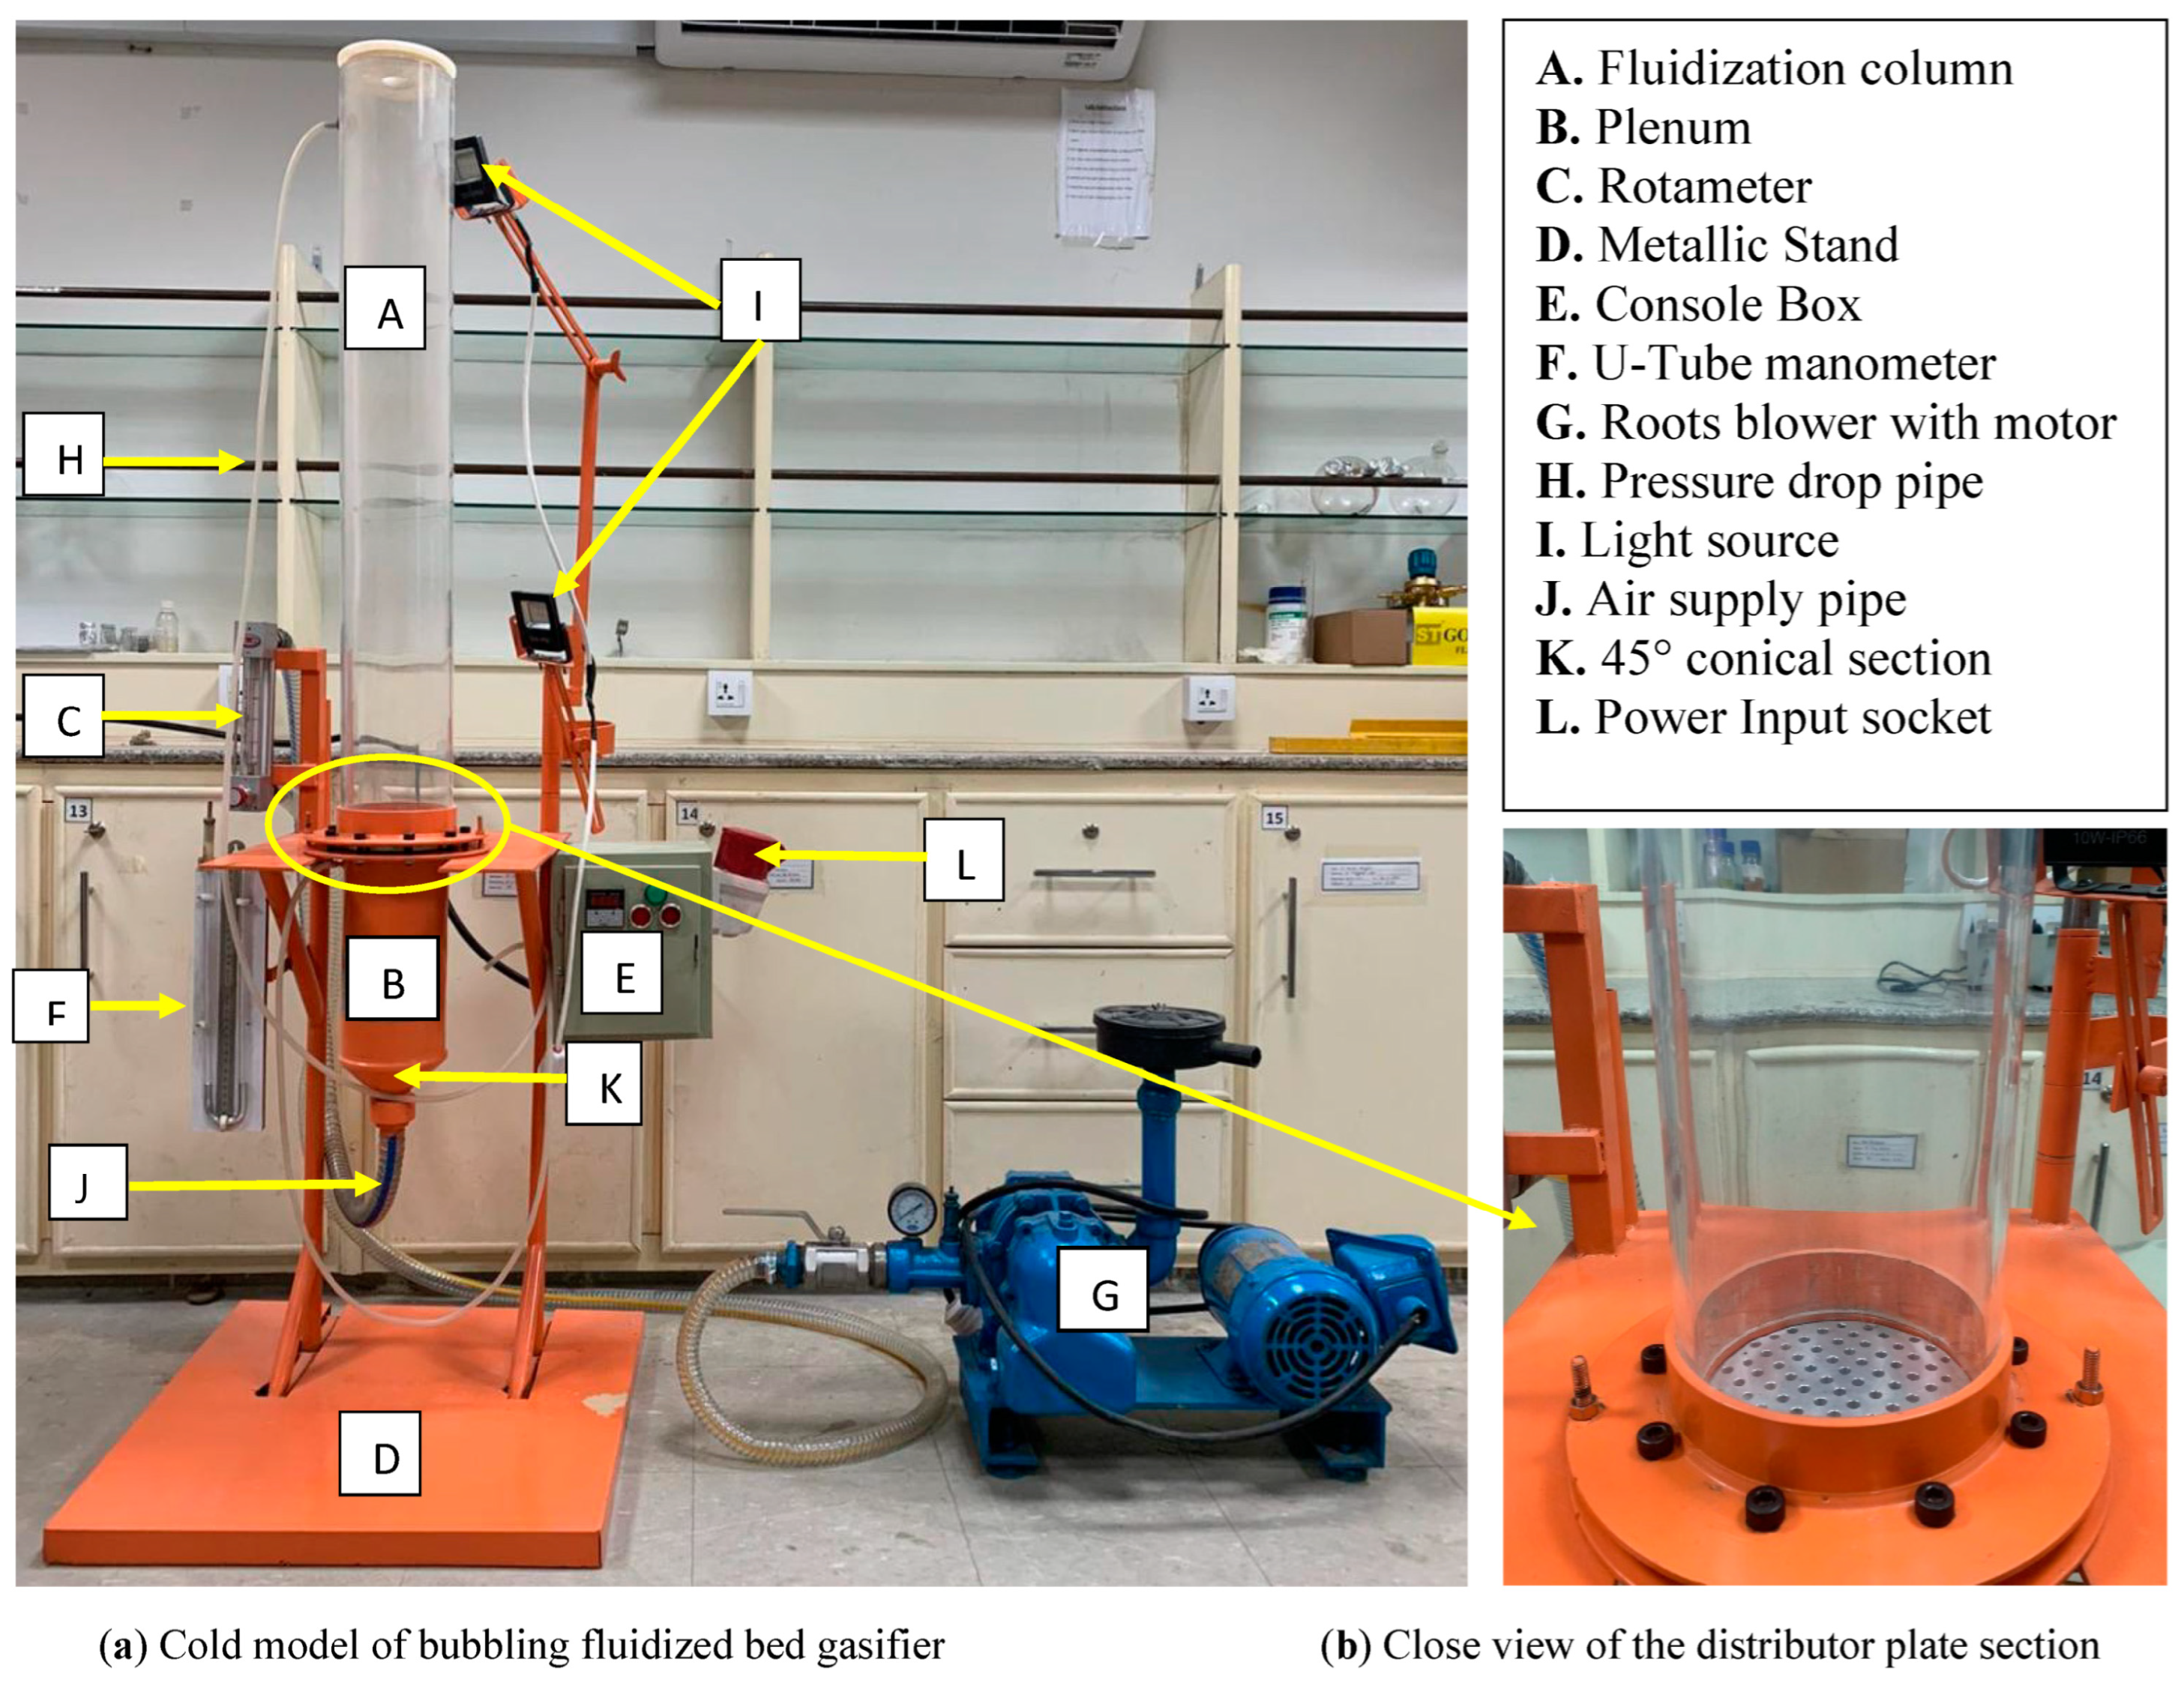
2. Experimental Setup

For the cold model testing of bubbling fluidized bed gasifier to investigate the hydrodynamic characteristics, an experimental setup has been fabricated, as shown in the Figure 1 below.
The setup comprises a metal structural part on which the fluidization column and associated parts such as plenum, pipes and other accessories are mounted along with the measurement fixtures through which the pressure drop, flow rate and concentration of binary mixtures are measured. The fluidization column having an internal diameter, D of 120 mm and height of 1000 mm, is composed of a transparent acrylic sheet with reasonable sight across the column to observe the flow inside the fluidized bed. Immediately below the fluidization column is the cylindrical section called the plenum having a height of 250 cm. Underneath that section is the 45° conical segment connected to the air-linking pipes. The section arranges the distributor plate’s integration between the fluidization column and plenum. The air distributor plate section is designed in such a way as to change the distributor plate after every test. In addition, nuts and bolts and an O ring are placed over the periphery of distributor plates to ensure an air-tight process. Three types of air distributor plates have been tested: perforated plate, 45° slotted plate and novel hybrid plate (combination of both perforated and 45° slotted plate). In addition, a 100-micron metal mesh is placed over the distributor plate to stop the particles from dropping through the distributor plate.
A 1 hp roots blower supplies fluidization air through a rotameter, where its flow rate is controlled and measured. There are two separate arrangements of pressure drop measurement across the bed: a U-Tube manometer, a manual measuring method, and a digital manometer mounted on a console box. The digital manometer gives the difference between a pressure tap located beneath the distributor plate (plenum section) and at the top of the column. Two light lamps are mounted on the metal stand to illumine flow behavior. A high-speed camera is also used to record the fluidization phenomena. Two concentric tube sampling probes are used to collect binary mixtures of solid particles. The sampling probe consists of two concentric rods with four slots that slide over each other. The upper end of the rod is used to twist the rod to open or shut the opening slots to collect samples axially and radially within the fluidized bed.

3. Materials and Methods

3.1. Fluidized Bed Material Characteristics

Materials used for the experiment were type B Galdert sand with three different particle sizes of 250, 590 and 840 µm. After that, sand is placed in an electric oven and heated to 105 degrees centigrade for 24 h to remove all the possible moisture contents for better fluidization. The physical properties of three different-sized sand are listed in Table 1.

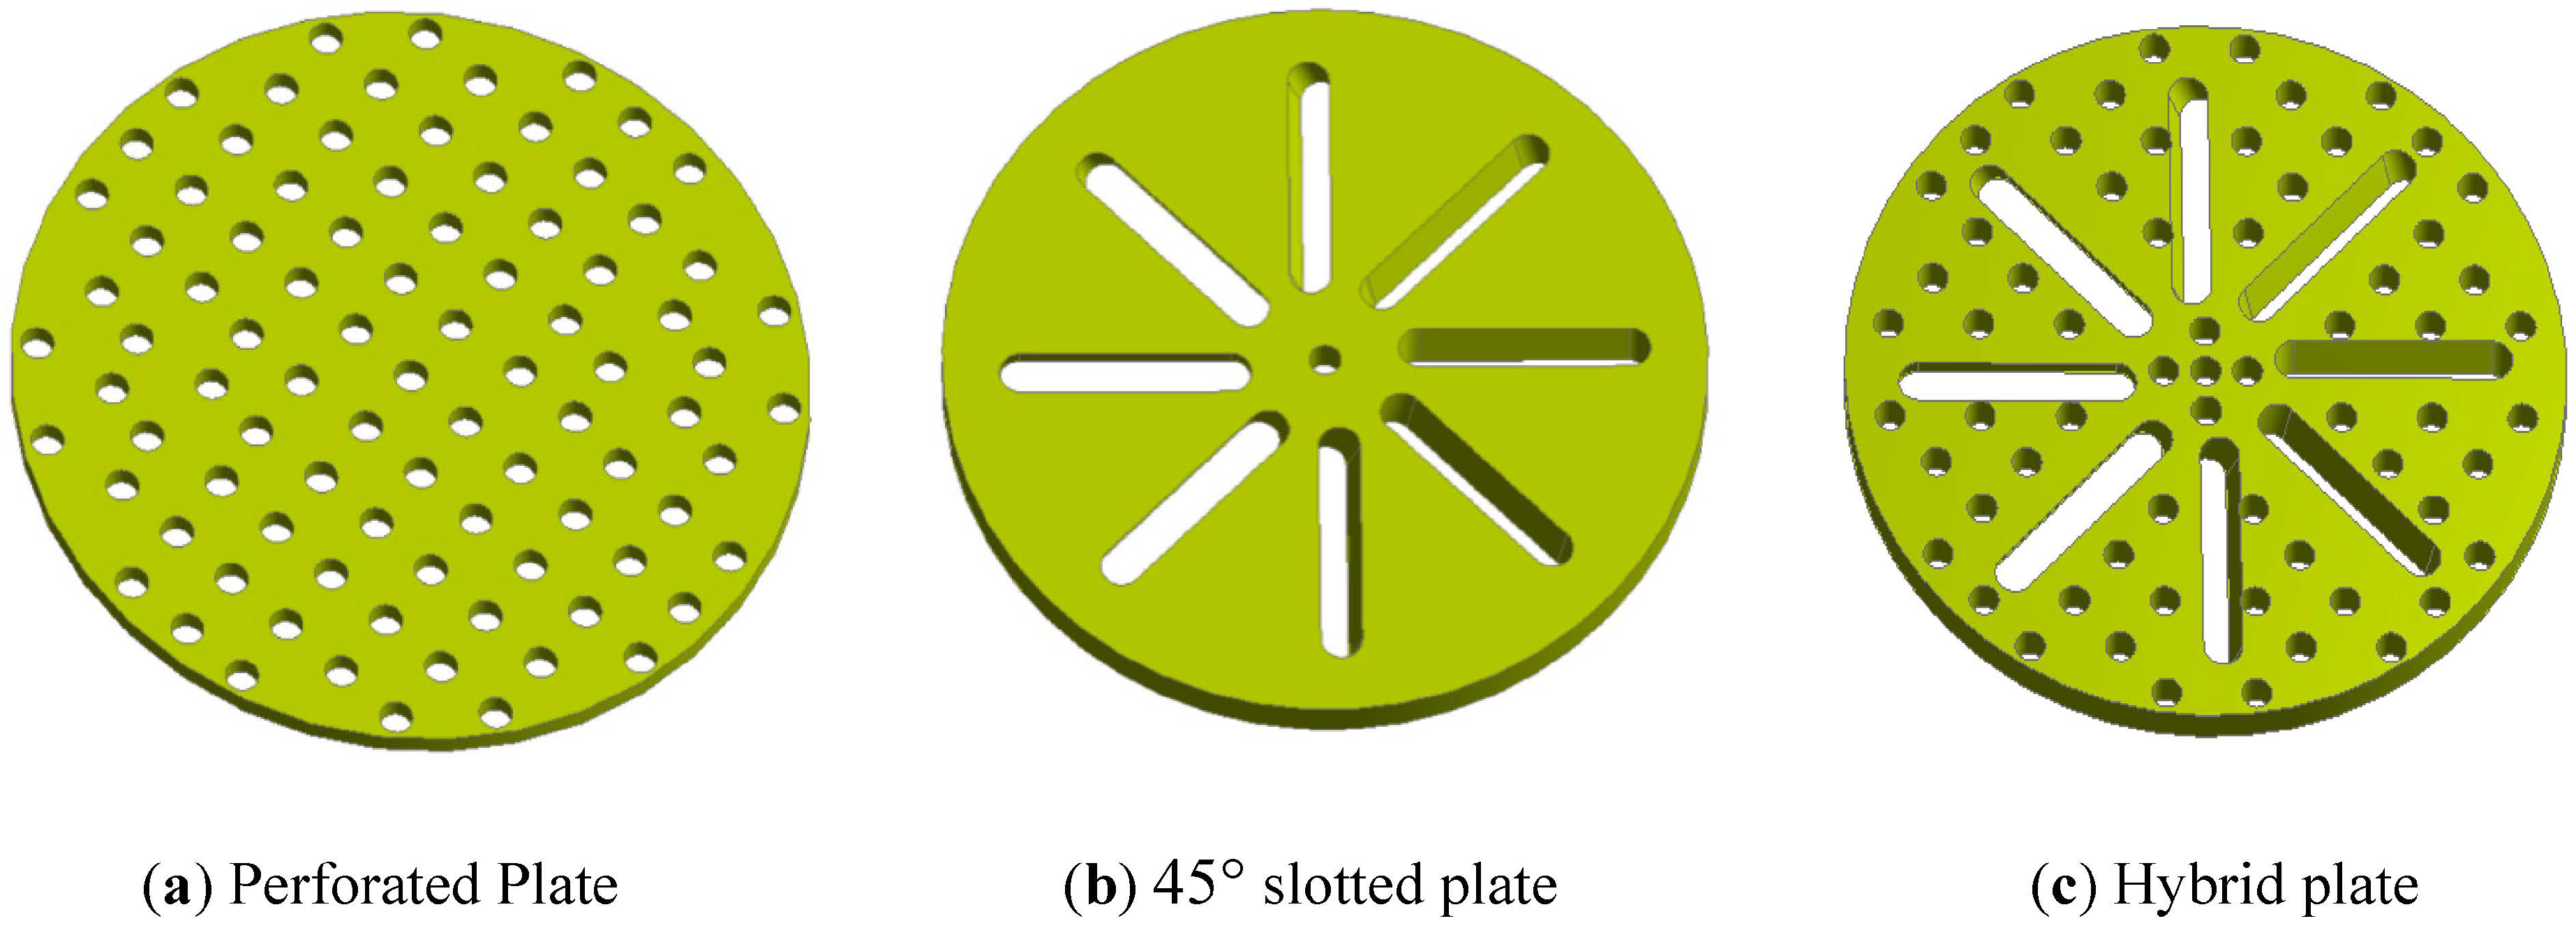
3.2. Geometry of Distributor Plates

Three distributor plates are employed to experiment with the cold model of a bubbling fluidized bed gasifier, as shown in Figure 2. The first is a perforated distributor plate, commonly used as a conventional plate for fluidized bed gasifiers. The second is a 45° slotted plate, which is usually recommended for the swirling flows for better lateral mixing of particles. The distributor plate’s novel design, which combines a perforated plate and a 45° slotted plate, is introduced here for the first time to study the fluidization behavior and bubble dynamics within the fluidized bed. In addition, this study is carried out to optimize the existing bubbling fluidized bed gasifier designs by varying the geometric and operational parameters to enhance the overall hydrodynamics and consequently improve the working efficiency of the gasifiers.
Distributor plates designs and general parameters are elaborated in Figure 2 and Table 2 below, respectively.

3.3. Experimental Scheme

Extensive testing has been performed using different sand particle sizes and three distributor plates. Fluidization characteristics curves describing pressure drop across the bed and minimum fluidization velocities are the main output variables that distinguish each distributor plate’s overall flow dynamics. Geometric parameters are taken as different designs of air distributor plates, whereas operational parameters are categorized as input and output variables. Input variables are initial bed height, solid particle size and superficial air velocities. Output variables are pressure drop across the bed, bed height rise, minimum fluidization, and bubble rise velocity, as illustrated in Table 3.

3.4. Experimental Procedure

Experiments were performed for each distributor plate for a range of superficial air velocities to observe the minimum fluidization velocities and pressure drop across the bed for every initial bed height (bed aspect ratio, L/D). L is the initial bed height, and D is the diameter of the fluidization column. Due to the larger open area of distributor plates, a 100 µm mesh was placed over each plate to prevent particles from falling into the plenum section. Before starting the fluidization experiments, the column was initially run without bed material to measure the pressure drop, which is purely the pressure drop for a specific plate. Afterward, bed material is introduced into the fluidization column up to different initial bed heights of 0.5, 0.833, and 1. Net pressure drop was calculated by subtracting the empty and distributor pressure drop from the total bed pressure drop for each bed aspect ratio.
The airflow rate was controlled via a knob located at the rotameter. The flow rate was gradually increased, and the bed was carefully monitored to check for any bubbling of the static bed. The static bed vibrated slightly after attaining a specific flow rate, and tiny bubbles erupted through the bed surface. Such a condition was the initial minimum fluidization velocity (Umf,i). Further increasing the flow rate resulted in a more vigorous and larger eruption of bubbles, and the pressure drop did not increase further. This condition is the final minimum fluidization velocity (Umf,f) [10]. Further flow rate increment will remain constant and will not affect the pressure drop. All experiments were performed at room temperature of ~25 degrees centigrade and atmospheric pressure of 1 atm.

4. Experimental Results and Discussion

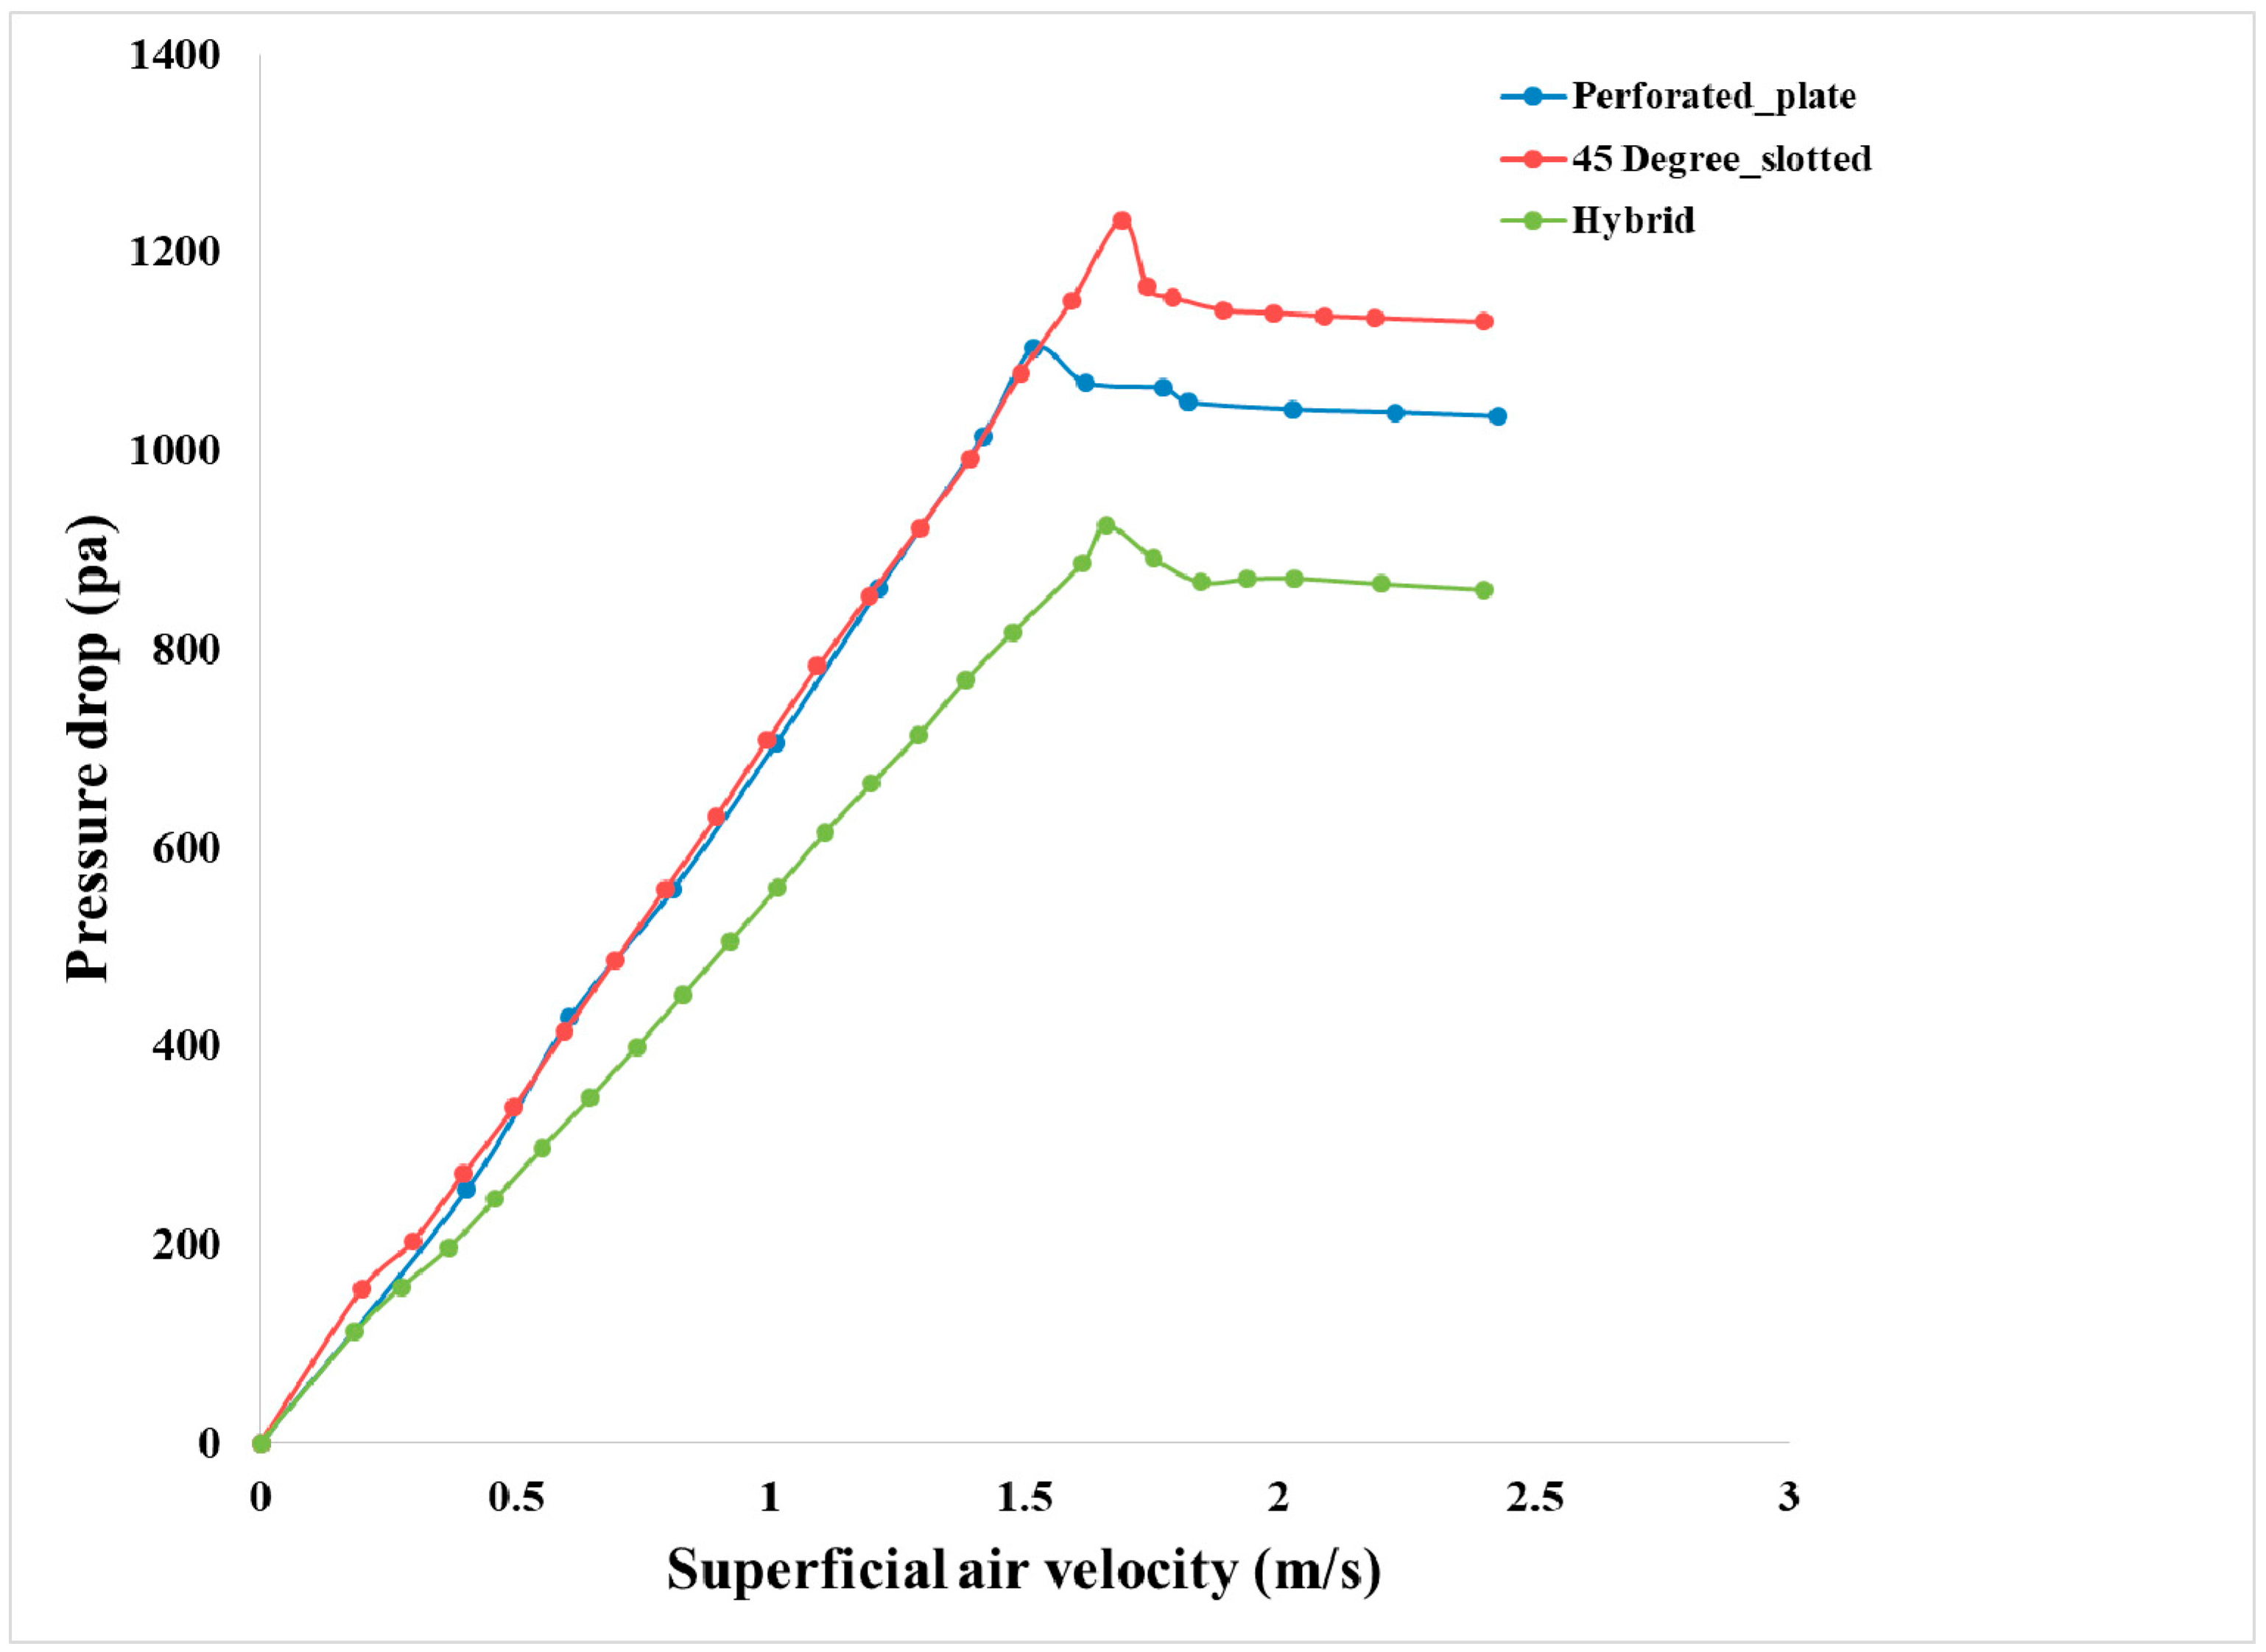
4.1. Sensitivity Analysis for Different Distributor Plates

In the first stage, three different distributor plate design configurations were tested experimentally for a fixed set of operational parameters to investigate their design sensitivity for fluidized bed overall hydrodynamics. Pressure drop across the bed, and minimum fluidization velocities for each distributor plate were measured, and the difference in pressure drop and minimum fluidization velocity was observed. Afterward, operational variables were also varied to comprehend each operational variable’s effect on the fluidization hydrodynamics for every distributor plate.
It is revealed from Figure 3 that for a fixed set of initial bed height and particle size, minimum fluidization velocity is found to be lowest for perforated plate distributor and highest for 45° slotted plate. Furthermore, pressure drop across the bed is highest for a 45° slotted plate, whereas it is lowest for a hybrid plate due to the highest open area ratio. For the geometric parameters, minimum fluidization velocity depends on the size and shape of the openings of the distributor plate, which, intern depends upon the bubble dynamics within the fluidized bed. These geometric parameters prescribed how the air bubbles travel up the column and ultimately rupture the bed surface after successive coalescence and collapse. Due to many smaller holes, numerous smaller size bubbles were instigated on the upper portion of the perforated distributor plate, causing a straight vertical motion of bubbles. The bubbles’ front area raised the solid particles, and the bubbles’ wake also sucked the lower portion of solid particles due to lower pressure region formation resulting in the entire upward motion of the emulsion phase. These bubbles coalesce and then collapse during their upward movement within the bed but with the axially dominant flow. It might be the main reason for early fluidization (lower Umf) in perforated distributor plate due to the straight upward movement of solids and bubbles with very little lateral dispersion.
On the other hand, due to the larger angular openings of slots in the 45° slotted plate, relatively bigger bubbles arise initially with deflected path partially toward the gasifier periphery. Similar phenomena of uplift and suction of solid particles occurred for a 45° slotted plate but with compromised axial flow due to air entering at 45° through slots. Due to the angular entrance of airflow, a portion of velocity is diverted into the lateral component. Hence, an axial component is reduced compared to the case in the perforated plate where all the holes are 90° to the sand bed, causing air inflow to be almost 100% axial as it emerges through the holes. Therefore, in a 45° slotted plate, fluidization will be delayed due to a reduction in the axial component of flow, and hence minimum fluidization velocity will be higher.
It can be observed from Figure 3 above that there is a significant difference in the slope of the pressure drop curve slope between the hybrid plate and the other two plates. This observation is due to the substantial difference in the open area ratio between the hybrid and the other two plates. The pressure drop is highest for the 45° slotted plate due to the smallest open area ratio. However, due to the largest open area ratio of the hybrid plate, a pressure drop is found to be lowest due to the reduction in the kinetic head compared to the perforated plate, where smaller holes increase the velocity of air inflow. Moreover, minimum fluidization velocity for a hybrid plate was found between perforated and 45° slotted plate scenarios. This effect is due to the blend of angular slots and small straight holes in the hybrid plate. Due to such configuration, airflow entered the plate and adopted two paths; one is a 90° straight upward path via smaller holes with higher kinetic heads, and the other is the 45° angular path through 45° angular slots. So the smaller, faster bubbles rise straight upward, whereas larger, slower bubbles through slots and adopt swirling angular paths. These two forms of bubbles interact with each other as they ascend upward, and the breakage of larger bubbles and coalescence of smaller bubbles occurred, as illustrated in Figure 4 below. So intermediate-size bubbles were formed, leading to the intermediate minimum fluidization velocity, which falls between the perforated and hybrid plate.
Figure 5 illustrates the fluidization phenomena for different distributor plates at 1.5 Umf and an average particle size of 590 µm. It can be seen from Figure 5a that for perforated plate distributors, the particles are fluidized with central concentration. However, the particle fluidization seemed to be rotational for the 45° slotted plate due to angular slots openings in distributor plates, as shown in Figure 5b. Moreover, the initial bed height rise ratio is prominent in the 45° slotted plate case due to the larger bubbles rupturing the bed surface, as shown in Figure 5b. Figure 5c shows fluidization behavior for hybrid plate distributors. Due to the larger open area ratio and a blend of smaller and larger openings in the distributor plate, the more sprinkled particle flow occurs at the bed’s surface. It moderates the bed height rise that appeared for the said plate. Furthermore, scattered flow appeared due to the blend of angular and straight holes.

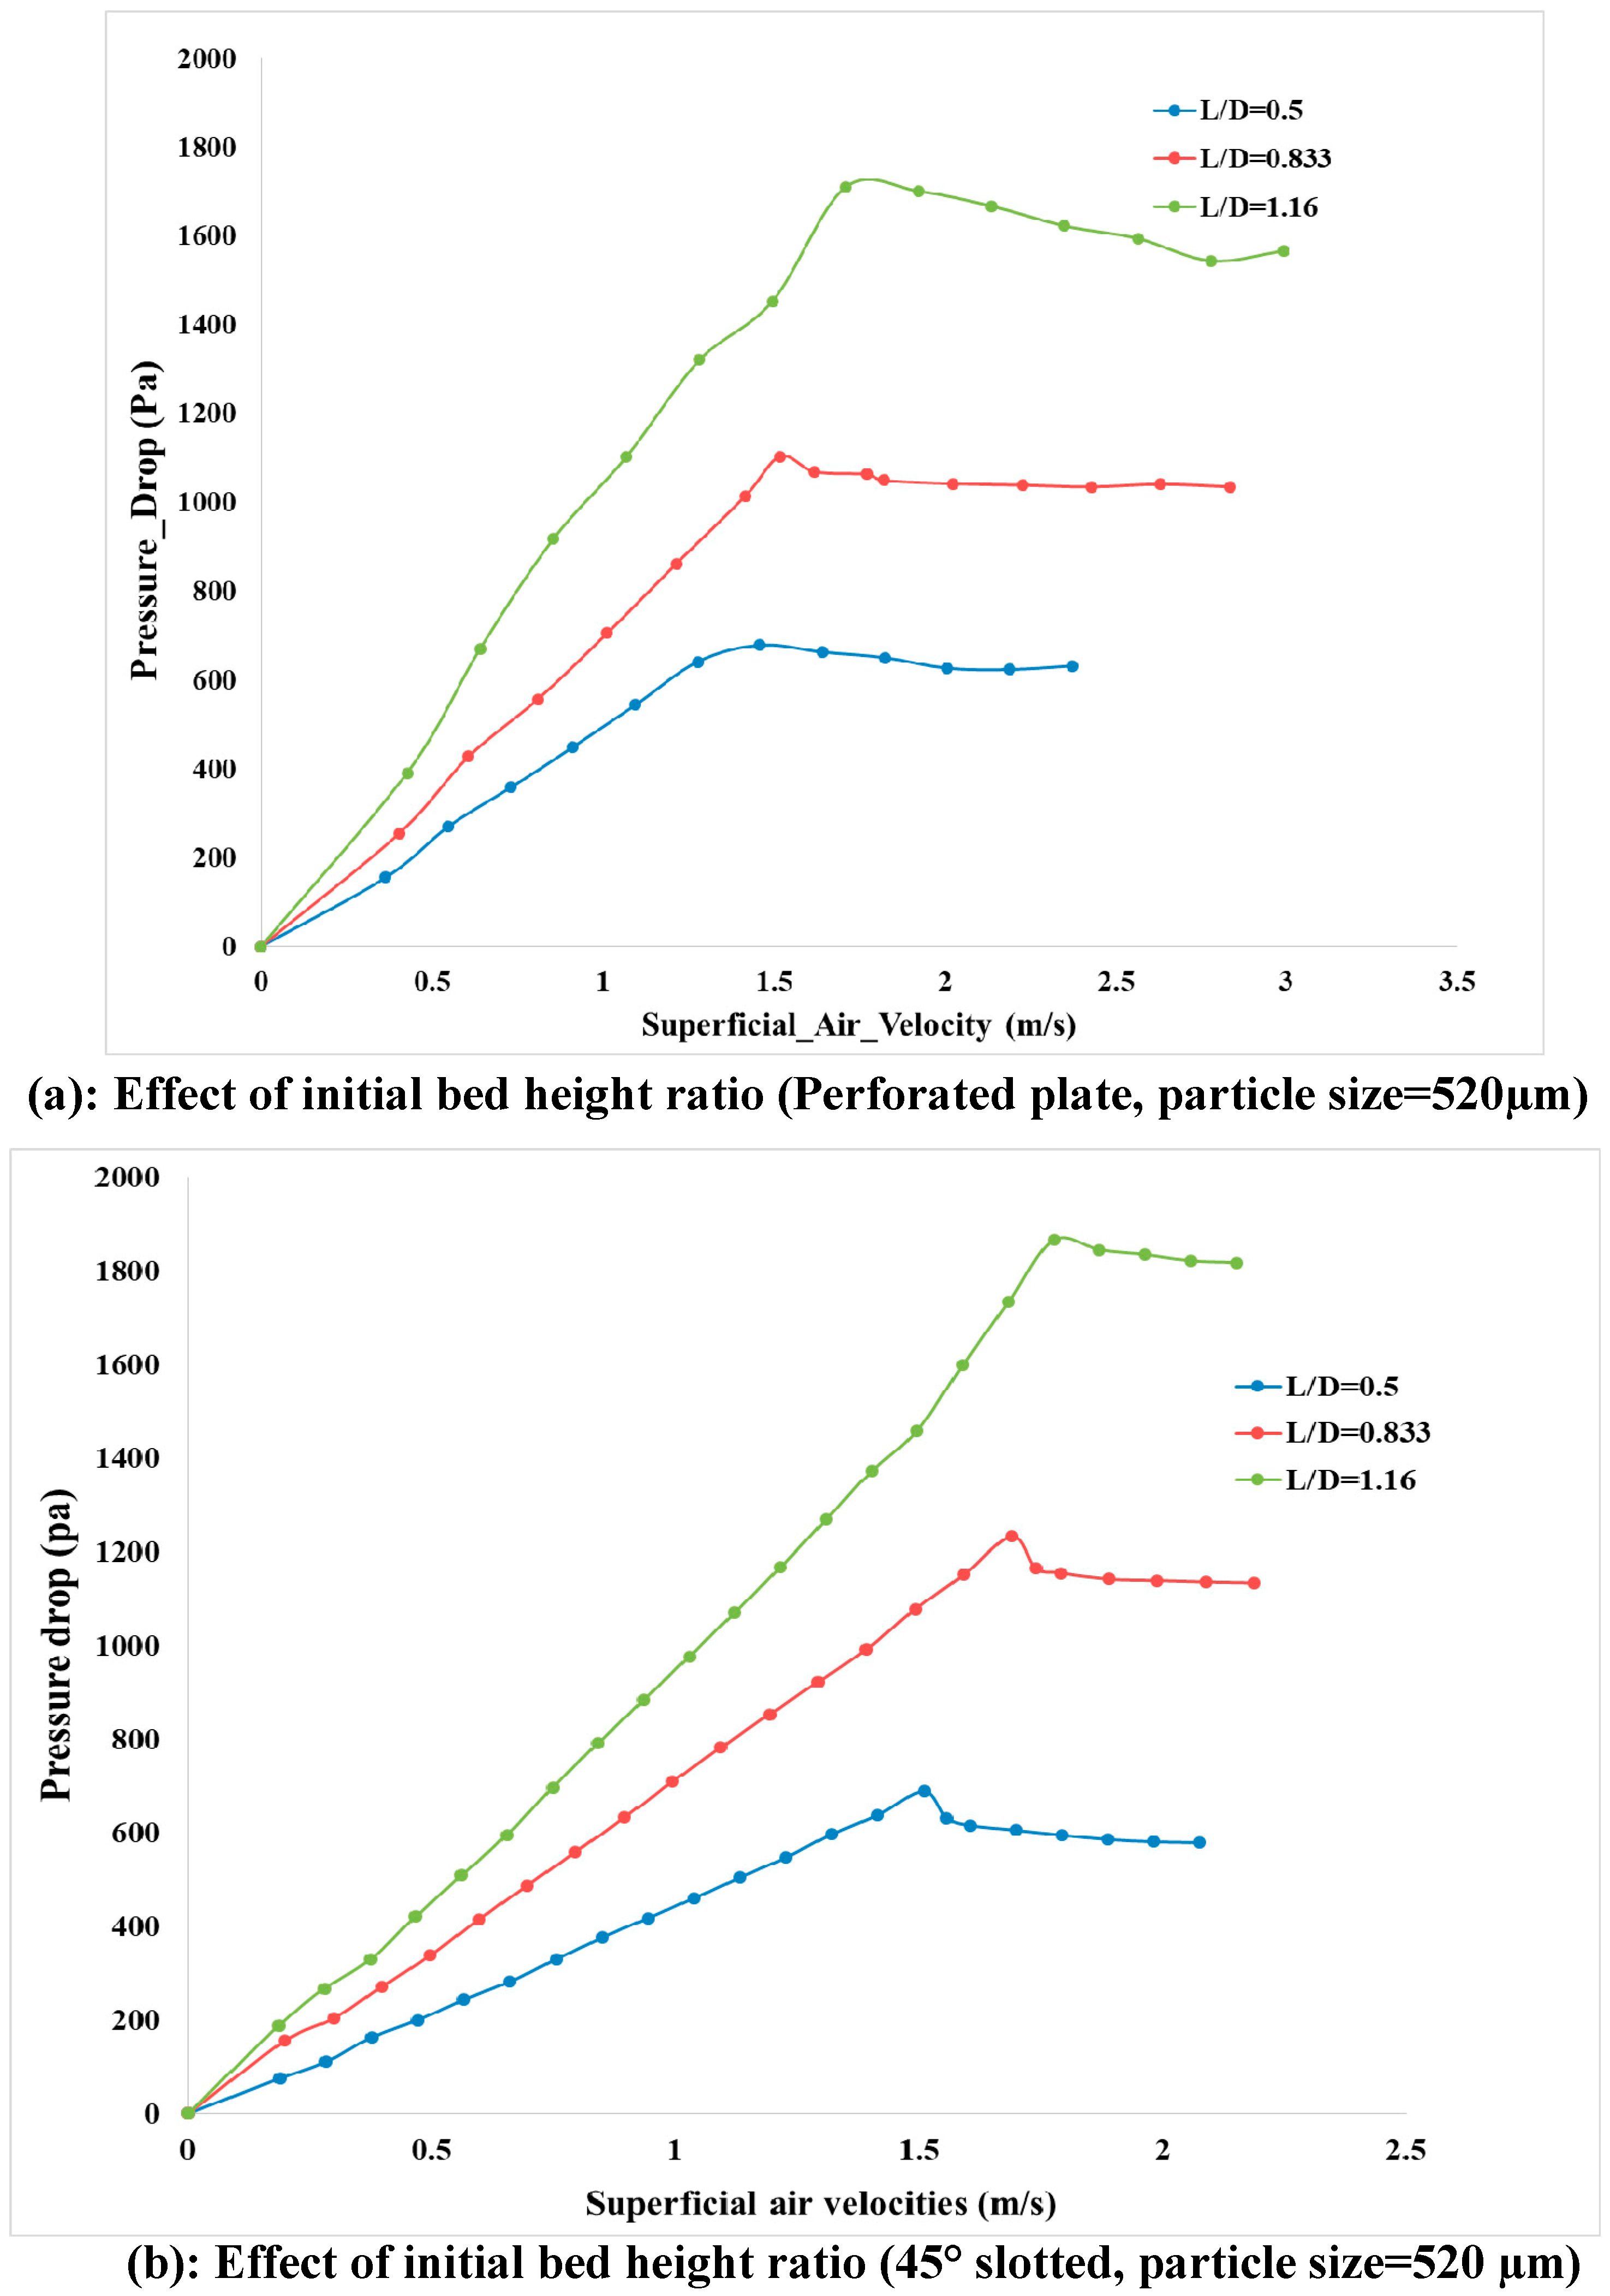
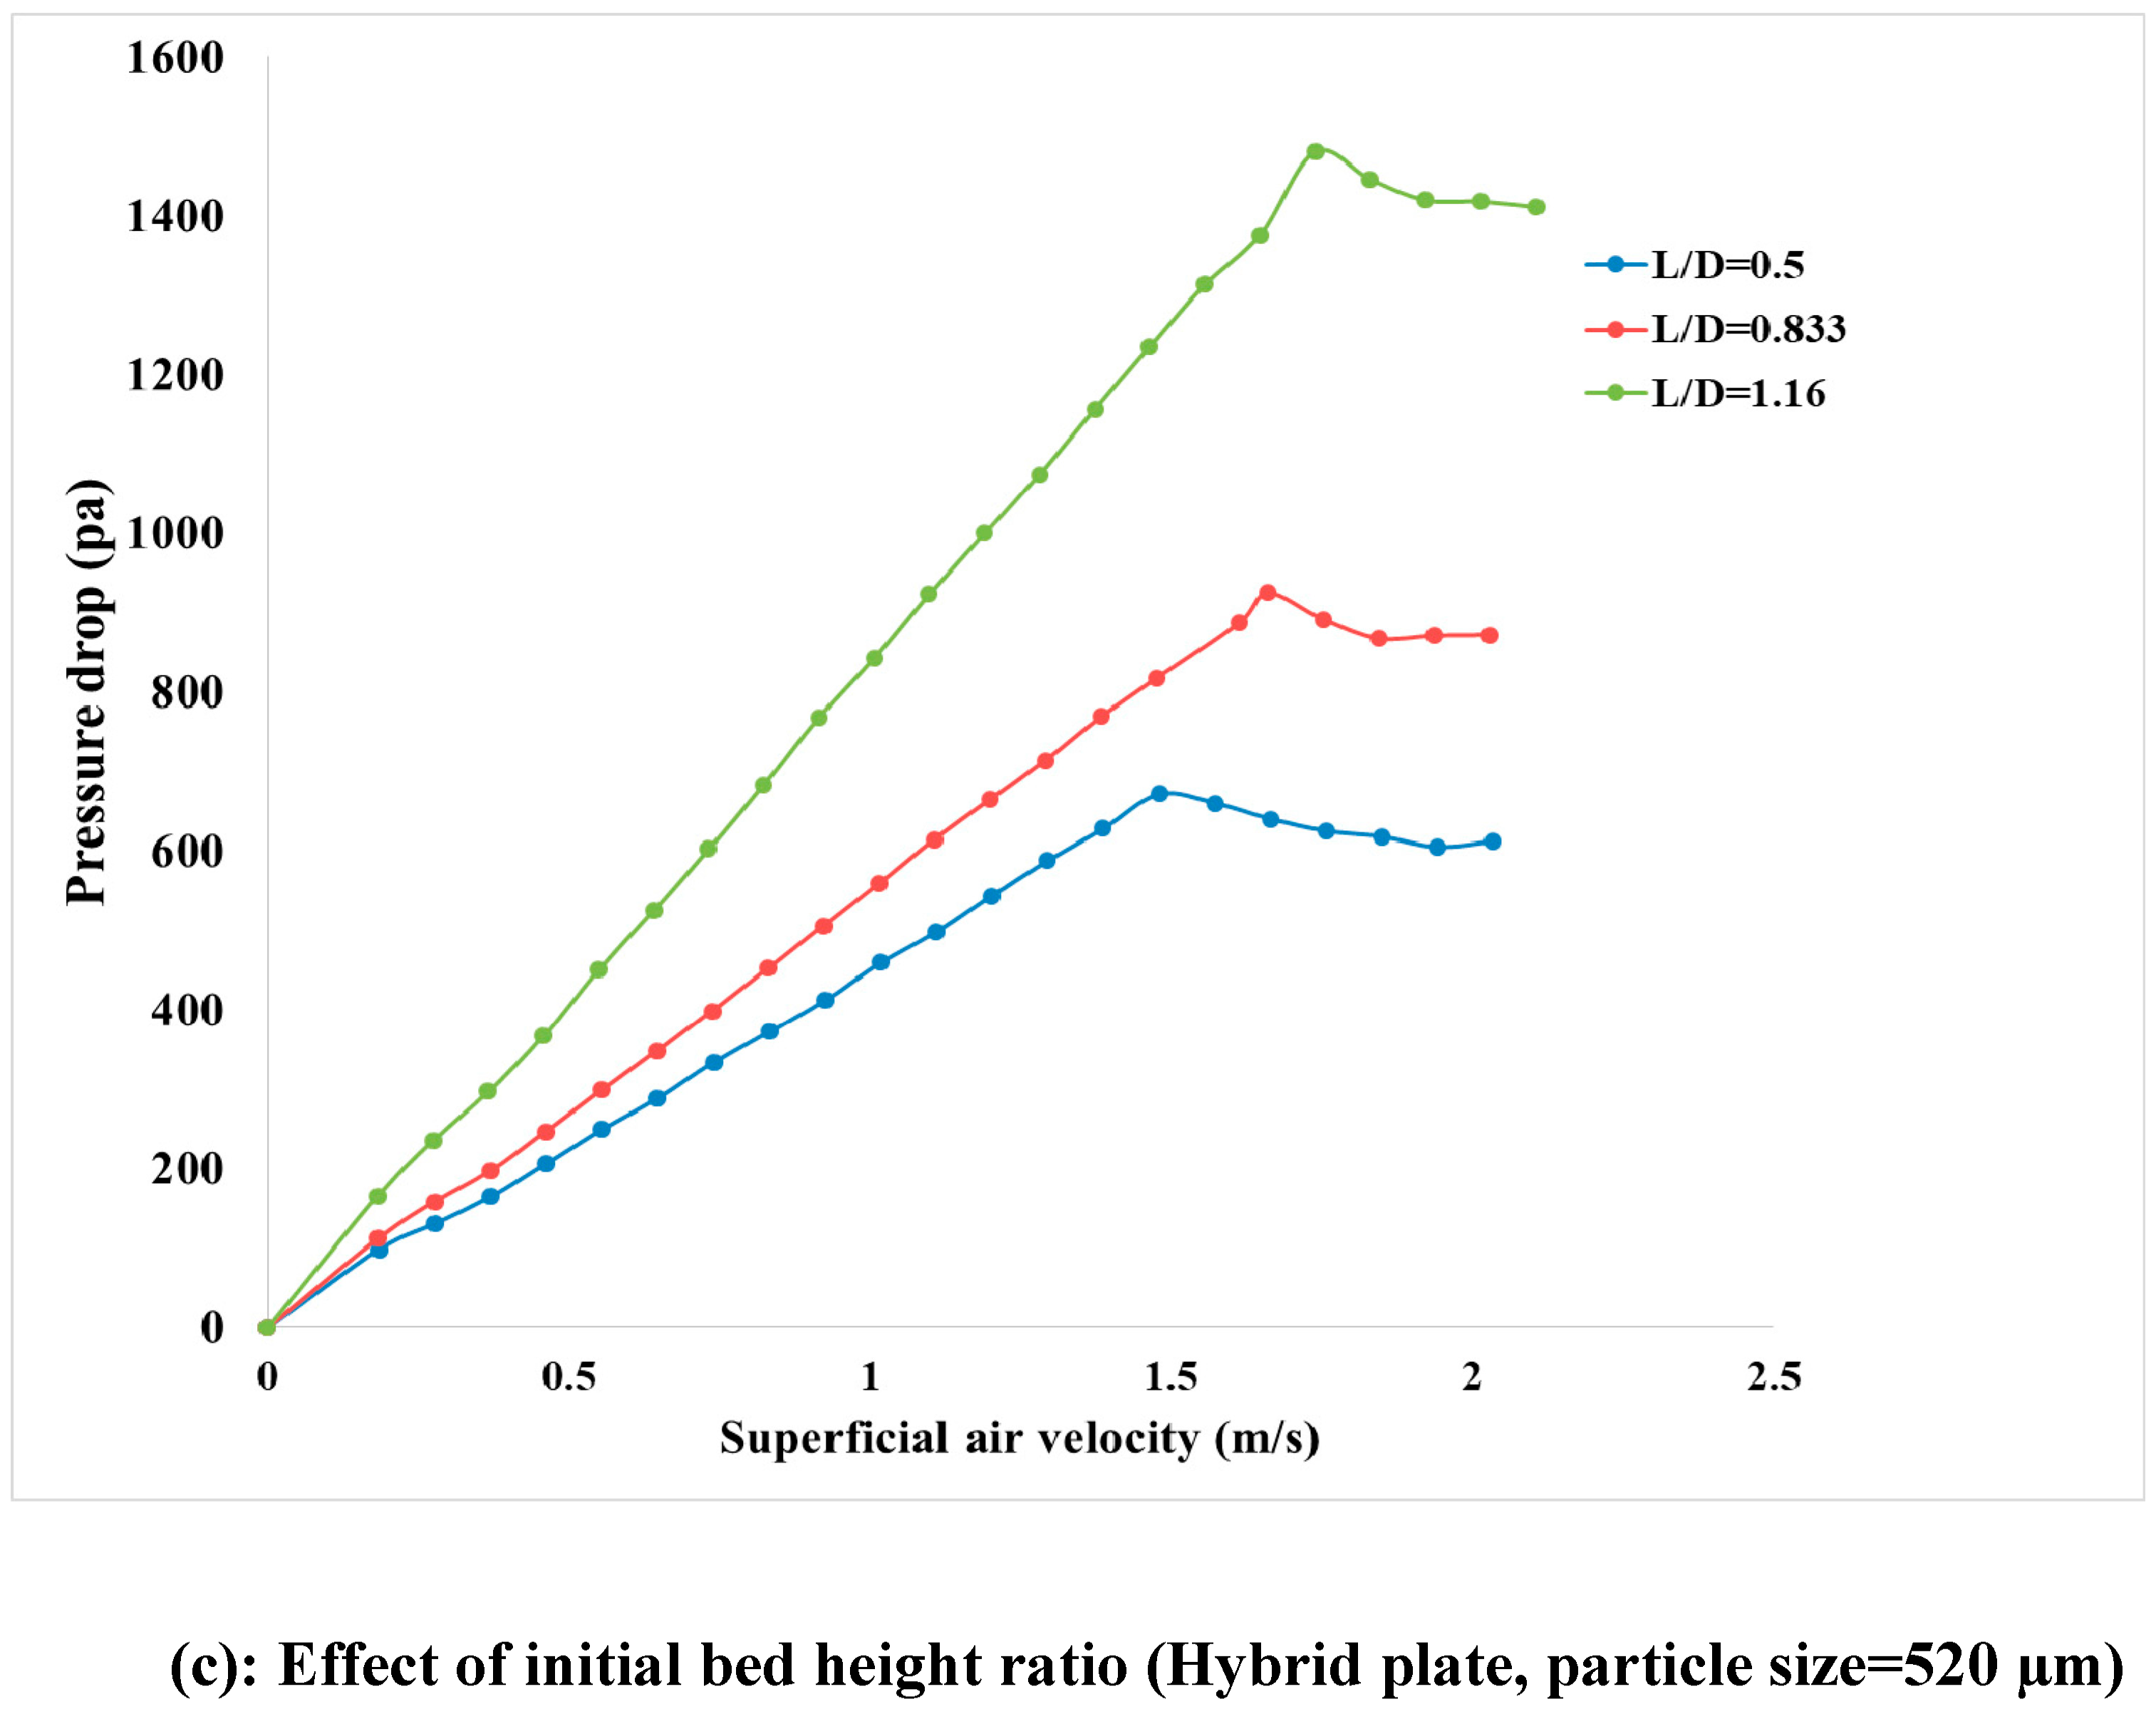
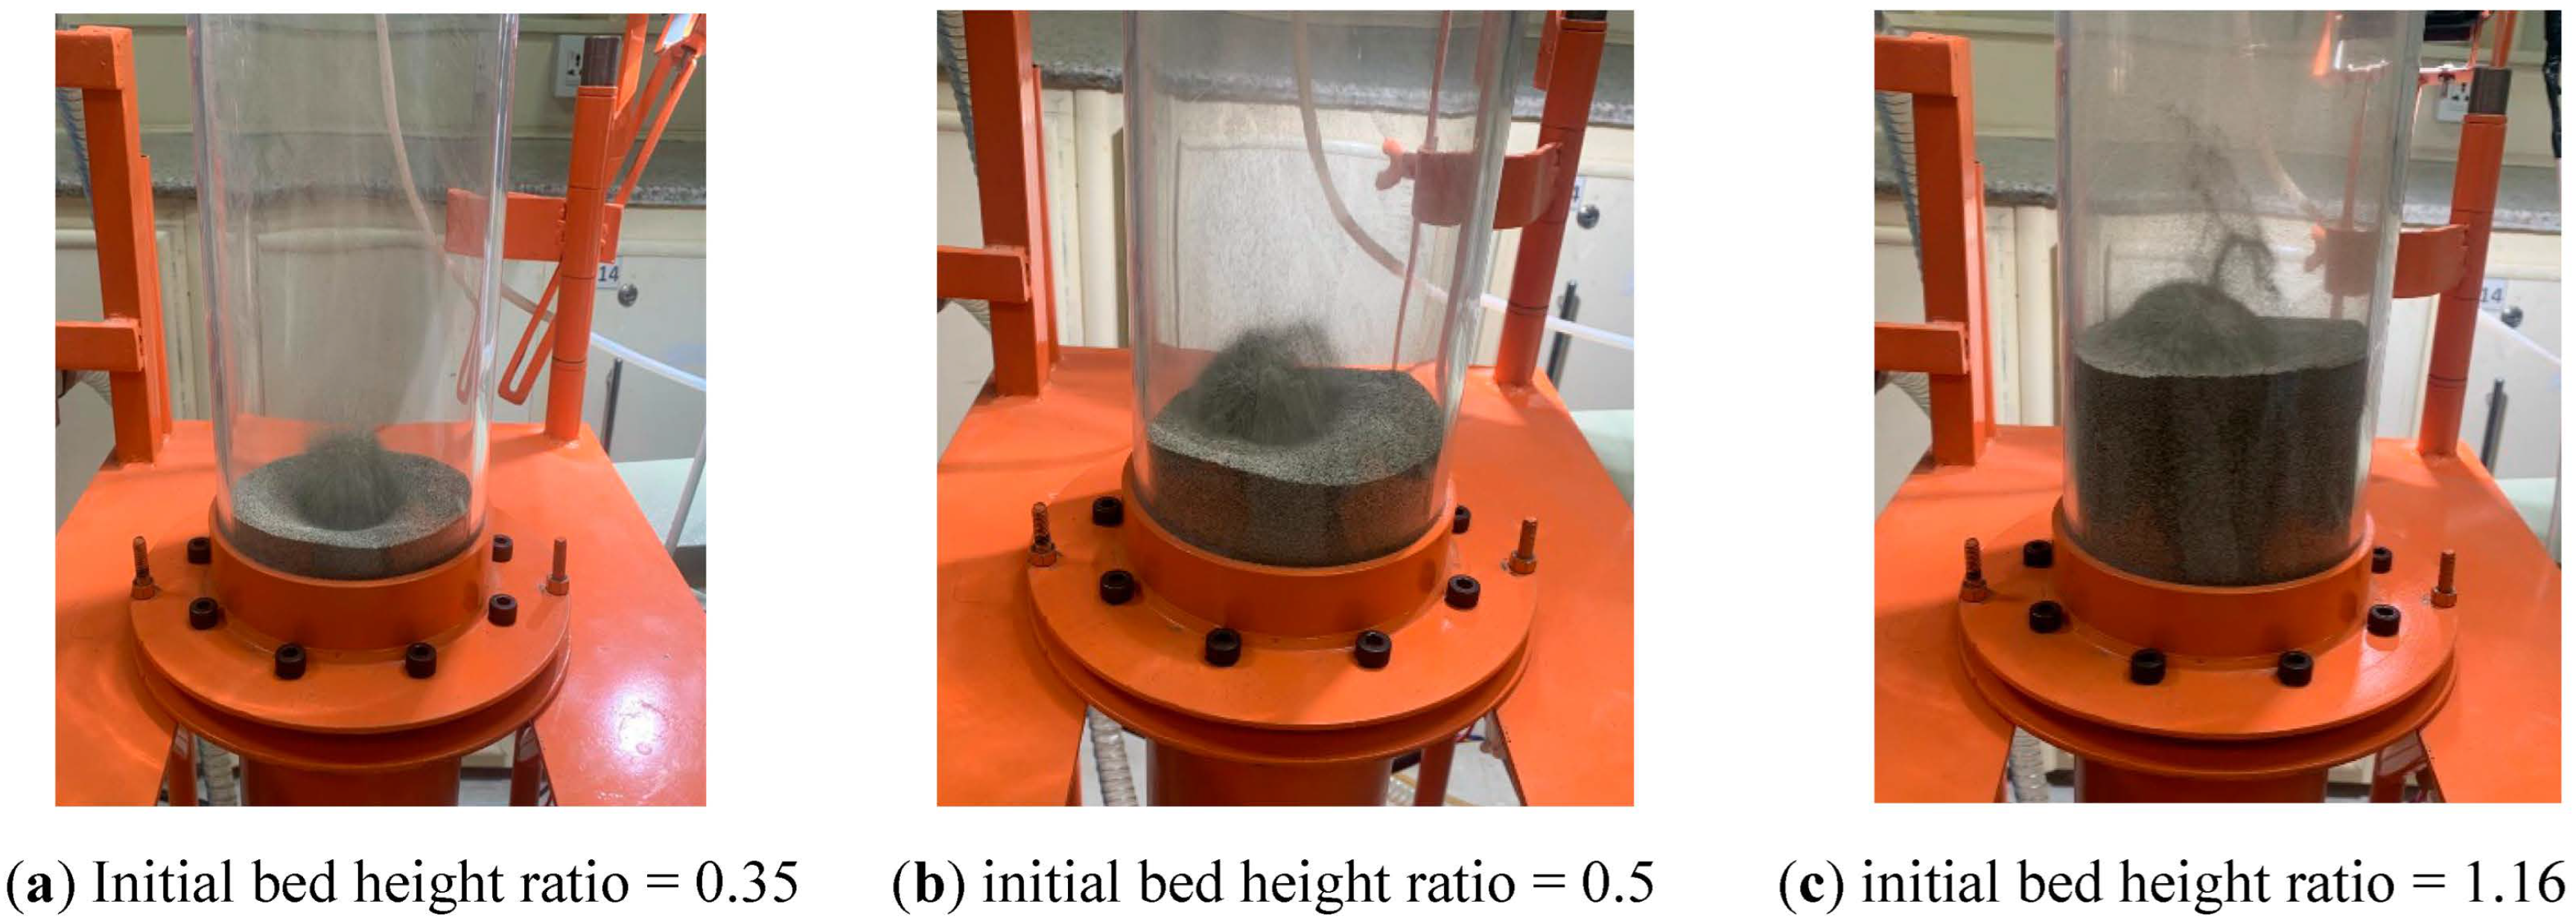
4.2. Effect of Initial Bed Height

Several experiments were carried out using three distributor plates by varying initial depth heights to observe the effect of bed aspect ratio on the hydrodynamics of bubbling fluidization. Bed particle size and distributor plate were kept constant for the set of bed aspect ratios, and variation in pressure drop was observed with increasing superficial velocity. The same had been carried out for the other two plates subsequently. It can be observed from Figure 6a that using perorated distributor plate, with increasing initial bed height, bed pressure drop also increased, and an average increase in bed pressure drop was found to be 36% for a rise in each bed aspect ratio.
The increase in bed pressure drop was due to an increase in the extra weight of the bed owing to the additional volume of bed material [32]. Hence more pressure and power are required to fluidize a larger solid material. Moreover, minimum fluidization velocity (Umf) had also increased from 1.4 m/s to 1.75 m/s for the lowest and highest bed aspect ratio. The rise in minimum fluidization velocity was due to the additional airflow required to fluidize the deeper bed. Bubbles that rise through the column require more time to travel a longer distance up the column and reach the bed’s surface, where they collapse, causing delayed fluidization and increased Umf.
A similar trend for a rise in bed pressure drop with increasing initial bed height was observed for the 45° slotted plate and hybrid plate in Figure 6b and 6c, respectively. However, the maximum pressure drop was found for a 45° slotted plate for all the bed aspect ratios compared with the other two distributor plates. This effect might be due to the lower open area ratio of the plate and the longer angular slot length causing additional frictional airflow to drag through the angular slots. Thus, additional pressure is required through the distributor plate to fluidize extra bed weight at a higher initial bed height. Moreover, there is a difference in minimum fluidization velocity Umf for shallow and deep beds for 45° slotted and hybrid plates. The difference in minimum fluidization velocity is lesser than 4% for medium and deep beds compared to the difference between medium and shallow beds (11%). The larger difference in Umf between medium and deep beds is due to the bubbles rising with almost similar upward velocity up to a specific bed height. However, as the bed height was further increased, the bubble rise velocity seemed slightly reduced due to more drag force experienced by all the bubbles hence more delayed bed surface rupturing. It is also pertinent to mention here that angular slots present in a 45° slotted plate and hybrid plate cause the lateral directional flow causing the reduction in an axial component of flow, hence reducing the upper rise velocity component of bubbles, so maximum Umf was observed for these two plates as compared to the perforated plate where the axial component of flow was maximum. The experimental observation with different initial sand bed heights can be seen in Figure 7.

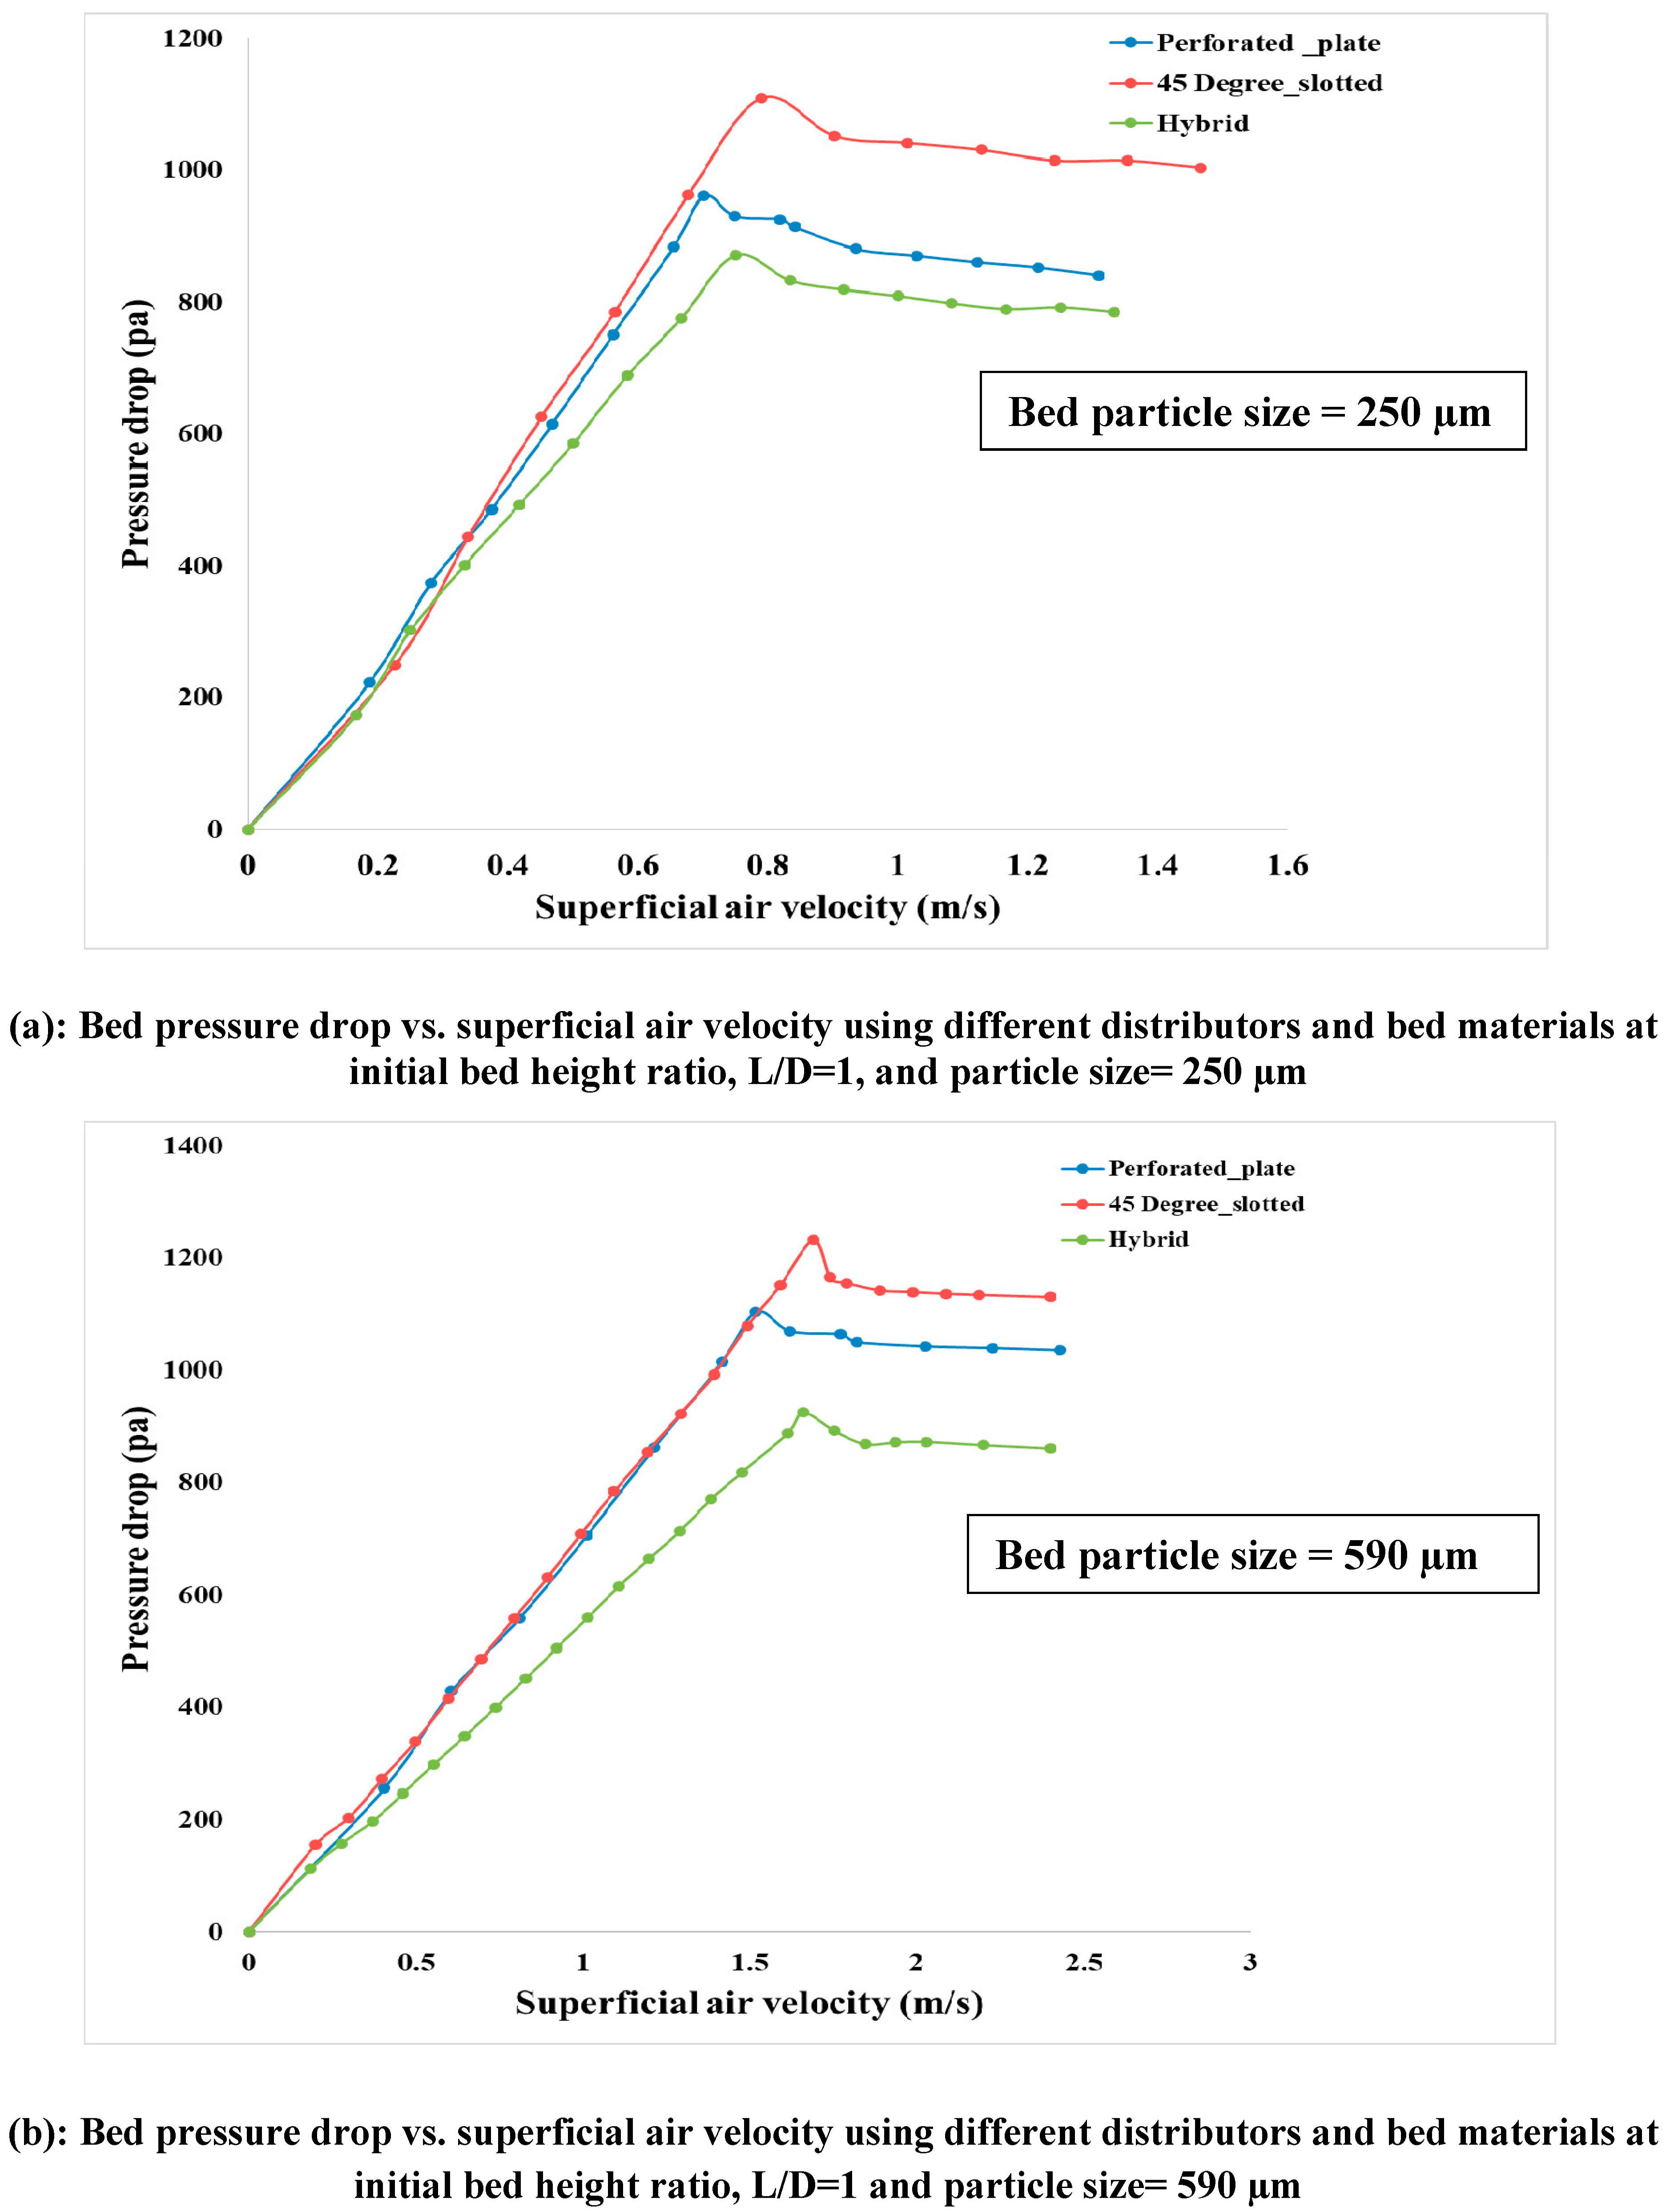
4.3. Effect of Bed Particle Size

In this section effect of particle size on the hydrodynamic characteristics of a fluidized bed was investigated. Pressure drop variation with superficial air velocity was investigated with a varying particle size of bed material. Figure 8 describes the pressure drop variation across the bed with superficial air velocity for different distributor plates at fixed particle size bed material. Three different types of bed material were used with different particle sizes, such as 250 µm, 590 µm, and 850 µm. Bed pressure drop across the bed increased for coarse bed particle size and decreased by employing smaller particles. This effect is due to the formation of relatively larger bubbles in coarse particle bed. When ascending along the fluidization column, these larger bubbles create a larger and longer wake behind them. So due to the formation of this larger suction area formation behind bubbles, many large and small eddies are generated, resulting in form drag due to eddy dissipation and, consequently, loss of total energy of the fluidizing medium. Many researchers also found a similar trend both computationally and experimentally that by increasing particle size, bed pressure drop tend to increase [33].
Conversely, the most probable description of less pressure drop across the bed for smaller-sized bed particles is that the small particles need less pressure to rise. This explanation is also illustrated by Hamzehei [34] in his work on hydrodynamics in a fluidized bed dryer. This effect can also be enlightened by inter-particle forces effects on air bubbles entrainment. Such as, when air passes through smaller particles, particle packing density may decrease due to continuous loading of fluidizing medium and consequently lead to particle-particle loose interaction. Hence smaller size air bubbles entrainment possibly will occur [35]. Therefore, early fluidization results in lower minimum fluidization and lower pressure drop for smaller particles. For example, Ramesh Timsina [36] revealed similar information computationally about the pressure drop rise with the particle size increase and vice versa. On the other hand, additional bed expansion was also observed in smaller particles due to the higher uplift of smaller particles for a similar air flow rate.
Moreover, minimum fluidization velocity also alters with the change in particle size. The figure above shows that minimum fluidization velocity decreases for smaller particles, as smaller particles are susceptible to fluidization at lower volumetric flow rates [37]. This effect mainly happened due to premature vibrations of smaller particles due to smaller bubbles’ entrainment and approaching the bed surface, leading to early initial minimum fluidization velocity. Furthermore, by observing the above graphs of bed particle size with different distributor plates, it can be revealed that the highest-pressure drop is observed with a 45° slotted plate with all three-bed particle sizes. However, minimum fluidization velocity is found to be highest for 45° slotted plates and lowest for perforated plates, and intermediate for novel hybrid plate distributors, as shown in Figure 8a–c. Therefore, using smaller particles with a 45° slotted plate is advantageous in reducing the fluidized bed’s overall pressure drop and minimum fluidization velocity. Also, a novel hybrid plate would be recommended for a broader range of particle size particles, such as a mixture of smaller and larger particles, as intermediate pressure drop and minimum fluidization velocity has found for novel hybrid plate.

4.4. Bubble Dynamics

Bubble rise velocity and the bubble size depend upon the bubble dynamics within the fluidized bed for each distributor plate. The larger openings of distributor plates tend to produce larger bubbles than smaller holes of distributor plates—three types of distributor plates used in this study have different holes and slot sizes. The perforated distributor plate has numerous holes through which smaller bubbles are formed. As they travel up the column, they tend to coalesce and collapse after interacting with the emulsion phase, forming relatively larger and intermediate bubbles. In a 45° slotted plate, as the opening of slots is larger compared to holes, larger bubbles are produced, and after amalgamating, they form even larger bubbles. Due to the larger surface area, the drag force they experience during their upward travel is also higher, so they move slower than smaller bubbles. The absolute bubble rise velocity for each distributor plate differs from the ratio of minimum bubble rise velocity (Umf,b) and minimum fluidization velocity (Umf,f) due to different volumetric flow rates of fluidizing air to achieve an incipient fluidized state. The ratio of Umf,b to Umf,f indicates the bubble dynamics, which depicts bubbles’ early or delayed approach to the bed’s surface.

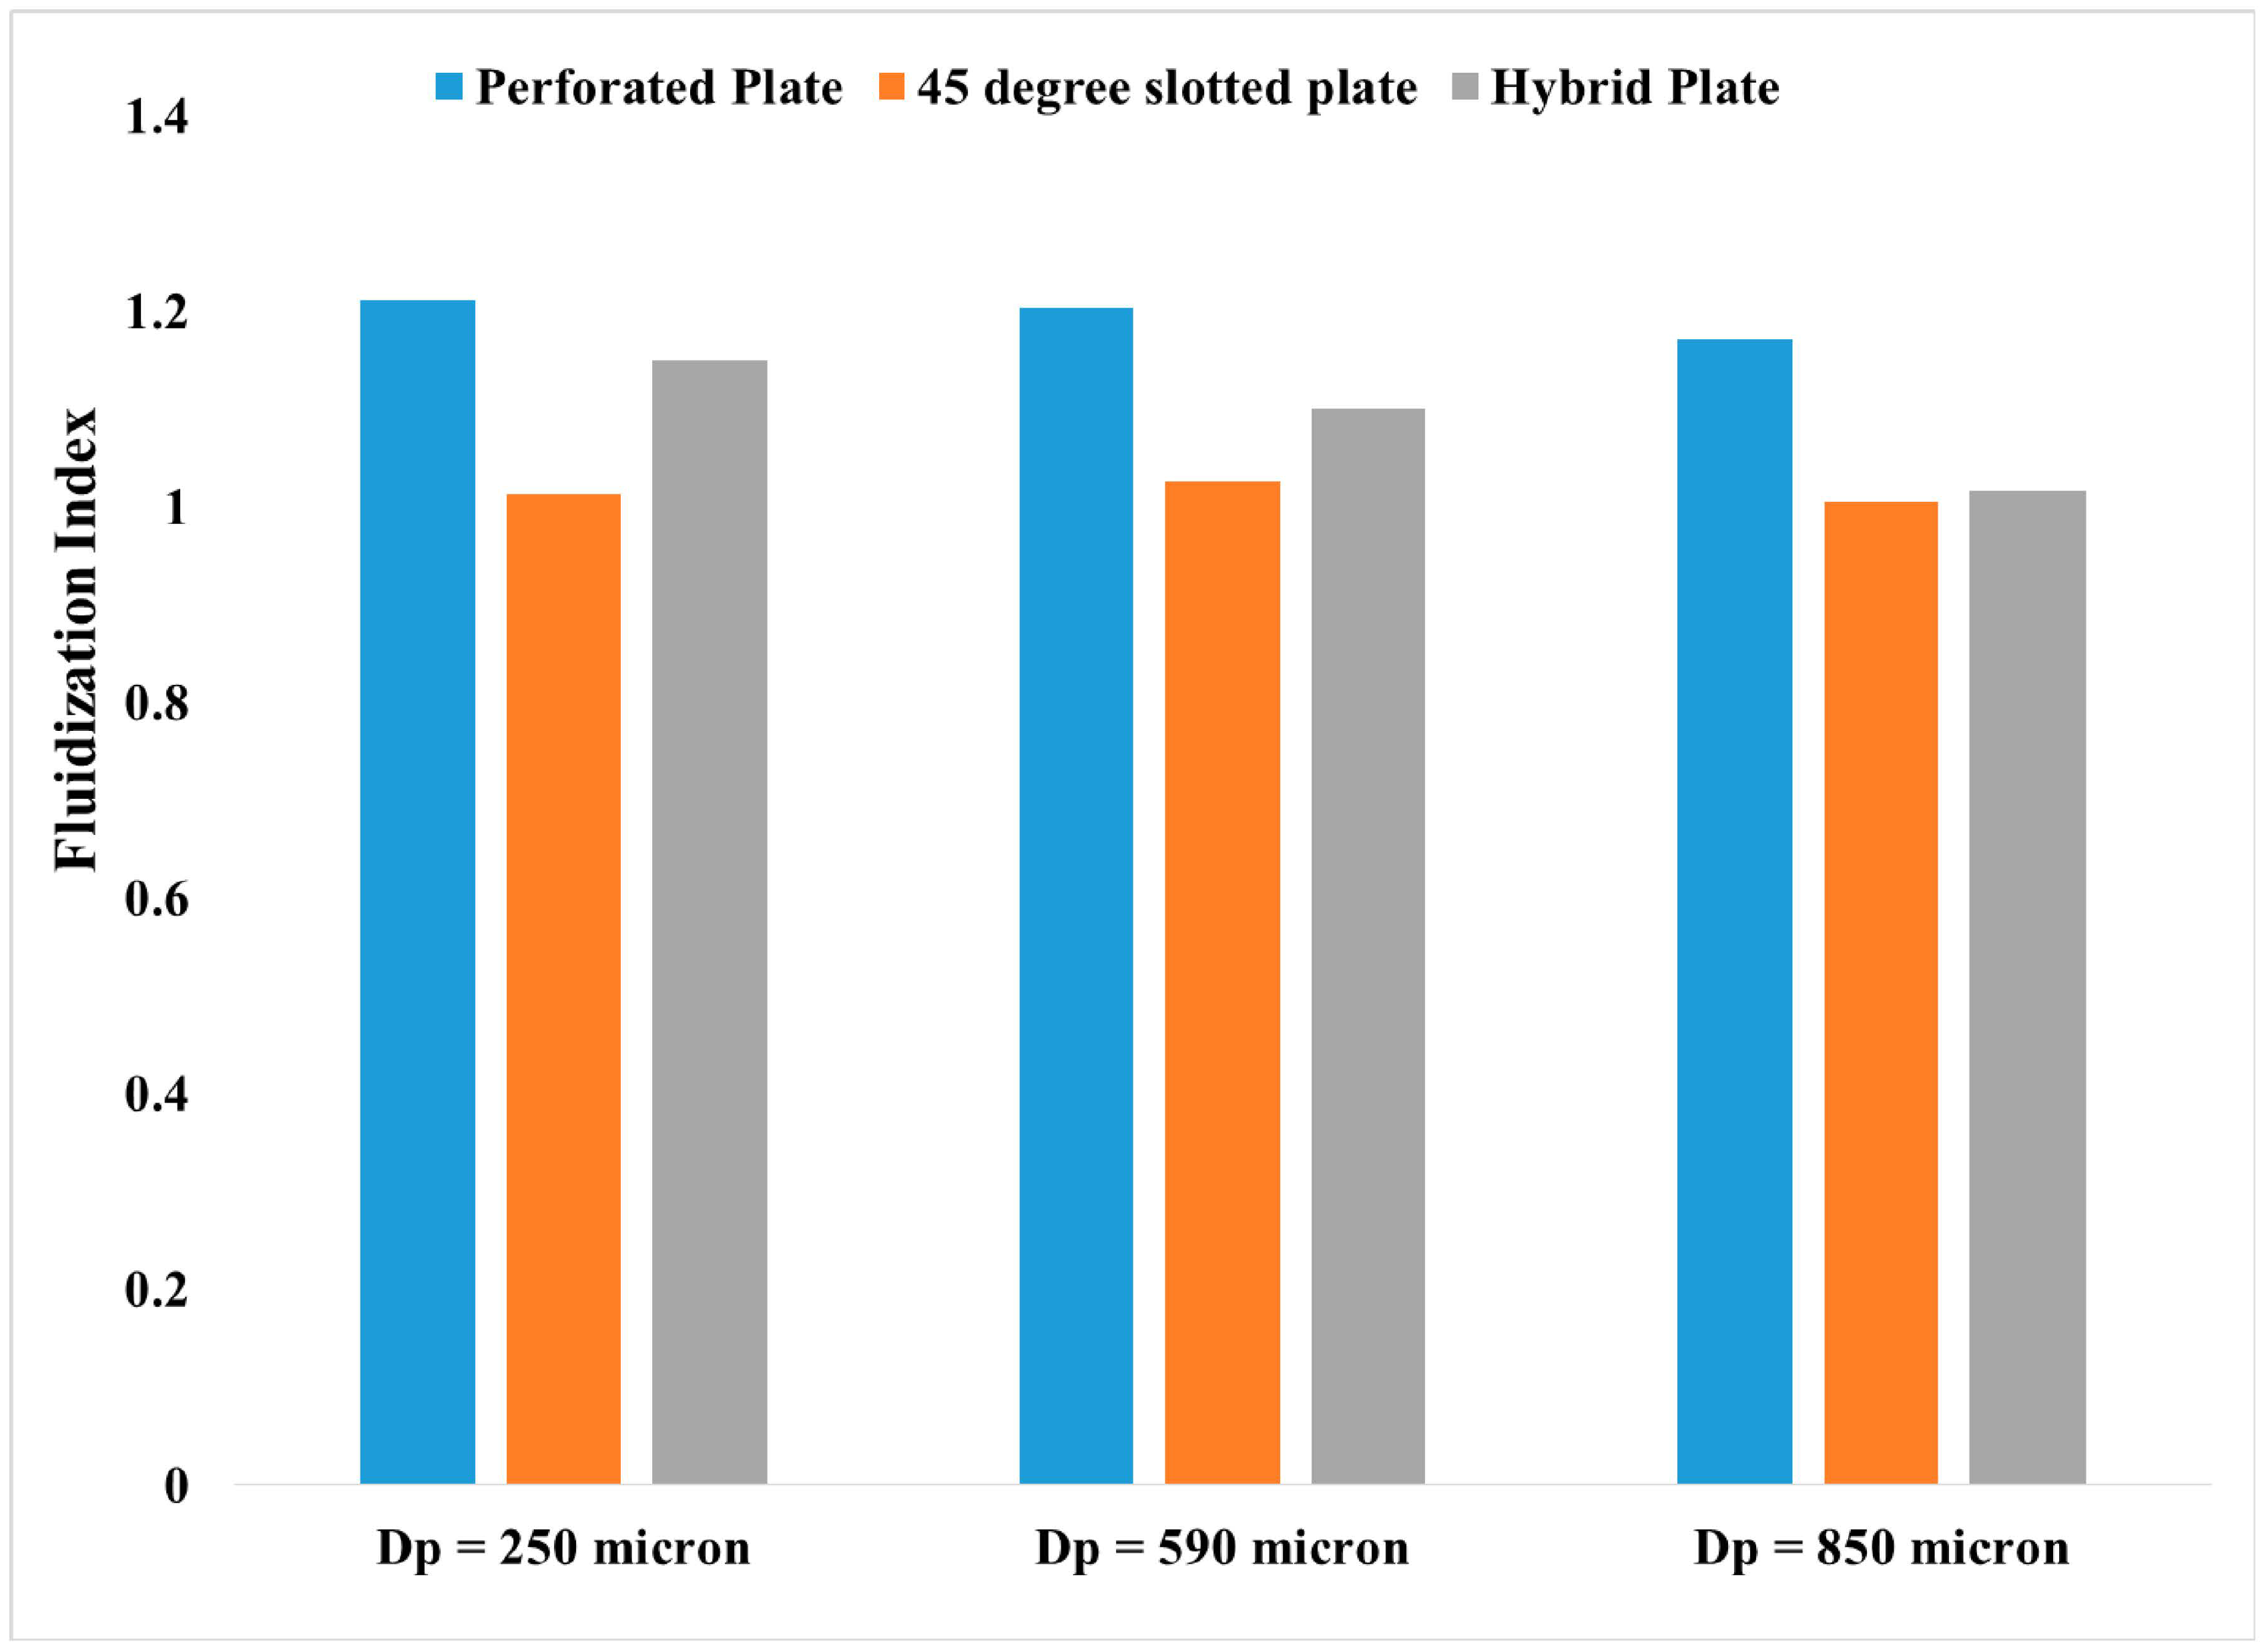
4.4.1. Fluidization Index (F.I.)

The fluidization quality can be examined through a vital parameter, a fluidization index (F.I.). This index is the ratio of minimum bubble rise velocity (Umf,b) and the minimum fluidization or incipient velocity of fluidization (Umf,f). This parameter provides information about the maximum expansion of the fluidized bed. Abrahamsen and Galdart [38] investigated the fluidization index for the fluidization of different sizes of powders and found that the index is maximum for Gardart group A particles. It was established previously that the bed could grasp more fluidizing air between the minimum fluidization velocity and bubbling rise velocity point for higher F.I. This means that there is less likelihood of bubbles formation at the surface of the static bed for initial superficial velocities increments between these two points (Umf,b and Umf,f) [39]. Most of the researchers have investigated the fluidization behavior of F.I with different types of solid particles. In this study fluidization index is evaluated for three different types of distributor plates to observe the hydrodynamic behavior of fluidized bed under different operational conditions. It has been predicted that under similar operating conditions, the minimum bubbling rise velocity (Umf,b) and F.I. are found to be maximum for perforated plate and minimum for 45° slotted plate distributor. However, for the hybrid plate distributor, F.I and Umf,b is found to be in between perforated and 45° slotted plate. Such behavior is owing to the bubble dynamic within the fluidized zone, as different sizes of bubbles form as they emerge through the distributor plates. Moreover, the further collapse and amalgamation of these bubbles are quite different for different distributor plate as they move up the column of a gasifier.
A high-speed camera is installed during the experimentation to record the fluidization phenomena. With the help of slow-motion flicks of the phenomena, the bubble rise velocity is calculated by measuring the time a bubble travels from the bottom to the surface of the bed, where it erupts for each distributor plate. It can be observed from the graphs below in Figure 9 that for the perforated distributor plate, the bubble rise velocity ratio is found to be highest (1.211) for the superficial velocity of Umf, the particle size of 590 µm and the initial bed height of 10 cm. In contrast, the bubble rise velocity ratio for a 45° slotted plate was slightly less (1.026) owing to the larger bubble size. The intermediate bubble rise velocity ratio (1.10) was observed for the hybrid plate distributor due to the intermediate-size air bubbles experiencing medium drag force during their upward path.
Figure 9 shows that the bubble rise velocity ratio (F.I.) is maximum for perforated plate distributor flowed by hybrid plate. The lowest fluidization index (F.I.) is found for a 45° distributor plate. It is also found that increasing superficial air velocity for each distributor plate increases the bubble rise velocity but not in a linear trend. The drag force of bubbles increases with the square of the velocity as the velocity increases; hence, the bubble velocity is not in the same order as superficial air velocity. As sand and air both act as a fluid in the fluidization phenomena so the object, which is a bubble here, can experience drag force with a square of the velocity according to the relation below:
FD = 0.5 ρ V2 A CD
where FD is the drag force of the bubbles, ρ is the density of the fluid, A is the reference area, V is the relative velocity of the object (bubbles) in the fluid, and CD is the drag coefficient. For the perforated distributor plate, there is more fluidization air to grasp within the bed for a range of superficial air velocities compared to the other two plates. This effect is due to the many smaller-sized bubbles forming through numerous smaller size holes in the distributor plate. Once they emerged through the plate’s holes, most bubbles diffuse within the static bed at lower bed heights for lesser initial air flow rates. The remaining smaller bubbles tend to coalesce and form even larger bubbles and eventually break into many smaller bubbles at higher air flow rates as they approach the bed’s upper part. However, for a 45° slotted distributor plate, larger bubbles emerge through the angular slots. Such bubbles coalesce to form even larger bubbles, and the probability of bubbles diffusing within the bed at a lower portion of the bed is very low. So the possibility of gases holding within the static bed is also reduced, resulting in a lower F.I. than perforated distributor plate.
Table 4 illustrate the comparison of the fluidization index for different distributor plate with various particle-size bed.

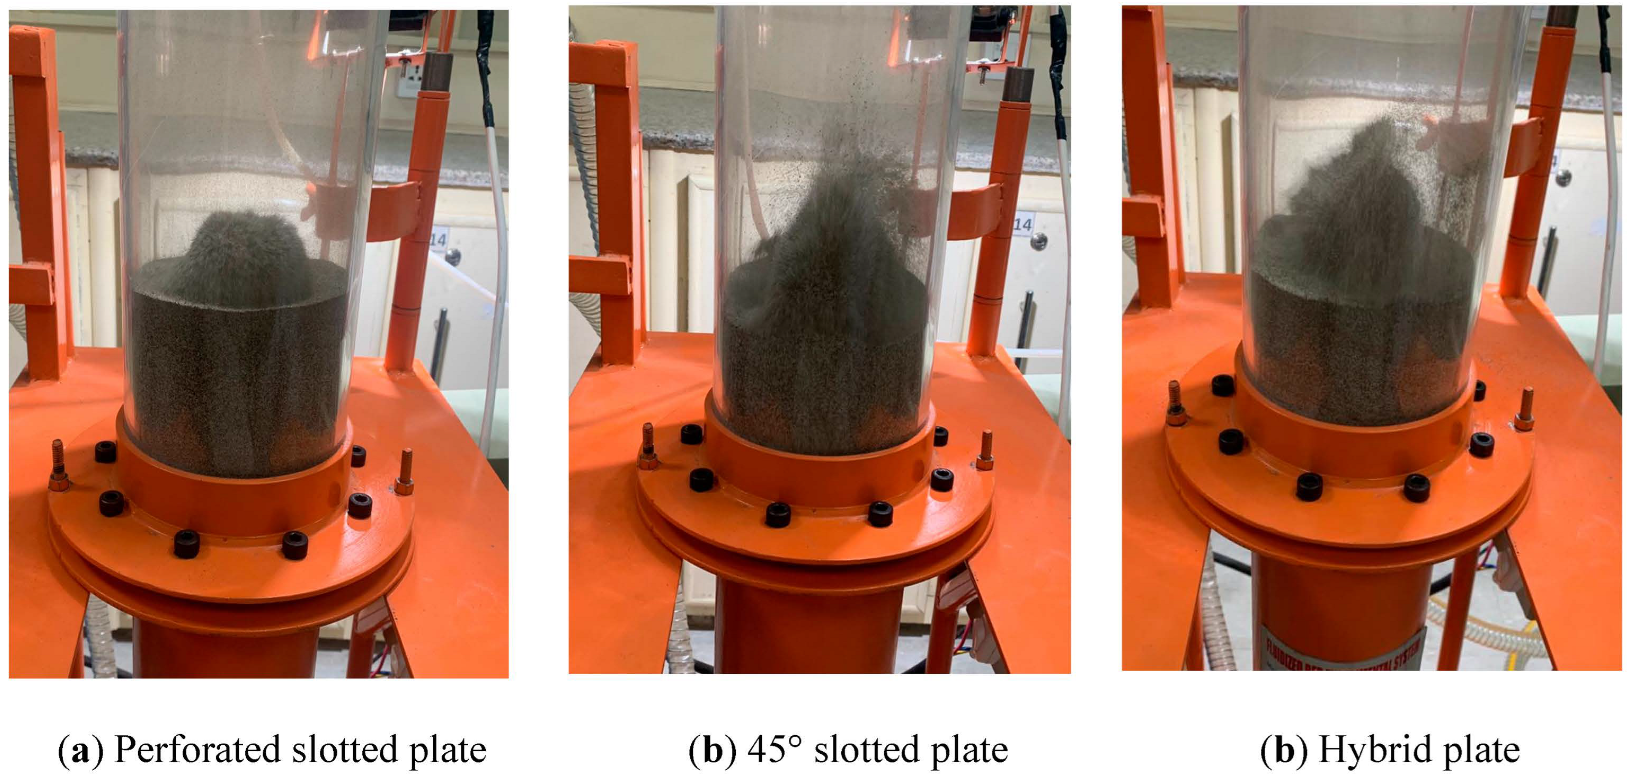
4.4.2. Bubble Rise Dynamics for Novel Hybrid Plate Distributor

Bubble dynamics are shown in Figure 10 below, illustrating the rise of smaller bubbles initially, which coalesce with each other soon as they emerge from the openings of the distributor plate, forming relatively larger bubbles as shown in Figure 10b,c. However, as they advance upward, they collapse and form smaller and intermediate-size bubbles, as shown in Figure 10d at a time interval of 0.04 s. As time passes, the further collapse of bubbles carries on, and smaller bubbles continue to form, as shown in Figure 10e,f, enhancing the mixing characteristics of fluidization phenomena. The merging of smaller bubbles once again starts as they approach the bed surface and form an intermediate-sized bubble. Eventually, a mixture of smaller and medium size bubbles collapses at the bed’s surface, as illustrated in Figure 10g,h.

4.5. Initial Bed Height Rise Ratio and Average Bed Fluctuations

In the experiments of fluidization, instantaneous initial bed height rise is found to be more prominent for 45° distributor plate for shallow beds; however, for deep beds, the initial bed height rise ratio is reduced a bit due to diffusion and collapse of larger bubbles within the deep beds during their travel up the gasifier. The significant initial bed height rise ratio for the 45° slotted plate is owing to the larger bubbles first rupturing at the surface, causing more expansion of the bed surface. However, the instantaneous initial bed height rise for the perforated distributor plate is less bloated due to smaller bubbles rupturing at the bed surface. Furthermore, the average bed fluctuations are more dominant for perforated plate distributors due to numerous smaller-sized bubbles traveling straight up the column having negligible lateral velocities due to the 90° emerging angle to the bed. However, for a 45° slotted plate for deeper beds, bubbles rise along a 45° path, such as the angular path of the inlet airflow, causing the flow’s radial and tangential velocity component to be more prominent in the lower region of the bed. There is a trend of particles and emulsion phases to shift more towards the periphery of the gasifier, so on average, the fluctuations at the surface of the beds have damped. Hence, losing most of the total fluidizing energy while striking more toward the gasifier wall due to centripetal force due to the flow’s tangential velocity component.
On the other hand, the vertically straight holes in the perforated plate distributor cause several smaller bubbles to travel upward, having a maximum axial velocity component resulting in the eruption of bubbles at the bed surface with a prominent average bed fluctuations ratio. However, a hybrid plate causes a mixture of smaller and bigger bubbles due to the blend of openings of larger slots and smaller holes. Thus, intermediate bed height rise was recorded in the experiments, as shown in the graph in Figure 11.
Figure 12 below describes the Initial Bed height rise fluidization phenomena for different distributor plates at 3.0*Umf and initial bed height, L/D = 1.16. The figure depicts the prominent bed height rise for a 45° slotted plate and less for a perforated distributor plate owing to the different bubble sizes approaching the bed surfaces.

5. Computational Analysis

With the advancements in computational resources, CFD is emerging as a viable tool to predict the inner flow behavior of many physical and chemical phenomena. In order to better understand the fluidization phenomena, CFD simulations were carried out to investigate the insight flow dynamics of the fluidized bed for each distributor plate.

5.1. Computational Model

5.1.1. Governing Equations

Conservation of mass and momentum is governed by the continuity and momentum equations individually for solids and gas phases. Two fluid model approach is used for multiphase modeling. The volume of gas (air) and solid phase (particle) is defined by Equation (1a,b).
ν a = ν α a d ν
ν p = ν α p d ν
Volume fractions of all the phases are equal to unity and expressed by the relation below:
m = 1 n α m = 1
where α m are the volume fractions of all the phases up phase n.
The continuity equations with time for gas, as well as particle phases, are expressed as follows:
t ( α a ρ a ) + · ( α a ρ a V a )
t ( α p ρ p ) + · ( α p ρ p V p )
The following equations represent the conservation of momentum for the gas and solid phases.
t ( α a ρ a V a ) + · ( α a ρ a V a V a ) = α a p a + · τ a ¯ ¯ + α a ρ a g + β a p ( V a V p )
t ( α p ρ p V p ) + · ( α p ρ p V p V p ) = α p p p + · τ p ¯ ¯ + α p ρ p g + β a p ( V p V a )
where V a and V p are air and particle phase velocities, respectively. Also τ a ¯ ¯ τ p ¯ ¯ are the gas and particle phase strain tensor, respectively and is expressed as
τ a ¯ ¯ = α a μ a ( V a + V a τ + α a ( λ a 2 3 μ a ) ) · V a I =
τ p ¯ ¯ = α p μ p ( V p + V p τ ) + α p ( λ p 2 3 μ p ) ) · V p I =

5.1.2. Turbulence Model

The velocity field in turbulent flows continuously varies with time and space. Therefore, the transport equations’ quantities, such as momentum, energy, and species concentration, also fluctuate. In order to capture all these fluctuations, which can be small or large, it is expensive to capture all these computationally. The alternate way to simulate such a phenomenon is to introduce a modified set of equations. These equations are time-averaged Navier stokes equations which are computationally less expensive to be solved by replacing the instantaneous governing equations to remove the small time scale fluctuations. However, the modifications of the instantaneous governing equations introduce new unknown variables. Therefore, many turbulence models have been developed to determine these new unknown variables (such as Reynolds stresses or higher-order terms in terms of known variables or low-order terms. The k-ε model, a two-equation model, is used in all the simulations of gas-solid flows in the gasifier. The k-ε model is further categorized into three types as Standard k-ε model, the RNG k-ε model, and the Realizable k-ε model. The standard k-ε model is employed for the simulations.

5.1.3. Computational Methodology

Table 5 below describes the fluid properties and simulation parameters.

5.1.4. Initial and Boundary Conditions

The solution is initialized with the air inlet velocity and gas phase. Afterward, domain patching was done for different initial bed height ratio cases. Sand particles with specified void fractions were patched up to a certain height. Velocity inlet boundary condition was employed for air inlet, whereas sand inlet was taken as zero. The upper part of the domain was taken as the pressure outlet boundary. All other boundaries, including plate, holes and side walls of the gasifier, were taken as no-slip wall boundary conditions.

5.2. Geometry

Cold model geometric details were taken from the experimental setup to generate the computational geometry for mesh generation and then for computational analysis. Geometry was created in the design modeler of the ANSYS workbench. Three distributor plate geometries and the cylindrical fluidization section were created, which is the area of interest. The geometry of the fluidization column and distributor plates are shown in Figure 13 below.

5.3. Computational Mesh Generation

The geometry domain is sliced into three sections; upper, middle and lower. The lower part is associated with the distributor plate section, where unstructured mesh was generated. However, the structured mesh was generated in the middle and upper sections to capture the fluidization phenomena more accurately. The structured mesh is renowned for being more efficient for the quality and quantity of computational results. A hybrid mesh which is a combination of unstructured and structured mesh, is shown in Figure 14.

5.4. Grid Independence Study

In the grid independence study section, three types of meshes were generated. Coarse mesh has a mesh size of 0.4 million cells, medium mesh with 1.2 million cells, and the fine mesh has 2.0 million cells using a perforated distributor plate. For each grid, simulations were carried out for fixed initial bed height, same particle size, and superficial velocity equal to 1.5*Umf. The pressure drop across the bed was compared with the experimental data. It was found that the computational pressure drop was not in good agreement with coarse mesh compared to medium and fine mesh (Table 6).
Moreover, the medium and fine mesh results were quite close. Hence medium mesh was selected as an optimum mesh for the rest of the simulations. Moreover, previous researchers also exposed that as a rule of thumb for solid-gas mixing phenomena, 10 times particle size grid size is recommended for appropriate CFD results [40,41]. This study’s grid size was well under this rule to capture good computational results.
Table 5 above compares CFD and experimental results using various resolutions of grids. It can be concluded from the above table that the pressure drops well matches medium and fine mesh. In contrast, the maximum solid volume fraction at a specified bed height (L/D = 0.4) does not change well for medium and heavy mesh. Therefore medium mesh as an optimum mesh was selected for the computational purpose.
The maximum solid volume fraction along the radius of the gasifier shown in Figure 15 depicts that for coarse mesh, the maximum solid volume fraction is around 0.38. In contrast, it is found to be 0.51 and 0.58 for medium and fine mesh, respectively. Moreover, medium and fine mesh volume fraction trend trends are pretty close. Hence medium mesh based on lower computational cost is preferred for simulations.

5.4.1. CFD Model Validation

The above experimental arguments are also sustenance by the CFD simulations. CFD cases were simulated for three distributor plates with similar operational conditions as of experiments. Fluidization curves were also plotted for CFD results and compared with the experimental data, and CFD results agreed reasonably with experimental results within 10% of error, as shown in Figure 16. Moreover, qualitative results were also analyzed to perceive the insight flow behavior of the fluidized bed. Finally, bubble dynamics were also analyzed in comparison with each distributor plate.

5.4.2. Inside Flow Pattern with Different Distributor Plates

CFD simulations were carried out for 5 s for every case. Pressure drop across the bed, and minimum fluidization velocities were calculated and compared with the experimental. CFD results show good agreement with the experimental results portraying the validity of CFD model used. Qualitative results of iso-surfaces and contours of solid volume fractions revealed smaller bubbles through perforated plate distributors. Larger bubbles formed in the 45° distributor plate due to larger slot openings. Moreover, a blend of larger and smaller bubbles was formed in the case of hybrid plate distributors due to smaller holes and larger slots.
It can be revealed from the above figures that CFD simulations depict the inside flow behavior of a fluidized bed. It can be observed from the contours of the solid volume fraction in Figure 17 that smaller bubbles arise from a perforated plate in contrast with a 45° slotted plate where larger bubbles arise through angular slots, as shown in Figure 17a,b, respectively. However, the hybrid plate portrays the relatively larger bubbles arising through 45° angular slots and smaller bubbles through smaller perforated holes, as shown in Figure 17c. Such behavior can be observed in the iso-surface contours of solid volume fraction in Figure 18, where smaller straight iso-surfaces illustrate the flow of air bubbles through perforated holes of perforated plate. Conversely, for 45° hybrid plate swirling larger iso-surfaces demonstrate the flow of air through angular plate slots exhibiting lateral mixing of solid particles and swirling pattern in shallow bed as shown in Figure 18b. However, in a deep bed, multi-layer axial-lateral rotation of solids is observed, which is also illustrated by Yudin, 2016 [42] during his experimental work of fluidization using different distributor plates. Whereas in Figure 18c hybrid plate shows the swirling and axial flow blend due to hybrid openings (angular slots + straight smaller holes), which can also lead to more chaotic flow resulting in enhanced mixing in a fluidized bed. Likewise, velocity vectors in Figure 19 also show the flow characteristics inside the fluidized bed for different distributor plates. The perforated plate shows the uniform axial rise of fluid suspension due to smaller air bubbles rising through the central core and descending near the cylindrical walls causing an axial circulatory flow pattern as depicted in Figure 19a. The 45° slotted plate shows a swirling flow pattern observed by velocity vectors in Figure 19b for shallow depth. It is also pertinent to mention here that for shallow initial beds, there is a significant rise of sand bed in 45° slotted plate due to larger bubble size to initial bed ratio, where larger size bubbles approaching promptly to the surface of the bed resulting in significant initial bed height rise. However, deep beds with 45° slotted plate exhibit moderate bed rise due to smaller bubble size to initial bed ratio. The hybrid plate shows a mixed flow pattern in axial and lateral directions due to mixing swirling and straight upward flow of gas solids mixture. Due to blends of bubbles rising through the hybrid distributor plate, a moderate rise and more diverse spread of solid particles are observed through CFD simulation results in Figure 19c.

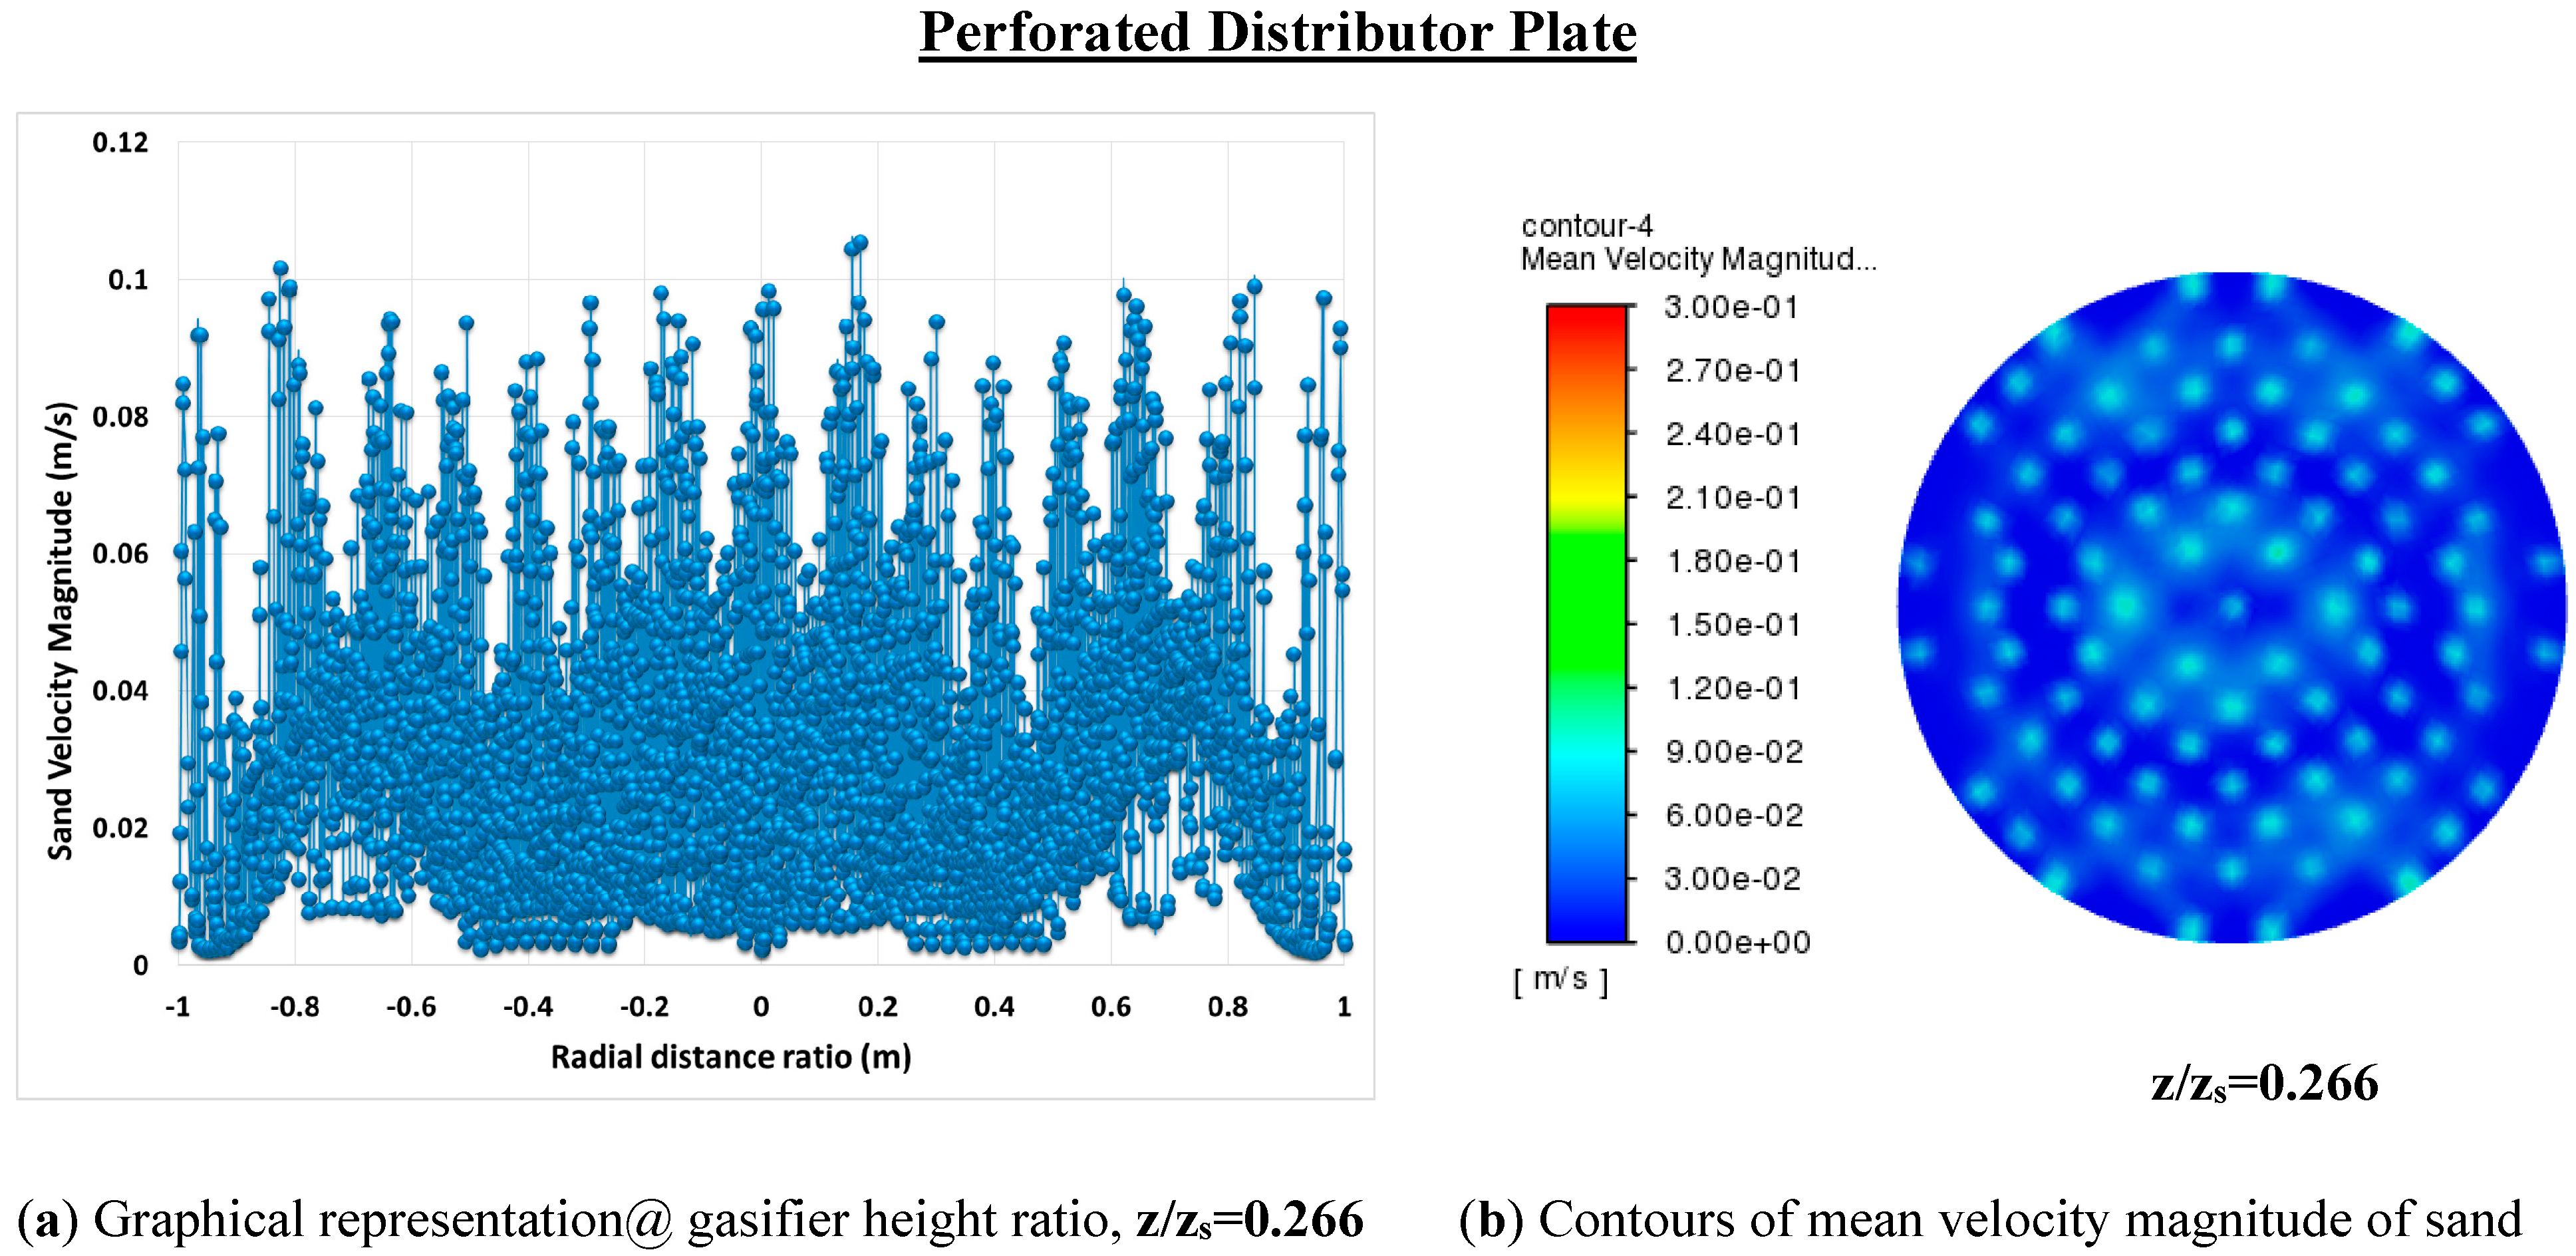
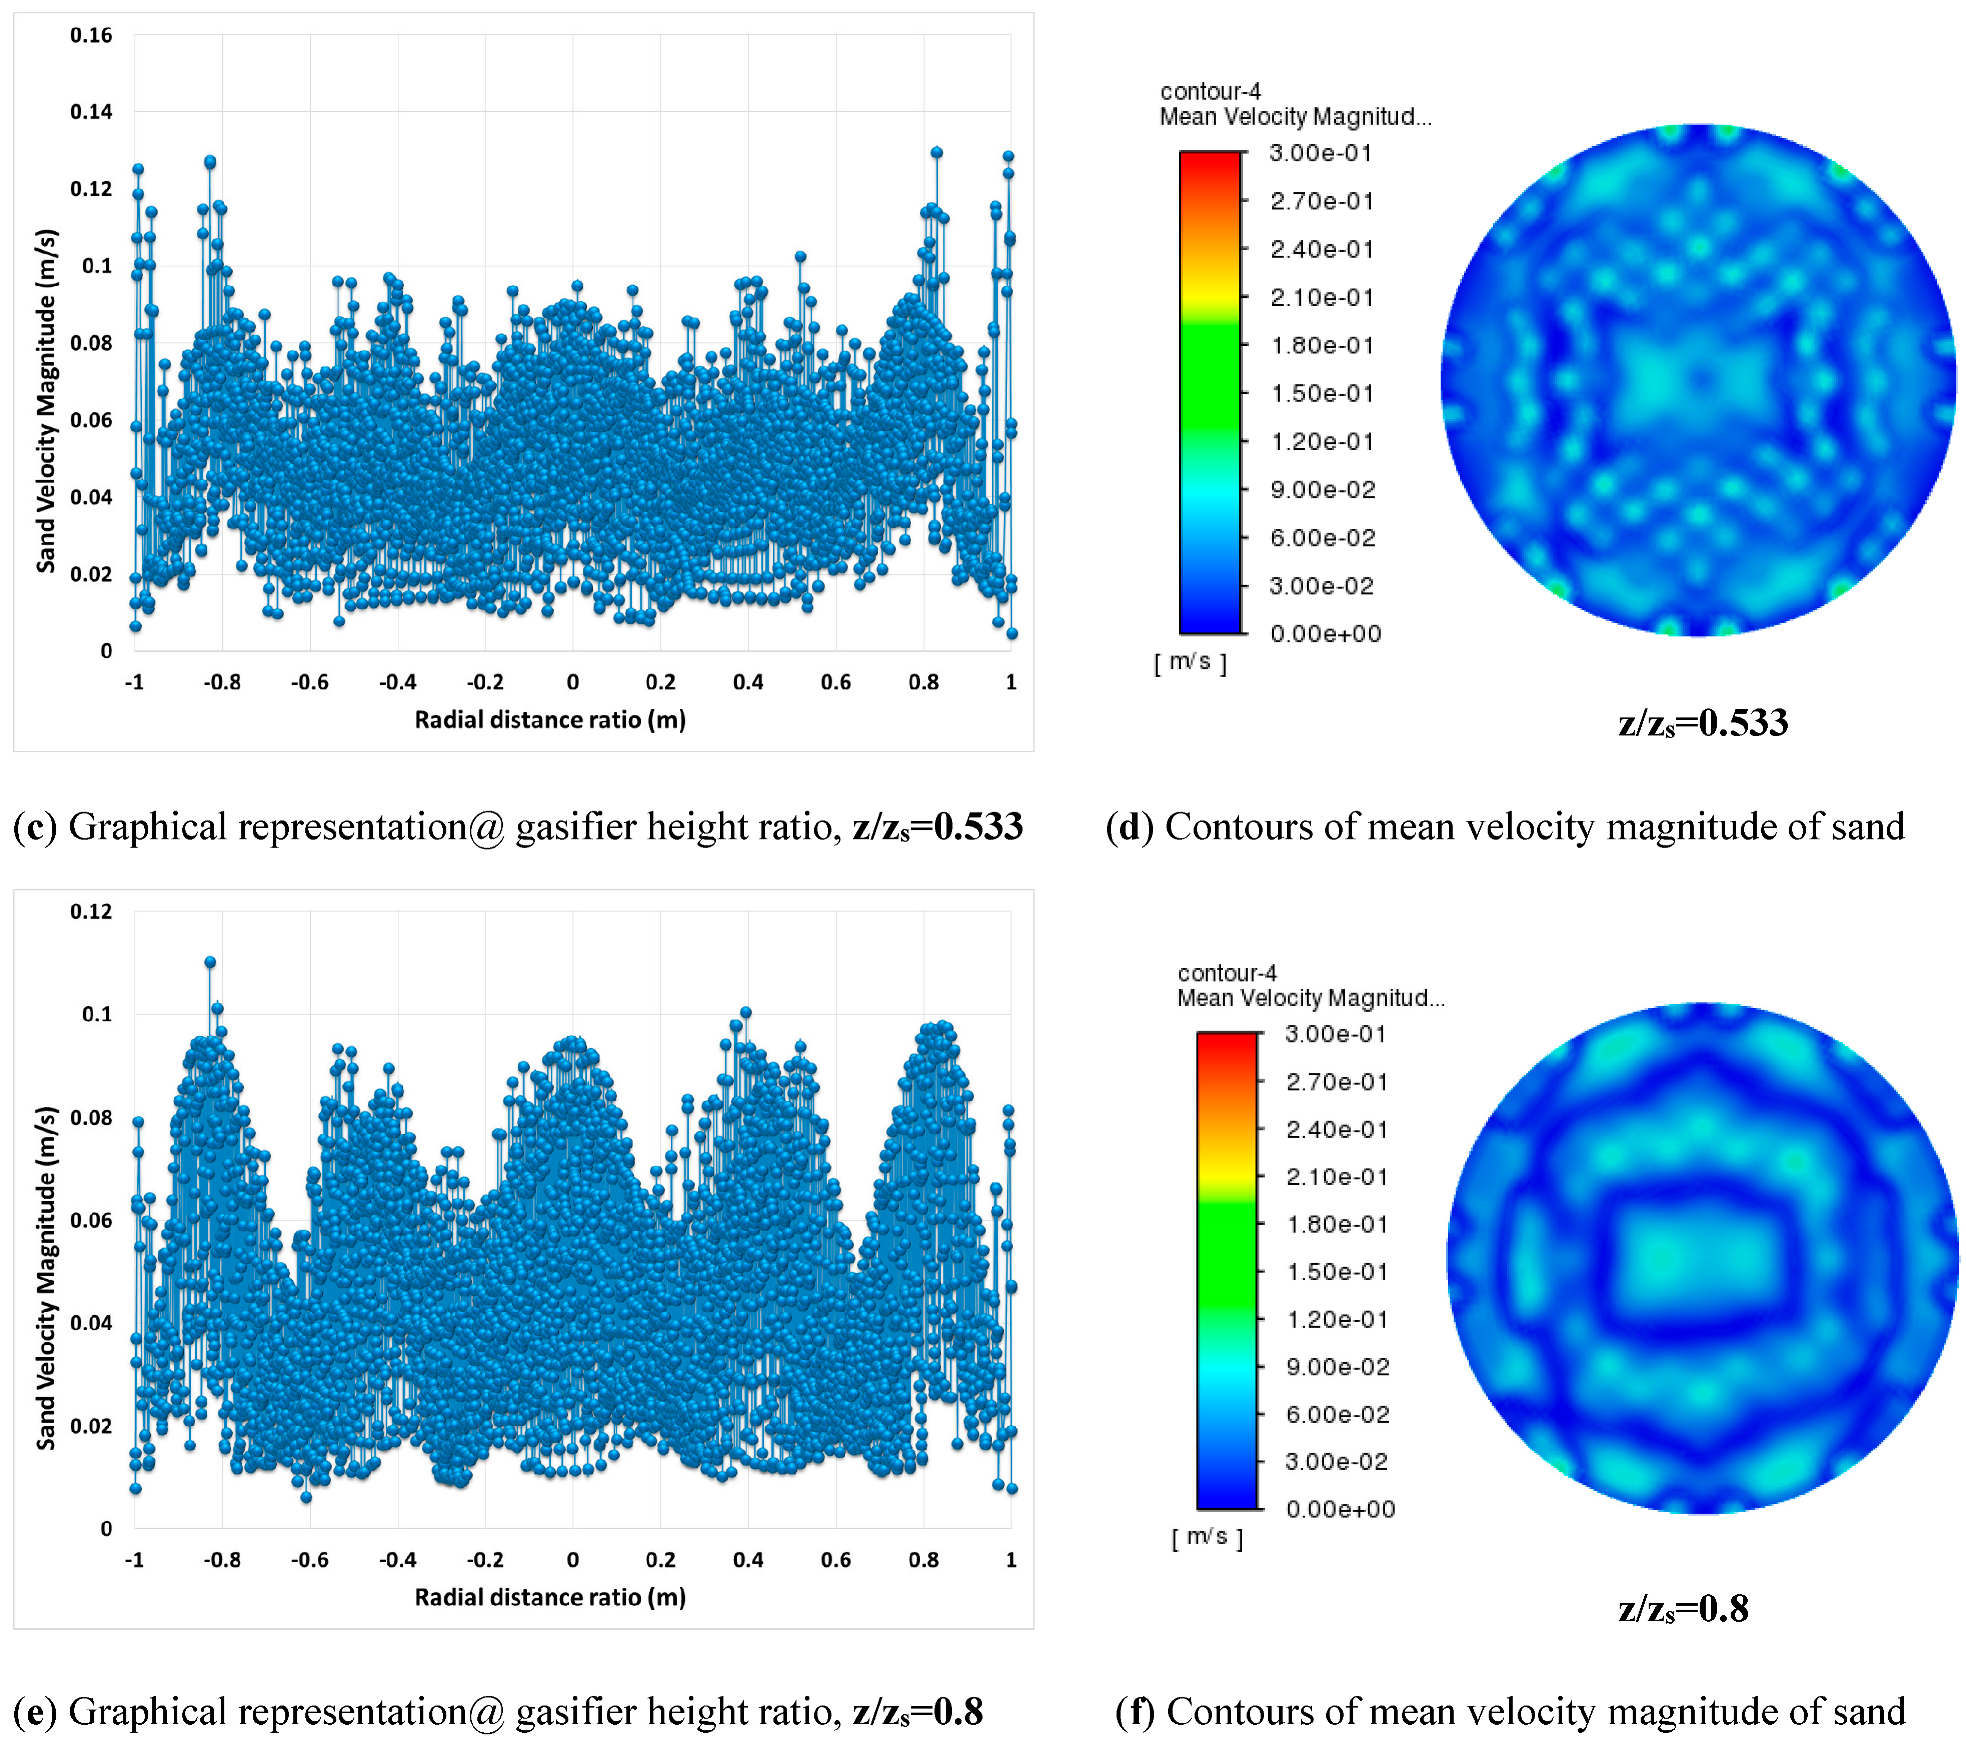
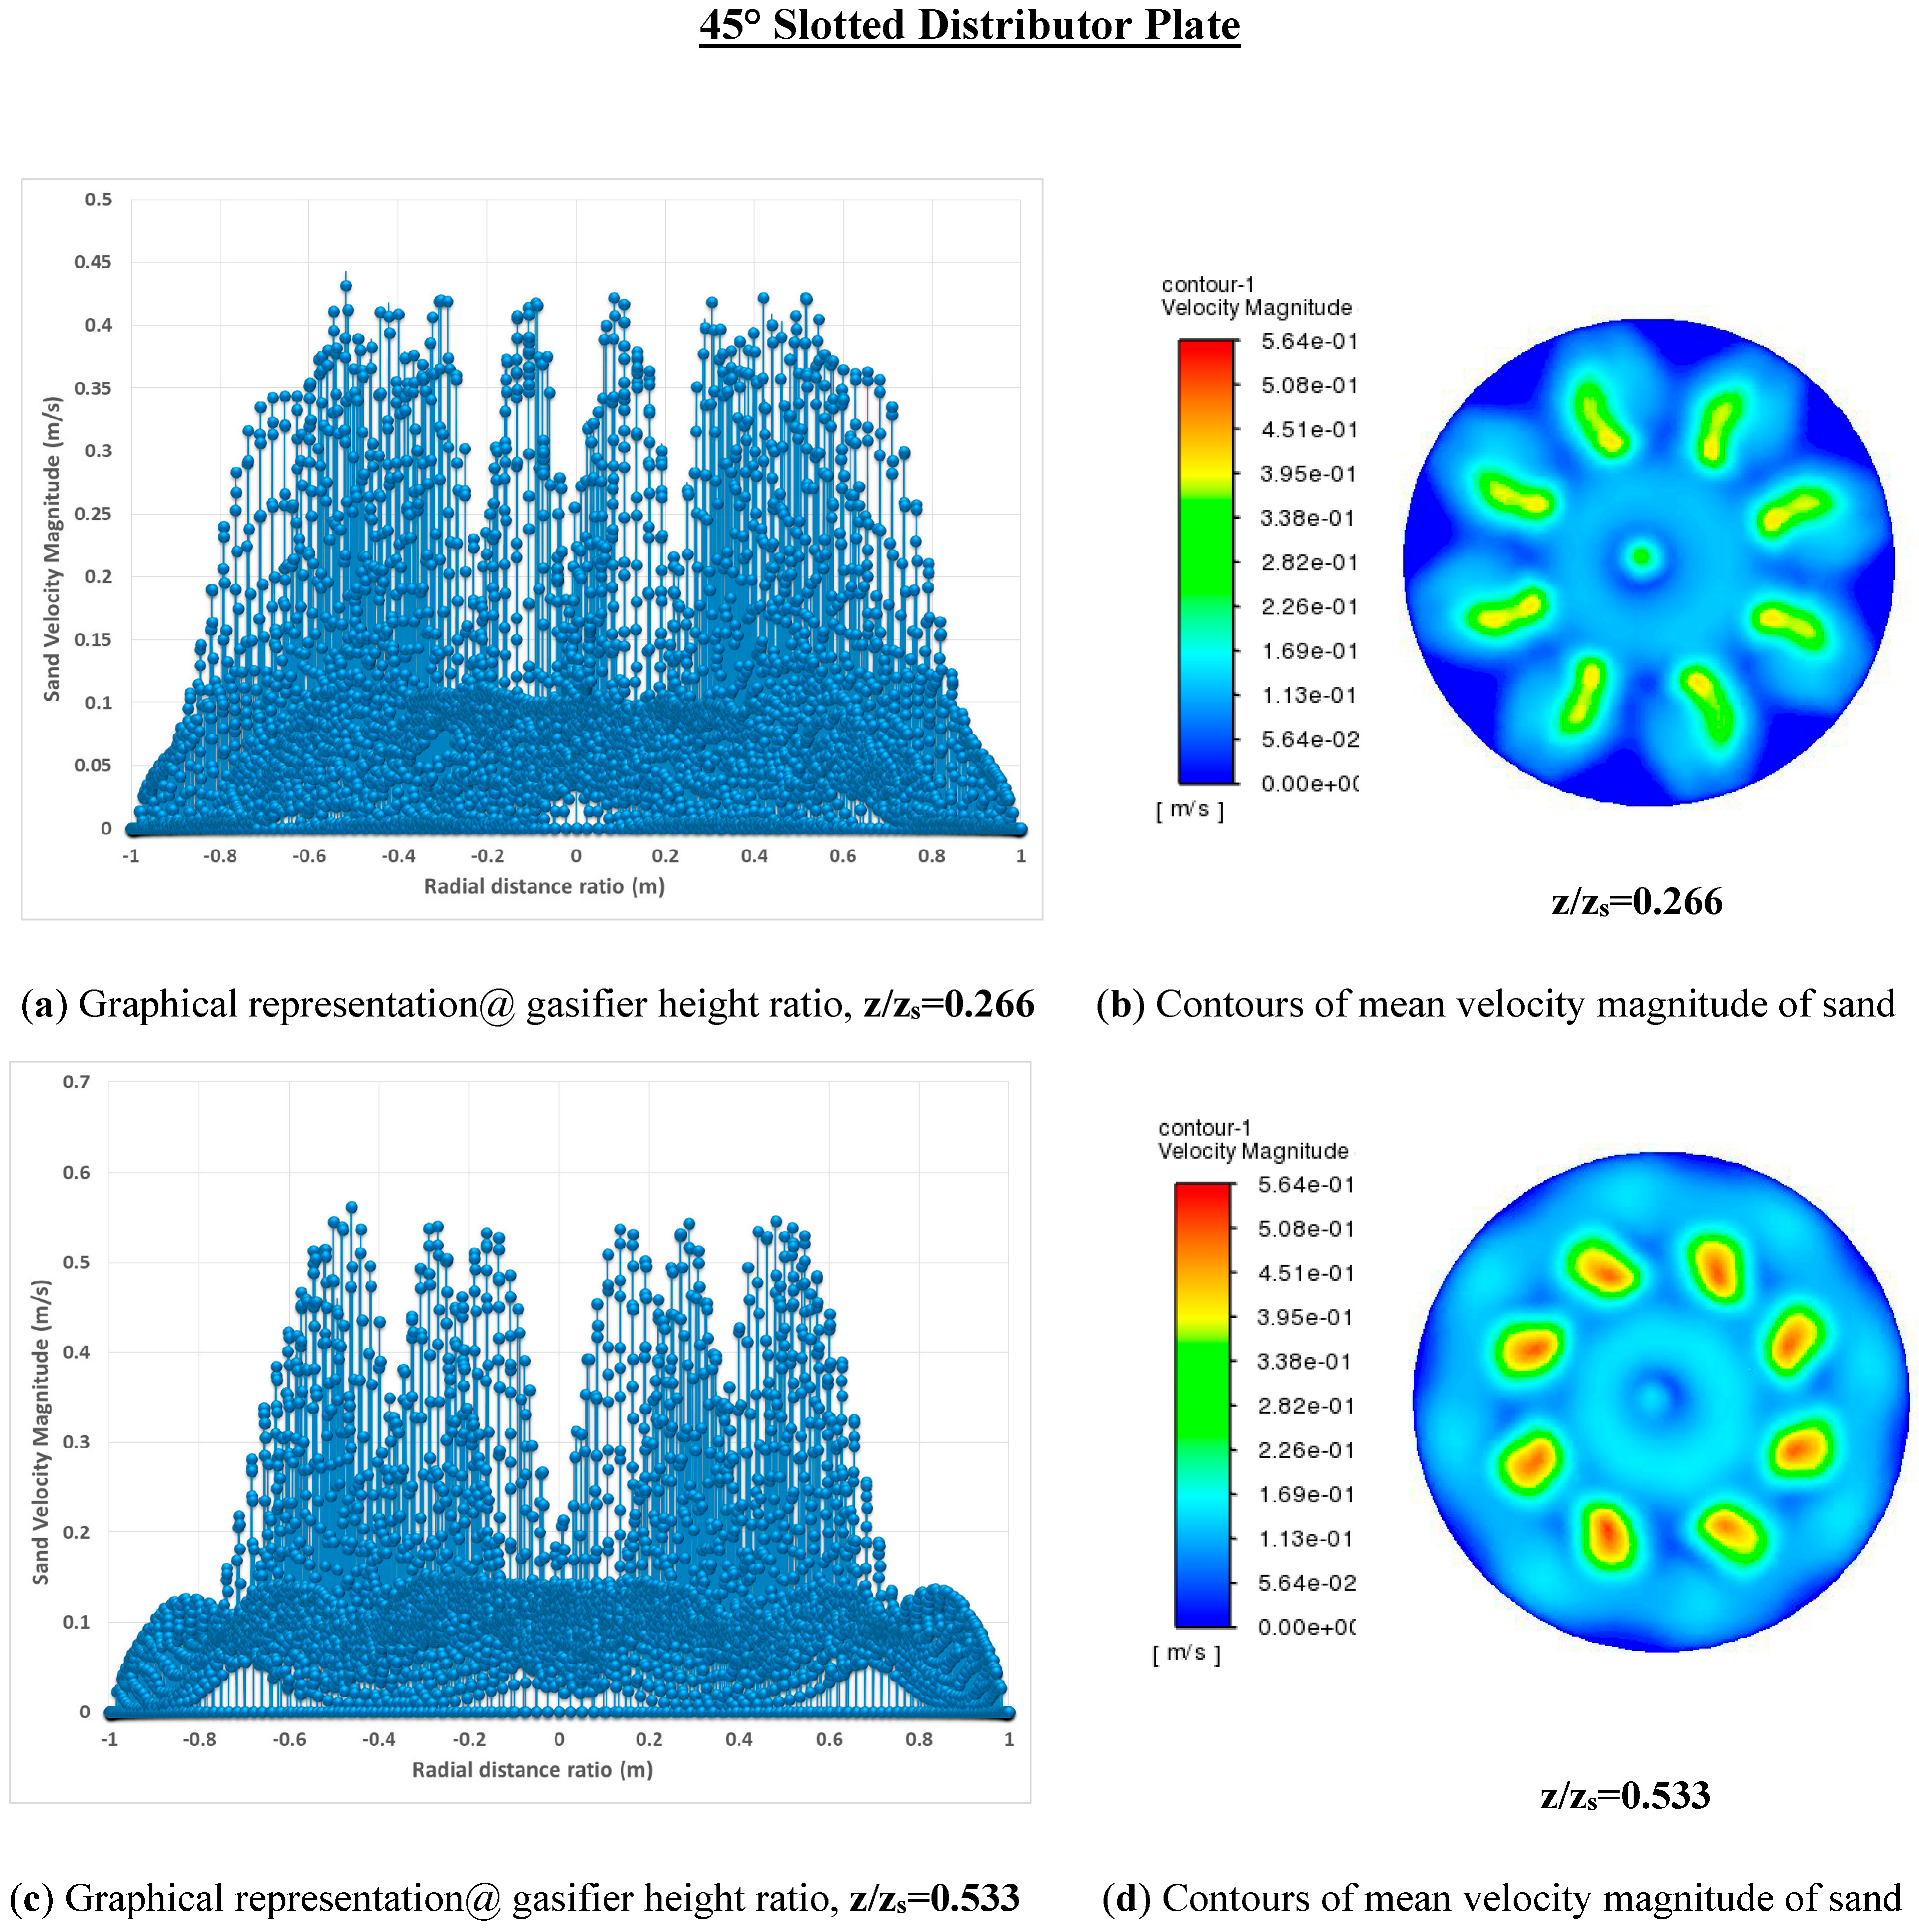
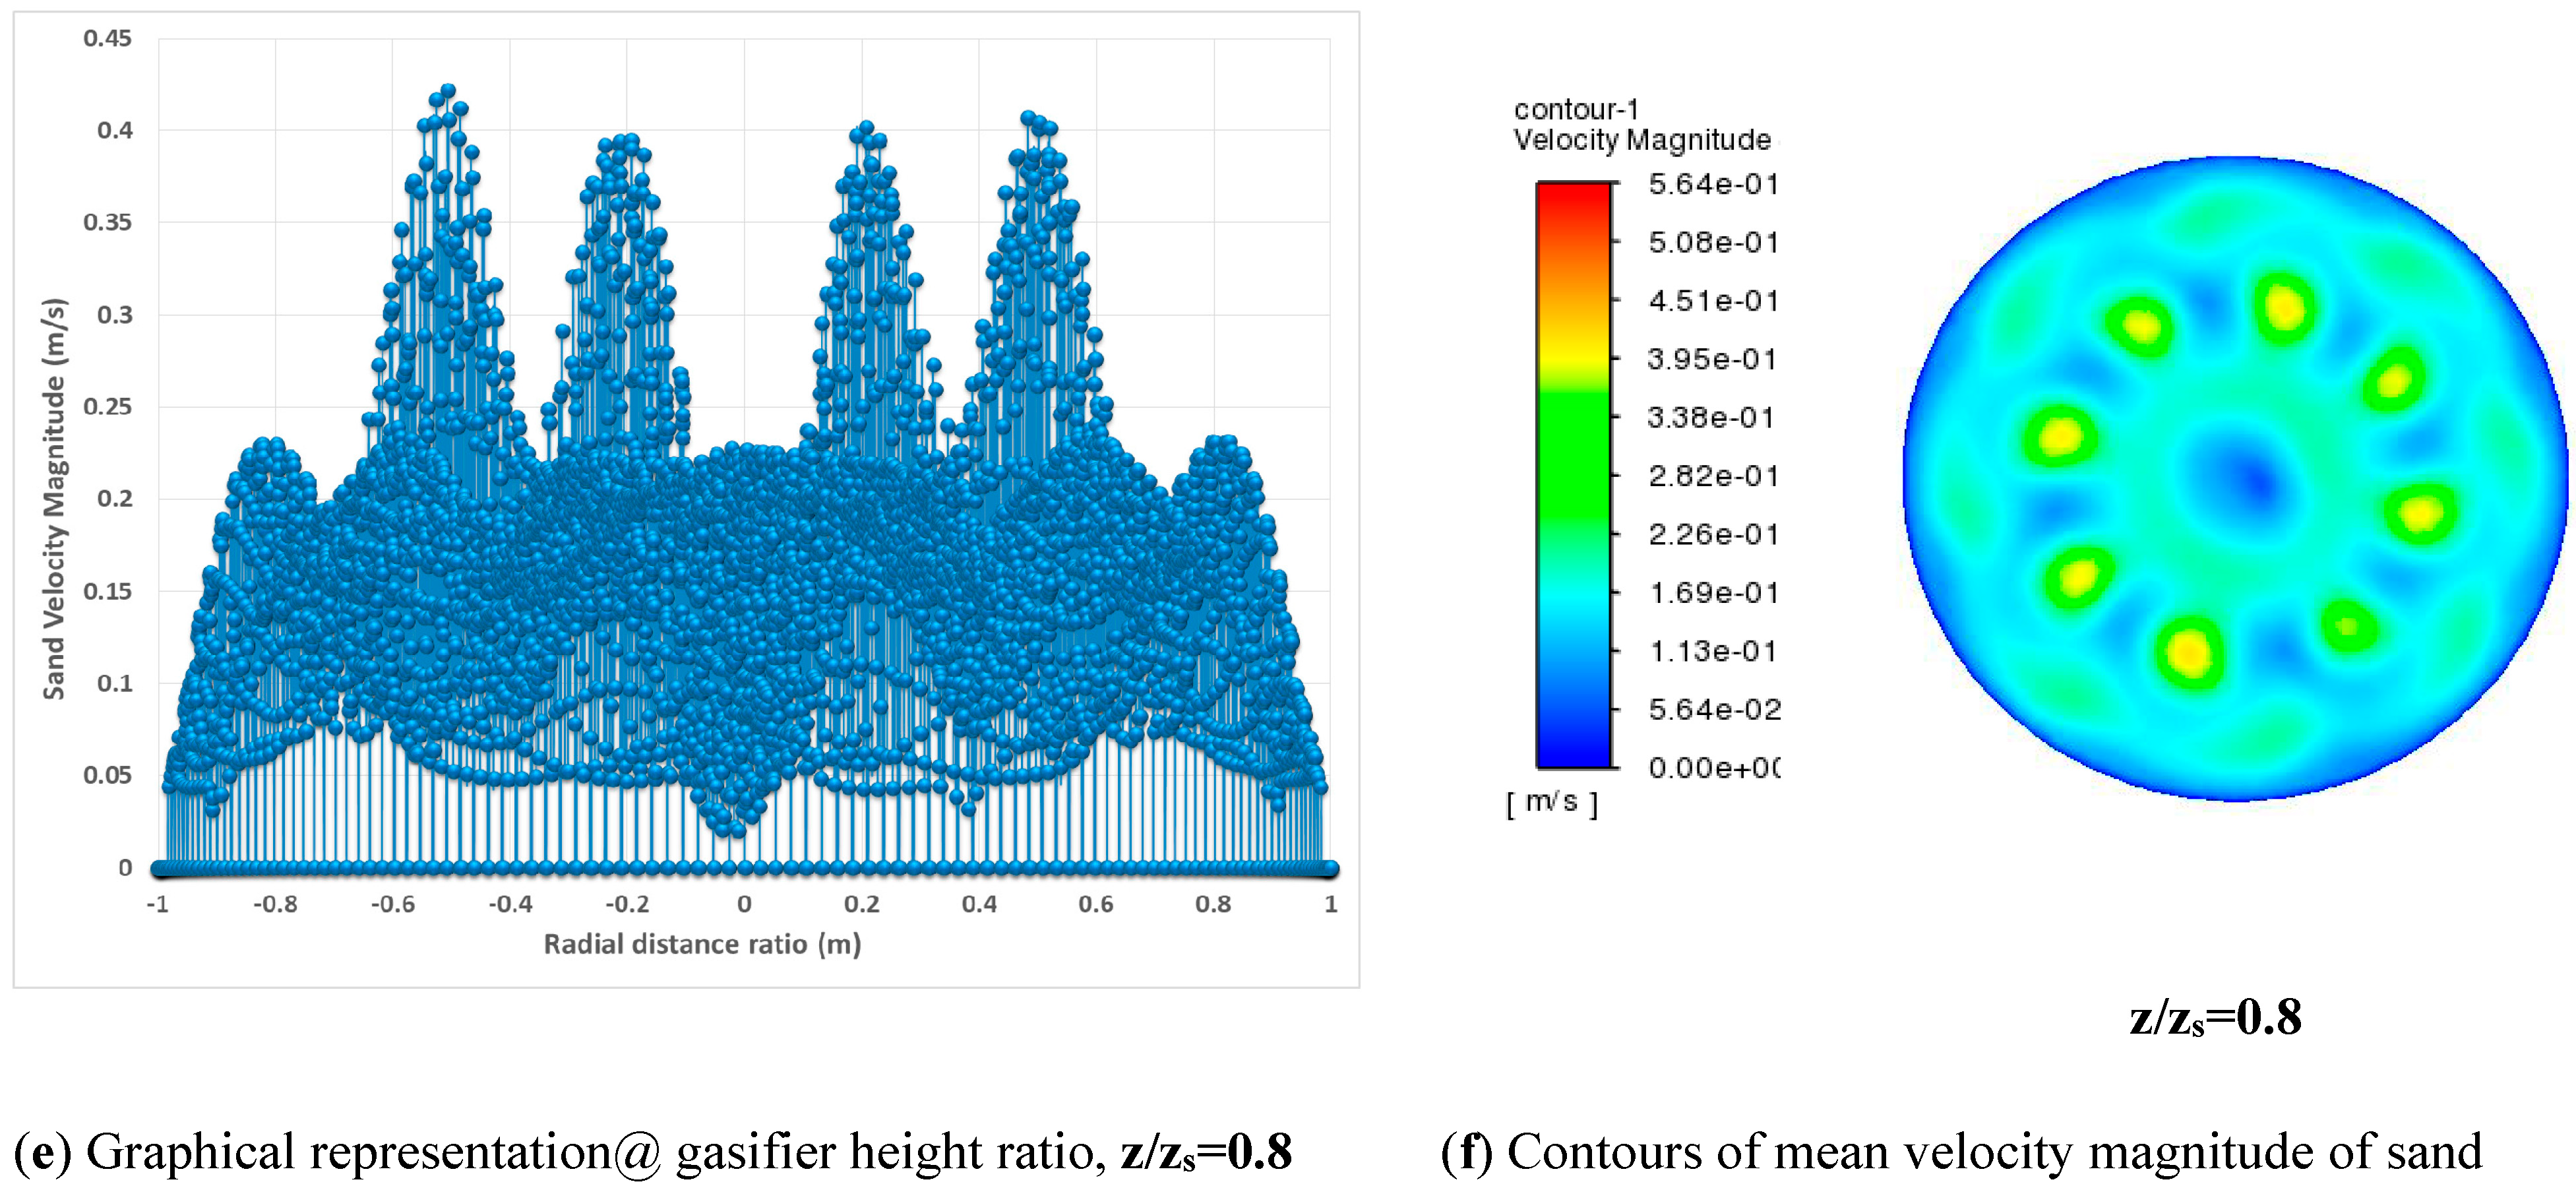
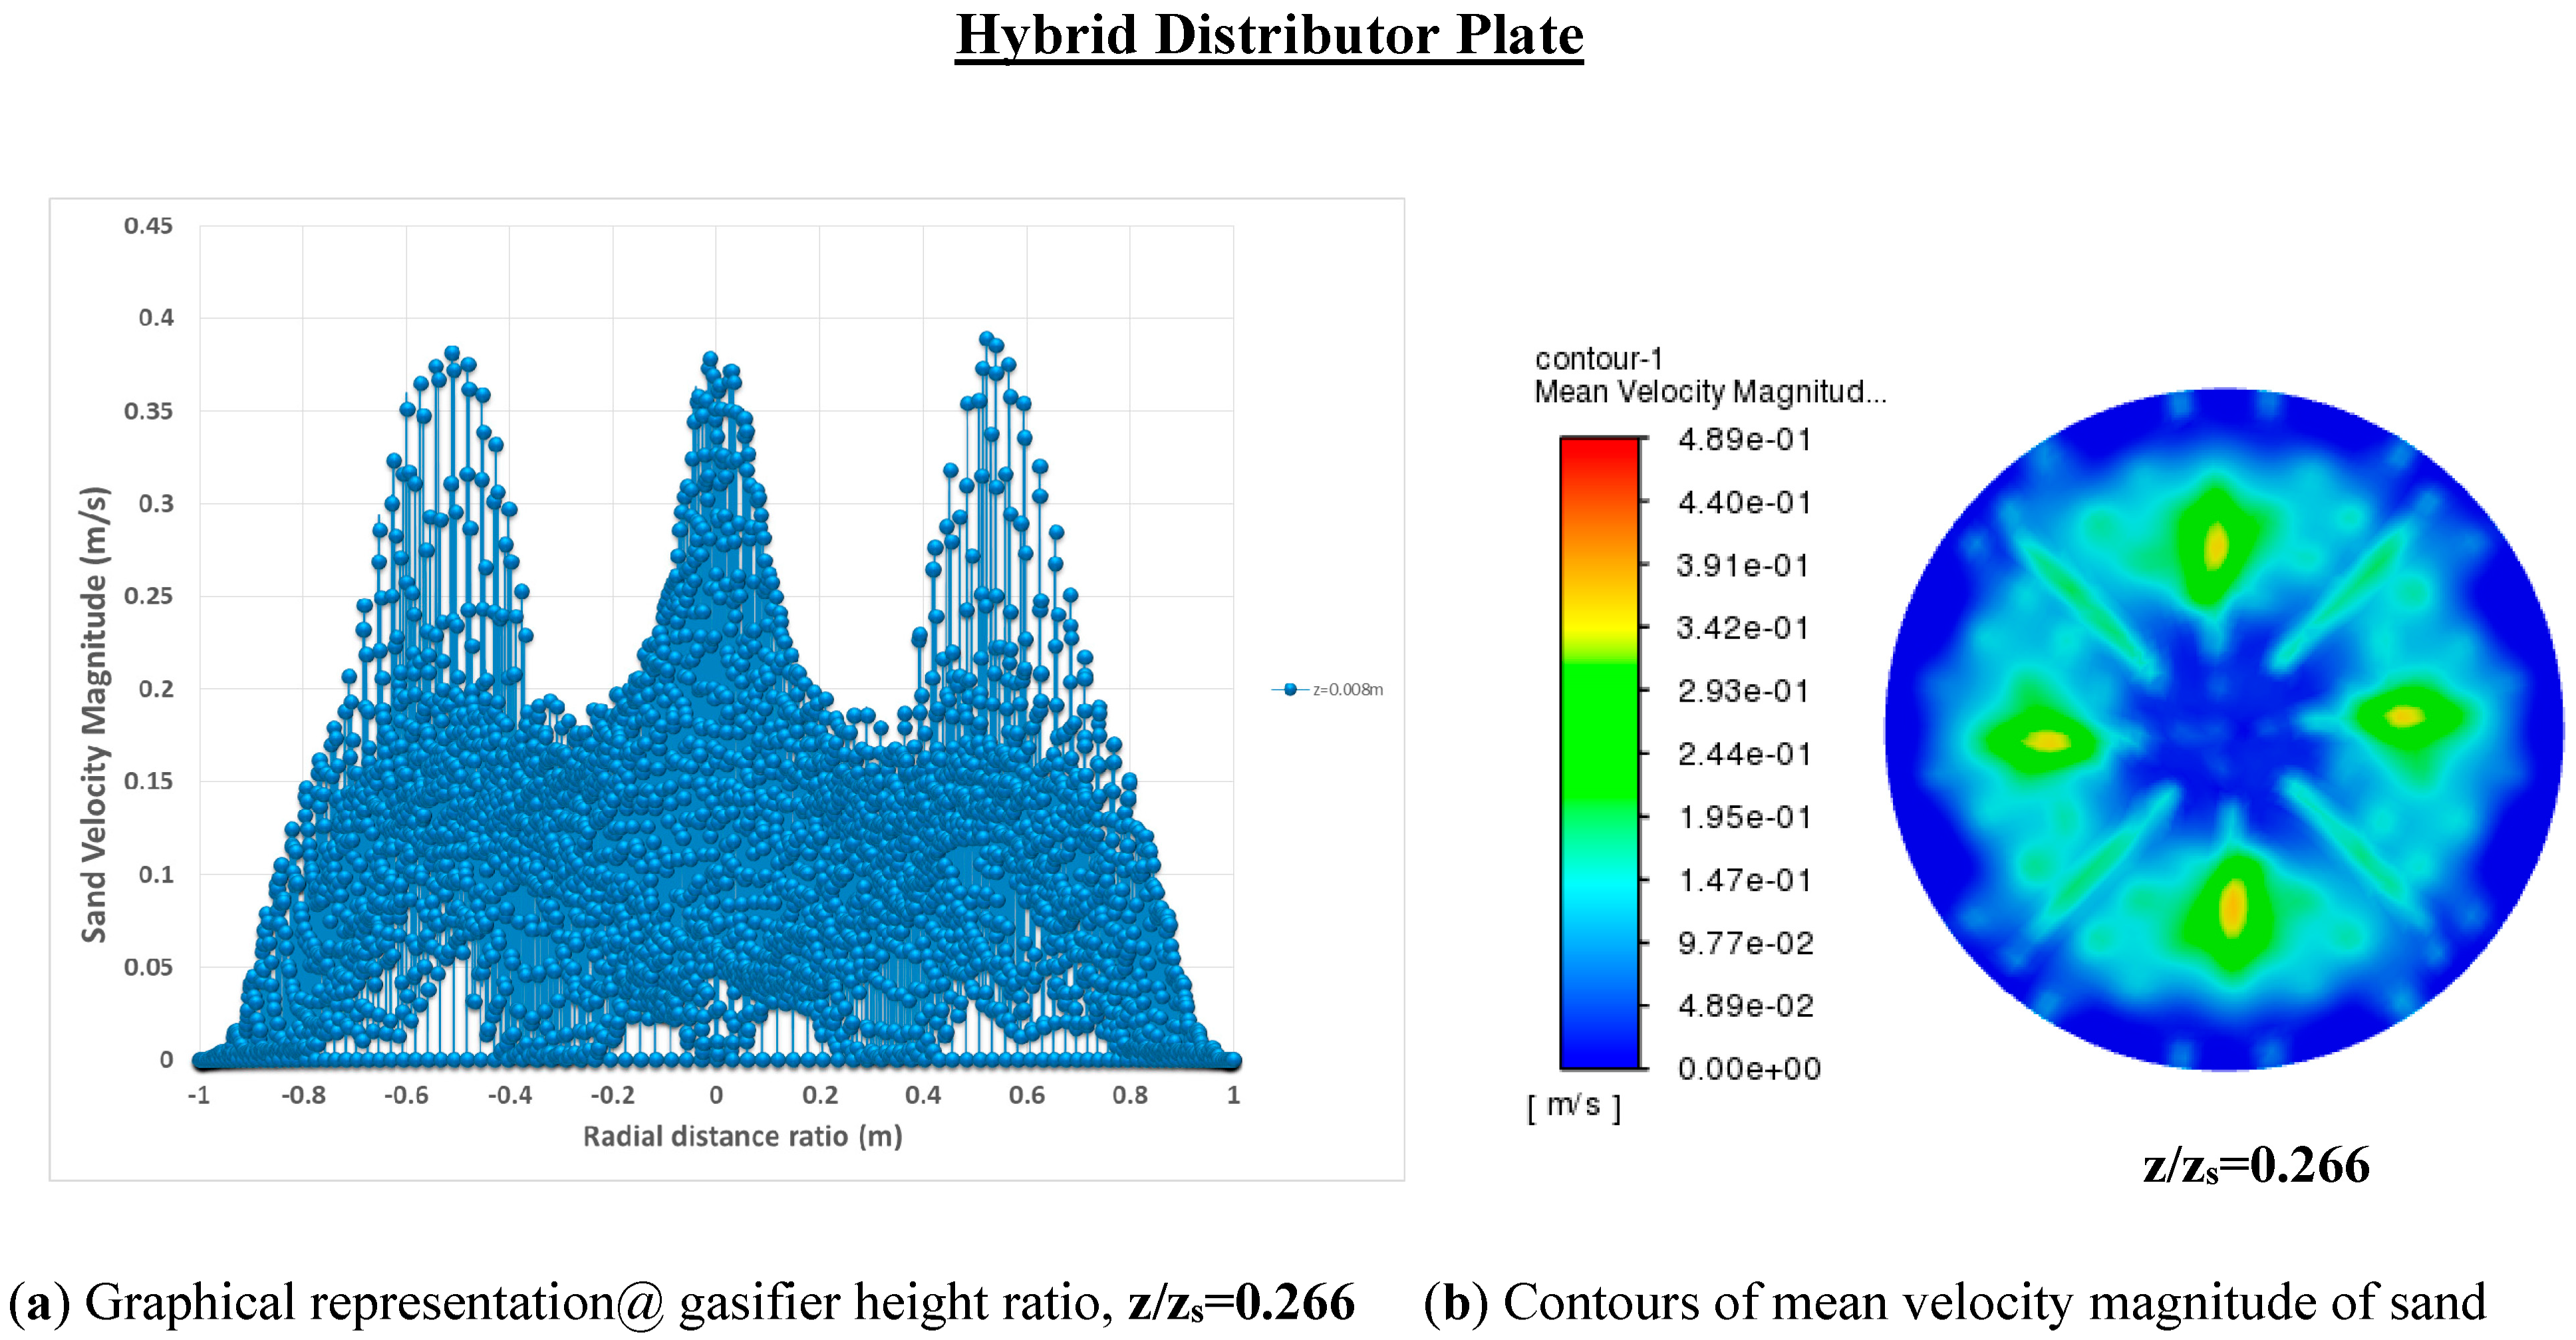
5.4.3. Velocity Distribution of Solid Particles within a Fluidized Zone of a Gasifier

The mean velocity distribution of solid particles with different distributor plates has been observed using CFD analysis. Solid phase velocity distribution is noted both qualitatively and quantitatively on different cut planes (z) along the height of the gasifier. It can be observed in Figure 10 that three cut planes describes the velocity distribution of sand particles with a graphical representation along with contours of velocity magnitude. Figure 20a shows that in a perforated distributor plate, the velocity distribution is axial dominant near the distributor plate due to 90° straight numerous smaller holes, which causes small velocity peaks as observed in graph of Figure 20a and contours of Figure 20b. however as we ascend upward there is a coalescence of smaller bubbles to form relatively larger bubbles as can be seen in Figure 10d and at the middle section there is a drift of solid particles in an upper direction along the periphery of gasifier as can be seen in Figure 20c. At the upper portion (z/zs = 0.8) of the fluidized bed, there is a sinusoidal pattern of velocity distribution due to the further coalescence of bubbles to form ever larger ones and forming relatively broader peaks of velocity distribution, indicating the wavy pattern near the surface of the fluidized bed as shown in Figure 20e,f.
By employing a 45° slotted distributor plate, it can be inferred from the above graphs of Figure 21 that at a lower portion of the bed, and there is a start of swirling flow of solids as indicated by Figure 21b. The velocity peaks of the solid phase are not as sharp as observed for the perforated distributor plate. This effect is due to the larger openings of entering air causing bulk solids to lift at once, as shown in Figure 21a. In the middle section of the fluidized region, there is a precise observation of the swirling of solid particles, which can be observed from the graph of Figure 21c, in which there are two zones of velocity distribution. One is the lower velocity zone indicating the frequent smaller up and down of velocities of the solid phase, indicating the dominant swirl zone in which there are two-dimensional flow (axial + lateral) and the second zone can be indicated by peaks of solids velocities which are above the slots through which air is entering and exhibiting higher air flux as shown in Figure 21d. Velocity distribution at the upper zone of the bed exhibits more swirl dominant flow and higher axial flux as indicated by the orange color contours above the eight 45° slots, also expressed by broader peaks of a graph in Figure 21e and besides also spread region of emulsion phase with relatively lower velocity magnitude of a solid phase (Figure 21f). A similar effect was also observed by Afrooz and Ching, 2019 by investigating two types of distributor plates, conventional distributor plate (CDP) and swirl distributor plate (SDP), for mixing characteristics. They revealed that better mixing is observed regarding the lateral distribution of solids with SDP with a dominant swirling motion of solids within a fluidized bed.
In a hybrid plate, a mixed velocity distribution pattern is observed at the lower bed portion, where sharp but relatively broader peaks compared to the perforated plate are observed due to the mixing of smaller bubbles with the dominant axial flow and larger bubbles arising through 45° slots. These bubbles coalesce and collapse, resulting in a more chaotic flow, as shown in Figure 22a,b. Moreover, at the upper portions of the bed, the more dominant mixing pattern of axial and swirl flow is observed due to the mixing of solids in axial and lateral directions resulting in enhanced mixing (Figure 22c,d). At the top section (z/zs = 0.8), there is also a velocity rise of solid particles near the periphery of the gasifier and, subsequently, a shrinkage of the central swirl flow portion, as shown in Figure 22e,f. Such flow patterns can also help eliminate the dead zones near the periphery of the gasifier.

5.5. Conclusions and Recommendations

Three distributor plates and various operational parameters have been studied to investigate the hydrodynamic characteristics of bubbling fluidized bed gasifiers. After extensive experimental and computational studies, many conclusions have been made to optimize the fluidization phenomena.
  • The perforated distributor plate exhibits the lowest minimum fluidization velocity compared to the other two.
  • Pressure drop is found to be maximum for a 45° slotted plate.
  • The hybrid plate shows the lowest pressure drop due to its highest open area ratio. Also, using this plate, minimum fluidization velocity remains between perforated and 45° slotted plate cases.
  • Furthermore, a lower portion swirling flow is observed in a 45° slotted plate for better lateral mixing of particles. The initial Bed height rise ratio is also highest for a 45° slotted plate and lowest for a perforated distributor plate due to many smaller-sized bubbles initially rupturing the bed surface.
  • It is also revealed that the bubble rise velocity ratio (F.I.) is highest for a perforated distributor plate, whereas it becomes lowest for a 45° slotted plate.
  • The 45° slotted plate improves inside mixing and lateral flow in the fluidized bed’s lower portion.
  • The hybrid plate improves mixing by combining smaller holes with 45° slots.
  • For applications requiring critical lower portion solid mixing and dead zone removal, a 45° slotted plate is recommended.
  • The hybrid plate suits various operational conditions and improves gasifier operational efficiency.
  • Table 7 of the article summarizes the conclusions on the hydrodynamics of bubbling fluidized bed gasifiers, detailing the findings and recommendations for various operational and geometric parameters.

Author Contributions

M.A. and N.R. proposed the main idea and methodology. N.R. and R.M. performed experimental research work. N.R. performed the CFD analysis and wrote the manuscript. M.T.M., S.R.N. and E.U. provided suggestions to improve the manuscript. All authors have read and agreed to the published version of the manuscript.

Funding

This project is supported by the National University of Sciences and Technology (NUST) under NUST Research Grant No. 21839.

Institutional Review Board Statement

Not Applicable.

Informed Consent Statement

Not Applicable.

Data Availability Statement

All data is included in the article.

Conflicts of Interest

The authors declare that the research was conducted without any commercial or financial relationships that could be construed as a potential conflict of interest.

Nomenclature

α a Volume fraction gas phase [-]
α p Volume fraction solid phase [-]
α m Volume fraction of all ‘m’ phases [-]
μ a Gas viscosity [kg m−1 s−1]
ρ p Density of solid [kg m−3]
ρ a Density of gas [kg m−3]
μ p Shear solid viscosity [kg m−1 s−1]
λ p Solid bulk viscosity [kg m−1 s−1]
CDDrag coefficient of phases [-]
β a p Exchange coefficient of gas solid phases [-]
τ a ¯ ¯ Solid-phase strain tensor [-]
τ p ¯ ¯ Gas-phase strain tensor [-]
V p Solid phase velocity [m s−1]
V a Gas phase velocity [m s−1]
IUnity tensor [-]
dsDiameter of solid particles [m]
d0Diameter of holes of distributor [m]
LsLength of slot of distributor [m]
WsWidth of slot [m]
u0Superficial Gas velocity [m s−1]
LInitial bed height [m]
DDiameter of Gasifier
ϕOpen area ratio of distributor plate [-]
FDDrag force [kg m s−2]
CDDrag coefficient [-]
DDiameter of distributor plate [m]
Umf,bMinimum bubble rise velocity [m s−1]
Umf,fFinal minimum fluidization velocity [m s−1]
F.IFluidization index [-]

References

  1. Salatino, P.; Solimene, R. Mixing and segregation in fluidized bed thermochemical conversion of biomass. Powder Technol. 2017, 316, 29–40. [Google Scholar] [CrossRef]
  2. Sánchez-Prieto, J.; Hernández-Jiménez, F.; Garcia-Gutierrez, L.M.; Soria-Verdugo, A. Experimental study on the characteristic mixing time of solids and its link with the lateral dispersion coefficient in bubbling fluidized beds. Chem. Eng. J. 2017, 307, 113–121. [Google Scholar] [CrossRef]
  3. Garcia-Gutierrez, L.; Soria-Verdugo, A.; Ruiz-Rivas, U. Optimization of the feeding ports location in a fluidized bed combustor based on Monte Carlo simulations of fuel particles motion. Fuel 2015, 141, 82–92. [Google Scholar] [CrossRef]
  4. Niklasson, F.; Thunman, H.; Johnsson, F.; Leckner, B. Estimation of solids mixing in a fluidized-bed combustor. Ind. Eng. Chem. Res. 2002, 41, 4663–4673. [Google Scholar] [CrossRef]
  5. Basu, P. Combustion and Gasification in Fluidized Beds; CRC Press: Boca Raton, FL, USA, 2006. [Google Scholar]
  6. Li, Y.; Rong, J.; Zhang, K.; Fan, X. Impact of solid and gas flow patterns on solid mixing in bubbling fluidized beds. Chem. Eng. Res. Des. 2018, 132, 1037–1053. [Google Scholar] [CrossRef]
  7. Askarishahi, M.; Salehi, M.-S.; Godini, H.R.; Wozny, G. CFD study on solids flow pattern and solids mixing characteristics in bubbling fluidized bed: Effect of fluidization velocity and bed aspect ratio. Powder Technol. 2015, 274, 379–392. [Google Scholar] [CrossRef]
  8. Jiang, H.; Chen, H.; Gao, J.; Lu, J.; Wang, Y.; Wang, C. Characterization of gas–solid fluidization in fluidized beds with different particle size distributions by analyzing pressure fluctuations in wind caps. Chem. Eng. J. 2018, 352, 923–939. [Google Scholar] [CrossRef]
  9. Lin, C.-L.; Wey, M.-Y.; You, S.-D. The effect of particle size distribution on minimum fluidization velocity at high temperature. Powder Technol. 2002, 126, 297–301. [Google Scholar] [CrossRef]
  10. Wu, X.; Li, Y.; Zhu, X.; Huang, L.; Zhu, X. Experimental study on fluidization behaviors of walnut shell in a fluidized bed assisted by sand particles. RSC Adv. 2018, 8, 40279–40287. [Google Scholar] [CrossRef]
  11. Feng, D.; Chen, H.; Whiting, W.B. The effects of distributor design on fluidized-bed hydrodynamic behavior. Chem. Eng. Commun. 1985, 36, 317–332. [Google Scholar] [CrossRef]
  12. Padhi, R.; Dora, D.; Mohanty, Y.; Roy, G.; Sarangi, B. Prediction of bed pressure drop, fluctuation and expansion ratios for three-phase fluidization of ternary mixtures of dolomite in a conical conduit. Cogent Eng. 2016, 3, 1181821. [Google Scholar] [CrossRef]
  13. Wang, S.; Shen, Y. CFD-DEM study of biomass gasification in a fluidized bed reactor: Effects of key operating parameters. Renew. Energy 2020, 159, 1146–1164. [Google Scholar] [CrossRef]
  14. Wang, S.; Luo, K.; Fan, J. CFD-DEM coupled with thermochemical sub-models for biomass gasification: Validation and sensitivity analysis. Chem. Eng. Sci. 2020, 217, 115550. [Google Scholar] [CrossRef]
  15. Hwang, I.S.; Sohn, J.; Do Lee, U.; Hwang, J. CFD-DEM simulation of air-blown gasification of biomass in a bubbling fluidized bed gasifier: Effects of equivalence ratio and fluidization number. Energy 2021, 219, 119533. [Google Scholar] [CrossRef]
  16. Chyou, Y.-P.; Chang, D.-M.; Chen, P.-C.; Chien, H.-Y.; Wu, K.-T.; Chein, R.-Y. Development of biomass gasification technology with fluidized-bed reactors for enhancing hydrogen generation: Part I, hydrodynamic characterization of dual fluidized-bed Gasifiers. Appl. Sci. 2019, 10, 2. [Google Scholar] [CrossRef]
  17. Hatate, Y.; Uemura, Y.; Migita, M.; Kawano, Y.; Tanaka, Y.; Ijichi, K.; King, D. Effect of Distributor on Bubble Size and Bubble Rise Velocity in the Slugging Regime of a Semi-Cylindrical Gas-Solid Fluidized Bed. Chem. Eng. Commun. 1991, 101, 39–44. [Google Scholar] [CrossRef]
  18. Dhrioua, M.; Hassen, W.; Kolsi, L.; Anbumalar, V.; Alsagri, A.S.; Borjini, M.N. Gas distributor and bed material effects in a cold flow model of a novel multi-stage biomass gasifier. Biomass Bioenergy 2019, 126, 14–25. [Google Scholar] [CrossRef]
  19. Sobrino, C.; Acosta-Iborra, A.; Santana, D.; de Vega, M. Bubble characteristics in a bubbling fluidized bed with a rotating distributor. Int. J. Multiph. Flow 2009, 35, 970–976. [Google Scholar] [CrossRef]
  20. Nakamura, H.; Kondo, T.; Watano, S. Improvement of particle mixing and fluidization quality in rotating fluidized bed by inclined injection of fluidizing air. Chem. Eng. Sci. 2013, 91, 70–78. [Google Scholar] [CrossRef]
  21. Sobrino, C.; Ellis, N.; de Vega, M. Distributor effects near the bottom region of turbulent fluidized beds. Powder Technol. 2009, 189, 25–33. [Google Scholar] [CrossRef]
  22. Sobrino, C.; Almendros-Ibañez, J.A.; Santana, D.; de Vega, M. Fluidization of Group B particles with a rotating distributor. Powder Technol. 2008, 181, 273–280. [Google Scholar] [CrossRef]
  23. Xiong, Q.; Yeganeh, M.M.; Yaghoubi, E.; Asadi, A.; Doranehgard, M.H.; Hong, K. Parametric investigation on biomass gasification in a fluidized bed gasifier and conceptual design of gasifier. Chem. Eng. Process. Process Intensif. 2018, 127, 271–291. [Google Scholar] [CrossRef]
  24. Yudin, A.S.M.; Anuar, S.; Oumer, A.N.J.A.P.T. Improvement on particulate mixing through inclined slotted swirling distributor in a fluidized bed: An experimental study. Adv. Powder Technol. 2016, 27, 2102–2111. [Google Scholar] [CrossRef]
  25. Sreenivasan, B.; Raghavan, V.R. Hydrodynamics of a swirling fluidised bed. Chem. Eng. Process. Process Intensif. 2002, 41, 99–106. [Google Scholar] [CrossRef]
  26. Najafi, A.F.; Mousavian, S.M.; Amini, K. Numerical investigations on swirl intensity decay rate for turbulent swirling flow in a fixed pipe. Int. J. Mech. Sci. 2011, 53, 801–811. [Google Scholar] [CrossRef]
  27. Eslami Afrooz, I.; Chuan Ching, D.L. Effect of novel swirl distributor plate on hydrodynamics of fluidized bed gasifier. Int. J. Eng. 2019, 32, 1358–1365. [Google Scholar]
  28. Ghasem, N.M.; Ang, W.L.; Hussain, M.A. Dynamics and stability of ethylene polymerization in multizone circulating reactors. Korean J. Chem. Eng. 2009, 26, 603–611. [Google Scholar] [CrossRef]
  29. Raza, N.; Ahsan, M.; Mehran, M.; Naqvi, S.; Ahmad, I.J.E.R. Computational Analysis of the Hydrodynamic Behavior for Different Air Distributor Designs of Fluidized Bed Gasifier. Front. Energy Res. 2021, 9, 692066. [Google Scholar] [CrossRef]
  30. Al-Akaishi, A.; Valera-Medina, A.; Chong, C.; Marsh, R.J.E.P. CFD analysis of the fluidised bed hydrodynamic behaviour inside an isothermal gasifier with different perforated plate distributors. Energy Procedia 2017, 142, 835–840. [Google Scholar] [CrossRef]
  31. Kang, P.; Hu, X.E.; Lu, Y.; Wang, K.; Zhang, R.; Han, L.; Yuan, H.; Chen, H.; Luo, X.; Zhou, Y.J. Modeling and Optimization for Gas Distribution Patterns on Biomass Gasification Performance of a Bubbling Spout Fluidized Bed. Energy Fuels 2020, 34, 1750–1763. [Google Scholar] [CrossRef]
  32. Bakhurji, A.; Bi, X.; Grace, J.R. Hydrodynamics and solids mixing in fluidized beds with inclined-hole distributors. Particuology 2019, 43, 19–28. [Google Scholar] [CrossRef]
  33. Yohana, E.; Muchammad; Tauviqirrahman, M.; Sayekti, A.A.; Choi, K.-H.; Paramita, V. Effect of particle size and bed height on the characteristic of a fluidized bed dryer. Cogent Eng. 2020, 7, 1738185. [Google Scholar] [CrossRef]
  34. Hamzehei, M. CFD modeling and simulation of hydrodynamics in a fluidized bed dryer with experimental validation. Int. Sch. Res. Not. 2011, 2011, 131087. [Google Scholar] [CrossRef]
  35. Russell, A.; Schmelzer, J.; Müller, P.; Krüger, M.; Tomas, J. Mechanical properties and failure probability of compact agglomerates. Powder Technol. 2015, 286, 546–556. [Google Scholar] [CrossRef]
  36. Timsina, R.; Thapa, R.K.; Moldestad, B.M.E.; Eikeland, M.S. Effect of particle size on flow behavior in fluidized beds. Int. J. Energy Prod. Manag. 2019, 4, 287–297. [Google Scholar] [CrossRef]
  37. Bandara, J.; Eikeland, M.S.; Moldestad, B.M.E. Analyzing the effects of particle density, size, size distribution and shape for minimum fluidization velocity with Eulerian-Lagrangian CFD simulation. Linkop. Electron. Conf. Proc. 2017, 138, 60–65. [Google Scholar] [CrossRef]
  38. Abrahamsen, A.R.; Geldart, D. Behaviour of gas-fluidized beds of fine powders part I. Homogeneous expansion. Powder Technol. 1980, 26, 35–46. [Google Scholar] [CrossRef]
  39. Ram, D.K. The determination of minimum bubbling velocity, minimum fluidization velocity and fluidization index of fine powders (hematite) using gas-solid tapered beds. Int. J. Sci. Res. 2013, 2, 287–293. [Google Scholar]
  40. Guenther, C.; Syamlal, M.; Shadle, L.; Ludlow, C. A numerical investigation of an industrial scale gas–solids CFB. Circ. Fluid. Bed Technol. VII 2002, 73, 483–488. [Google Scholar]
  41. Andrews IV, A.T.; Loezos, P.N.; Sundaresan, S. Coarse-grid simulation of gas-particle flows in vertical risers. Ind. Eng. Chem. Res. 2005, 44, 6022–6037. [Google Scholar] [CrossRef]
  42. Shukrie, A.; Anuar, S.; Oumer, A.N. Air distributor designs for fluidized bed combustors: A review. Eng. Technol. Appl. Sci. Res. 2016, 6, 1029–1034. [Google Scholar] [CrossRef]
Figure 1. Experimental Setup of cold model bubbling fluidized bed gasifier.
Applsci 13 09317 g001
Figure 2. Geometry of distributor plates.
Applsci 13 09317 g002
Figure 3. Experimental results of characteristic fluidization curves for different distributor plates (L/D = 0.833, particle size = 590 µm).
Applsci 13 09317 g003
Figure 4. Schematic illustration of velocity flow vectors through the angular slot and straight hole of the hybrid distributor plate.
Applsci 13 09317 g004
Figure 5. Fluidization phenomena for different distributor plates (1.5*Umf, L/D = 0.833).
Applsci 13 09317 g005
Figure 6. Experimental study of initial bed height ratio on fluidization phenomena.
Applsci 13 09317 g006aApplsci 13 09317 g006b
Figure 7. Experimental observation of initial bed height for perforated plate distributor.
Applsci 13 09317 g007
Figure 8. Effect of particle size on bed pressure drop with different distributor plates.
Applsci 13 09317 g008aApplsci 13 09317 g008b
Figure 9. Bubble rise velocity ratio (F.I.) for different distributor plates for three particle sizes (Dp) and the initial bed height of 10 cm.
Applsci 13 09317 g009
Figure 10. Bubble rise dynamics with time for a hybrid plate at U = Umf.
Applsci 13 09317 g010
Figure 11. Bed Height rise for different distributor plates for three superficial air velocity.
Applsci 13 09317 g011
Figure 12. Initial Bed height rise fluidization phenomena for different distributor plates (3.0*Umf, L/D = 1.16).
Applsci 13 09317 g012
Figure 13. Geometry of fluidization column along with air distributor plates.
Applsci 13 09317 g013
Figure 14. Mesh of fluidization column along with air distributor plates.
Applsci 13 09317 g014
Figure 15. Time-averaged solid volume fraction with radial distance for different grids.
Applsci 13 09317 g015
Figure 16. Comparison of CFD results with experimental (L/D = 0.5, particle size = 520 µm) (hybrid plate).
Applsci 13 09317 g016
Figure 17. Contours of solid volume fraction for shallow bed different plates at a time, t = 5 s.
Applsci 13 09317 g017
Figure 18. Iso-surface of solid volume fraction for different plates for shallow depth at the time, t = 5 s.
Applsci 13 09317 g018
Figure 19. Velocity vectors of sand for different plates for shallow depth at the time, t = 5 s.
Applsci 13 09317 g019
Figure 20. Graph and contours of the mean velocity of sand particles [m/s] with Perforated plate.
Applsci 13 09317 g020aApplsci 13 09317 g020b
Figure 21. Graph and contours of mean velocity magnitude of sand particles [m/s] with 45° plate.
Applsci 13 09317 g021aApplsci 13 09317 g021b
Figure 22. Graph and contours of mean velocity magnitude of sand particles [m/s] with hybrid plate.
Applsci 13 09317 g022aApplsci 13 09317 g022b
Table 1. Physical properties of bed material.
Bed MaterialGaldert ClassificationAverage Particle Diameter (µm)Bulk Density (kg/m3)Particle Density (kg/m3)Void Fraction
(%)
Sand 1Type B2501234242051
Sand 2Type B5901330251053
Sand 3Type B8501424259055
Table 2. Geometric details of distributor plates.
Distributor TypeDiameter of the Plate, D (m)The Thickness of the Plate, t (m)Diameter of Holes, d0 (m)Length of Slot, l (m)Width of Slot, W (m)Open Area Ratio γ (%)Number of Holes/Slots
Perforated0.1250.0080.005--14.2589 (holes)
45° degree0.1250.008-0.030.006513.998 (Slots)
Hybrid0.1250.0080.0050.030.006525.5589 + 8 (holes + slots)
Table 3. Experimental scheme for input and output operational parameters along with geometric parameter.
Number of Plates = 3
Perforated Plate, 45° Slotted Plate, Hybrid Plate (Perforated + Slotted)
Operational Variables
Input VariablesOutput Variables
Geometric Variables
Three designs of Distributor Plates.
  • Perforated distributor plate
  • 45° distributor plate
  • Novel Hybrid Plate
Superficial Air Velocities1.5*Umf3.0*Umf
  • Pressure drop across the bed (pa)
  • Bed height rise (m)
  • Bubble rise velocity (m/s)
  • Minimum fluidization velocity (Umf)
Initial bed Height Ratio (L/D)/bed aspect ratio0.5, 0.833, 1.160.5, 0.833, 1.16
Particle Size (µm)250, 590, 850250, 590, 850
Table 4. Comparison of fluidization index for different distributor plates.
Particle Size
µm
Density of Particles (kg/m3)Perforated Plate
F.I. (Umf,b/Umf,f)
45° Plate
F.I. (Umf,b/Umf,f)
Novel Hybrid Plate
F.I. (Umf,b/Umf,f)
25025901.2111.0131.151
59025101.2031.0261.101
85024201.1721.0051.017
Table 5. Fluid properties and simulation parameters of gas-solid flows hydrodynamics.
Properties of Gas and Particle FlowParameter Values
Mean Particle diameter (µm)250, 590, 850
Density of sand (kg/m3)2590, 2510, 2420
Density of air (kg/m3)1.225
Multiphase modelEulerian-Eulerian
Superficial gas velocity (m/s)0.5, 1, 1.5, 2, 2.5, 3, 3.5, 4.0, 4.5
Restitution coefficient0.90
Packing limit of solids0.63
Drag model for gas-solid flowsSyamlal-Obrien
Solution methodologyPressure velocity coupling
Table 6. Grid Independence study results from a comparison of different mesh generated.
Mesh GeneratedGrid Size (Number of Cells)Pressure Drop (CFD)
(Pa)@ Superficial Velocity
(m/s) [1.5Umf]
Pressure Drop (Experiment)
(Pa)
Maximum Solid Volume Fraction L/D = 0.4
Light4.0 × 10590211200.38
Medium1.2 × 10610520.51
Heavy2.0 × 10610710.58
Table 7. Summary of hydrodynamic characteristics of a cold model of gasifiers to a geometric and operational parameter.
Operational ParametersGeometric Parameters
Static Distributor Plates
Perforated45° SlottedNovel Hybrid Plate
ProsCons/LimitationRemarksProsCons/LimitationRemarksProsCons/LimitationRemarks
Pressure drop, Minimum fluidization velocity, Bed aspect ratio, Bubble rise velocity, bed height rise, superficial gas velocity.Uniform distribution of particles at the mid and upper section of fluidization zone, lower minimum fluidization velocity.Moderate to high Pressure drop, probability of dead zones at the lower bed zones, the possibility of de-fluidization phenomena.Due to dominant axial velocity component the chances of solid particles elutriation are higher at higher flow rates.Lower portion swirling flow for better mixing of solid particles. Limit the chances of de-fluidization, lower average bed fluctuations.Higher Pressure drop due to higher open area ratio and angular flow of gas solid flow towards periphery of gasifier, higher minimum fluidization velocity.Due to initial tangential and radial component of flow the solid particles move towards periphery tend to lose more energy of fluidizing medium.Wide range of initial bed height can be possible from low to high, Lower pressure drop, moderate minimum fluidization velocity, moderate bed height rise, long range particle size inclusion for fluidization, both axial and swirling flow motion.Elutriation of particles can happen at higher flow rates.Due to hybrid openings of plate, both axial and tangential velocity of flow resulted in moderate bed height rise.
Disclaimer/Publisher’s Note: The statements, opinions and data contained in all publications are solely those of the individual author(s) and contributor(s) and not of MDPI and/or the editor(s). MDPI and/or the editor(s) disclaim responsibility for any injury to people or property resulting from any ideas, methods, instructions or products referred to in the content.

