Featured Application
Authors are encouraged to provide a concise description of the specific application or a potential application of the work. This section is not mandatory.
Abstract
The phenomenon of luminescence and quenching is widely applied in the forensic examination of various ink materials. Here, we introduce a hybrid spectroscopic and chromatography approach to gain insights into the underlying cause of infrared luminescence (IRL) in blue ballpoint (BP) pen inks. A total of thirty BP pen ink samples from the Egyptian market were employed in this study. Insights into the origin of luminescence and quenching in the studied samples were gained based on video spectral comparator (VSC), thin layer chromatography (TLC), ultraviolet–visible (UV–Vis) spectrophotometry, and photoluminescence (PL) spectroscopy. Results showed that some of the studied inks possessed IRL due to the presence of crystal violet and some other triaryl methane dyes. Nevertheless, some ink samples did not possess IRL, despite the presence of the dyes responsible for IRL in their matrix. Interestingly, the inclusion of phthalocyanine dye in those non-luminescent ink matrices resulted in luminescence quenching, mainly due to the overlap between the absorption of phthalocyanine dye and the luminescence of the triarylmethane dyes. The IRL behavior of the ink sample under the first illumination wave band (400–485 nm) exerted control over the IRL activity across subsequent illumination wavebands, and the most effective differentiation was achieved by utilizing the first and second preset filters in VSC. The results revealed the luminescent components present in studied inks and unraveled their distinct luminescence behavior present within the ink matrix. The combination of optical spectroscopy and chromatography techniques could provide a distinctive tool to reveal the luminescence and quenching behaviors of ink dyes for the successful forensic discrimination of several BP writing pens.
1. Introduction
Among the important forensic procedures for the examination of questioned documents are handwriting analysis, authentication of documents, forgery detection, and ink discrimination [1,2]. The chemical analysis of inks can reveal information about questioned documents based on the inorganic and organic characteristics of the writing pen ink matrices [3]. The role of pen ink analysis and the area of questioned document analysis has been significantly growing and is being addressed more in forensic chemistry [4]. Several chemical and physical techniques are used in the chemical analysis of hand-written documents quite apart from the classical mainstay of handwriting comparison. Today, the advent of modern instrumental methods of inorganic and organic analysis permits the comparison of pen inks for the sake of identification and discrimination [3,4,5]. A spot of typical writing pen ink is composed mainly of a colorant agent such as a dye or pigment, a vehicle including solvent and resin, and some additives such as emulsifying agents, surfactants, and anti-corrosion compounds. Ink analysis can reveal information about its chemical components and manufacture, which are valuable for ink discrimination, identification, and dating [6,7]. The colorant agents such as dyes and pigments are the most important components of certain ink samples. BP and gel pens are amongst the most commonly used pen types, and each type has its specific chemical and physical characteristics. BP pen ink typically contains either a single dye or a mixture of two or three dyes to retain an appropriate color. Gel pen ink might contain only dyes or a mixture of dyes and pigments [8,9]. Identifying inorganic pigments of writing pen inks and studying their optical properties such as luminescence and quenching plays a crucial role in forensic ink examination. Analytical techniques such as X-ray spectrometry, laser-ablation mass spectrometry, laser-induced breakdown spectrometry, and inductively coupled plasma mass spectrometry are employed to determine the elemental composition of inks, enabling the identification and quantification of various metallic components present in ink formulations. Optical absorption, emission, and reflectance spectrometry techniques are also vital for revealing the luminescence and quenching properties of inorganic or organic luminescent species within the ink formula [2,10,11]. Forensic examination of pen inks on documents relies in the first stage on non-destructive and simple tools such as visual and optical examination using microscopy and video spectral comparator (VSC) techniques [12]. Forensic examination of inks using microscopy techniques can be useful only for differentiating different types of ink and discriminating between pens of the same type that vary in mechanical features or color tones [13]. The VSC is considered the first analytical tool that is typically employed by forensic examiners for the primary examination of ink on documents. The VSC is a non-destructive technique that is fast, user-friendly, and can carry out sample-free analysis of questioned documents, and thus is one of the most common toolkits used in forensic document examination [8,14,15]. Infrared luminescence (IRL) and infrared reflectance (IRR) comprise highly effective approaches for ink differentiation using the VSC. They are based on discerning variances in the IRL and IRR of the questioned ink samples, whereby the inks are accordingly deemed distinguishable or indistinguishable [12]. The VSC instruments may also comprise a micro-spectrometer, enabling the measurement of reflected, transmitted, and luminescent light, which is a simple and valuable addition for the examination of a variety of pen types and documents [15]. Further forensic examination of inks using more complex and destructive analytical tools such as chromatography and spectroscopic techniques is typically required for deeper chemical analysis in forensic investigations [15,16]. Thin layer chromatography (TLC) is an efficient, rapid, and cost-effective analytical tool that can provide side-to-side sample comparisons. The TLC can thus be employed for the separation of different dye components within ink matrices, providing a base for user-friendly screening and discrimination of various ink formulations [17,18]. The combination of two or more analytical tools can further enable the high-resolution discrimination of questioned inks and lead to reliable forensic results [1,9,19,20]. Of particular interest, ultraviolet–visible (UV–Vis) spectroscopy is a reliable analytical toolkit that can be adopted to complement and confirm analytical findings obtained from TLC investigations [19,21]. In this work, the in situ luminescence behavior of blue BP pen ink specimens when subjected to long-pass filters of the VSC 6000 apparatus was investigated. The scrutinized ink samples were systematically categorized into four distinctive cohorts based on their photoluminescence when subjected to the initial 400–485 nm band-pass filter. To comprehend the differential behavior of each classification, TLC and UV–Vis spectroscopy measurements were conducted on selected ink samples, aiming to ascertain the number of dyes present in the ink specimens, as well as their photo-responsive characteristics. The results revealed the luminescent components present in studied inks and unraveled the distinct luminescence behaviors of a certain dye when present within the ink matrix compared to the pristine dye. The combination of optical spectroscopy and chromatography techniques could provide a distinctive tool to reveal luminescence and quenching behaviors of ink dyes for successful forensic discrimination of several BP writing pens.
2. Materials and Methods
2.1. Ink Samples and Samples Preparation
A total of thirty blue BP pen samples sourced from various brands and models were obtained from the local market in Egypt. Table S1 lists the codes given to 30 pen samples along with the brand, model, and manufacturer of each pen sample. For sample preparation, defined square areas were designed on a sheet of A4 white copy paper (Multi-office, 80 g/m2). Each of the 30 BP pens was used to write the two words “Forensic science” within the square areas on the A4 paper sheet. For chemical analysis of some selected ink samples, 1 cm of the BP pen barrel of the selected pen sample was cut and soaked into 20 mL ethanol. Ethanol was chosen as a solvent for ink extraction and solvation due to its efficacy in dissolving most ballpoint pen inks and following previous literature reports [14,22,23]. Upon soaking, the final concertation of the soaking mixture was adjusted to 20 ppm and the mixture was stored in the dark for chemical analysis. The TLC analysis was employed to study the impact of the dissolution on the luminescence behavior of the BP pen samples using a concentrated solution of each dissolved sample. Additionally, the solution of each dissolved sample was employed in writing the letter “A” on A4 copy paper, and these written samples were examined using the VSC to investigate any differences in the luminescence properties of the ink samples.
2.2. Video Spectral Comparator (VSC) Studies
The VSC studies were conducted using a VSC 6000 workstation (Foster & Freeman Ltd., Evesham, UK) featuring an advanced digital system suitable for comprehensive forensic examination of a variety of questioned documents. The sophisticated VSC 6000 workstation incorporates a digital imaging system, variable light sources, and multi-spectral illumination spanning different regions of ultraviolet, visible, and infrared light. Notably, the VSC 6000 includes a high-resolution micro-spectrometer, which facilitates the non-destructive spectral analysis helpful for studying distinct features of ink and paper compositions. The VSC 6000 system allows the acquisition of absorption, reflectance, fluorescence, and transmitted spectra from the documents under scrutiny. Such advanced optical and spectroscopic capabilities enable using the VSC 6000 for a wide range of document examinations, encompassing both ink and paper analysis. The VSC 6000 features spot luminescence examination capability, allowing images to be illuminated with visible light of different wavelengths, and then the luminescence is recorded in the infrared region. VSC 6000 features ten preset optical excitation filters for sample illumination, allowing varying the excitation waveband over different bandwidth ranges from 400–485 nm to 645–800 nm band-pass regions in addition to the wide band-pass filter in the 300–800 nm region. The VSC then can adjust the emission filters of the camera according to the excitation waveband, and this determines the range of the infrared emitted wavelengths that will be recorded. In our experiments, the ten preset filters of VSC 600 were used to vary the excitation waveband used for sample illumination. The different ink samples were examined using the same magnification with slight adjustments to the iris, integration, and exposure time to obtain optimal image clarity using different transmission filters.
The handwritten ink samples were classified according to their luminescence behavior under the first spot luminescence 400–485 nm band-pass filter. Upon examination of a large set of selected samples, the examined samples were grouped into 4 distinct groups (groups I–IV). To gain a thorough understanding of the luminescent properties of the examined samples, the luminescence spectra of the handwritten ink samples were acquired along with those for the crystal violet dye standard and bands of other constituents separated using the TLC plates.
2.3. Thin Layer Chromatography (TLC)
The TLC analysis was conducted using 5 cm × 7.5 cm aluminum sheets coated with silica gel (60F-254, Merck, Darmstadt, Germany). From the above-mentioned samples of Groups I–IV, 12 samples were sub-selected for ink dissolution and analysis. The prepared solvated ink solutions along with a solution of the standard relevant dye were analyzed using TLC to determine the dyes present in each sample. The mobile phase employed for this analysis consisted of a mixture of n-butanol, ethanol, and water in a ratio of 5:1:1.5, as described in the literature [17,24,25]. The TLC bands were labeled as D1–D5 based on their respective Rf values. The standard crystal violet dye was also added to those bands.
2.4. Ultraviolet–Visible (UV–Vis) and Photoluminescence (PL) Measurements
The UV–Vis measurements were carried out using a JENWAY UV–Vis spectrophotometer (Modal ST150SA, United Kingdom). The concentration of the measured samples was adjusted to 20 ppm and UV–Vis spectra were used to study the presence of crystal violet dye or other dyes and their concentration. The PL spectra of ink samples on TLC plates were recorded using the VSC 6000. The PL spectra were acquired using a fixed exposure time of 5 s from 3 different sample spots to assure repeatability, and then one spectrum was considered for spectral comparison.
3. Results and Discussion
3.1. Video Spectral Comparator (VSC) Studies
The IRL toolkit of the VSC constitutes a potent tool for examining and distinguishing different types of ink in the field of forensics. By utilizing the IRL, different BP pen inks can be differentiated based on the color obtained during the investigation. A luminescent ink displays a white color when subjected to IRL, whereas a non-luminescent ink appears black [12,16]. Based on their luminescence response under the initial 400–485 nm band-pass filter, the examined samples were categorized into four main groups (Groups I–IV).
Group I comprises 12 luminescent ink samples exhibiting a vivid white coloration, namely RO4, RO7, RO8, TO1, TO2, PG1, RX1, RX2, CL2, EU1, PE1, and ST1a. Notably, all of these 12 samples maintain their luminescent activity when subjected to examination with the remaining optical filters, as well as the complete spectrum, as depicted in Figure 1. Even though little variations in luminescence strength exist due to some variations in the tone of the color between samples, ranging between a blurring white to off-white and gray color, all such samples were considered as having luminescence activity in our classification [16].
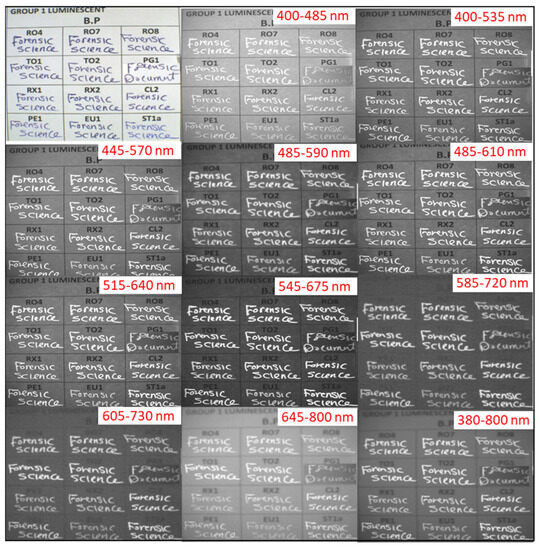
Figure 1.
IRL images of ink samples in Group I including RO4, RO7, RO8, TO1, TO2, PG1, RX1, RX2, CL2, EU1, PE1, and ST1a writing pens under white light and different preset optical excitation filters.
Group II ink samples showed a neutral appearance and seemed transparent under the first 400–485 nm band-pass filter. Group II contained nine samples, namely PR2, PR5, PR6, PR7, PR9, CE1, VN1, RE1a, and RE1b. All Group II samples showed a bright white color using the different excitation filters as shown in Figure 2. Starting from the eighth 585–720 nm band-pass filter, the IRL of the samples PR5, PR7, PR9, CE1, and VN1 begin to decrease while the remaining other samples still possess a strong IRL, suggesting differences in the dye constituents. This shows the capability of using longer-wavelength excitation filters to discriminate ink samples [26].
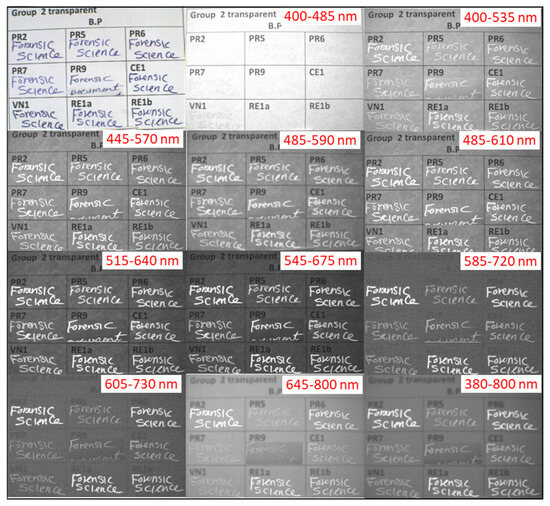
Figure 2.
IRL images of ink samples of Group II including PR2, PR5, PR6, PR7, PR9, CE1, VN1, RE1a, and RE1b writing pens under white light and different preset optical excitation filters.
Group III contained three BP pen samples namely BV1, BV2, and PK1, which showed slight absorbance and appeared faint black. Similar to Group II, samples of Group III also showed white color luminescence with all other remaining filters, as shown in Figure 3. Group IV contained six samples, namely SA1a, SA1b, ZR1a, ZR1b, UB1a, and TO3, which showed noticeable absorbance and appeared black. As can be seen in Figure 4, the behavior of Group IV is distinct from other groups of samples where samples of groups IV remained apparently black when examined with all filters over the entire excitation band-pass regions.
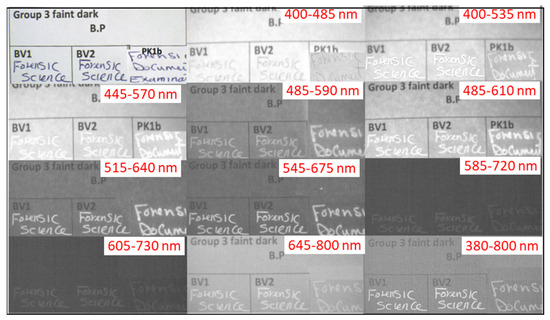
Figure 3.
IRL images of ink samples of Group III including BV1, BV2, and PK1 writing pens under a white light and different preset optical excitation filters.
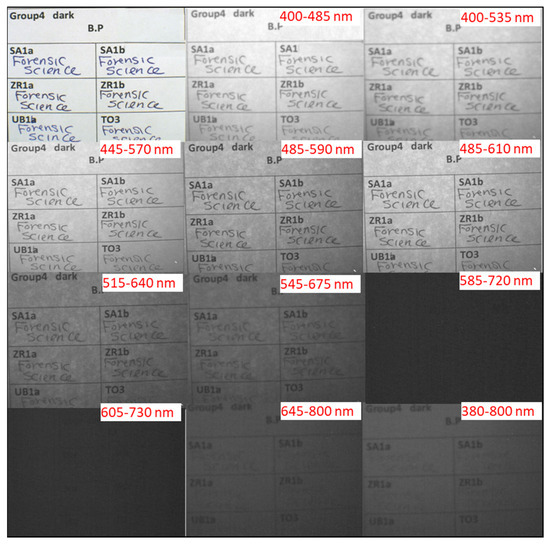
Figure 4.
IRL images of ink samples of Group IV including SA1a, SA1b, ZR1a, ZR1b, UB1a, and TO3 writing pens under white light and different preset optical excitation filters.
Ink dissolution, IRL, and TLC were employed to further investigate the organic dye content of the ink samples which could be responsible for the different optical IRL behavior of the different groups. Specific samples from each of the four main groups were sub-selected to reduce data redundancy and at the same time assure sample diversity via the representation of the various brands in each subgroup of the solvated ink samples. The first subgroup, denoted subgroup I, comprised four samples, namely PE1, TO1, RX1, and RO4, which represent diverse brands of the 12 pens included in the main Group I. The subsequent subgroup (subgroup II) encompassed three selected samples, namely PR2, RE1a, and VN1. The third sub-group (subgroup III) was represented by two samples, namely BV1 and PK1, while the last subgroup (subgroup IV) included three samples of distinct brands, namely SA1a, ZR1a, and TO3. The above-mentioned sub-selected ink samples were solvated and used for sample writing upon their dissolution.
The IRL images of the letter “A” written by the solvated selected ink samples of subgroups I–IV under white light and different preset optical excitation filters are shown in Figure 5 and Figure 6. The ink samples of subgroup I and subgroup II displayed similar IRL characteristics. As can be seen in Figure 5, samples of subgroup I and subgroup II possessed no IRL under the first filter with a bandwidth of 400–485 nm, while possessing a strong IRL across the five following filters and an IRL decay beginning from the seventh filter to the tenth. Figure 6 shows the IRL images of the solvated ink samples of subgroups III and IV under white light and different preset optical excitation filters. The solvated ink samples of subgroup III exhibited similar behavior to that observed in the case of subgroups I and II. On the other hand, solvated ink samples of subgroup IV exhibited unique IRL characteristics. The sample SA1a possessed enhanced solubility, while ZR1a and TO3 samples exhibited poor solubility in ethanol. Consequently, those solvated ink samples displayed variable appearance. The sample SA1a appeared black with white edges along the stroke, while the samples ZR1a and TO3 appeared essentially neutral under the first filter. Nevertheless, they began to exhibit IRL starting from the second excitation filter to the sixth filter. Afterward, they seemed to absorb light and appeared black from the seventh to the tenth filter.
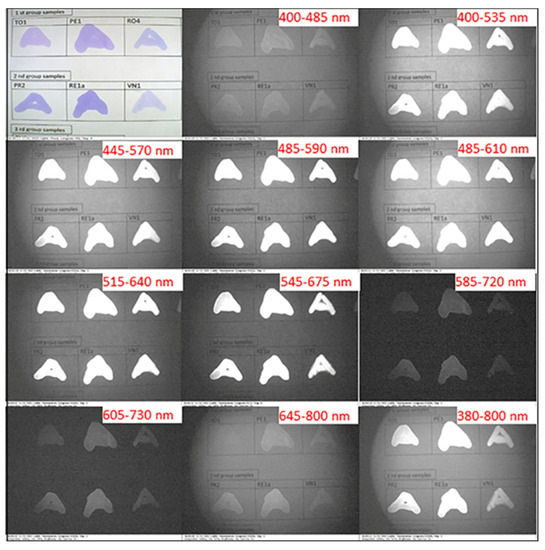
Figure 5.
IRL images of the letter “A” written with dissolution and solvated selected ink samples of subgroups I and II under white light and different preset optical excitation filters.
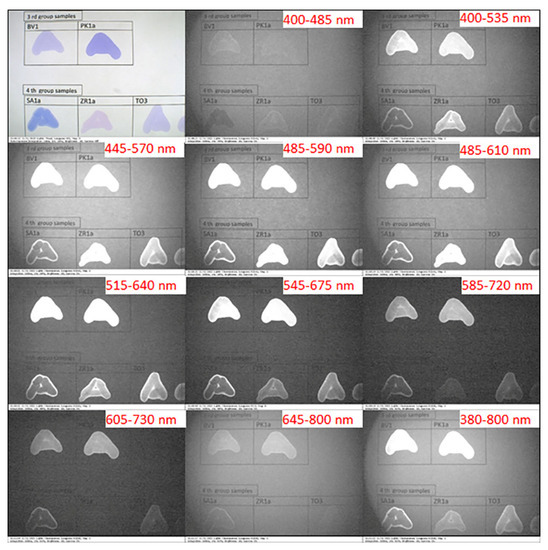
Figure 6.
IRL images of solvated ink samples of subgroups III and IV under white light and different preset optical excitation filters.
3.2. Tin Layer Chromatography (TLC)
The TLC analysis provides a robust and powerful method for screening dye components within a chemical matrix. The results of the TLC analysis (Figure 7) revealed that the examined samples show a prominent presence of crystal violet dye as the primary organic dye ingredient [9,24,27]. The typical chemical structure of the crystal violet dye is shown in Figure S1. The TLC of crystal violet displays four chromatographic zones, even though it is a single substance, as can be seen in Figure 7a. It is worth mentioning that pristine crystal violet dye is photosensitive and it can degrade upon exposure to light. The light-exposed crystal violet can lose a methyl group and form methyl violet dye, which upon further light exposure loses another methyl group forming tetramethylpararosaniline [28,29,30,31]. Consequently, the TLC of the crystal violet reflects the TLC zones correlated with the mother dye and its associated light degradation products. Additionally, many of the studied BP pens contained additional dyes to attain the desired coloration [32]. In addition to findings on the crystal violet, each group exhibited distinct TLC bands. Samples of subgroup I, including the RX1 and RO4, showed a prominent turquoise band with a retention factor (Rf) of 0.55, while the PE1 sample slightly displayed that band. On the other hand, the TO1 sample did not show a turquoise-relevant band. The turquoise-relevant band is designated as D1. For subgroup II, the PR2 and RE1a samples demonstrated bands relevant to strong green dye with an Rf value of 0.66. This band is designated as D2. The VN1 sample of subgroup II showed deviated behavior from the norm and displayed an outlier band. This outlier band was designated as D5. For the two samples, PK1 and BV1 of subgroup III, a green band with an Rf value of 0.76 could be observed for the PK1 sample; this was designated as D3. The BV1 exhibited bands relevant to the D2 dye band similar to samples of subgroup II. The SA1a sample of subgroup IV exhibited a turquoise-relevant band with an Rf value of 0.53, designated as D4. This band was observed in both the TO3 and ZR1a samples, but as a faint band only.
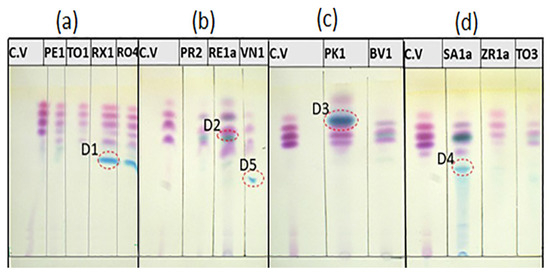
Figure 7.
TLC plates of solvated ink samples of (a) subgroup I, (b) subgroup II, (c) subgroup III, and (d) subgroup IV writing pen samples.
A summary of the distribution of dye components among the different solvated ink samples of subgroups I–IV is presented in Table 1. The TLC results revealed the prominent presence of crystal violet dye in all solvated ink samples. The samples of subgroup I, except for the TO1 sample, contain the D1 dye. The samples of subgroup II comprised D2 dye, except for the VN1 sample which featured a D5 dye instead of D2. For samples of subgroup III, the PK1 sample contained D3, while BV1 contained D2. Samples of subgroup IV comprised the D4 dye, in addition to the D2 dye in the case of both SA1a and TO3 samples.

Table 1.
Summary of the TLC bands and dye distribution of the solvated ink samples of subgroups I–IV.
The TLC plates were then examined by using the VSC to further study the optical behavior of the separated bands on TLC plates and gain insights into the origin of the IRL of the solvated ink samples. The IRL images of the TLC plates of samples of subgroups I–IV under white light and different preset optical excitation filters are displayed in Figure 8 and Figure 9. The two TLC sheets for subgroups I and II were examined together under the ten preset excitation filters. The IRL images shown in Figure 8 indicate that the TLC bands of the reference crystal violet, as well as the correlated bands in the solvated ink samples, show very weak IRL under the first (400–485 nm) band-pass filter. They then began to luminesce from the second (400–535 nm) band-pass filter and luminescence increases over the excitation bandwidths range of the third (445–570 nm) filter to the fourth (485–590) nm filter. The highest luminescence could be observed using the fifth 485–610 nm band-pass filter. The IRL then started to decay from the sixth (515–640) nm band-pass filter to the seventh (545–675) nm band-pass filter, and from the eighth to tenth band-pass filters (585–720 nm, 605–730 nm, and 645–800 nm), no luminescence could be observed. On the other hand, the D1 dye had strong IRL under excitation using the first filter to the tenth, with a peak luminescence under excitation using the middle-range filters. Similar to crystal violet, the D2 dye showed a very weak luminescence under the first excitation filter. It then started to exhibit luminescence under excitation beginning from the second filter, with higher luminescence than that in the case of crystal violet. At the same time, the luminescence could still be observed at excitation using the eighth and ninth filters, unlike the crystal violet.
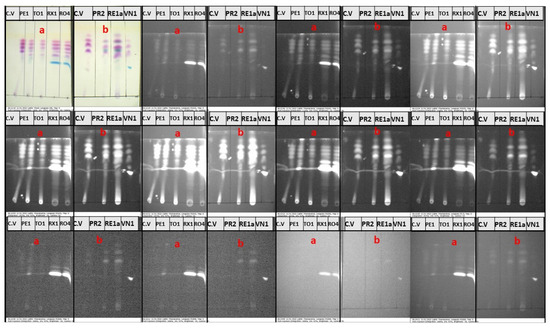
Figure 8.
IRL of TLC plates of samples of (a) subgroup I and (b) subgroup II under white light and different preset optical excitation filters.
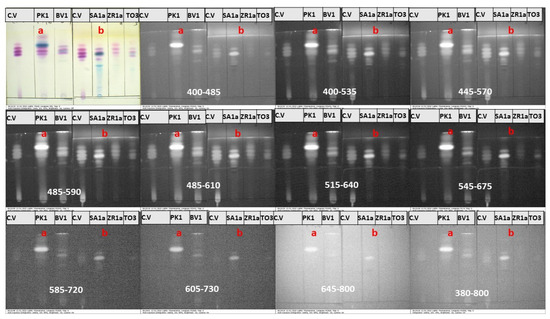
Figure 9.
IRL images of TLC plates of samples of (a) subgroup III and (b) subgroup IV under white light and different preset optical excitation filters.
Figure 9 displays the IRL images of TLC plates of solvated ink samples of subgroups III and IV under white light and different preset optical excitation filters. The IRL properties of the dyes indicated on the TLC plates of subgroup III samples are similar to those observed in the case of subgroup II. Moreover, the D3 dye that distinguishes the PK1 sample exhibited strong luminescence under excitation using the first (400–485 nm) band-pass filter and across the remaining excitation filters, similar to D1 and D2. For solvated ink samples of subgroup IV, which have been shown to contain crystal violet, D2, and D4 dyes, luminescence could be observed for crystal violet and D2, similar to samples of subgroups I–III. In addition, the D4 did not express any luminescence and seemed black under different preset optical excitation filters.
3.3. UV–Visible (UV–Vis) Spectroscopy
UV–Vis spectroscopy was used as a complementary tool for further study of dyes present in the solvated ink samples, particularly crystal violet dye. The presence of some other dyes was identified whenever possible based on similar studies in the literature. The concentration of crystal violet in the studied samples was also investigated using absorbance measurements. A 10−5 M solution of crystal violet dye dissolved in ethanol was used as a standard. Figure S2 displays the absorption spectrum of the ethanolic solution of crystal violet, which features two bands, a “B” band in the UV region at 303 nm, and a “Q” band in the visible region at 582 nm. Figure 10 displays the UV–Vis spectra of the 20 ppm solutions of the 12 selected solvated ink samples of subgroups I–IV. The UV–Vis absorption spectra of the solvated ink samples of subgroup I (Figure 10a) are characterized by absorption peaks typical of crystal violet. Similarly, the remaining solvated ink samples of subgroups II–IV also expressed the two featured absorption peaks of crystal violet as can be seen in Figure 10b,d. The concentration and ratio of the crystal violet in the different ink matrices of the samples of subgroups I–IV were calculated using the Beer–Lambert law (), where A is absorbance (582 nm), is molar absorption coefficient, and is optical path length (1 cm). The calculated concentrations and ratios of the crystal violet in the different samples are listed in Table S2. The ratio of crystal violet percent in the different solvated ink matrices varied from the minimum 6.36% in PE1 to 35.9% in PK1. Interestingly, the absorption spectrum of the solvated ink sample of VN1 from subgroup II (Figure 10b) featured a shoulder absorption at 617 nm which could be related to the D5 dye. Moreover, the UV–Vis spectra of the solvated ink samples of subgroup IV (Figure 10d) demonstrated distinctive characteristics, as indicated by the presence of additional B and Q bands in the UV and visible regions centered around 343 nm around 667 nm, respectively, as can be seen in Figure 10d. These distinct absorption features could suggest the presence of a phthalocyanine dye, which is a common colorant in the matrices of the BP ink formula [22,23]. The chemical structure of a typical phthalocyanine dye is shown in Figure S3. The low relative absorption observed in the case of ZR1a and TO3 samples could be attributed to their limited solubility in ethanol, which further suggests the existence of phthalocyanine dyes (Figure S3) with low solubility [25,33].
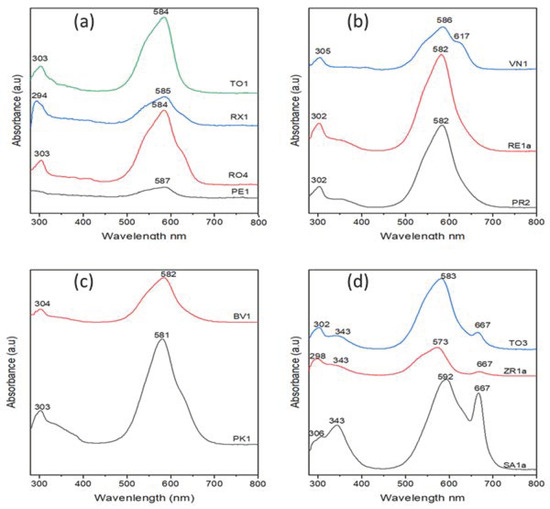
Figure 10.
UV–Vis spectra of solutions of the solvated ink samples of (a) subgroup I, (b) subgroup II, (c) subgroup III, and (d) subgroup IV.
To further investigate the contribution of the different dyes besides the crystal violet to the absorption spectral characteristics of solvated inks, curves of selected UV–Vis spectra were fitted, and absorption maxima other than those of crystal violet were determined. Figure S4 displays the deconvoluted UV–Vis absorption spectra of the RX1 and RE1a samples of subgroups I and II, respectively. The deconvoluted absorption spectrum of the RX1 sample suggests the presence of a convoluted peak at 536 nm, which could be related to the D1 dye. Additionally, the deconvoluted absorption spectrum of the RE1a sample shows a secondary absorption peak centered around 530 nm, which could be related to the D2 dye.
The above TLC and UV–Vis results (Figure 7, Figure 10 and Figure S4) indicate the presence of dye components other than crystal violet as indicated by the broad absorption spectral profiles and the additional peaks obtained upon spectral deconvolution. The absorption maxima of the other dyes indicated by the UV–Vis spectra and deconvoluted data (Figure 10 and Figure S4) suggest that the (D1-D3) dyes (Figure 7) could belong to the triarylmethane family, which typically expresses absorption features overlapping with crystal violet. Figure S5 represents the molecular chemical structures of some of the triarylmethane dyes including methyl violet, basic blue 7, Victoria blue R, and Victoria blue B commonly present in blue BP inks [32,34,35,36].
3.4. Photoluminescence (PL)
The VSC is capable of measuring the PL intensities using different preset excitation optical filters [26,37]. We further studied the PL of writing ink strokes, reference crystal violet, and dyes on TLC plates (crystal violet, D1, D2, and D3) using the ten preset optical filters of the VSC for excitation. Figure 11 presents the PL spectra of the ink strokes of the writing BP pens of subgroup I, namely PE1, TO1, RX1, and RO4 pens under excitation of the ten different preset optical filters of the VSC. The PL spectra of the subgroup I samples are characterized by a broad emission in the range of 705–740 nm upon excitation using the first 400–485 nm band-pass filter. When the ink stroke samples were excited using the second to fourth excitation band-pass filters, a narrower emission band was observed at around 730 nm. Upon excitation with the fifth to seventh band-pass filters of longer wavelengths (<585 nm), a slight gradual red shift of the PL maxima up to 750 nm was observed. In the case of excitation using the eighth 585–720 nm band-pass filter, the emission red shift was greatly increased to around 850 nm, with relatively low PL intensities. The PL characteristics of the ink strokes of the subgroup are in good agreement with their IRL images shown in Figure 1, as discussed earlier. Interestingly, the intercomparison of the four PL spectra of the four samples of subgroup I reveal that the emission maxima of the PE1 and TO1 pair are very similar. Similarly, the RX1 and RO4 pair express comparable emission maxima. The similar PL characteristics of the two pairs, namely (PE1 and TO1) and (RX1 and RO4), further confirm the similar dye composition present in their corresponding ink formulas in agreement with the TLC results shown above in Figure 7a. These results indicate that PL measurements using the VSC can be used to differentiate different ink samples.
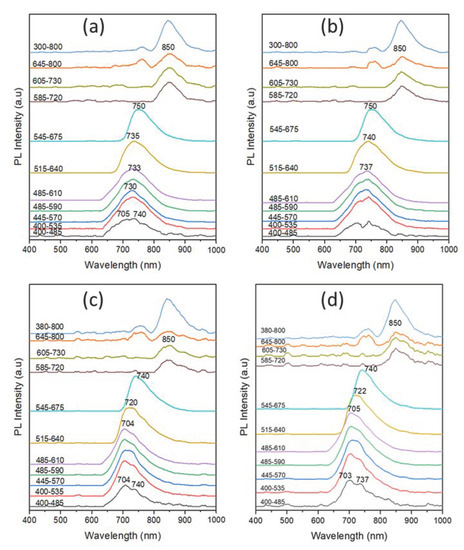
Figure 11.
PL spectra of the ink strokes of the writing BP pens of subgroup I, namely (a) PE1, (b) TO1, (c) RX1, and (d) RO4 pens under excitation of the ten different preset optical filters of the VSC.
Figure 12 displays the PL spectra of the ink strokes of the writing BP pens of subgroup II, namely RE1a, PR2, and VN1 pens under excitation of the ten different preset optical filters of the VSC. The PL spectra of the subgroup II samples were characterized by a weak emission in the range of 705 nm–740 nm upon excitation using the first 400–485 nm band-pass filter. This observation is in good agreement with the IRL images of the same samples shown above in Figure 2. When the ink stroke samples were excited using the second excitation band-pass filters, both the RE1 and PR2 samples (Figure 12a,b) showed a relatively high emission intensity with maxima centered around 736 nm. The emission maxima were then slightly red shifted to 764 nm up to the seventh excitation filter. In addition, the RE1a and PR2 samples continued to express enhanced emission around 745 nm up to the eighth excitation filter. The VN1 sample behaved differently and its PL spectrum (Figure 12c) indicates different emission maxima relative to the RE1 and PR2. Moreover, the VN1 sample did not show appreciable emission upon excitation using the eighth (585–720 nm) to the tenth (645–800 nm) band-pass filters. These results confirm the findings obtained from the TLC studies of those samples (Figure 7b).
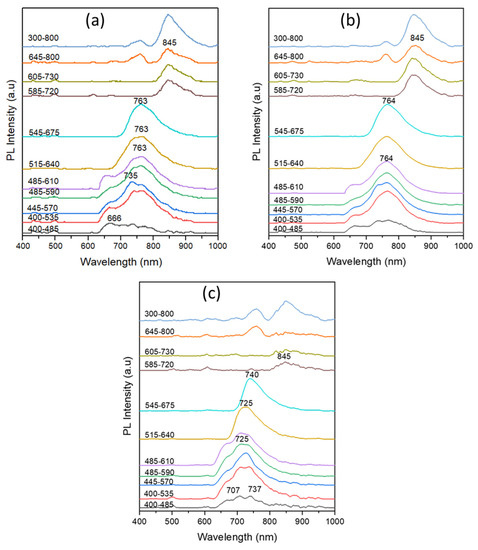
Figure 12.
PL spectra of the ink strokes of the BP pens of subgroup II, namely (a) RE1a, (b) PR2, and (c) VN1, under excitation of the ten different preset optical filters of the VSC.
Figure 13 displays the PL spectra of the ink strokes of the writing BP pens of subgroup III, namely PK1 and BV1 pens under excitation of the ten different preset optical filters of the VSC. The spectra indicate that both the PK1 and BV1 samples express weak PL under the excitation of the first (400–485 nm) band-pass filter in an alignment with their faint dark appearance as discussed in the IRL images shown above in Figure 3. When the ink stroke samples were excited using the second excitation band-pass filters, the PK1 featured emission peaks centered around 666 nm and 732 nm, while BV1 showed emission bands with maxima at 670 nm and 742 nm, as can be seen in Figure 13a,b. Upon excitation with band-pass filters of longer wavelength, the PK1 sample expressed relatively higher PL intensity at around 666 nm, compared to 742 nm in the case of the BV1. The different PL characteristics of these two samples match well with different dye compositions as indicated by the TLC results shown in Figure 7c. When both samples were excited using the seventh excitation band-pass filter, a red shift of the emission maxima to 745 nm and 765 nm was observed for the PK1 and BV1, respectively. Under the excitation, using the eighth-to-tenth filters, both Pk1 and BV1 samples possess a weak PL with an emission maximum centered around 845 nm. The weak PL under these excitation filters agrees with the weak IRL observed using the same filters as discussed earlier in Figure 3.
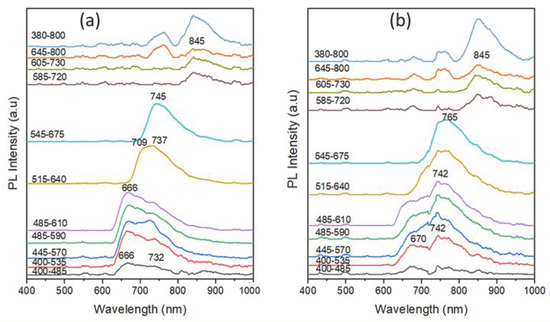
Figure 13.
PL spectra of the ink strokes of the writing BP pens of subgroup III, namely (a) PK1 and (b) BV1 pens under excitation of the ten different preset optical filters of the VSC.
For the ink samples of subgroup IV, the TLC results (Figure 9d) indicated the presence of some dye components in the three samples. This is despite the fact that these samples did not express IRL and their corresponding ink strokes appeared dark (black) under the illumination of the ten preset optical excitation filters of the VSC. Additionally, the same samples showed no appreciable PL properties and no emission peaks could be recorded for them. To investigate this optical behavior, the PL spectra of the dye bands on the TLC plates of the corresponding samples were studied along with reference crystal violet. Figure 14 compares the PL spectra of TLC bands of reference crystal violet and crystal violet band for the RO4 sample (subgroup I) using the ten different preset optical excitation filters of the VSC. The PL spectra of the TLC of reference and sample crystal violet dyes are similar, showing low emission intensity under the first (400–485 nm) band-pass excitation filter. Upon excitation using the second-to-fifth filter, an increased emission could be observed with a maximum emission centered around 660 nm. When the bands were excited using the sixth 515–640 nm band-pass excitation filter, a red shift of the emission maximum to ~705 nm was observed. The PL then started to decay from the seventh 545–675 nm band-pass filter until the emission was completely damped using the remaining excitation filters.
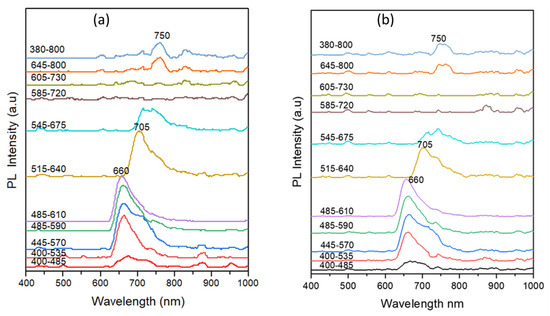
Figure 14.
PL spectra of TLC bands of (a) reference crystal violet and (b) crystal violet band for the RO4 sample (subgroup I) using the ten different preset optical excitation filters of the VSC.
Figure 15 PL spectra of the TLC bands of (a) D1, (b) D2, and (c) D3 dyes separated from the solvated ink samples of the RO4, PR2, and PK1 pens, respectively. The PL spectra indicate the high PL of the D2, D2, and D3 bands with emission maxima centered around 672 nm, 670 nm, and 690 nm, respectively, using the first (400–485 nm) band-pass excitation filter up to the fifth (485–610 nm) band-pass excitation filter. The optical excitation using the sixth (515–640 nm) band-pass filter resulted in a red shift of emission maxima to 705 nm, 707 nm, and 710 nm, respectively. Using the seventh excitation filter, a further red shift of the emission maxima to 734 nm for both D1 and D2 and to 740 in the case of D3. Upon excitation using band-pass filters with transmission greater than 585 nm, only the D1 sample continued to express significant PL under excitation using the 585–720 nm, 605–730 nm, and 645–800 nm band-pass filters. The D1 dye exhibited higher PL compared to crystal violet, and the high PL remained under the excitation of almost all band-pass bands. These results explain the high-intensity IRL for the samples of the mother Group I (Figure 1) since they contain the D1 dye as indicated by the TLC study (Figure 7a). For the D2 and D3, PL behaviors similar to that of the crystal violet were observed when excited using band-pass filters of wavelengths greater than 400–485 nm. In addition, these dyes did not exhibit any PL when excited with band-pass filters with wavelengths greater than 585 nm. This confirms the conclusion that the D1, D2, and D3 dyes belong to the triarylmethane family of dyes. On the other hand, the D4 dye which is suggested to be phthalocyanine did not express PL response under excitation of the different band-pass filters.
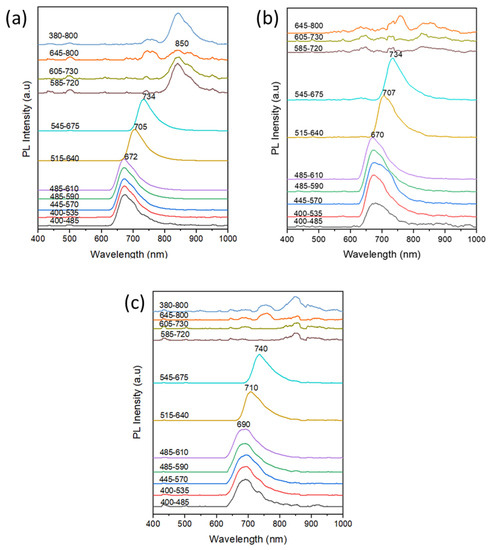
Figure 15.
PL spectra of the TLC bands of (a) D1, (b) D2, and (c) D3 dyes separated from the solvated ink samples of the RO4, PR2, and PK1 pens, respectively.
In summary, the VSC studies resulted in the successful categorization of the 30 studied BP pen samples into four main groups based on the IRL characteristics. The TLC results revealed the presence of crystal violet as an essential dye component in all examined samples, along with some other dyes from the triarylmethane family of dyes. The crystal violet demonstrated weak PL using the first excitation filter (400–485 nm) and under filters beginning from the seventh to the tenth filter in the band-pass range of 585 nm–800 nm. The ink samples of Group I were distinguished by the presence of D1 in their corresponding TLC plates, which was prominently visible, particularly in RX1 and RO4 samples relative to the PE1 sample. The TLC analysis of the TO1 sample revealed the presence of crystal violet only, without any indication of the presence of D1 or other dyes. Nevertheless, the PL spectrum of the ink stroke of the TO1 sample, as well as the corresponding IRL images, indicated the presence of other dye components that match D1. This suggests that D1 dye exists in the TO1 sample in very low concentrations that are undetectable using TLC. The strong PL observed in Group I can be attributed to the presence of D1, as this dye exhibited a high PL signal throughout the entire excitation range, as shown in Figure 15a. Furthermore, D2 and D3 exhibited a higher IRL than crystal violet upon optical excitation using the first (400–485 nm) band-pass filter, and comparable IRL to that of crystal violet under excitation wavelengths greater than 585 nm. These results agree with the optical characteristics of the ink stroke samples containing these dyes (subgroup II and subgroup III). This strongly suggests that crystal violet and triarylmethane dyes (D2 and D3) are responsible for the IRL characteristics observed in both Group II and Group III samples [26,38]. For samples of the subgroup IV which expressed no luminescence, IRL could be observed in the separated dyes, including crystal violet and D2. This could be explained by the presence of phthalocyanine dye (D4) within the ink matrix of those samples with absorption maxima centered around 670 nm, as shown in Figure 10. The absorption peak at 670 nm overlaps with the IRL wavelength of the triarylmethane dyes (660–690 nm) under excitation using the first five optical filters with band-pass in the range 400–585 nm, as shown in Figure 15. The overlap between the absorption of phthalocyanine and emission of triarylmethane dyes could result in photoluminescence quenching.
The samples including the hand-written “A” letter using the solvated inks showed IRL characteristics similar to crystal violet. The solvation of different inks could result in diluted writing ink solutions, which in turn causes a decrease in the overall dye concentration. Among all dyes present, crystal violet expressed a higher relative concentration compared to other dyes. This marginalized the concentrations of the other dyes compared to crystal violet, which caused the IRL of crystal violet to appear as the most prominent dye in subgroups I, II, and III.
For subgroup IV samples, the different solubility extents were reflected in the IRL properties of the corresponding written samples using the solvated samples. For instance, the SA1a sample, which was very soluble, displayed IRL at the edges of the writing line, and no IRL in the middle of the written “A” letter with a black appearance. The luminescence observed at the edges of the stroke can be attributed to the diffusion of the solvent carrying the highly concentrated crystal violet dye, where the mixture of phthalocyanine dye and crystal violet in the middle of the line resulted in luminescence quenching and caused the black color. Furthermore, when writing with a dilute solution of TO3 and ZR1a samples, their obtained IRL resembled that of crystal violet. These two samples had poor solubility, which further suggests the presence of D4 as a phthalocyanine dye with limited solubility. The limited solubility of the phthalocyanine dye resulted in low concentrations, thus limiting the quenching effect.
Concerning the PL spectra, the combination of the two dyes causes a red shift in the emitted light wavelength. For instance, the RO4 and RX1 samples, containing crystal violet and D1 dyes, exhibited PL at 660 nm and 672 nm under the excitation range (400–585 nm). The emission maxima of the ink strokes of these samples were positioned around 705 nm under excitation using the first filter, around 735 nm using the second to sixth filters, and around 750 nm under the seventh excitation filter. This red shift of the PL may result from the conjugation of the present dyes, in addition to the Stokes shift. The extent of the observed red shift varied between different ink samples with different dye compositions, leading to the sub-differentiation of samples of both subgroups I and II. These results show that PL spectra measured using the VSC can provide an important tool for ink examination, while higher discriminatory power can be achieved. The IRL properties of the blue BP pen inks have been assigned mainly to the presence of the crystal violet dye [38]. Our results confirm that crystal violet constitutes the main dye component causing IRL, along with contributions from some other dyes such as the triarylmethane dyes. Interestingly, results show that some triarylmethane dyes exhibited even stronger PL compared to crystal violet. Moreover, their IRL behavior has a significant influence on the overall IRL characteristics obtained from the studied ink stroke samples.
4. Conclusions
This study of luminescence and quenching plays a significant role in the analysis of inks. In this article, we employed a combined approach using spectroscopy and chromatography to unravel the luminescence of BP pen inks. The findings revealed that some tested inks exhibited IRL, attributed to the presence of crystal violet and certain triarylmethane dyes. However, some ink specimens did not display IRL, despite having dyes that normally cause IRL in their composition. Notably, the inclusion of phthalocyanine dye into these non-luminescent ink compounds resulted in quenching of the luminescent components. With the effective use of VSC spot luminescence filters, we achieved a successful classification of the studied ink samples following their respective dyes. PL spectra measured using VSC significantly aid in the differentiation and detailed examination of various ink types.
Supplementary Materials
The following supporting information can be downloaded at: https://www.mdpi.com/article/10.3390/app13169300/s1, Figure S1: The typical chemical structure of the crystal violet dye; Figure S2: UV-Vis spectrum of the reference crystal violet dye in solution; Figure S3: The typical chemical structure of the phthalocyanine dye; Figure S4: Deconvoluted UV-Vis absorption spectra of the RX1 and RE1a samples of subgroups I and II, respectively; Figure S5: Molecular chemical structure of four different triarylmethane dyes including (a) methyl violet, (b) basic blue 7, (c) Victoria blue R, and (d) Victoria blue B; Table S1: List of the codes assigned to the thirty blue BP pen samples along with their brands, models, and manufacturers; Table S2: Calculated crystal violet concentrations and ratios in the solvated ink matrices of the 12 selected samples of subgroups I–IV.
Author Contributions
Conceptualization, A.A.G. and A.F.Z.; Methodology, A.A.G. and A.F.Z.; Software, A.A.G.; Validation, A.F.Z., T.M.S. and I.I.; Formal Analysis, A.A.G. and A.F.Z.; Investigation, A.A.G. and A.F.Z.; Resources, A.A.G. and I.I.; Visualization, M.M. and I.I.; Data Curation, A.A.G. and A.F.Z.; Writing, A.A.G. and A.F.Z.; Review and Editing, A.F.Z., T.M.S. and G.G.M.; Supervision, A.F.Z., T.M.S., M.M. and G.G.M.; Project Administration, I.I. and T.M.S. All authors have read and agreed to the published version of the manuscript.
Funding
This research received no external funding.
Institutional Review Board Statement
Not applicable.
Informed Consent Statement
Not applicable.
Data Availability Statement
Not applicable.
Conflicts of Interest
The authors declare no conflict of interest.
References
- Kher, A.; Mulholland, M.; Green, E.; Reedy, B. Forensic classification of ballpoint pen inks using high performance liquid chromatography and infrared spectroscopy with principal components analysis and linear discriminant analysis. Vib. Spectrosc. 2006, 40, 270–277. [Google Scholar] [CrossRef]
- Rauschenbach, I.; Jessberger, E.; Pavlov, S.; Hübers, H.-W. Miniaturized Laser-Induced Breakdown Spectroscopy for the in-situ analysis of the Martian surface: Calibration and quantification. Spectrochim. Acta Part B At. Spectrosc. 2010, 65, 758–768. [Google Scholar] [CrossRef]
- Cicconi, F.; Lazic, V.; Palucci, A.; Almeida Assis, A.C.; Saverio Romolo, F. Forensic Analysis of Commercial Inks by Laser-Induced Breakdown Spectroscopy (LIBS). Sensors 2020, 20, 3744. [Google Scholar] [CrossRef]
- Quigley, M.N.; Qi, H. A chemistry whodunit: Forensic examination of pen inks. J. Chem. Educ. 1991, 68, 596. [Google Scholar] [CrossRef]
- Denman, J.A.; Skinner, W.M.; Kirkbride, K.P.; Kempson, I.M. Organic and inorganic discrimination of ballpoint pen inks by ToF-SIMS and multivariate statistics. Appl. Surf. Sci. 2010, 256, 2155–2163. [Google Scholar] [CrossRef]
- Gawad, A.A.; Salama, T.M.; Meshref, M.; Mohamed, G.G.; Zedan, A.F. Coupling ATR-FTIR Spectroscopy and Chemometric Analysis for Rapid and Non-Destructive Ink Discrimination of Forensic Documents. Egypt. J. Chem. 2022, 65, 1–6. [Google Scholar] [CrossRef]
- Díaz-Santana, O.; Vega-Moreno, D.; Conde-Hardisson, F. Gas chromatography-mass spectrometry and high-performance liquid chromatography-diode array detection for dating of paper ink. J. Chromatogr. A 2017, 1515, 187–195. [Google Scholar] [CrossRef] [PubMed]
- Purba, M.; Gupta, S.; Gupta, R. Differentiation of Different Blue Inks in Manipulated Documents using VSC ® -8000/HS: A Comprehensive Non-Destructive Technique. Ann. Rom. Soc. Cell Biol. 2021, 25, 5794–5801. [Google Scholar]
- Bansinge, M.D.; Tekade, P.V.; Bajaj, S.D.; Mahodaya, O.; Barwat, N.A. Analysis of Different Ball Point Pen Inks Using Thin Layer Chromatography and Comparison with FTIR Spectrometer. Chem. Sci. 2019, 8, 160–171. [Google Scholar]
- Lehmann, E.L.; Arruda, M.A.Z. Minimalist strategies applied to analysis of forensic samples using elemental and molecular analytical techniques—A review. Anal. Chim. Acta 2019, 1063, 9–17. [Google Scholar] [CrossRef]
- Farid, S.; Kasem, M.A.; Zedan, A.F.; Mohamed, G.G.; El-Hussein, A. Exploring ATR Fourier transform IR spectroscopy with chemometric analysis and laser scanning microscopy in the investigation of forensic documents fraud. Opt. Laser Technol. 2021, 135, 106704. [Google Scholar] [CrossRef]
- Khairkar, S.; Gaikawad, S.; Kokare, R.; Daundkar, B. Forensic discrimination potential of video spectral comparator and micro spectrophotometer in analyzing question document and fraud cases in India. J. Forensic Res. 2016, 7, 1000329. [Google Scholar]
- Sauzier, G.; McGinn, J.; Trubshoe, T.; Lewis, S.W. In situ examination of handwritten blue ballpoint inks using video spectral comparison with chemometrics. Forensic Sci. Int. Rep. 2019, 1, 100021. [Google Scholar] [CrossRef]
- Mekonnen, N. Examination of Different Inks Available in Ethiopia Using VSC 8000, U.V-Visible Spectrophotometer and TLC: Study of Their Discrimination Potential. Int. Res. J. Sci. Technol. 2019, 1, 66–69. [Google Scholar] [CrossRef]
- Khumalo, N. Analysis of Selected Methods Used in Forensic Paper-Based Document Examination. J. Forensic Doc. Exam. 2018, 10, 20–28. [Google Scholar]
- Weyermann, C.; Techabowornkiat, K.-U. Emerging Approaches in the Analysis of Inks on Questioned Documents. In Emerging Technologies for the Analysis of Forensic Traces; Francese, S., Ed.; Springer International Publishing: Cham, Switzerland, 2019; pp. 157–178. [Google Scholar]
- Sherma, J. Advances in the thin-layer chromatographic forensic analysis of inks. J. Liq. Chromatogr. Relat. Technol. 2016, 39, 549–557. [Google Scholar] [CrossRef]
- Neumann, C.; Ramotowski, R.; Genessay, T. Forensic examination of ink by high-performance thin layer chromatography—The United States Secret Service Digital Ink Library. J. Chromatogr. A 2011, 1218, 2793–2811. [Google Scholar] [CrossRef]
- Senior, S.; Hamed, E.; Masoud, M.; Shehata, E. Characterization and dating of blue ballpoint pen inks using principal component analysis of UV–Vis absorption spectra, IR spectroscopy, and HPTLC. J. Forensic Sci. 2012, 57, 1087–1093. [Google Scholar] [CrossRef]
- Causin, V.; Casamassima, R.; Marega, C.; Maida, P.; Schiavone, S.; Marigo, A.; Villari, A. The discrimination potential of ultraviolet-visible spectrophotometry, thin layer chromatography, and Fourier transform infrared spectroscopy for the forensic analysis of black and blue ballpoint inks. J. Forensic Sci. 2008, 53, 1468–1473. [Google Scholar] [CrossRef]
- Quinteros, E.D. Analysis of Blue Fountain Pen Ink by UV-Vis Spectroscopy, ATR-FTIR Spectroscopy, and Thin Layer Chromatography Enhanced with RGB Spot Evaluation to Construct a Database for Comparison and Identification. Ph.D. Thesis, City University of New York, New York, NY, USA, 2022. [Google Scholar]
- Adam, C.D.; Sherratt, S.L.; Zholobenko, V.L. Classification and individualisation of black ballpoint pen inks using principal component analysis of UV–vis absorption spectra. Forensic Sci. Int. 2008, 174, 16–25. [Google Scholar] [CrossRef]
- Kumar, R.; Sharma, V. A novel combined approach of diffuse reflectance UV–Vis-NIR spectroscopy and multivariate analysis for non-destructive examination of blue ballpoint pen inks in forensic application. Spectrochim. Acta Part A Mol. Biomol. Spectrosc. 2017, 175, 67–75. [Google Scholar] [CrossRef]
- Tinggi, L.N.B. Forensic analysis of blue ballpoint pen inks on questioned documents by high performance thin layer chromatography technique (HPTLC). Malays. J. Anal. Sci. 2014, 18, 226–233. [Google Scholar]
- Coman, V.; Copaciu, F. Analysis of dyes and inks. In Instrumental Thin-Layer Chromatography; Elsevier: Amsterdam, The Netherlands, 2015; pp. 555–588. [Google Scholar]
- Stašková, S.; Reháková, M.; Oravec, M.; Jabconová, A. Using infrared luminescence to study crystal violet lactone in carbonless papers. Chem. Pap. 2021, 75, 4099–4111. [Google Scholar] [CrossRef]
- Włodarczyk, E.; Zarzycki, P.K. Chromatographic behavior of selected dyes on silica and cellulose micro-TLC plates: Potential application as target substances for extraction, chromatographic, and/or microfluidic systems. J. Liq. Chromatogr. Relat. Technol. 2017, 40, 259–281. [Google Scholar] [CrossRef]
- Andrasko, J. HPLC analysis of ballpoint pen inks stored at different light conditions. J. Forensic Sci. 2001, 46, 21–30. [Google Scholar] [CrossRef] [PubMed]
- Díaz-Santana, O.; Conde-Hardisson, F.; Vega-Moreno, D.J. Comparison of the main dating methods for six ball-point pen inks. Microchem. J. 2018, 138, 550–561. [Google Scholar] [CrossRef]
- Ezcurra, M.; Góngora, J.M.; Maguregui, I.; Alonso, R. Analytical methods for dating modern writing instrument inks on paper. Forensic Sci. Int. 2010, 197, 1–20. [Google Scholar] [CrossRef] [PubMed]
- Hoang, A.D.; Tu, M.B.; Ta, T.T.; Hoang, M.H. Combination of a Green and a Traditional Method for Estimating Relative and Absolute Ink Age: A Case Study of Ballpoint Pen Ink Dating in Vietnam. J. Anal. Methods Chem. 2021, 2021, 8870541. [Google Scholar] [CrossRef]
- Feraru, D.L.; Mihaly, M.; Meghea, A. Chromatic analysis of blue ballpoint pen inks and related dyes. Color Res. Appl. 2015, 40, 169–177. [Google Scholar] [CrossRef]
- Zhou, Q.; Liu, Z.-F.; Marks, T.J.; Darancet, P. Electronic Structure of Metallophthalocyanines, MPc (M = Fe, Co, Ni, Cu, Zn, Mg) and Fluorinated MPc. J. Phys. Chem. A 2021, 125, 4055–4061. [Google Scholar] [CrossRef]
- Dunn, J.D.; Allison, J. The detection of multiply charged dyes using matrix-assisted laser desorption/ionization mass spectrometry for the forensic examination of pen ink dyes directly from paper. J. Forensic Sci. 2007, 52, 1205–1211. [Google Scholar] [CrossRef] [PubMed]
- Weyermann, C.; Marquis, R.; Mazzella, W.; Spengler, B. Differentiation of blue ballpoint pen inks by laser desorption ionization mass spectrometry and high-performance thin-layer chromatography. J. Forensic Sci. 2007, 52, 216–220. [Google Scholar] [CrossRef]
- Sun, Q.; Luo, Y.; Yang, X.; Xiang, P.; Shen, M. Detection and identification of dyes in blue writing inks by LC-DAD-orbitrap MS. Forensic Sci. Int. 2016, 261, 71–81. [Google Scholar] [CrossRef] [PubMed]
- Adam, C.D. In situ luminescence spectroscopy with multivariate analysis for the discrimination of black ballpoint pen ink-lines on paper. Forensic Sci. Int. 2008, 182, 27–34. [Google Scholar] [CrossRef] [PubMed]
- Williamson, R.; Djidrovska, D.; Ledic, A.; Brzica, S.; Antikj, V.; Hofer, R.; Almirall, J. Characterization and identification of luminescent components in inks using various analytical techniques for the study of crossed-line intersections. Forensic Chem. 2017, 3, 28–35. [Google Scholar] [CrossRef]
Disclaimer/Publisher’s Note: The statements, opinions and data contained in all publications are solely those of the individual author(s) and contributor(s) and not of MDPI and/or the editor(s). MDPI and/or the editor(s) disclaim responsibility for any injury to people or property resulting from any ideas, methods, instructions or products referred to in the content. |
© 2023 by the authors. Licensee MDPI, Basel, Switzerland. This article is an open access article distributed under the terms and conditions of the Creative Commons Attribution (CC BY) license (https://creativecommons.org/licenses/by/4.0/).