
A Path Recommendation Method Considering Individual Driving Preferences

Abstract
:1. Introduction
- A path satisfaction calculation method based on ALPR data was proposed based on ALPR data. By analyzing the trajectory data obtained through ALPR data, the driver type was identified and their path selection preferences were extracted. This approach makes the quantification of individual preferences at low cost, providing a new avenue for quantifying preferences using ALPR data.
- An indicator importance scoring method was proposed. We suggested using the pth percentile method to evaluate the importance of the indicators instead of relying on expert evaluations which are used in traditional AHP. This approach enhanced objectivity and stability in the construction of the comparison matrix, thus improving the accuracy of the model.
- To validate the effectiveness of the proposed method, we designed and conducted experiments, and the results demonstrated the efficacy and superiority of the proposed method in capturing individual preferences and generating personalized path recommendations.
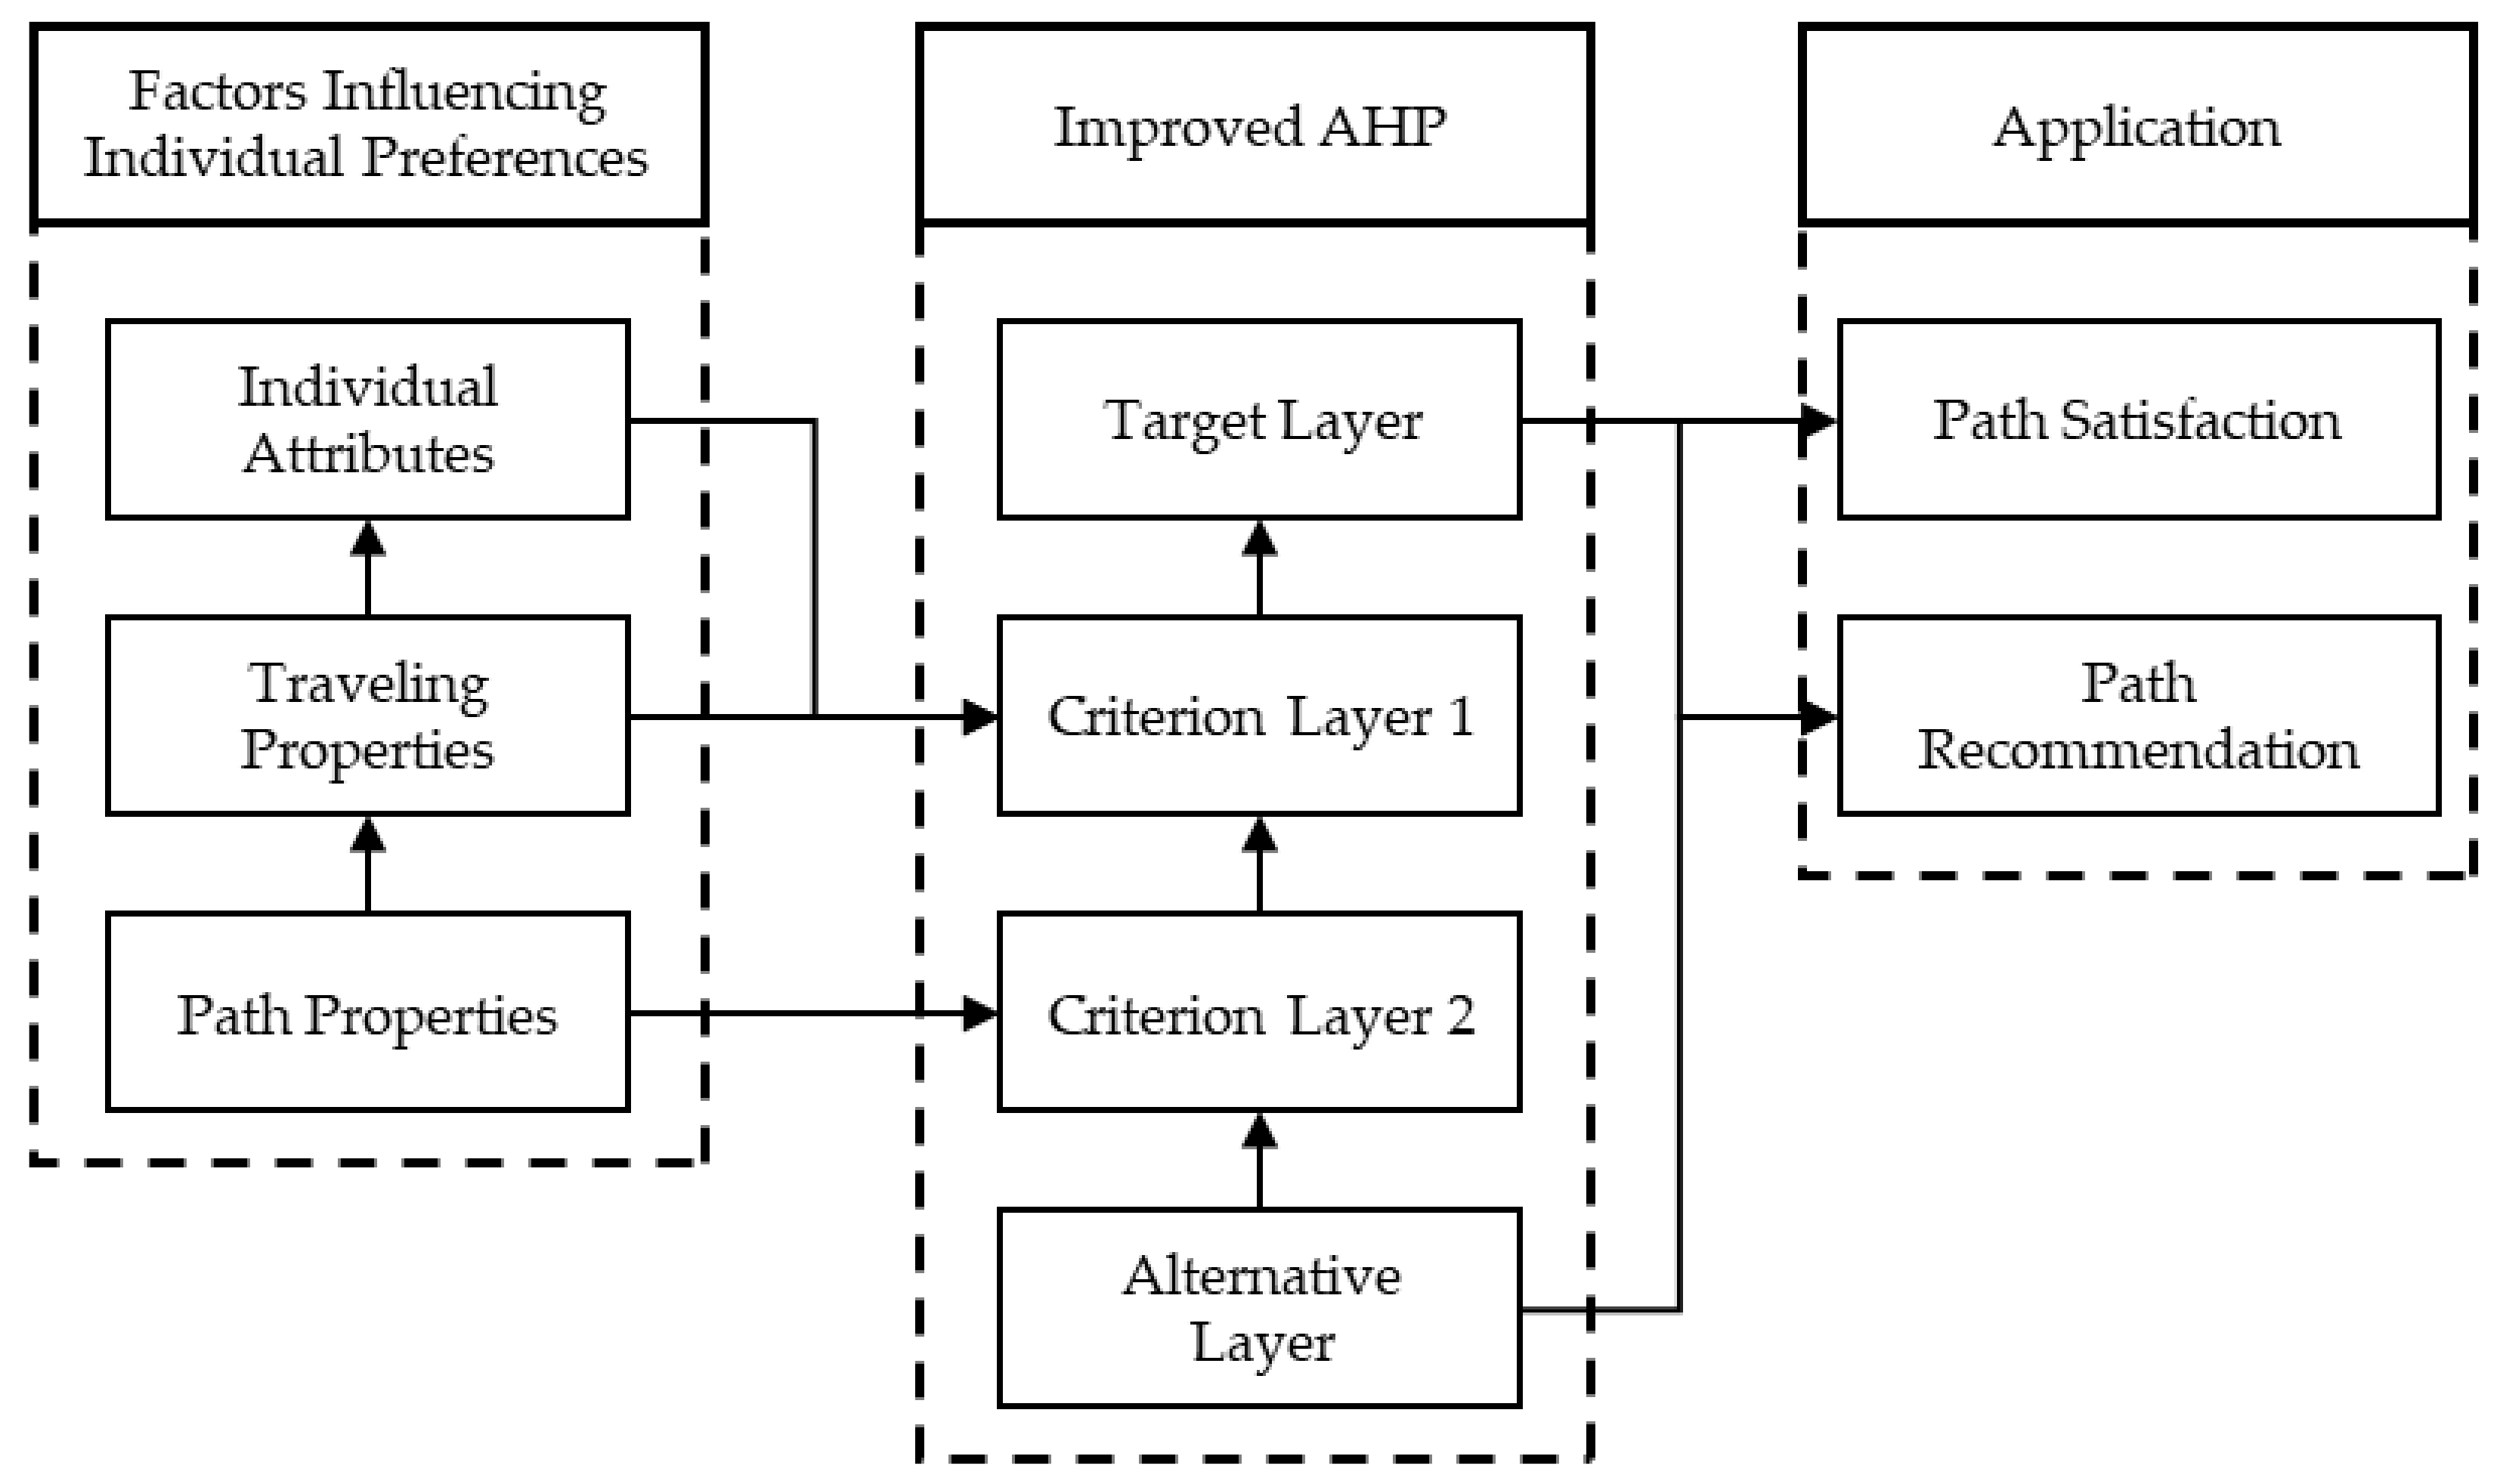
2. Factors Influencing Individual Preferences
2.1. Path Properties
2.1.1. Static Properties
- 1.
- Path length
- 2.
- Number of path lanes
- 3.
- Number of path intersections
- 4.
- Path turning index
2.1.2. Dynamic Properties
- 1.
- Path Travel Time
- 2.
- Maximum and Average Path Density
2.2. Traveling Properties
- 1.
- Purpose of trip and expected length of trip
- 2.
- Frequency of trips
2.3. Individual Attributes
- 1.
- Stability of travel time
- 2.
- Historical Inertia
- 3.
- Path Difficulty
- 4.
- Traffic Status
3. A Path Satisfaction Model Considering Individual Preferences
3.1. Hierarchical Analysis Method
- 1.
- Building a hierarchical model
- 2.
- Construction of comparison matrix
- 3.
- Weighting solution
- 4.
- Consistency identification
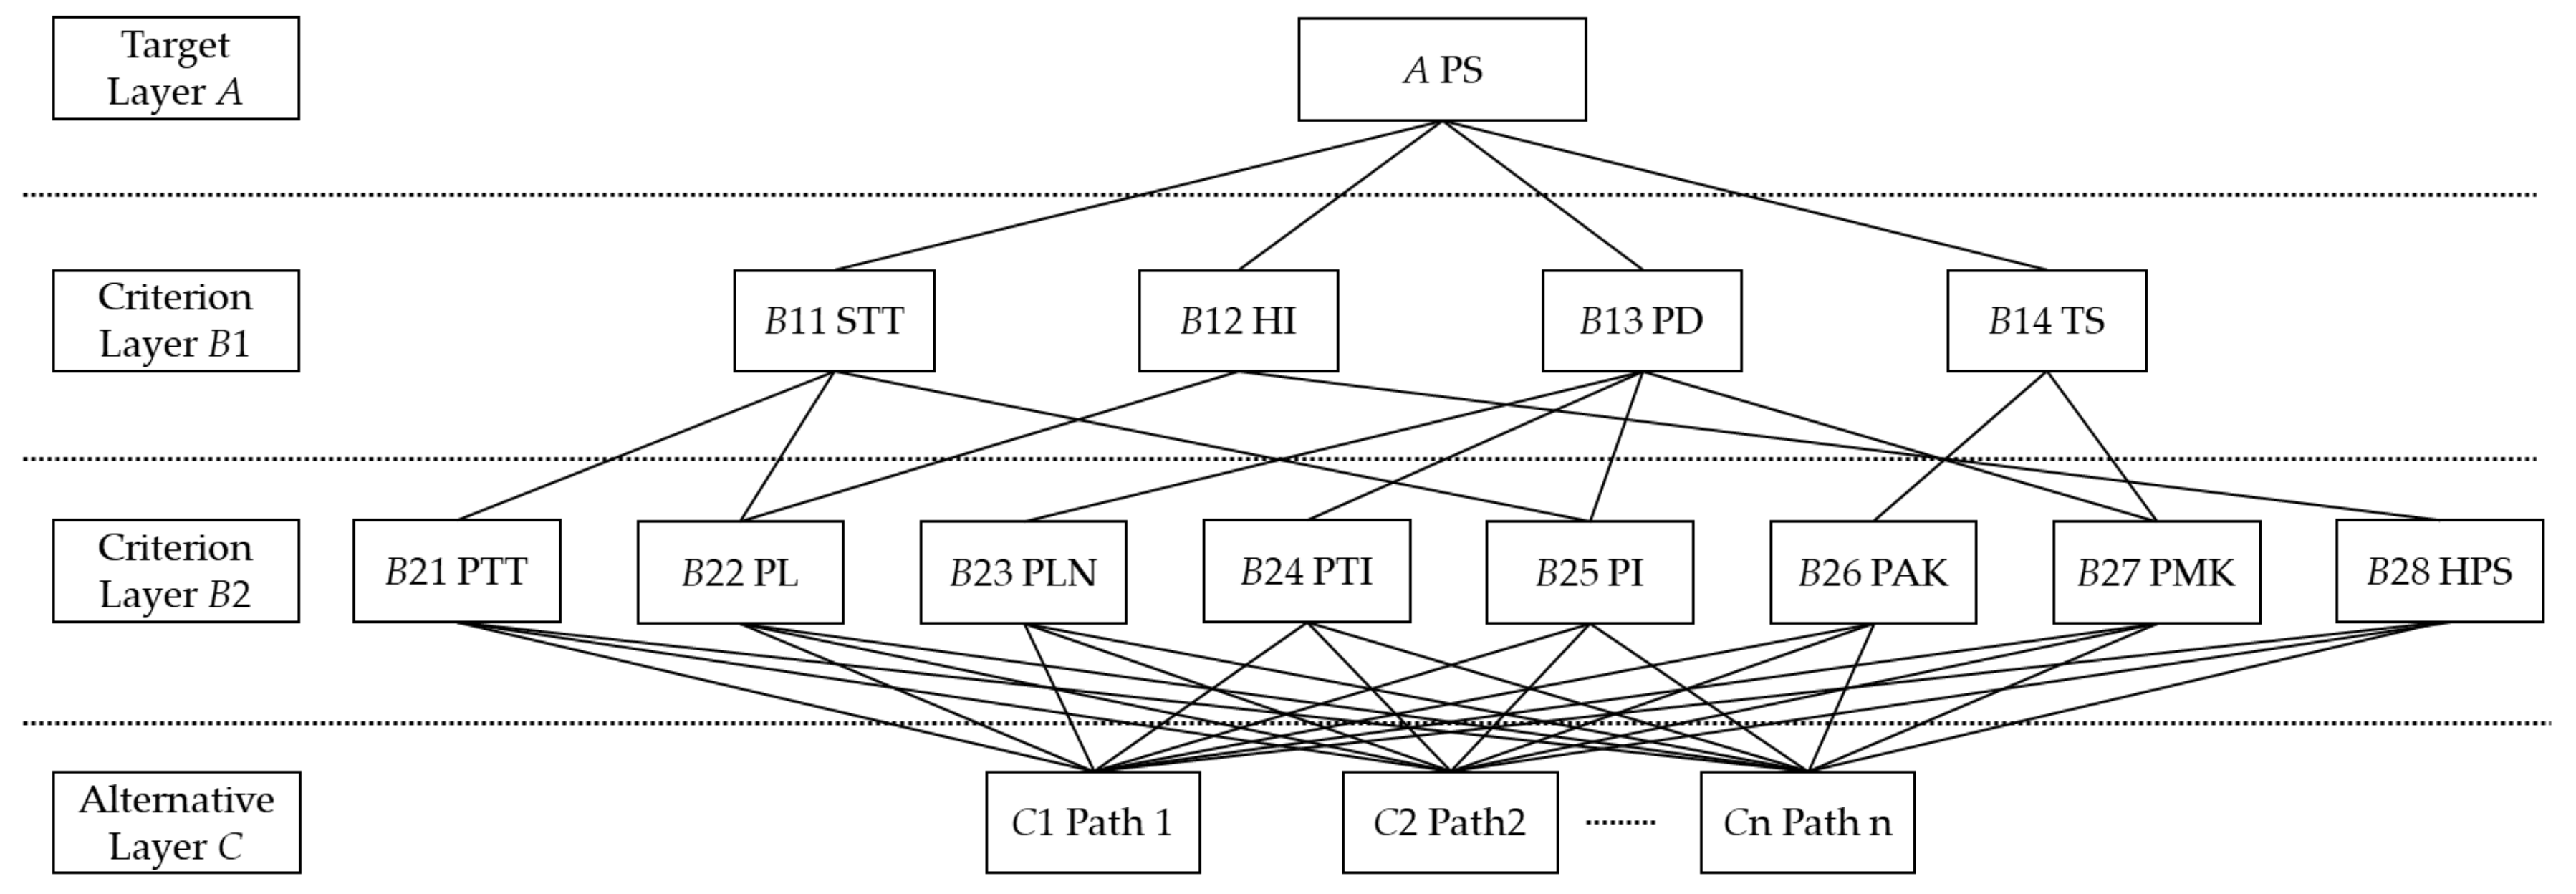
3.2. Path Satisfaction Model Based on Improved AHP Algorithm
- 1.
- value of indicators from criterion layer B1 affecting target layer A
- 2.
- value of indicators from criterion layer B2 affecting criterion layer B1
- 3.
- value of indicators from alternative layer C affecting criterion layer B2
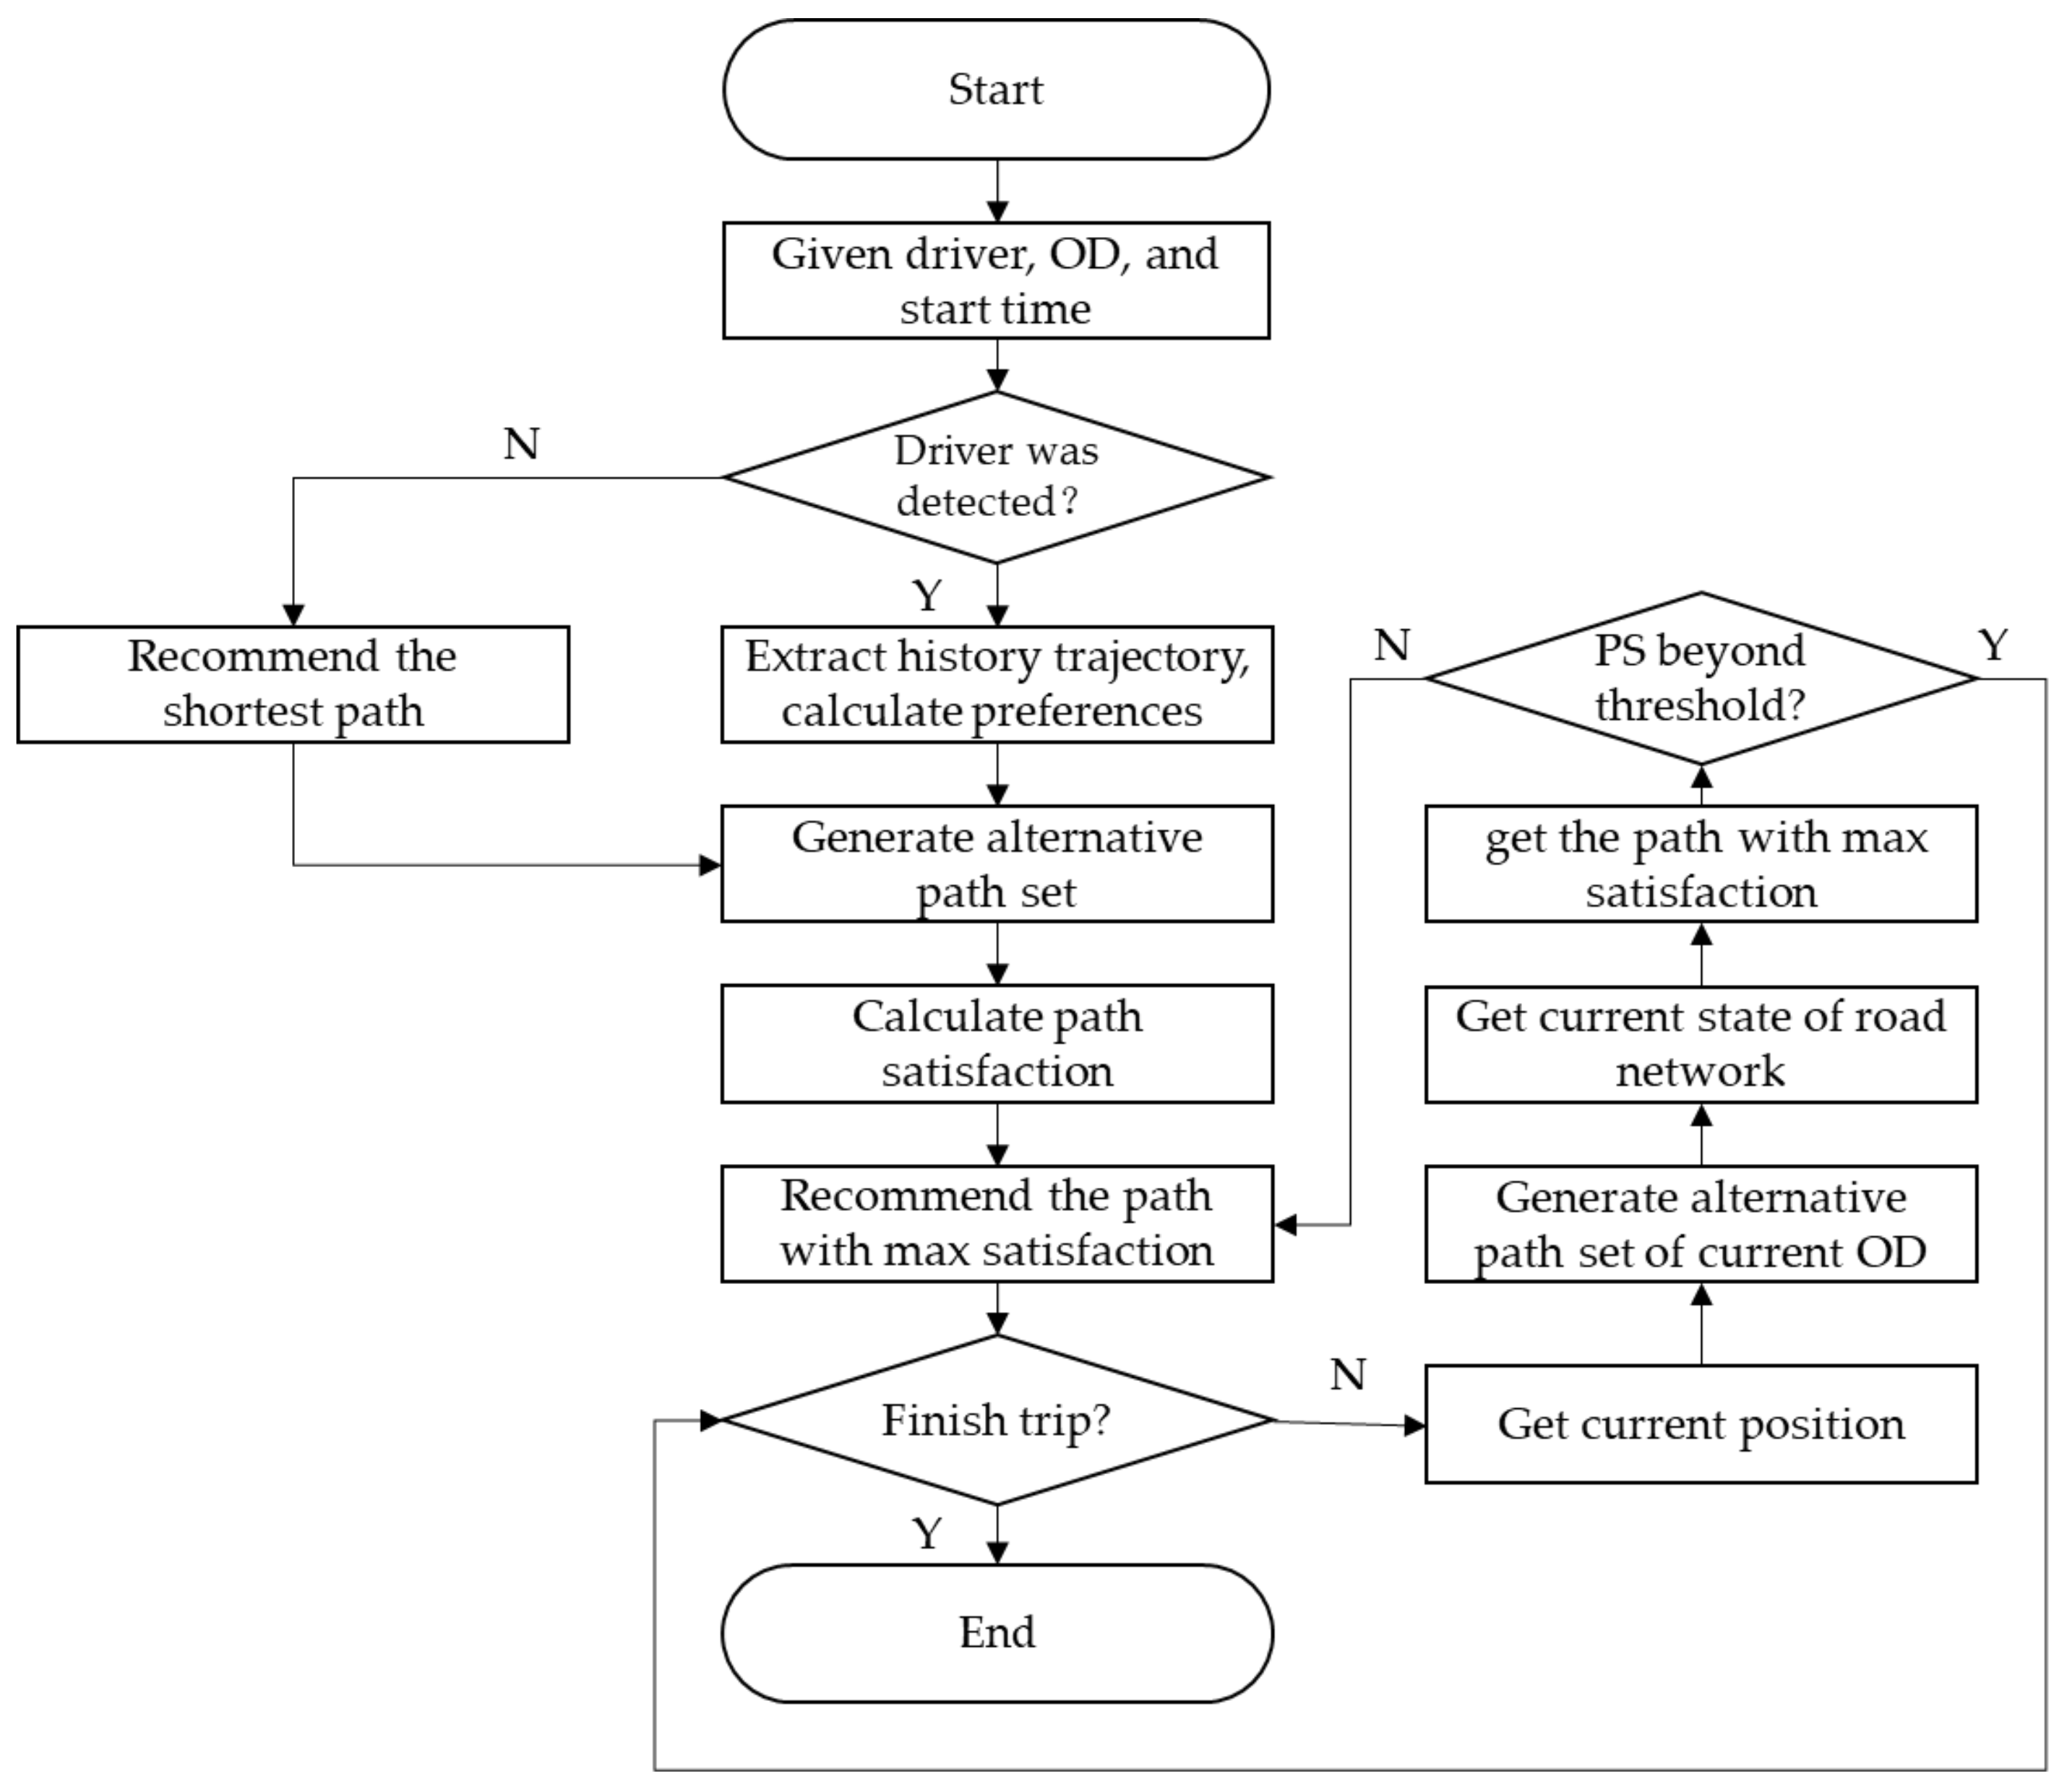
4. Personalized Path Recommendation Method
4.1. Alternative Path Sets
4.2. Secondary Path Recommendation Threshold
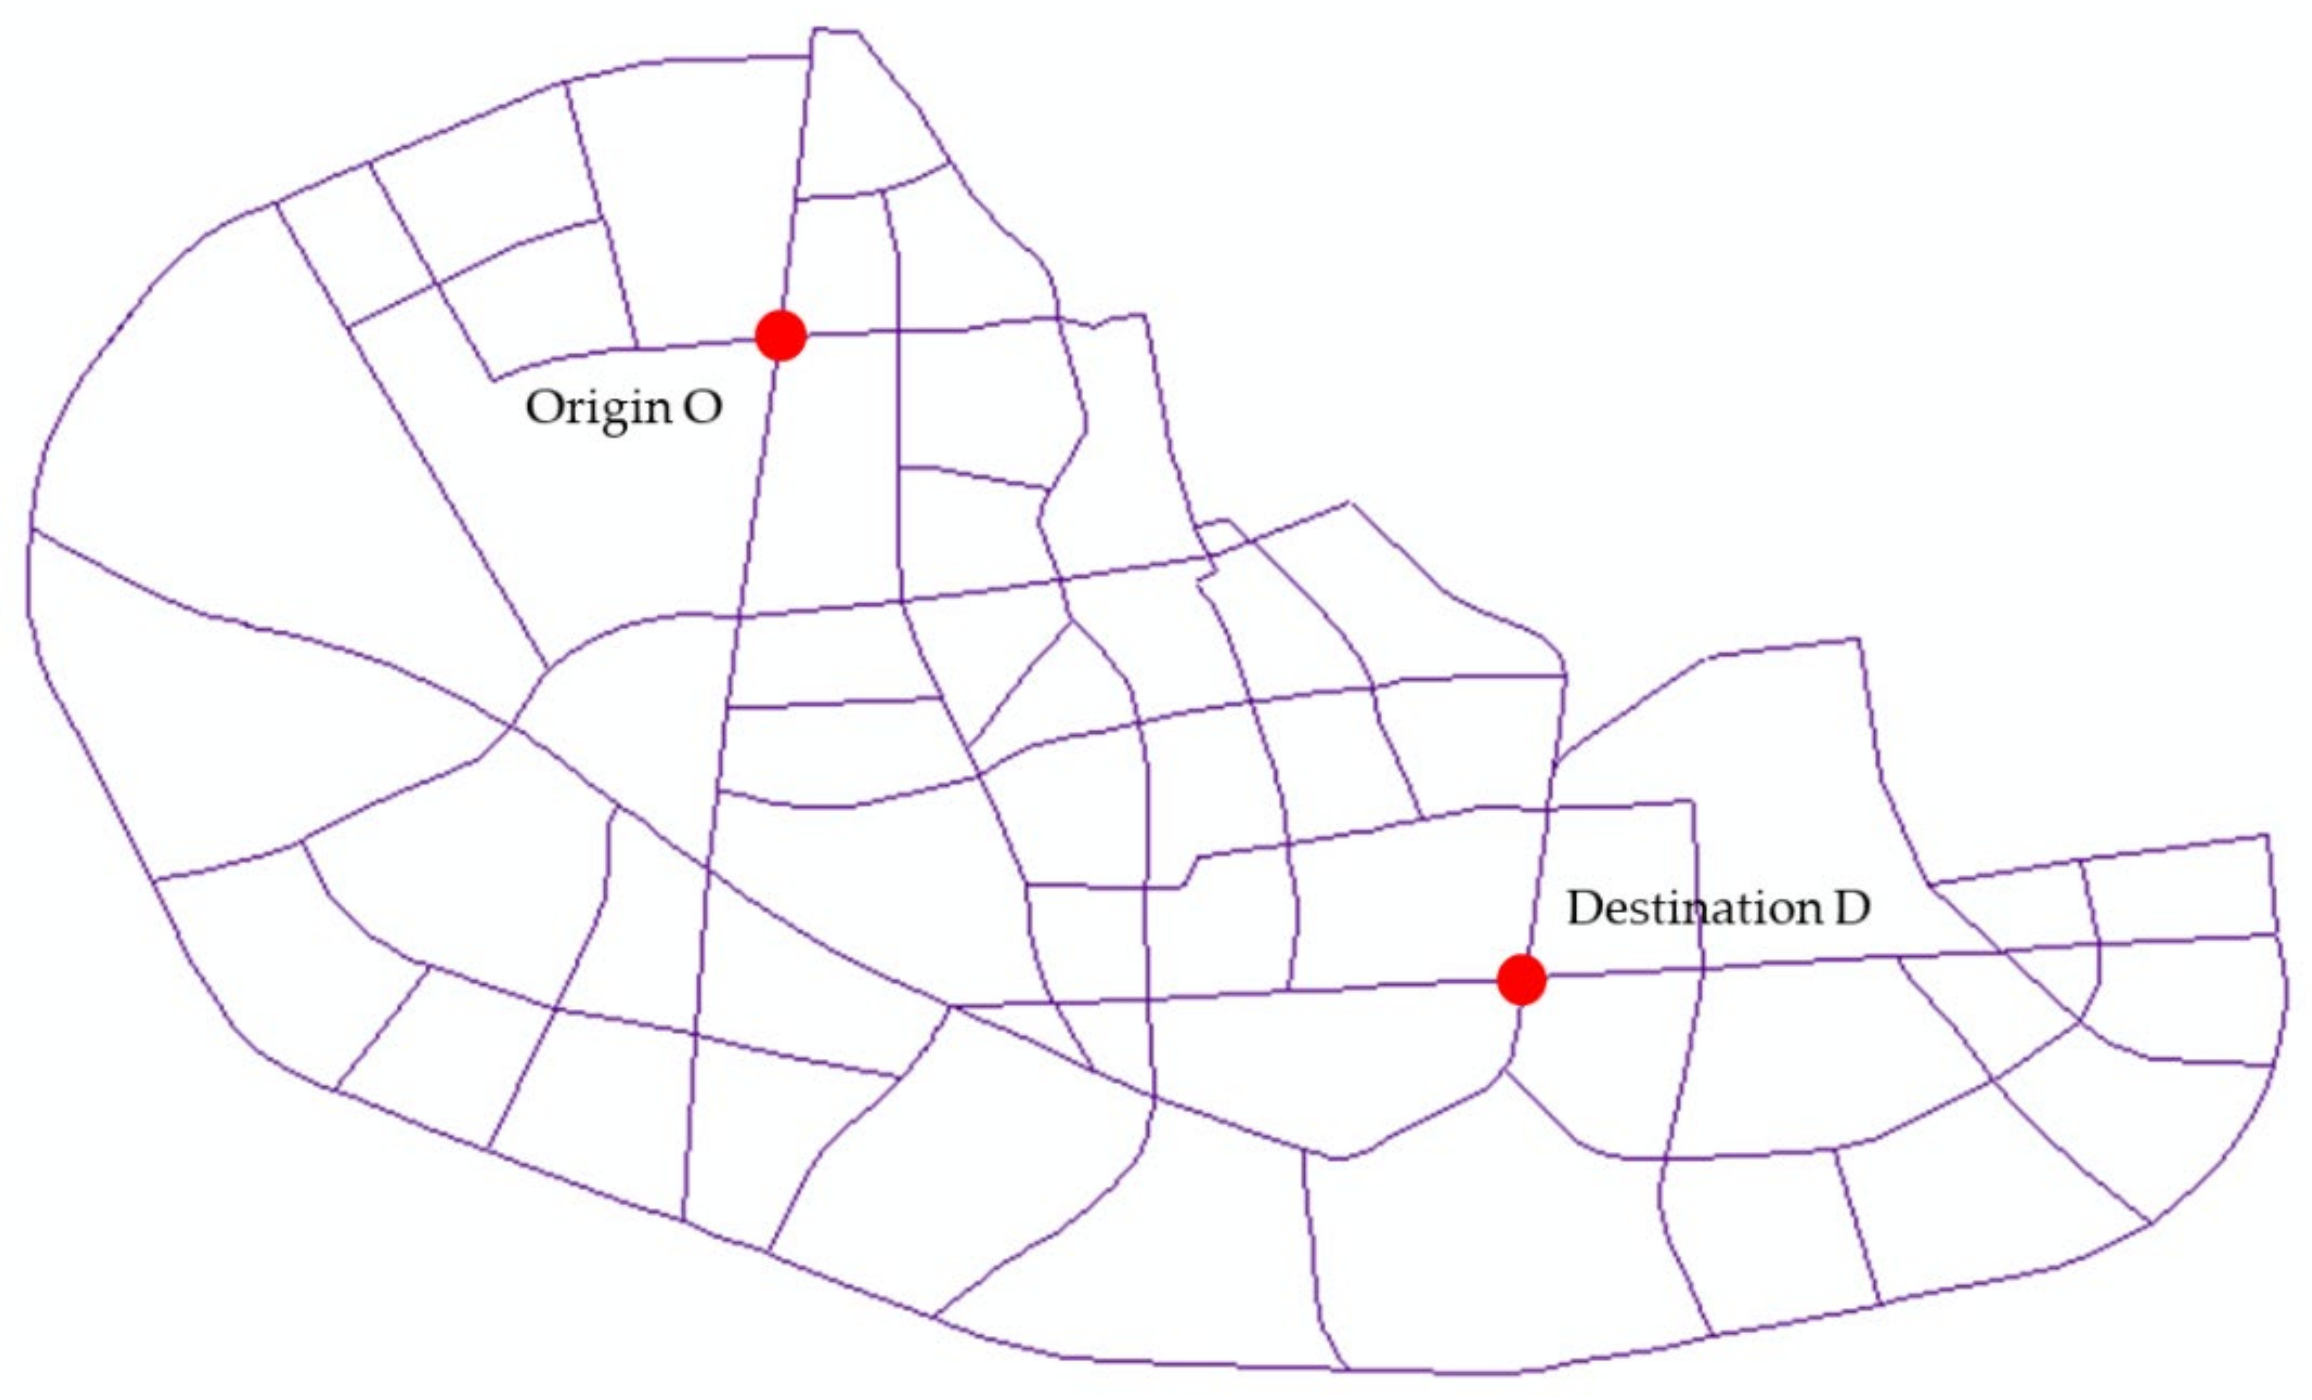
5. Case Studies
5.1. Research Data
5.2. Calculation of Path Satisfaction of Individual Driver
5.2.1. Path Dynamic and Static Properties
5.2.2. Path Satisfaction

| B13 | B21 | B22 | B23 | B24 | B25 | B26 | B27 | B28 |
|---|---|---|---|---|---|---|---|---|
| B21 | 0 | 0 | −1 | −1 | −1 | 0 | −1 | 0 |
| B22 | 0 | 0 | −1 | −1 | −1 | 0 | −1 | 0 |
| B23 | 1 | 1 | 0 | −1 | −1 | 1 | −1 | 1 |
| B24 | 1 | 1 | 1 | 0 | −1 | 1 | −1 | 1 |
| B25 | 1 | 1 | 1 | 1 | 0 | 1 | −1 | 1 |
| B26 | 0 | 0 | −1 | −1 | −1 | 0 | −1 | 0 |
| B27 | 1 | 1 | 1 | 1 | 1 | 1 | 0 | 1 |
| B28 | 0 | 0 | −1 | −1 | −1 | 0 | −1 | 0 |
| B14 | B21 | B22 | B23 | B24 | B25 | B26 | B27 | B28 |
|---|---|---|---|---|---|---|---|---|
| B21 | 0 | 0 | 0 | 0 | 0 | −1 | −1 | 0 |
| B22 | 0 | 0 | 0 | 0 | 0 | −1 | −1 | 0 |
| B23 | 0 | 0 | 0 | 0 | 0 | −1 | −1 | 0 |
| B24 | 0 | 0 | 0 | 0 | 0 | −1 | −1 | 0 |
| B25 | 0 | 0 | 0 | 0 | 0 | −1 | −1 | 0 |
| B26 | 1 | 1 | 1 | 1 | 1 | 0 | −1 | 1 |
| B27 | 1 | 1 | 1 | 1 | 1 | 1 | 0 | 1 |
| B28 | 0 | 0 | 0 | 0 | 0 | −1 | −1 | 0 |
| Paths | PI | PMK | PAK | Satisfaction |
|---|---|---|---|---|
| 5122_5123_5126_5132_5061_4961_4854_4863_4724 | 1.97 | 16.54 | 11.96 | 66.90 |
| 5122_5012_5021_9163_9177_9164_4973_4904_4863_4724 | 1.87 | 23.52 | 13.11 | 54.23 |
| 5122_5123_5126_9162_9163_9177_9164_4973_4904_4863_4724 | 2.14 | 23.52 | 8.95 | 52.40 |
| 5122_5123_5126_5132_5061_4961_4973_4904_4863_4724 | 2.13 | 23.52 | 12.46 | 50.03 |
| 5122_5123_5126_9162_9163_5010_4927_4806_4697_4706_4724 | 2.30 | 30.21 | 15.19 | 41.21 |
5.3. Personalized Path Recommendation Results and Analysis
5.3.1. Differences in Path Selection for Different Types of Travelers
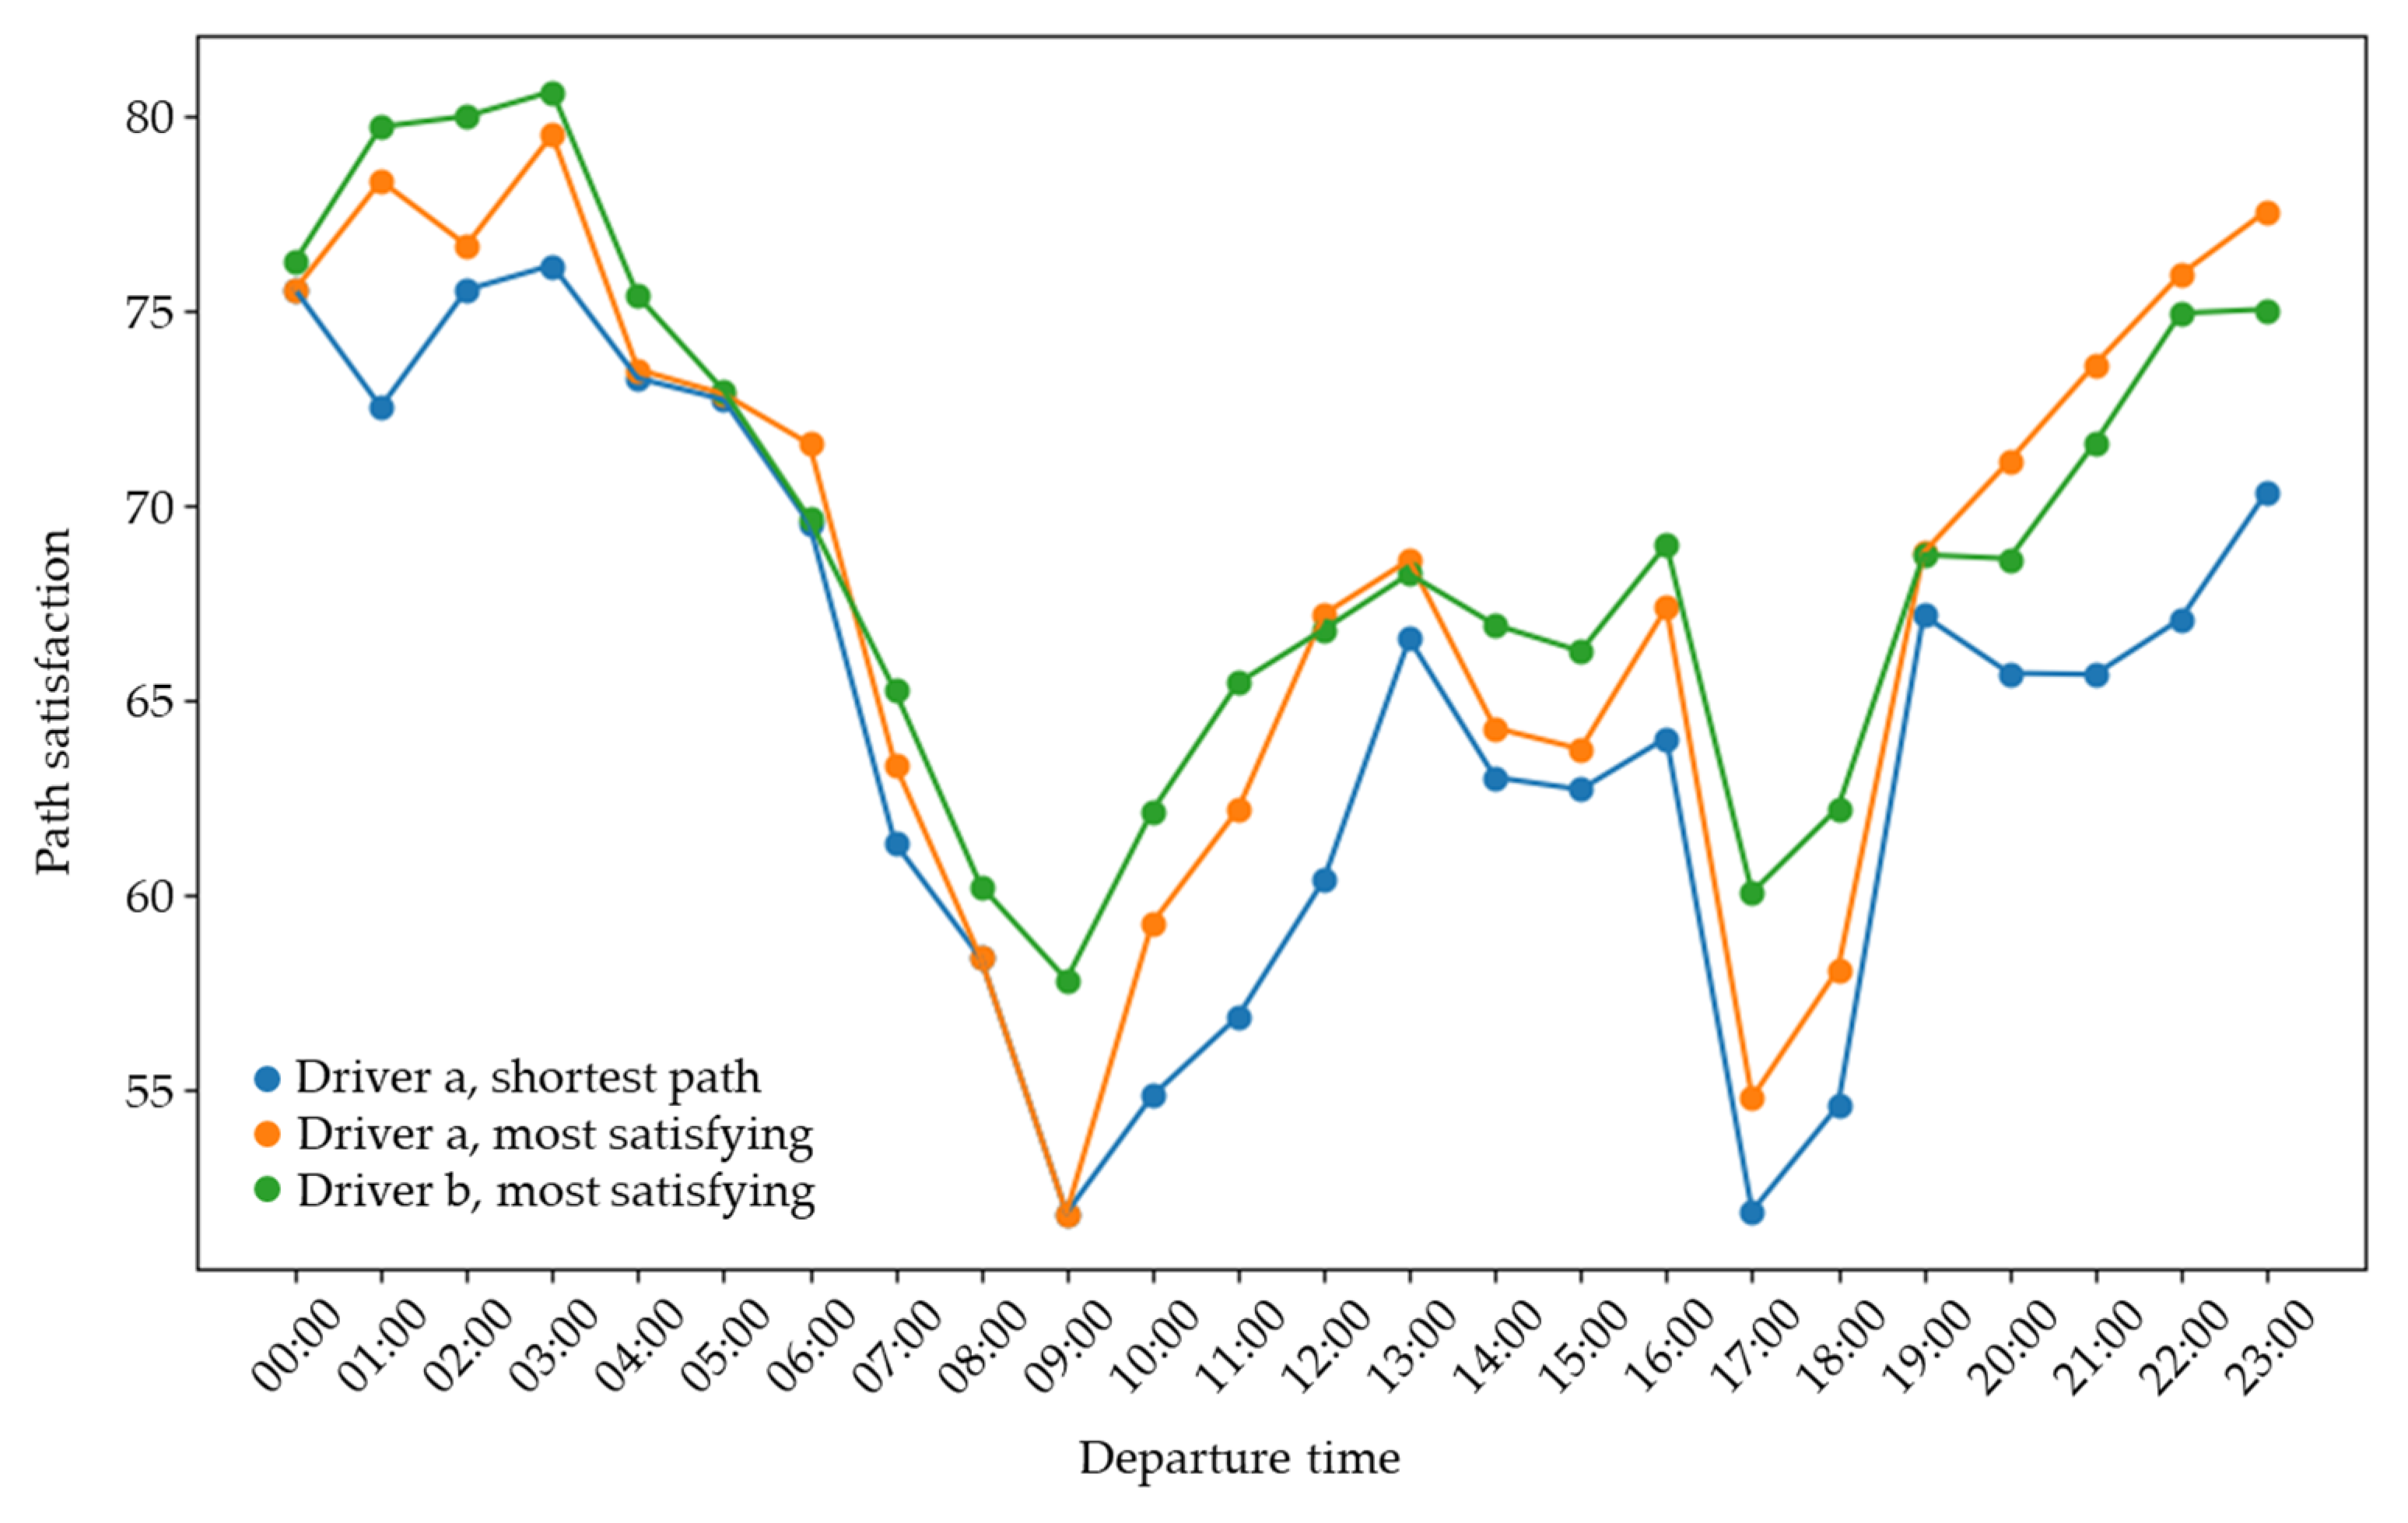
5.3.2. Differences in Path Satisfaction at Different Departure Moments
| Maximum Satisfaction Path | Shortest Length Path | Satisfaction Difference | |||||||
|---|---|---|---|---|---|---|---|---|---|
| Maximum Density | Average Density | Trip Time | Satisfaction | Maximum Density | Average Density | Trip Time | Satisfaction | ||
| 00:00:00 | 3.22 | 1.18 | 463.76 | 75.53 | 3.22 | 1.18 | 463.76 | 75.53 | 0.00% |
| 01:00:00 | 2.68 | 0.88 | 592.11 | 78.32 | 3.98 | 1.95 | 661.24 | 72.51 | 8.01% |
| 02:00:00 | 2.09 | 0.77 | 685.92 | 76.67 | 2.67 | 0.97 | 497.25 | 75.52 | 1.52% |
| 03:00:00 | 1.02 | 0.32 | 532.42 | 79.51 | 2.08 | 0.59 | 284.42 | 76.15 | 4.40% |
| 04:00:00 | 1.64 | 0.91 | 871.10 | 73.47 | 2.66 | 1.49 | 641.79 | 73.25 | 0.30% |
| 05:00:00 | 4.24 | 1.29 | 779.26 | 72.85 | 2.52 | 0.93 | 680.83 | 72.70 | 0.20% |
| 06:00:00 | 8.20 | 3.54 | 862.31 | 71.56 | 8.20 | 5.00 | 717.97 | 69.52 | 2.94% |
| 07:00:00 | 18.10 | 8.39 | 945.95 | 63.33 | 16.54 | 10.20 | 718.94 | 61.31 | 3.30% |
| 08:00:00 | 16.54 | 11.96 | 727.32 | 58.35 | 16.54 | 11.96 | 727.32 | 58.35 | 0.00% |
| 09:00:00 | 21.88 | 13.52 | 755.87 | 51.81 | 21.88 | 13.52 | 755.87 | 51.81 | 0.00% |
| 10:00:00 | 18.92 | 10.79 | 959.73 | 59.25 | 17.97 | 13.12 | 775.78 | 54.82 | 8.09% |
| 11:00:00 | 16.50 | 10.51 | 886.97 | 62.17 | 16.50 | 12.59 | 759.90 | 56.85 | 9.35% |
| 12:00:00 | 14.90 | 7.30 | 887.68 | 67.19 | 14.90 | 11.29 | 728.08 | 60.35 | 11.32% |
| 13:00:00 | 13.54 | 6.03 | 904.93 | 68.58 | 11.29 | 7.34 | 769.79 | 66.56 | 3.04% |
| 14:00:00 | 15.26 | 9.09 | 950.11 | 64.27 | 15.17 | 9.68 | 707.26 | 63.00 | 2.01% |
| 15:00:00 | 16.35 | 9.18 | 915.70 | 63.73 | 16.35 | 9.83 | 678.40 | 62.69 | 1.66% |
| 16:00:00 | 11.50 | 8.54 | 887.95 | 67.36 | 12.94 | 9.85 | 701.07 | 64.01 | 5.22% |
| 17:00:00 | 24.05 | 11.32 | 930.94 | 54.77 | 20.27 | 14.66 | 764.04 | 51.86 | 5.61% |
| 18:00:00 | 20.52 | 10.91 | 941.12 | 58.06 | 18.57 | 13.85 | 721.62 | 54.55 | 6.43% |
| 19:00:00 | 11.28 | 6.51 | 944.51 | 68.77 | 11.28 | 7.23 | 740.56 | 67.16 | 2.40% |
| 20:00:00 | 10.04 | 4.05 | 855.85 | 71.12 | 12.12 | 8.10 | 758.24 | 65.68 | 8.29% |
| 21:00:00 | 12.40 | 3.83 | 676.23 | 73.61 | 12.40 | 8.22 | 747.92 | 65.64 | 12.13% |
| 22:00:00 | 4.71 | 1.72 | 685.59 | 75.92 | 7.39 | 4.28 | 900.27 | 67.06 | 13.20% |
| 23:00:00 | 3.33 | 1.53 | 619.11 | 77.54 | 5.21 | 3.07 | 735.00 | 70.31 | 10.28% |
5.4. Results and Analysis of Mid-Trip Secondary Recommendations
6. Conclusions
- 1.
- Proposed path satisfaction model based on ALPR data
- 2.
- Personalized path recommendation case study
- 1.
- While this study considered changes in traffic conditions due to time variations in making secondary path recommendations, it is worth exploring changes in traffic conditions due to path selections chosen by drivers with multi-agent and reinforcement learning methods.
- 2.
- The individual preferences extracted in this study were based on a fixed OD pair. It is important that whether these preferences can be directly used to all OD pairs, as well as to what extent adjustments are needed to make them applicable to other OD pairs. Further research could determine the conditions under which these preferences can be applied.
Author Contributions
Funding
Institutional Review Board Statement
Informed Consent Statement
Data Availability Statement
Acknowledgments
Conflicts of Interest
References
- National Bureau of Statistics of the People’s Republic of China. China Statistical Yearbook; China Statistics Press: Beijing, China, 2021.
- Guangzhou Municipal Planning and Natural Resources Bureau (Guangzhou Municipal Oceanic Bureau) Home Page. Available online: http://ghzyj.gz.gov.cn/attachment/7/7104/7104800/7756059.pdf (accessed on 24 April 2023).
- The People’s Government of Guangzhou Municipality Home Page. Available online: https://www.gz.gov.cn/attachment/7/7143/7143318/8495357.pdf (accessed on 24 April 2023).
- Huang, L.; Huang, H.; Wang, Y. Resilience Analysis of Traffic Network under Emergencies: A Case Study of Bus Transit Network. Appl. Sci. 2023, 13, 8835. [Google Scholar] [CrossRef]
- Alawad, H.; An, M.; Kaewunruen, S. Utilizing an Adaptive Neuro-Fuzzy Inference System (ANFIS) for Overcrowding Level Risk Assessment in Railway Stations. Appl. Sci. 2020, 10, 5156. [Google Scholar] [CrossRef]
- Ge, Z.; Du, M.; Zhou, J.; Jiang, X.; Shan, X.; Zhao, X. An Assessment Scheme for Road Network Capacity under Demand Uncertainty. Appl. Sci. 2023, 13, 7485. [Google Scholar] [CrossRef]
- Wang, H.; Zhu, J.; Gu, B. Model-Based Deep Reinforcement Learning with Traffic Inference for Traffic Signal Control. Appl. Sci. 2023, 13, 4010. [Google Scholar] [CrossRef]
- Cao, X.H.; Li, X.Y.; Wei, X.G.; Li, S.; Huang, M.X.; Li, D.L. Dynamic Programming of Emergency Evacuation Path Based on Dijkstra-ACO Hybrid Algorithm. J. Electron. Inf. Technol. 2020, 42, 1502–1509. [Google Scholar]
- Li, Z.J.; Zheng, X.Q.; Wang, S.Q.; Yang, X. Application of Improved A* Algorithm for Path Searching in GIS. J. Syst. Simul. 2009, 21, 3116–3119. [Google Scholar]
- Chang, M.M.; Yuan, L.; Ding, Z.M.; Li, L.T. Adaptive Dynamic Path Planning Method Under Traffic Condition Awareness. J. Transp. Syst. Eng. Inf. Technol. 2021, 21, 156–162+247. [Google Scholar]
- Wang, W.W.; Zhao, X.M.; Li, X.G.; Xie, D.F. Empirical Study and Modeling of Variable Message Signs on Route Choice Behavior. J. Transp. Syst. Eng. Inf. Technol. 2013, 3, 60–64. [Google Scholar]
- Chen, P.Z.; Wu, J.H.; Li, N. A Personalized Navigation Path Recommendation Strategy Based on Differential Perceptron Tracking User’s Driving Preference. Comput. Intell. Neurosci. 2023, 2023, 8978398. [Google Scholar] [CrossRef]
- Liu, X.M.; Lu, X.Y.; Sun, Q.X. Traveler’S Behavior of Path Selection Based on Different Preferences. J. Chongqing Jiaotong Univ. (Nat. Sci.) 2017, 36, 102–106. [Google Scholar]
- Simon, H.A. A Behavioral Model of Rational Choice. Q. J. Econ. 1955, 69, 99–118. [Google Scholar] [CrossRef]
- Zhang, W.H.; Yan, P.; Huang, Z.P. Traveler’s Subjective Path Selection Model Considering Road Network Congestion Status. J. Chongqing Jiaotong Univ. (Nat. Sci.) 2019, 38, 90–95. [Google Scholar]
- Ghader, S.; Darzi, A.; Zhang, L. Modeling effects of travel time reliability on mode choice using cumulative prospect theory. Transp. Res. Part C. 2019, 108, 245–254. [Google Scholar] [CrossRef]
- Li, D.W.; Feng, S.Q.; Cao, Q.; Song, Y.C.; Lai, X.J.; Ren, G. Modeling Route Choice Behavior in the Era of Big Data. China J. Highw. Transp. 2021, 34, 161–174. [Google Scholar]
- Humagain, P.; Singleton, P.A. Investigating Travel Time Satisfaction and Actual Versus Ideal Commute Times: A Path Analysis Approach. J. Transp. Health 2020, 16, 100829. [Google Scholar] [CrossRef]
- Liu, K.; Zhou, J.; Bi, X.X.; Zhang, J.T. Impacts of Traffic Information Type Preference on Urban Travelers′ Route Choice. J. Transp. Inf. Saf. 2019, 37, 71–77. [Google Scholar]
- Correa, D.; Ozbay, K. Urban Path Travel Time Estimation Using GPS Trajectories from High-Sampling-Rate Ridesourcing Services. J. Intell. Transp. Syst. 2022, 2022, 1–16. [Google Scholar] [CrossRef]
- Wang, R.; Zhou, M.; Gao, K.; Alabdulwahab, A.; Rawa, M.J. Personalized Route Planning System Based on Driver Preference. Sensors 2022, 22, 11. [Google Scholar] [CrossRef]
- Dai, J.; Yang, B.; Guo, C.J.; Ding, Z.M. Personalized route recommendation using big trajectory data. In Proceedings of the IEEE 31st International Conference on Data Engineering, Seoul, Republic of Korea, 13–17 April 2015; pp. 543–554. [Google Scholar] [CrossRef]
- Yuan, P.C.; Juan, Z.C. Urban road network evolution mechanism based on the ‘direction preferred connection’ and ‘degree constraint’. Phys. A Stat. Mech. Appl. 2013, 20, 5186–5193. [Google Scholar] [CrossRef]
- Tseng, Y.Y.; Knockaert, J.; Verhoef, E.T. A revealed-preference study of behavioural impacts of real-time traffic information. Transp. Res. Part C 2013, 30, 196–209. [Google Scholar] [CrossRef]
- Long, X.Q.; Su, Y.J.; Yu, C.; Wu, D.X. Analyzing Methods of Vehicle’ Travel Using Plate Recognition Data. J. Transp. Syst. Eng. Inf. Technol. 2019, 19, 66–72. [Google Scholar]
- Saaty, T.L. How to Make a Decision: The Analytic Hierarchy Process. Eur. J. Oper. Res. 1990, 48, 9–26. [Google Scholar] [CrossRef]
- Mirzahossein, H.; Sedghi, M.; Habibi, H.M.; Jalali, F. Site selection methodology for emergency centers in Silk Road based on compatibility with Asian Highway network using the AHP and ArcGIS (case study: I. R. Iran). Innov. Infrastruct. Solut. 2020, 5, 113. [Google Scholar] [CrossRef]
- Li, Y.J.; Zhao, Z.Q. A Judgment Vector in Analytic Hierarchy Process. Syst. Eng. 2002, 2022, 83–87. [Google Scholar]
- Jang, S.; Rasouli, S.; Timmermans, H. Tolerance and Indifference Bands in Regret-Rejoice Choice Models: Extension to Market Segmentation in the Context of Mode Choice Behavior. Transp. Res. Rec. 2018, 2672, 23–34. [Google Scholar] [CrossRef]


| Scale | Meaning |
|---|---|
| 1 | thth indicator. |
| 3 | th indicator is slightly more important than the th indicator. |
| 5 | th indicator is strongly more important than the th indicator. |
| 7 | th indicator is very strongly more important than the th indicator. |
| 9 | th indicator is extremely more important than the th indicator. |
| 2,4,6,8 | Intermediate values between the two adjacent scales from those listed above. |
| Reciprocals | th indicator relative to the th indicator, the comparison value of the first indicator is while the comparison value of the second indicator is . |
| Matrix Order | 1 | 2 | 3 | 4 | 5 | 6 | 7 | 8 | 9 | 10 |
|---|---|---|---|---|---|---|---|---|---|---|
| 0 | 0 | 0.58 | 0.90 | 1.12 | 1.24 | 1.32 | 1.41 | 1.45 | 1.49 |
| Target Layer A | Criterion Layer B1 | Criterion Layer B2 |
|---|---|---|
| A path satisfaction | B11 stability of travel time (STT) | B21 path travel time (PTT) |
| B22 path length (PL) | ||
| B25 number of path intersections (PI) | ||
| B12 historical inertia (HI) | B22 path length (PL) | |
| B28 historical path similarity (HPS) | ||
| B13 path difficulty (PD) | B23 number of path lanes (PLN) | |
| B24 path turning index (PTI) | ||
| B25 number of path intersections (PI) | ||
| B27 maximum path density (PMK) | ||
| B14 traffic status (TS) | B26 average path density (PAK) | |
| B27 maximum path density (PMK) |
| Path (Sequence of Nodes) | Number of Travel Tracks |
|---|---|
| 5122_5123_5126_9162_9163_9177_9164_4973_4904_4863_4724 | 766 |
| 5122_5123_5126_5132_5061_4961_4973_4904_4863_4724 | 320 |
| 5122_5123_5082_5021_9163_9177_9164_4973_4904_4863_4724 | 295 |
| 5122_5123_5082_9162_9163_9177_9164_4973_4904_4863_4724 | 292 |
| 5122_5123_5126_5132_5061_4961_4854_4863_4724 | 194 |
| 5122_5012_5021_9163_9177_9164_4973_4904_4863_4724 | 151 |
| 5122_5123_5082_5021_4950_4907_4893_4808_4694_4697_4706_4724 | 147 |
| Paths | Path Length (m) | Number of Path Lanes (Lane/km) | Number of Roadway Intersections (1/km) | Path Steering Factor (1/km) |
|---|---|---|---|---|
| Path 1 | 4811.49 | 3.00 | 2.07 | 2.29 |
| Path 2 | 4084.65 | 1.64 | 2.69 | 3.18 |
| Path 3 | 4665.00 | 2.35 | 2.14 | 2.79 |
| Paths | Path Travel Time (s) | Average Density of Paths (veh/km/Lane) | Maximum Density of Paths (veh/km/Lane) |
|---|---|---|---|
| Path 1 | 772 | 22.32 | 62.65 |
| Path 2 | 766 | 24.95 | 76.75 |
| Path 3 | 674 | 10.31 | 21.37 |
| B11 STT | B12 HI | B13 PD | B14 TS | |
|---|---|---|---|---|
| value | 0 | 1 | 2 | 2 |
| A | B11 STT | B12 HI | B13 PD | B14 TS |
|---|---|---|---|---|
| B11 STT | 0 | −1 | −1 | −1 |
| B12 HI | 1 | 0 | −1 | −1 |
| B13 PD | 1 | 1 | 0 | 0 |
| B14 TS | 1 | 1 | 0 | 0 |
| B21 | B22 | B23 | B24 | B25 | B26 | B27 | B28 | |
|---|---|---|---|---|---|---|---|---|
| Percentile | 10.88 | 18.76 | 35.72 | 53.89 | 17.56 | 16.47 | 16.11 | 60.82 |
| B21 | B22 | B23 | B24 | B25 | B26 | B27 | B28 | |
|---|---|---|---|---|---|---|---|---|
| value | 89.12 | 81.24 | 35.72 | 46.11 | 82.46 | 83.53 | 83.89 | 60.85 |
| B21 | B22 | B23 | B24 | B25 | B26 | B27 | B28 | |
|---|---|---|---|---|---|---|---|---|
| value | 89.12 | 81.24 | 0 | 0 | 82.46 | 0 | 0 | 0 |
| B11 | B21 | B22 | B23 | B24 | B25 | B26 | B27 | B28 |
|---|---|---|---|---|---|---|---|---|
| B21 | 0 | 1 | 1 | 1 | 1 | 1 | 1 | 1 |
| B22 | −1 | 0 | 1 | 1 | −1 | 1 | 1 | 1 |
| B23 | −1 | −1 | 0 | 0 | −1 | 0 | 0 | 0 |
| B24 | −1 | −1 | 0 | 0 | −1 | 0 | 0 | 0 |
| B25 | −1 | 1 | 1 | 1 | 0 | 1 | 1 | 1 |
| B26 | −1 | −1 | 0 | 0 | −1 | 0 | 0 | 0 |
| B27 | −1 | −1 | 0 | 0 | −1 | 0 | 0 | 0 |
| B28 | −1 | −1 | 0 | 0 | −1 | 0 | 0 | 0 |
| B21 | B22 | B23 | B24 | B25 | B26 | B27 | B28 | |
|---|---|---|---|---|---|---|---|---|
| value | 0 | 81.24 | 0 | 0 | 0 | 0 | 0 | 60.85 |
| B21 | B22 | B23 | B24 | B25 | B26 | B27 | B28 | |
|---|---|---|---|---|---|---|---|---|
| value | 0 | 0 | 35.72 | 46.11 | 82.46 | 0 | 83.89 | 0 |
| B21 | B22 | B23 | B24 | B25 | B26 | B27 | B28 | |
|---|---|---|---|---|---|---|---|---|
| value | 0 | 0 | 0 | 0 | 0 | 83.53 | 83.89 | 0 |
| B12 | B21 | B22 | B23 | B24 | B25 | B26 | B27 | B28 |
|---|---|---|---|---|---|---|---|---|
| B21 | 0 | −1 | 0 | 0 | 0 | 0 | 0 | −1 |
| B22 | 1 | 0 | 1 | 1 | 1 | 1 | 1 | 1 |
| B23 | 0 | −1 | 0 | 0 | 0 | 0 | 0 | −1 |
| B24 | 0 | −1 | 0 | 0 | 0 | 0 | 0 | −1 |
| B25 | 0 | −1 | 0 | 0 | 0 | 0 | 0 | −1 |
| B26 | 0 | −1 | 0 | 0 | 0 | 0 | 0 | −1 |
| B27 | 0 | −1 | 0 | 0 | 0 | 0 | 0 | −1 |
| B28 | 1 | −1 | 1 | 1 | 1 | 1 | 1 | 0 |
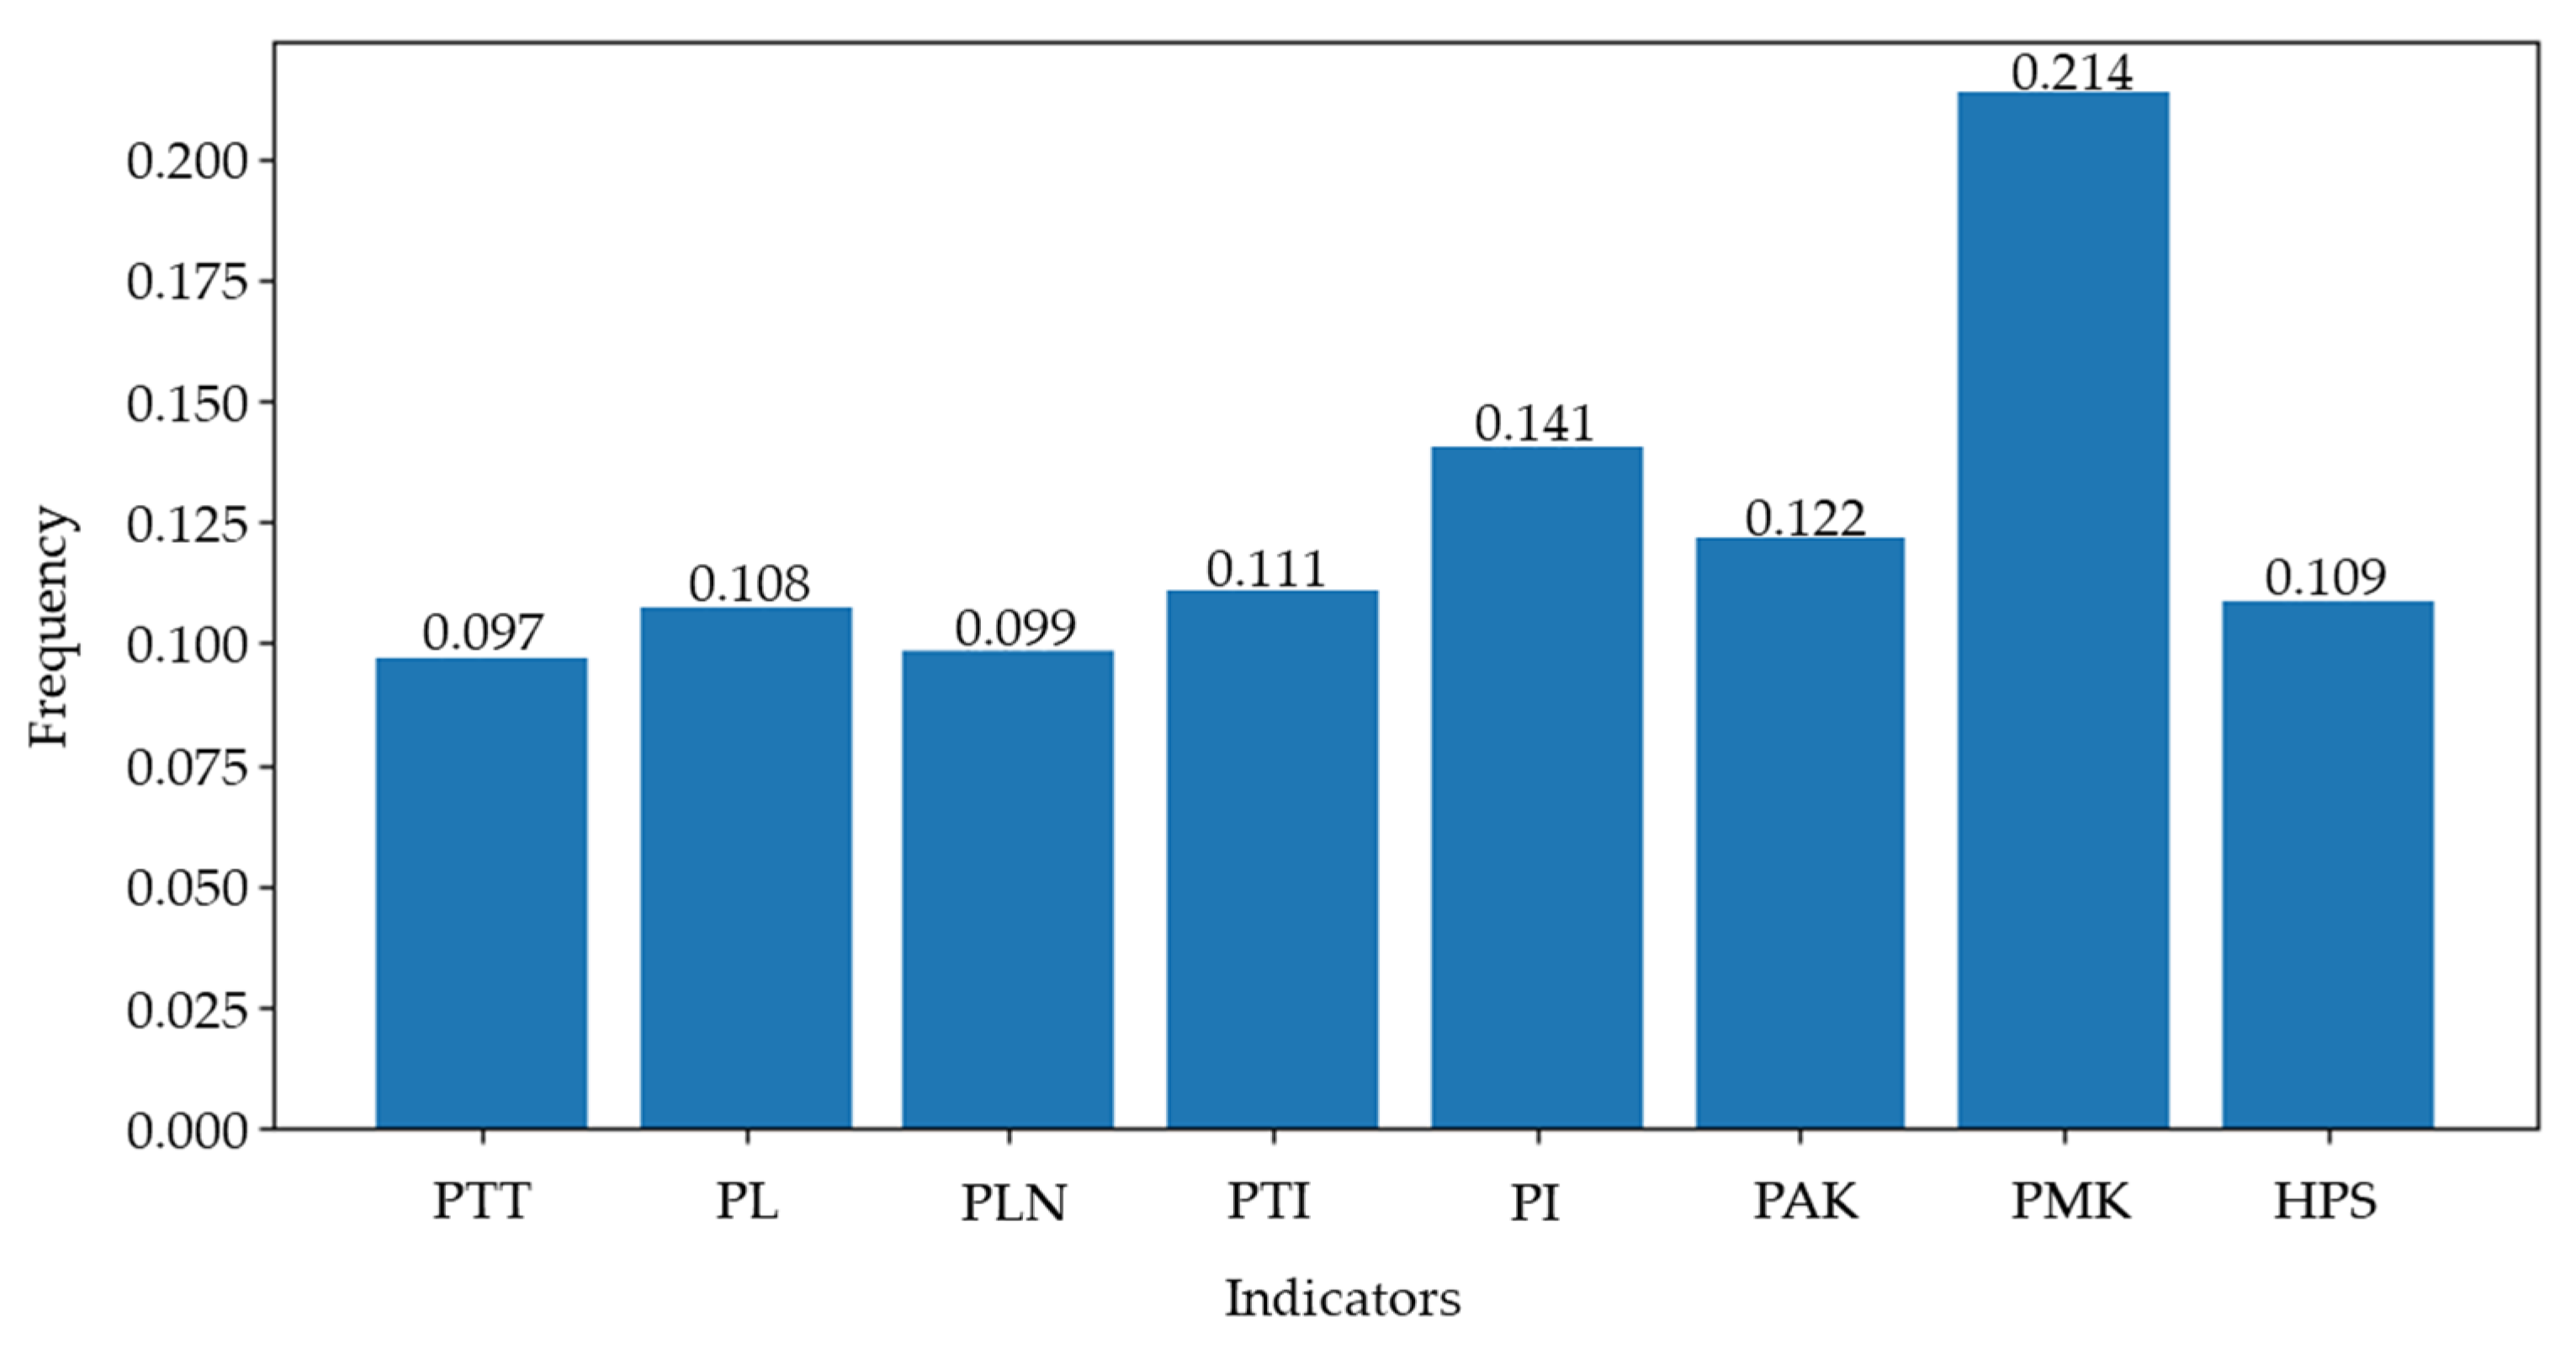
| Criterion Layer B1 | B21 | B22 | B23 | B24 | Weight of Criterion Layer B2 to Target Layer A | |
|---|---|---|---|---|---|---|
| 0.104 | 0.171 | 0.362 | 0.362 | |||
| Criterion layer B2 | B21 | 0.262 | 0.087 | 0.065 | 0.087 | 0.097 |
| B22 | 0.158 | 0.268 | 0.065 | 0.087 | 0.108 | |
| B23 | 0.075 | 0.087 | 0.122 | 0.087 | 0.099 | |
| B24 | 0.075 | 0.087 | 0.157 | 0.087 | 0.111 | |
| B25 | 0.204 | 0.087 | 0.201 | 0.087 | 0.141 | |
| B26 | 0.075 | 0.087 | 0.065 | 0.209 | 0.122 | |
| B27 | 0.075 | 0.087 | 0.258 | 0.268 | 0.214 | |
| B28 | 0.075 | 0.209 | 0.065 | 0.087 | 0.109 | |
| Path 1 | Actual Value | Percentile | Value |
|---|---|---|---|
| B21 PTT | 1009 s | 80.07 | 19.93 |
| B22 PL | 4666 m | 57.68 | 42.32 |
| B23 PLN | 2.35 lane/km | 81.90 | 81.90 |
| B24 PTI | 2.79 /km | 16.02 | 83.98 |
| B25 PI | 2.14 /km | 35.97 | 64.03 |
| B26 PAK | 8.95 veh/km/lane | 29.06 | 70.94 |
| B27 PMK | 23.52 veh/km/lane | 51.35 | 48.64 |
| B28 HPS | 31.98% | 0.12 | 0.12 |
| Drivers | a | b | c | d |
|---|---|---|---|---|
| B21 path travel time | 0.099 | 0.114 | 0.166 | 0.125 |
| B22 path length | 0.123 | 0.154 | 0.178 | 0.130 |
| B23 number of path lanes | 0.096 | 0.115 | 0.085 | 0.113 |
| B24 path steering coefficient | 0.105 | 0.097 | 0.089 | 0.127 |
| B25 number of path intersections | 0.126 | 0.128 | 0.132 | 0.125 |
| B26 path average density | 0.162 | 0.113 | 0.119 | 0.124 |
| B27 path maximum density | 0.189 | 0.112 | 0.126 | 0.132 |
| B28 historical path similarity | 0.100 | 0.167 | 0.106 | 0.124 |
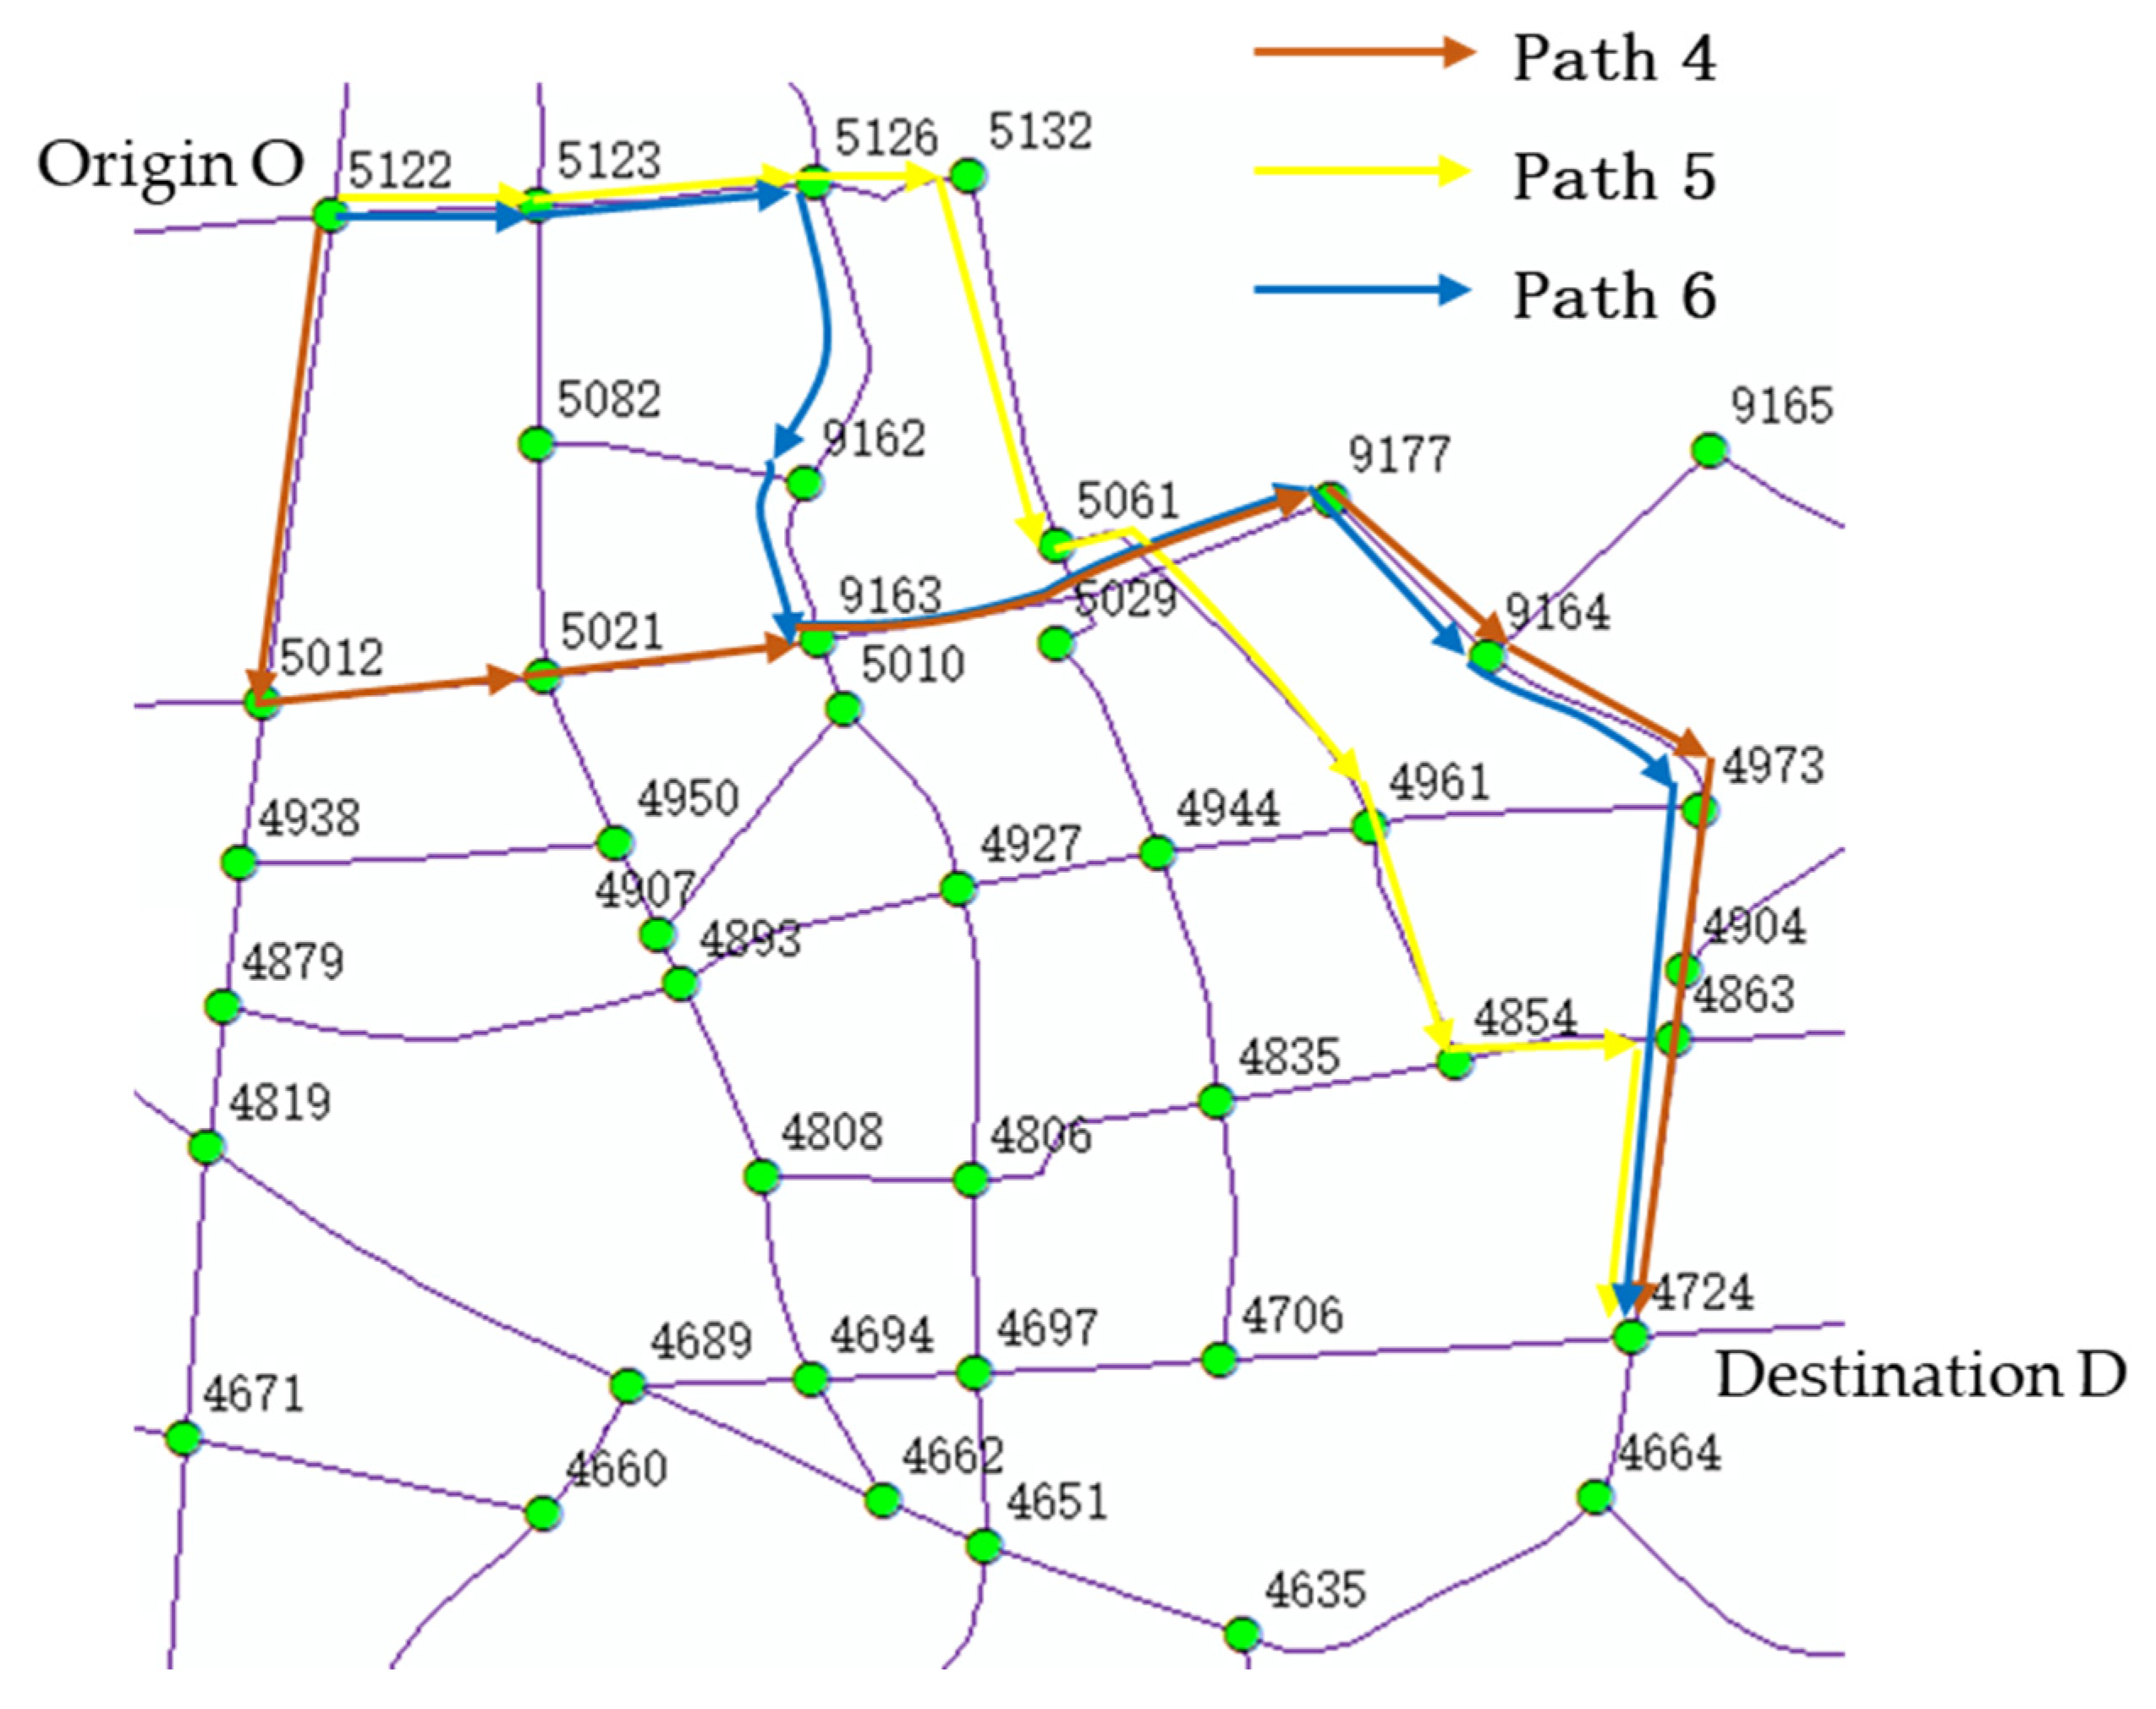
| Path 4 (Brown) | Path 5 (Yellow) | Path 6 (Blue) | ||||
|---|---|---|---|---|---|---|
| Actual Value | Importance Rating | Actual Value | Importance Rating | Actual Value | Importance Rating | |
| B21 path travel time | 999.07 | 20.58 | 722.58 | 57.70 | 962.47 | 23.75 |
| B22 path length | 4810.21 | 29.74 | 4067.39 | 97.81 | 4666.00 | 42.32 |
| B23 number of path lanes | 2.72 | 96.03 | 1.67 | 14.87 | 2.35 | 81.90 |
| B24 path steering coefficient | 2.29 | 96.80 | 3.20 | 58.79 | 2.79 | 83.98 |
| B25 number of path intersections | 1.87 | 97.82 | 1.97 | 92.70 | 2.14 | 64.03 |
| B26 path average density | 14.81 | 22.56 | 15.08 | 21.22 | 9.82 | 62.99 |
| B27 path maximum density | 21.39 | 57.29 | 17.71 | 71.88 | 17.71 | 71.88 |
| B28 historical path similarity | 61.53 | 6.86 | 21.15 | 13.04 | 18.28 | 0.00 |
| Satisfaction | d | b | c | a | ||
| 53.00 | 51.33 | 58.64 | 56.07 | |||
| Driver | Original Plan | Actual | Secondary Recommendation | Change in Satisfaction | ||||||
|---|---|---|---|---|---|---|---|---|---|---|
| Path | Time | Satisfaction | Path | Time | Satisfaction | Path | Time | Satisfaction | ||
| e | 7 | 7:43 | 33.13 | 7 | 7:43 | 33.13 | 8 | 7:43 | 47.10 | +42.17% |
| f | 9 | 8:00 | 41.02 | 9 | 7:58 | 42.73 | 8 | 7:58 | 43.71 | +2.29% |
| g | 10 | 7:26 | 50.39 | 10 | 7:24 | 48.73 | 8 | 7:24 | 52.06 | +6.83% |
Disclaimer/Publisher’s Note: The statements, opinions and data contained in all publications are solely those of the individual author(s) and contributor(s) and not of MDPI and/or the editor(s). MDPI and/or the editor(s) disclaim responsibility for any injury to people or property resulting from any ideas, methods, instructions or products referred to in the content. |
© 2023 by the authors. Licensee MDPI, Basel, Switzerland. This article is an open access article distributed under the terms and conditions of the Creative Commons Attribution (CC BY) license (https://creativecommons.org/licenses/by/4.0/).
Share and Cite
Li, Y.; Huang, M. A Path Recommendation Method Considering Individual Driving Preferences. Appl. Sci. 2023, 13, 9271. https://doi.org/10.3390/app13169271
Li Y, Huang M. A Path Recommendation Method Considering Individual Driving Preferences. Applied Sciences. 2023; 13(16):9271. https://doi.org/10.3390/app13169271
Chicago/Turabian StyleLi, Yetao, and Min Huang. 2023. "A Path Recommendation Method Considering Individual Driving Preferences" Applied Sciences 13, no. 16: 9271. https://doi.org/10.3390/app13169271
APA StyleLi, Y., & Huang, M. (2023). A Path Recommendation Method Considering Individual Driving Preferences. Applied Sciences, 13(16), 9271. https://doi.org/10.3390/app13169271