Abstract
With the convergence of the Internet of Things, 5G, and artificial intelligence, limited network bandwidth and bursts of incoming service requests seem to be the most important factors affecting user experience. Therefore, caching technology was introduced. In this paper, a caching placement optimization strategy based on comprehensive utility (CPOSCU) in edge computing is proposed. Firstly, the strategy involves quantifying the placement factors of data blocks, which include the popularity of data blocks, the remaining validity ratio of data blocks, and the substitution rate of servers. By analyzing the characteristics of cache objects and servers, these placement factors are modeled to determine the cache value of data blocks. Then, the optimization problem for cache placement is quantified comprehensively based on the cache value of data blocks, data block retrieval costs, data block placement costs, and replacement costs. Finally, to break out of the partial optimal solution for cache placement, a penalty strategy is introduced, and an improved tabu search algorithm is used to find the best edge server placement for cached objects. Experimental results demonstrate that the proposed caching strategy enhances the cache service rate, reduces user request latency and system overhead, and enhances the user experience.
1. Introduction
The widespread adoption of advanced mobile applications with high bandwidth requirements has led to a significant increase in mobile wireless network traffic in recent years. As per the projected number of 5G mobile subscriptions worldwide from 2019 to 2026 [1], it is expected that the number of 5G subscriptions will continue to grow steadily, reaching 5 billion subscriptions by 2026. This growth is predicted to include a rise of 700 million subscriptions between 2022 and 2023, followed by an additional 900 million between 2023 and 2024. Especially on backhaul links, this explosive data growth will put a huge burden on current cellular networks [2] and the traditional core network architecture cannot accommodate the rapidly growing user demand. However, the introduction of edge computing has been introduced as a promising solution. Edge computing is gaining increasing attention from industry and academia, by deploying edge servers at base stations or access points near mobile users [3], which alleviates network traffic, reduces user request latency, and decreases energy consumption. Edge computing is now widely used in various applications, including face recognition [4], the Internet of Things (IoT) [5], autonomous driving [6], smart cities [7], and smart healthcare [8].
Edge caching is one of the prominent technologies that provide computing and communication capabilities and network caching capabilities [9]. Caching input files for required computations in advance or caching the computation results of certain frequently requested computation tasks, not only relieves the pressure on the core network but also avoids network congestion caused by the repeated transmission of the same content, thus achieving the goal of the high-speed rate transmission of content. However, the current edge caching strategy seldom considers the characteristics of cache objects and servers, resulting in low cache space utilization and the frequent replacement of data blocks, which generates high system overhead and affects the advantages of edge computing. The main challenges faced by edge caching are the selection and placement of cached content. Developing an effective caching strategy to cache high-value content on inappropriate servers to improve overall performance is an important research topic. Therefore, a caching strategy is proposed to improve the utilization of cache space, reduce system overhead, and improve user experience by considering the characteristics of cache objects and servers for the placing of data blocks to be cached in a suitable cache cluster. The main contributions are as follows:
- A cache value model of data blocks is built by quantifying placement factors including data block popularity, remaining validity ratio of data blocks, and server replacement rate; a comprehensive-utility-based cache placement model is constructed based on data block cache value, data block acquisition overhead, and data block placement cost and replacement cost.
- To avoid trapping in a partial optimum, a disciplinary strategy is introduced in tabu search, and a comprehensive-utility-based cache placement optimization policy is proposed for the edge computing environment; an optimized placement of cached data blocks is achieved through an improved tabu search algorithm in this approach.
- The performance of the proposed algorithm is verified in three ways: data response time, cache service rate, and the number of permutations, by comparing the CPOSCU algorithm with LOCAL, GPA, and NVCP algorithms.
The paper is structured as follows. Section 2 provides an overview of related work. Section 3 outlines the two proposed models, including the data block cache value model and the data block placement model, and then formulates the optimal placement problem as the composite optimization problem. In Section 4, the proposed algorithm is validated through extensive experiments and analysis. Section 5 shows the design and implementation of a caching-placement-optimization-strategy-based comprehensive utility in edge computing. Section 6 summarizes the work and prospects of this paper.
2. Related Work
The caching placement strategy is an important issue in edge computing research and a key factor in improving caching performance. An increasing number of researchers are considering studying caching placement in the context of edge computing.
To address the challenge of data placement caused by user mobility, reference [10] proposed a mobility-aware caching strategy by considering the randomness of user mobility. This strategy aims to find the optimal location for the requested content to minimize the average load on the base station. Reference [11] presented a popularity-based cache placement strategy by considering the connection quality of the network, the demand for content, and user activity, which divides the requested data blocks into three popularity levels and strategically caches the content into fog nodes with different activity levels to reduce energy consumption. Reference [12] studied a genetic algorithm-based cooperative cache placement strategy for contact duration-aware mobile edge networks by analyzing the impact of user mobility and contact duration on cache placement in mobile edge networks. Reference [13] investigated how to perform caching placement on SBS and mobile devices using user mobility to maximize the cache hit rate, which is described as a mixed integer nonlinear programming (MINLP) problem, and they solved the problem using greedy algorithms.
Designing placement strategies based on user needs is currently an urgent issue to be addressed. Reference [14] proposed an intelligent caching scheme that considers not only the location of user requests but also categorizes them according to different caching policies to solve the caching problem of content-centric network (CCN) routers. Reference [15] determined the cached content on each network node based on the relative popularity of the content and proposed a greedy-algorithm-based content placement strategy to maximize the overall network hit rate. Reference [16] studied task caching in multi-user and multi-server mobile edge computing systems. By calculating the size and popularity of tasks and considering the actual distribution of users and task requests, a task was cached on multiple MEC servers to improve the hit rate of popular tasks. To cache content demanded by users on the nearest IoT device, reference [17] used a recurrent neural network method to predict the user location. They used an FP-growth algorithm to forecast the location of each IoT device and the interests of users, which precaches the interested content to reduce access latency and improve caching efficiency and user experience.
Aiming at the limitations of non-cooperative strategies for data block placement, reference [18] proposed a cooperative edge caching scheme by considering the location and prevalence of vehicle request content to minimize transmission latency and service cost. Reference [19] presented a dynamic collaborative caching strategy for latency-sensitive applications in an edge computing environment, which reduces redundant forwarding and improves the hit ratio of the entire network by considering the popularity of the content at the edge nodes and the caching capacity of the nodes, and placing popular content on the core nodes. Reference [20] suggested a CE-D2D collaboration framework that fuses edge networks and device-to-device clusters. In this framework, different mobile users and MEC servers collaborate to store different blocks of a video to optimize the use of storage resources and transmission resources. Reference [21] offered a caching scheme that considers the trade-off between cache diversity and redundancy, which achieves an optimal redundancy ratio for the content of each base station placement through collaboration between placements in the radio access network. Reference [22] denoted a capacity-aware edge caching strategy by considering the limited fog cache capacity and the connectivity capability of the base station, which employs an alternating direction multiplier method (ADMM)-based algorithm to efficiently search for the best cache content placement at each fog node.
Although the above caching strategies enhance the cache hit rate and degrade the transfer latency to a certain extent, most cache placement strategies give less consideration to the characteristics of cache objects and servers in a comprehensive analysis. To optimize the cache placement problem and address the issue of underutilized cache space and the frequent replacement of cache data, a comprehensive-utility-based cache placement optimization strategy is proposed in this paper, which analyzes the characteristics of cache data objects and servers, and this strategy is integrated into the CPOSCU algorithm. The Mobile edge caching strategies are summarized and categorized in Table 1.

Table 1.
Summary and classification of mobile edge caching strategies.
3. The Comprehensive-Utility-Based Cache Placement Model in the Edge Computing Environment
The following outlines the step-by-step process of the integrated utility-based cache placement strategy within an edge computing environment. Firstly, the cloud data center collects information about data blocks and edge servers, where the information about data blocks mainly includes access frequency, access time, and data modification time, while the information about edge servers mainly includes the cache space size, used space, replacement times, and usage load information. The cloud server calculates the cache value, placement cost, replacement cost, and acquisition cost of the data block placed on the edge server based on the collected information and obtains the combined utility value. Finally, using an improved tabu search algorithm, the proposed caching strategy aims to find the optimal placement position for data blocks. And the comprehensive-utility-based cache placement model in edge computing environment is shown in Figure 1. The main parameters involved in this paper are listed in Table 2.
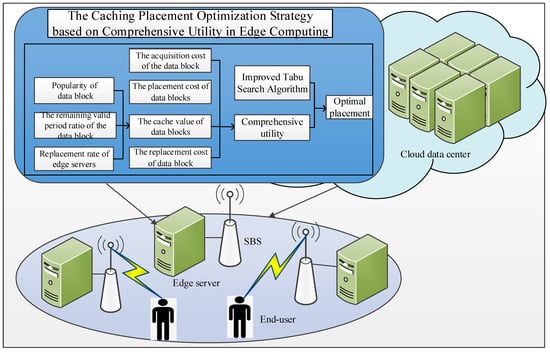
Figure 1.
The architecture of the cache placement strategy.
Table 2.
Summary of the main parameters.
3.1. The Cache Value of the Data Block
To enhance the cache hit ratio and ensure the efficient long-term service provision of cached data blocks in edge computing, this paper considers the cache value of the data blocks when determining their storage. Factors including data block popularity, remaining validity period, and server replacement rate are quantified to determine the cache value.
First, assume that the set of data blocks to be cached consists of , where indicates the -th data block and is the quantity of the cached data block. Then, set the cached data blocks to the same size and denote them as . The servers are represented by the set , where denotes the -th edge server and represents the number of edge servers. The proposed strategy involves selecting and storing data blocks from the cloud data center in the most suitable edge servers according to the optimal placement model.
3.1.1. The Popularity of the Data Block
The popularization of the data block is determined by various factors, including its access frequency, the average time interval, and the recency of access. Access frequency means the proportion of the total number of users accessing the data block in the entire set of data blocks. Therefore, the access frequency for the data block can be modeled in Equation (1).
In Equation (1), is the number of times when the block is being accessed. is the time of the first access and is the currently accessed time. The average time interval, , represents the average time between two consecutive accesses, which can be expressed in Equation (2).
In Equation (2), denotes the time when the data block was last accessed, indicates the time when the data block was first accessed. The size of the average access interval represents the prevalence of the data block.
The recency of access represents the time interval between the current access time and the last access time of the data block, which can be expressed as:
Therefore, combining Equations (1)–(3), the cached data block population is shown in Equation (4).
3.1.2. The Percentage of Remaining Validity of Data Blocks
The remaining validity ratio of the data blocks represents the length from the current time to the expiration time as a percentage of the stored time to the expiration time. It is a measure of how long a cached data block resides in memory to function. The remaining validity ratio of a data block can be expressed as follows:
In Equation (5), indicates the percentage of remaining validity of the cached data block, denotes the expiration time, and represents the storage time.
3.1.3. Edge Server Replacement Rate
The storage capacity of edge servers is finite, which means that new content cannot be cached when the capacity is insufficient, and some unwanted content will be evicted, resulting in a certain replacement overhead. Therefore, the server replacement rate depends on the replaced data block size and the available storage space on the edge server, which can be modeled as:
In Equation (6), indicates the replacement rate of the server , denotes the number of cache replacements performed by the server , represents the data block size that the server replaces for the first time, and shows the storage capacity of the edge server .
3.1.4. The Cache Value of the Data Block
Taking into account the popularity, remaining valid period, and server replacement rate of data blocks, the caching value can be represented by Formula (7).
A binary variable is defined, which expresses whether data blocks are to be placed on the edge server. The formula is calculated as shown in Equation (8).
Thus, the total cache value of caching the entire data block on the edge server can be obtained from Equation (9):
3.2. The Cache Placement Overhead for Data Blocks
3.2.1. The Acquisition Cost of Data Blocks
The distance and bandwidth between the edge server and the physical location of the data blocks to be cached are the main factors that determine the cost of acquiring data blocks. If the network distance is small or the bandwidth is large, the acquisition cost of data blocks can be reduced. The acquisition cost can be mathematically represented as:
In Equation (10), shows the data block size, while , , and , respectively, denote the network distance, network bandwidth, and transmission overhead from the edge server to the physical location to be cached.
The transmission overhead of caching the set of data blocks can be represented as:
3.2.2. The Placement Cost of Data Blocks
To place the data blocks, placement cost is an important factor that should be considered. Placement cost depends on several factors, including placement time, the bandwidth associated with the transmission of the data block from the edge server to the user, and the load on the edge server’s resources, where the hit rate of the cached data blocks on the server can be expressed as:
In Equation (12), illustrates the total amount of times from the edge server and represents the number of times that the request for a data block was fulfilled by the user.
The requested rate of users requesting data blocks from the edge server can be expressed as:
In Equation (13), represents the frequency of users accessing the data block and denotes the total amount of requests for that data block from the server by the user. The bandwidth cost by edge servers transmitting data to users can be represented as:
In Equation (14), shows the bandwidth cost of transmitting 1 bit of data over the unit distance. represents the average distance from the users to the edge servers and expresses the placement scheme of data blocks.
To alleviate the load on the edge server, the resource utilization load is taken into account. indicates the load on resource utilization caused by placing a data block on the edge server, that is, the memory and CPU usage load during the cache storage. Thus, the resource utilization load of placing the set of data blocks being cached can be expressed in Equation (15).
The placing of data blocks on the edge server is based on their physical location about the caching server; thus, the placement time cost of placing the set of data blocks being cached can be shown as:
In Equation (17), are non-negative weights for the bandwidth, the placement time, and server resource utilization load, respectively, .
Then, the placement cost can be shown as:
3.2.3. The Replacement Cost of Data Blocks
During cache placement, the replacement cost of cached data blocks is affected by the amount of storage space available on the edge server and the number of data blocks cached on that server. If the available cache capacity on the server is insufficient to store a new data block, a replacement cost is incurred, which is equivalent to the transfer cost of the evicted block. Consequently, there is a replacement cost of storing from a physical location to an edge server .
In Equation (19), represents the amount of cache space available to the server , indicates the number of cache replacements performed by the edge server , and expresses the overhead of fetching the data block from a physical location to an edge server .
The replacement overhead resulting from caching the entire set of data blocks to be cached can be represented as:
3.2.4. Comprehensive Utility
To determine the placement of data blocks, a comprehensive analysis of objective factors such as the caching value, transfer cost, placement cost, and server replacement cost is taken into consideration. Thus, the formula for comprehensive-utility-based cache placement is shown in Equation (21).
3.3. The Comprehensive-Utility-Based Caching Placement Model
To optimize the overall performance of data block placement, the placement decision is made by considering the retrieval cost, placement cost, and replacement cost. The placement problem is formulated as:
In Equation (22), constraint () indicates whether a data block is stored on a specific edge server , where represents the cloud data center. Constraint () allows the data block to be stored on multiple servers. Constraint () indicates that all data blocks can be stored on an edge server, depending on the available storage space. Thus, the task of determining the optimal placement of data blocks can be expressed as a 0–1 multiple-choice knapsack problem, which is known to be NP-hard. At present, the traditional methods for solving the knapsack problem are the dynamic programming method and the branch-and-bound method. But these methods do not apply to the large-scale knapsack problem, and the main methods for solving the large-scale knapsack problem include the particle swarm optimization algorithm and the tabu search algorithm. Since the tabu search algorithm is efficient for solving combinatorial optimization problems, although it can easily fall into local optimality, this paper uses an improved tabu search algorithm to solve the cache placement problem and obtain an approximate optimal solution.
4. The Cache Placement Optimization Algorithm Based on Improved Tabu Search in Edge Computing
To solve the comprehensive-utility-based cache placement problem, the initial allocation scheme of data blocks was first obtained with the replacement-rate-based cache placement strategy. Subsequently, an optimization approach for cache placement based on an improved tabu search algorithm was implemented to further refine the initial solution.
4.1. The Cache Placement Strategy Based on the Replacement Rate to Find the Initial Solution of the Placement
The initial cache placement solution was determined using a strategy based on the replacement rate. The specific solution procedure is as follows:
- The set of data blocks for caching is and the collection of edge servers is .
- The data block value is calculated and then sequenced, ; the server replacement rate is calculated and arranged in the composition .
- Each data block is accessed sequentially, starting with the data block where no server is placed, and representing this set as: .
- The span of a data block is determined by considering its current prevalence and the remaining validity ratio, which is expressed as follows:
- The span of the data block obtained in step 4 is used to calculate the server replacement rate for that data block placement, which can be shown as:
- The resulting server replacement rate is compared to the replacement rate set to place the data blocks into the appropriate servers.
The correspondence can be defined as . Among them, denotes the data block to be cached and represents the corresponding server where the data block is placed.
4.2. Implementation of Cache Placement Algorithm Based on Improved Tabu Search
After obtaining the initial solution for cache placement using the displacement-based caching strategy, the initial cache placement solution was optimized using the improved tabu search algorithm regarding the objective function and initial solution presented in Equation (22). In the process of solving the cache placement of data objects, the original tabu search algorithm’s short-sighted criterion cannot guarantee that it will always jump out of the local optimal solution during the search. Therefore, a disciplinary strategy was introduced, mainly to record the number of times the tabu objects in the modified were modified. If the initial value is 0 when a tabu object enters the tabu List, adds 1, and if the set is not updated consecutive times, i.e., , the disciplinary strategy will be activated.
4.2.1. A Disciplinary Strategy Is Introduced
The server random component function is defined as: , where is the index amount of the current minimum server, is the random penalty constant, and is the record count threshold. The increasing server component function will affect the selection of the server with the minimum placement cost , causing the index volume to be shifted. The corresponding server is selected instead based on the latest , ultimately guiding the search for the local optimum.
4.2.2. The Cache Placement Algorithm Based on Improved Tabu Search
Given the cache placement obtained through the replacement rate, the objective function, and the disciplinary strategy, an improved tabu-search-based cache placement algorithm is proposed. The specific solution steps are as follows:
- Initialization setting.
Define the tabu array , and the initial value of each element in the array is 1, which identifies the data block that can be swapped. Set the server random component function , and initialize the record count threshold , random discipline constants , and record count .
- 2.
- Server selection.
According to formulas (10), (18), and (20), the placement cost of placing a data block in a server can be expressed as . Define and as the servers with the highest and lowest placement cost.
Determine whether the number of records reaches the record count threshold . If so, the disciplinary strategy is triggered and the minimum cost of an edge server is reselected according to the server random component function , i.e., .
- 3.
- Data block swapping.
Select the data block that can be swapped on the server , and set the tabu value . If all the data blocks on the server are marked as non-swapping, the data block allocation is completed and the algorithm ends; otherwise, define as the task allocated to the server and calculate the data block swapping function in Formula (28). and denote the combined utility function in the non-swapping and swapping states.
If the data block swapping function exists, then swap the values . This means that for the interchange of and values, the tabu value ; otherwise, set the record count as .
4.3. The Flow Chart of the Cache Placement Algorithm Based on Improved Tabu Search
Firstly, the initial solution for cache placement is found, according to the replacement-rate-based cache placement strategy, to complete the initial allocation of the data blocks to be cached. Secondly, to escape from local optimal solutions, a disciplinary strategy based on the tabu search algorithm is introduced, and the tabu list and the frequency record are initialized, while obtaining the server with the maximum and minimum costs. Thirdly, it must be checked if the frequency record exceeds the threshold value. If it does, the disciplinary strategy is started and a server is randomly selected based on the server random selection function. Finally, the existence of a data block that can be exchanged is determined so that the exchange function is higher than 0. If the data block exists, it will be exchanged; otherwise, the number of records will be incremented by 1. The process flowchart of the cache placement algorithm based on improved tabu search is shown in Figure 2.
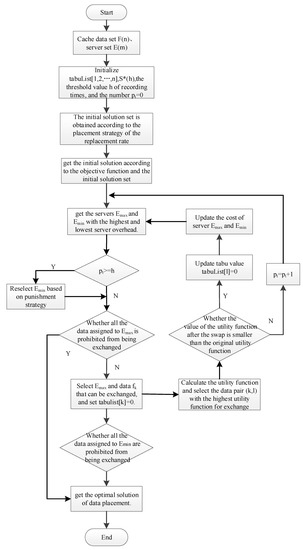
Figure 2.
Improved Tabu-Search-Based Cache Placement Algorithm Flow.
4.4. The Pseudo-Code for the Cache Placement Algorithm Based on the Improved Tabu Search
The pseudo-code for the cache placement algorithm based on the improved tabu search is shown in Algorithm 1.
| Algorithm 1: The cache placement optimization algorithm based on improved tabu search |
| Input: the set of data blocks to be cached ; the set of servers . Output: the optimal solution for cache data placement; |
| 1. Initialization: set ; ; |
| 2. for each do |
| 3. Calculate the popular level of the data block |
| 4. Calculate the value of the remaining valid period ratio of each data block |
| 5. the data block value is saved in // |
| 6. end for each |
| 7. for each do |
| 8. Calculate the replacement rate for each server |
| 9. keep the value to the set |
| 10. end for each |
| 11. for each do |
| 12. Calculate the span of the data block // According to Formula (23) |
| 13. Calculate the replacement rate // According to Formula (24) |
| 14. for each do |
| 15. if |
| 16. keep in the solution set . |
| 17. end for each |
| 18. end for each |
| 19. Calculate the value of the comprehensive utility // According to Formula (19) |
| 20. Calculate and // According to Formulas (20) and (21) |
| 21. while the data blocks in and are not forbidden do |
| 22. Calculate and ; |
| 23. if then |
| 24. Using the disciplinary strategy choose |
| 25. end if |
| 26. find and assigned to ; |
| 27. set ; |
| 28. for to and , set do |
| 29. if assigns to and then |
| 30. Calculate and ; |
| 31. if and then |
| 32. set ; |
| 33. end if |
| 34. end if |
| 35. end for |
| 36. if then // Calculate according to Formula (28) |
| 37. set ; |
| 38. |
| 39. |
| 40. else |
| 41. |
| 42. end if |
| 43. end while |
| 44. get the optimal solution . |
In the optimization of the cache placement algorithm using improved tabu search, set the number of data blocks for cache placement to be , and the number of servers to be . Typically, the cache placement benchmark is satisfied . The time complexity of the algorithm in this paper mainly consists of two parts:
- The time complexity of obtaining the initial solution using the permutation-rate-based cache placement strategy is .
- The time complexity of optimizing the initial solution using the tabu list and the swap strategy based on the improved tabu search is .
Generally, the cache placement is and the time complexity of an improved tabu-search-based cache placement algorithm is .
5. Experiment and Analysis
5.1. Experimental Environment
5.1.1. Experimental Equipment
The performance of the proposed algorithm was evaluated by building an edge environment consisting of one cloud data center, ten edge servers, and ten mobile devices. A Linux Ubuntu-18.10-desktop-amd64 system, JDK 1.8.0_11 development kit, and Linux Eclipse 4.5.0 development environment were used. The configuration of the specific experimental environment is shown in Figure 3. The edge orchestrator manages other edge servers to facilitate communication from the edge server to the cloud data center, while users interact with the servers through wireless network hotspots.
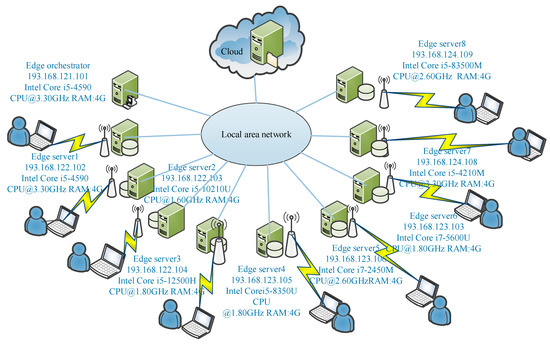
Figure 3.
The configuration of the experimental environment.
5.1.2. Evaluation Metrics
- Data response time: this metric indicates how the cache placement algorithm affects the user’s data retrieval time; that is, a shorter the data response time represents a more effective algorithm.
- Cache service rate: this index reflects the quality of the cache placement algorithm. A higher cache service rate indicates a more successful algorithm. The cache service rate calculation is shown in Equation (29).
In Equation (29), denotes the cache service rate, represents the sum of the data being accessed in the cache, and indicates the total amount of accessed data.
- 3.
- The replacement count: this indicator reflects the efficiency of the cache placement strategy in terms of the quantity of data blocks cached in the server. The formula is given in Equation (30).
In Equation (30), is the number of data blocks evicted from the server cache, is the server’s cache capacity, and is the overall count of servers.
5.2. Experimental Data and Test Cases
5.2.1. Experimental Data
The dataset for this experiment consisted of text, which included tweets and phrases from all online news downloaded from the Stanford Web Analytics Project (SNAP, http://snap.stanford.edu/) (6 April 2023) between August 2008 and April 2009 from memetracker9, with a dataset size of 13.36 G, which satisfied the experimental needs.
5.2.2. Test Cases
The experiment test case used in this paper was the WordCount [23] program that comes with the Hadoop platform, which is a word count program. The cache space of the servers set in the experiment could be different so that it could be more beneficial to verify the Hadoop cluster cache performance. In the Hadoop environment, the data block size of HDFS was 128 MB. After the dataset was stored in HDFS, the cache factors such as cache data popularity, data validity period, and server replacement rate were calculated through 120 rounds of execution, access, cache placement, and replacement. And users randomly read 200 pieces of data from HDFS and placed 120 pieces of cache data. The job was run under the LOCAL, the GPA [24], the NVCP [25], and the CPOSCU algorithm to record the response time of the data, cache service rate, and the number of server replacements, respectively, and compare the differences between them.
5.3. Experimental Results and Analysis
- Impact of different cache sizes on the algorithmic performance
To evaluate the impact of different cache capacities on the algorithm’s performance, the cache capacity of each server was set to vary between 30 and 60 data blocks. A total of 200 tasks were simulated to be executed by users. The impact of different cache capacities on the cache service rate generated by the four algorithms is shown in Figure 4.
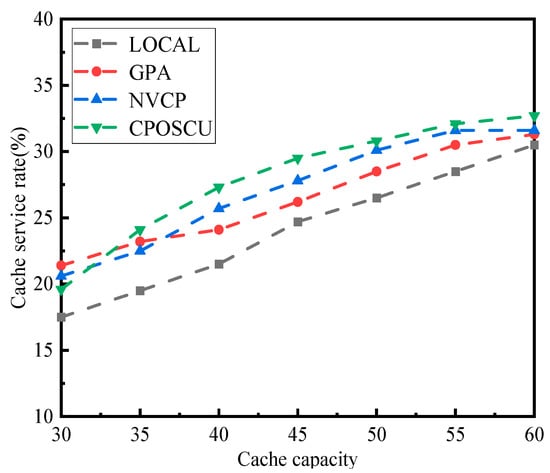
Figure 4.
Impact of cache capacity on cache service rate.
The results in Figure 4 indicate that as the cache capacity increases, the cache hit ratios of the GPA, NVCP, and CPOSCU algorithm improve by about 0.95%, 12.98%, and 19.36% compared to the LOCAL algorithm. But as the cache capacity continues to increase, the gap in the cache hit ratios between the four algorithms gradually decreases. On the one hand, when the probability of user requests being served by edge servers grows with the cache capacity, the cache service rate improves for the four algorithms; however, the cache capacity is limited, and the cache service rate gap becomes smaller when a certain value is reached. On the other hand, the LOCAL algorithm only considers the ratio of the cache space on the server; the NVCP algorithm caches the content with higher popularity at nodes with higher values, which reduces the update frequency, but it ignores the replacement rate of cache nodes and the value of cached content; the GPA algorithm considers the popularity of cached data, which improves the service rate of cache to some extent, but the CPOSCU is better than the GPA algorithm.
The experimental results of four algorithms for data response time with varying storage capacities is given in Figure 5. The figure indicates that when the cache capacity is 50, the CPOSCU algorithm reduces the data response time by 14.43%, 10.37%, and 8.61% compared to the LOCAL, GPA, and NVCP algorithms. While the value of the cache capacity is 55, the data response time, respectively, decreases by 8.45%, 6.87%, and 5.41%.
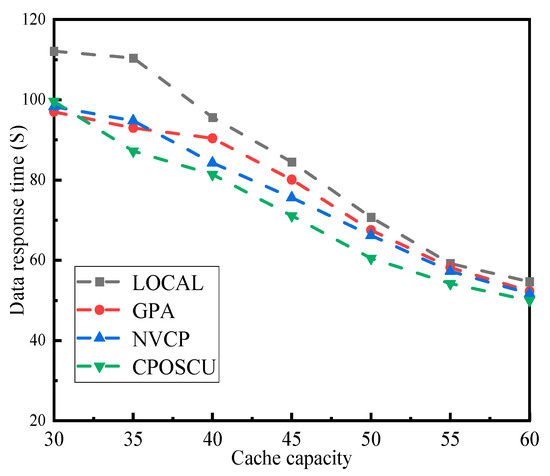
Figure 5.
Impact of cache capacity on data response time.
The point-fold line chart of the four algorithms on the number of replacements is outlined in Figure 6. When the values of cache capacity are 50 and 55, the CPOSCU algorithm improves by 8.33% and 1.86%, respectively, over the LOCAL algorithm; compared with the GPA algorithm, it improves by 26.95% and 8.14%; compared with the NVCP algorithm, it is, respectively, enhanced by 4.59% and 3.07%. This is mainly because the LOCAL, GPA, and NVCP algorithms did not consider replacement costs, while the CPOSCU algorithm considers the replacement costs as placing data. Thus, the CPOSCU algorithm has the least number of replacements in a limited server space.
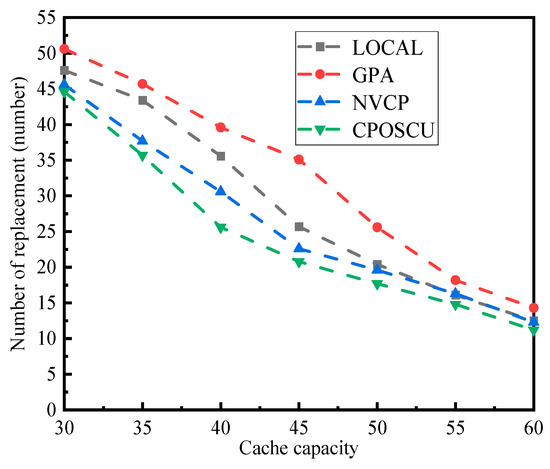
Figure 6.
Impact of cache capacity on the number of replacements.
- 2.
- The impact of the different number of data blocks required on the algorithmic performance
To evaluate the impact of different numbers of data blocks required on the algorithm’s performance, the number of data blocks was set to vary in the range of 16~256. The cache service rate of the four algorithms with different numbers of data blocks is outlined in Figure 7.
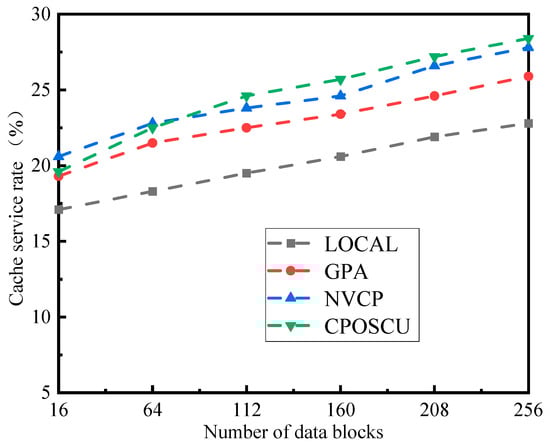
Figure 7.
Impact of different numbers of data blocks on cache service rate.
As can be seen from Figure 7, the cache service rate of each algorithm gradually grows as the number of data blocks continues to increase. The cache service rate increases as the count of requested data blocks increases, allowing for more hits in the cache server. Among the four algorithms, the CPOSCU algorithm attains the highest cache service rate by considering the cache value of the cache object and the cost overhead of the edge server, which can ensure data persistence to some extent.
The performance comparison experimental results of data response time among the four algorithms under the range of required data block numbers is demonstrated in Figure 8. The data response time of each algorithm rises with the increasing number of required data blocks, while the data response time of the CPOSCU algorithm is the lowest and the data response time of the LOCAL algorithm is the highest. Owing to this, the LOCAL algorithm prioritizes placing data with a high cache value on servers with a low replacement rate, but the CPOSCU algorithm effectively improves the data hit rates while also ensuring data stability.
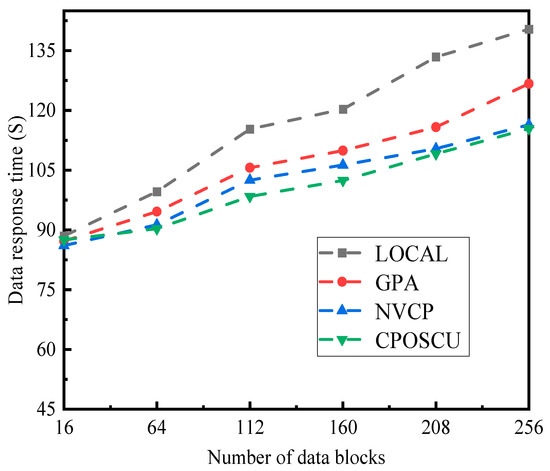
Figure 8.
Impact of different numbers of data blocks on data response time.
The impact of replacement numbers under the range of required data block numbers is illustrated in Figure 9. The replacement rates of the four algorithms increase as the quantity of the required data blocks increases. However, when the quantity of required data blocks is small, the difference in the number of replacements between the CPOSCU algorithm and the LOCAL algorithm is not much different, mainly because the LOCAL algorithm considers the cache ratio of available space, and the CPOSCU algorithm also considers the cache space and replacement cost; however, when the number of data blocks is large, the CPOSCU algorithm has the lowest replacement number.
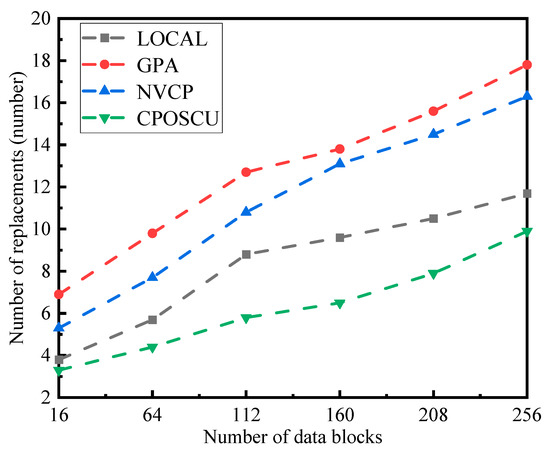
Figure 9.
Impact of different number of data blocks on the number of replacements.
- 3.
- The Impact of different data block popularities on the algorithmic performance
To evaluate the impact of different data block popularities on the algorithmic performance, the range of data block popularity variation was set from 0.7 to 1.2. The variation process of the cache service rate with data block popularity is reflected in Figure 10.
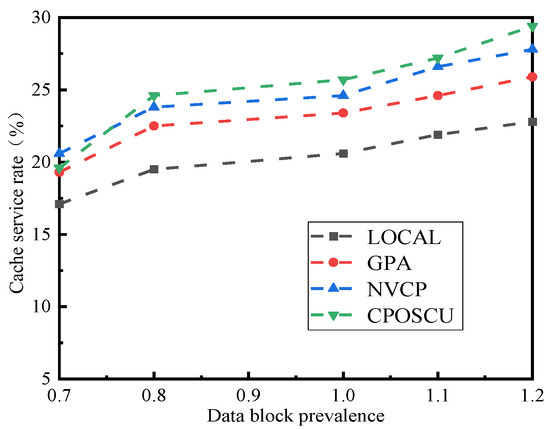
Figure 10.
Impact of data block prevalence on cache service rate.
As can be seen from Figure 10, the LOCAL algorithm has the lowest cache service rate, while the NVCP algorithm is higher, and the CPOSCU algorithm has the highest cache service rate. This is mainly because the LOCAL algorithm only considers the cache space ratio; the NVCP algorithm caches data having a higher popularity to nodes with higher values, ensuring data diversity, but the replacement cost of edge servers is ignored. The CPOSCU algorithm guarantees the stability of the data cache in the edge server by accounting for the cost overhead along with the cache value of the data blocks.
The impact of data response time on the number of data blocks is illustrated in Figure 11. This is primarily caused by the fact that the data response time decreases as the probability of a user hit increases with the increasing popularity of the data block. Furthermore, it is clear that the CPOSCU algorithm has the lowest and the LOCAL algorithm has the highest data response time. The reason is that the LOCAL algorithm is a random cache, while the CPOSCU algorithm considers the replacement rate and cost overhead of the edge server as well as the data block’s prevalence.
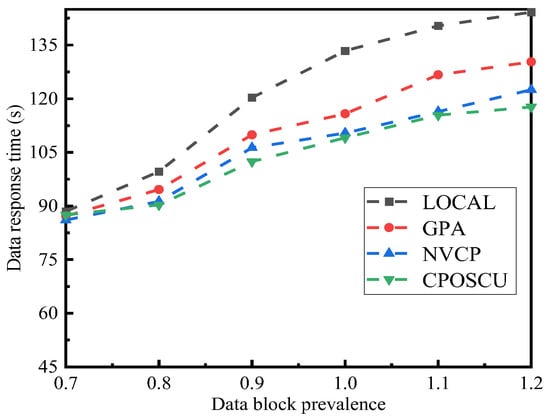
Figure 11.
Impact of data block prevalence on data response time.
The effect of replacement numbers under the different data block’s popularity is illustrated in Figure 12. The LOCAL algorithm keeps the number of permutations stable as the popularity increases, while the GPA, NVCP, and CPOSCU algorithms decrease most significantly. This is because the LOCAL algorithm only performs random caching and has the largest number of permutations; other algorithms take into account the data popularization, which generates a reduced number of permutations, while the CPOSCU algorithm considers the server permutation rate in addition to the prevalence. Therefore, it generates the smallest number of permutations.
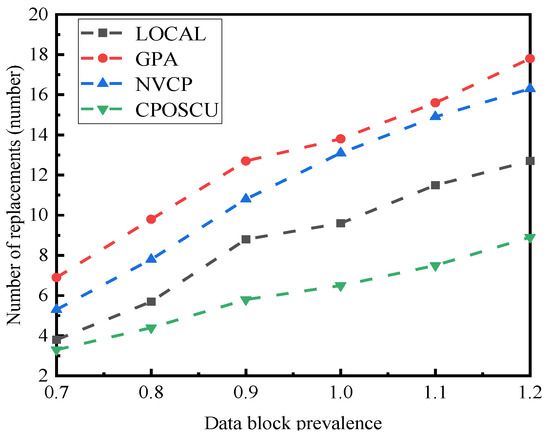
Figure 12.
Impact of data block prevalence on the number of replacements.
5.4. Summary of Experiments
The conclusions drawn from the three sets of experimental results are as follows:
- Cache capacity has a certain impact on cache placement algorithms, i.e., as the cache capacity increases, the cache hit rate improves, while the data response time and replacement number decrease.
- The number of data blocks has a certain impact on the algorithm, i.e., with the growing quantity of data blocks, the cache hit rate, the data response time, and the replacement number all increase.
- Data popularity has a certain impact on the algorithm, i.e., as the popularity of data blocks increases, the cache hit rate improves, while the data response time and replacement number decrease.
6. Conclusions
This paper aimed to address the low utilization of storage space and high data replacement rates in traditional edge computing cache placement strategies. The objective was to maximize the cache service rate and minimize the system overhead and data response time. The cache value, acquisition cost, placement cost, and replacement cost for data blocks is considered as a joint optimization problem. A cache placement optimization strategy based on improved tabu search was proposed for solving this problem. The replacement overhead of data blocks was quantified by taking into account the available storage space and the number of data blocks cached on the edge server. The experimental results demonstrated that the CPOSCU algorithm can boost the cache space utilization, reduce the system overhead, and effectively improve the system performance, thereby enhancing the user experience of mobile internet applications.
In future work, two aspects will be investigated. First, various content caching and placement operations will be performed using deep reinforcement learning methods based on different content types. Second, as the scale of the edge cloud environment built in this experimental environment was limited, the experiments will be scaled up further by expanding the number of edge servers and improving the deployment.
Author Contributions
Conceptualization, Y.L.; methodology and writing, Y.B.; visualization, N.C.; data curation, S.Z. All authors have read and agreed to the published version of the manuscript.
Funding
The work was supported by the National Natural Science Foundation (NSF) under grant no. 61802353, the Natural Science Foundation of Henan Province (No. 202300410505), and the Project of Science and Technology of Henan Province (No. 192102210270).
Institutional Review Board Statement
Not applicable.
Informed Consent Statement
Informed consent was obtained from all subjects involved in the study.
Data Availability Statement
Data sharing not applicable. No new data were created or analyzed in this study. Data sharing is not applicable to this article.
Conflicts of Interest
The funders had no role in the design of the study; in the collection, analyses, or interpretation of data; in the writing of the manuscript; or in the decision to publish the results.
References
- Statista. Forecast Number of 5G Mobile Subscriptions Worldwide 2019–2026. 2022. Available online: https://www.statista.com/statistics/760275/5g-mobile-subscriptions-worldwide/ (accessed on 3 October 2022).
- Chen, Y.; Zhang, N.; Zhang, Y. Energy Efficient Dynamic Offloading in Mobile Edge Computing for Internet of Things. IEEE Trans. Cloud Comput. 2021, 8, 2163–2176. [Google Scholar] [CrossRef]
- Wang, S.; Zhao, Y.; Xu, J. Edge server placement in mobile edge computing. J. Parallel Distrib. Comput. 2018, 127, 160–168. [Google Scholar] [CrossRef]
- Pozo, E.; Germine, L.T.; Scheuer, L.; Strong, R.W. Evaluating the Reliability and Validity of the Famous Faces Doppelgangers Test, a Novel Measure of Familiar Face Recognition. Assessment 2022, 30, 1200–1210. [Google Scholar] [CrossRef] [PubMed]
- Wang, A.; Wang, P.; Miao, X.; LI, X.; Ye, N.; Liu, Y. A review on non-terrestrial wireless technologies for Smart City Internet of Things. Int. J. Distrib. Sens. Netw. 2020, 16, 1–17. [Google Scholar] [CrossRef]
- Khan, M.A. Intelligent environment enabling autonomous driving. IEEE Access 2021, 9, 32997–33017. [Google Scholar] [CrossRef]
- Qonita, M.; Giyarsih, S.R. Smart city assessment using the Boyd Cohen smart city wheel in Salatiga, Indonesia. GeoJournal 2022, 88, 479–492. [Google Scholar] [CrossRef]
- Chen, Y.; Zhang, L.; Wei, M. How does smart healthcare service affect resident health in the digital age? Empirical evidence from 105 cities of China. Front. Public Health 2022, 9, 1–10. [Google Scholar] [CrossRef]
- Yao, J.; Han, T.; Ansari, N. On mobile edge caching. IEEE Commun. Surv. Tutor. 2019, 21, 2525–2553. [Google Scholar] [CrossRef]
- Song, J.; Choi, W. Mobility-aware content placement for device-to-device caching systems. IEEE Trans. Wirel. Commun. 2019, 18, 3658–3668. [Google Scholar] [CrossRef]
- Althamary, I.; Huang, C.W.; Lin, P.; Yang, S.-R.; Cheng, C.-W. Popularity-based cache placement for fog networks. In Proceedings of the 2018 14th International Wireless Communications & Mobile Computing Conference (IWCMC), Limassol, Cyprus, 25–29 June 2018; IEEE: New York, NY, USA, 2018; pp. 800–804. [Google Scholar]
- Somesula, M.K.; Rout, R.R.; Somayajulu, D.V.L.N. Contact duration-aware cooperative cache placement using genetic algorithm for mobile edge networks. Comput. Netw. 2021, 193, 1–13. [Google Scholar] [CrossRef]
- Chen, M.; Hao, Y.; Hu, L.; Huang, K.; Lau, V.K.N. Green and mobility-aware caching in 5G networks. IEEE Trans. Wirel. Commun. 2017, 16, 8347–8361. [Google Scholar] [CrossRef]
- Wu, H.T.; Cho, H.H.; Wang, S.J.; Tseng, F.H. Intelligent data cache based on content popularity and user location for Content Centric Networks. Hum.-Centric Comput. Inf. Sci. 2019, 9, 1–16. [Google Scholar] [CrossRef]
- Banerjee, B.; Kulkarni, A.; Seetharam, A. Greedy caching: An optimized content placement strategy for information-centric networks. Comput. Netw. 2018, 140, 78–91. [Google Scholar] [CrossRef]
- Chen, W.; Han, L. Time-efficient task caching strategy for multi-server mobile edge cloud computing. In Proceedings of the 2019 IEEE 21st International Conference on High Performance Computing and Communications, IEEE 17th International Conference on Smart City and IEEE 5th International Conference on Data Science and Systems (HPCC/SmartCity/DSS), Zhangjiajie, China, 10–12 August 2019; IEEE: New York, NY, USA, 2019; pp. 1429–1436. [Google Scholar]
- Tang, Y.; Guo, K.; Ma, J.; Shen, Y.; Chi, T. A smart caching mechanism for mobile multimedia in information centric networking with edge computing. Future Gener. Comput. Syst. 2019, 91, 590–600. [Google Scholar] [CrossRef]
- Chen, J.; Wu, H.; Yang, P.; Lyu, F.; Shen, X. Cooperative edge caching with location-based and popular contents for vehicular networks. IEEE Trans. Veh. Technol. 2020, 69, 10291–10305. [Google Scholar] [CrossRef]
- Chunlin, L.; Zhang, J. Dynamic cooperative caching strategy for delay-sensitive applications in edge computing environment. J. Supercomput. 2020, 76, 7594–7618. [Google Scholar] [CrossRef]
- Baccour, E.; Erbad, A.; Mohamed, A.; Guizani, M.; Hamdi, M. Collaborative hierarchical caching and transcoding in edge network with CE-D2D communication. J. Netw. Comput. Appl. 2020, 172, 1–21. [Google Scholar] [CrossRef]
- Wang, S.; Zhang, X.; Yang, K.; Wang, L.; Wang, W. Distributed edge caching scheme considering the tradeoff between the diversity and redundancy of cached content. In Proceedings of the 2015 IEEE/CIC International Conference on Communications in China (ICCC), Shenzhen, China, 2–4 November 2015; IEEE: New York, NY, USA, 2015; pp. 1–5. [Google Scholar]
- Li, Q.; Zhang, Y.; Li, Y.; Xiao, Y.; Ge, X. Capacity-aware edge caching in fog computing networks. IEEE Trans. Veh. Technol. 2020, 69, 9244–9248. [Google Scholar] [CrossRef]
- Jesien, K.; Lederman, H.; Arancillo, M. Journal word count specifications: A comparison of actual word counts versus submission guidelines. Curr. Med. Res. Opin. 2017, 33, 14–15. [Google Scholar]
- Xu, Y.; Ci, S.; Li, Y.; Lin, T.; Li, G. Design and evaluation of coordinated in-network caching model for content centric networking. Comput. Netw. 2016, 110, 266–283. [Google Scholar] [CrossRef]
- Gu, J.; Ji, Y.; Duan, W.; Zhang, G. Node Value and Content Popularity-Based Caching Strategy for Massive VANETs. Wirel. Commun. Mob. Comput. 2021, 2, 1–10. [Google Scholar] [CrossRef]


Disclaimer/Publisher’s Note: The statements, opinions and data contained in all publications are solely those of the individual author(s) and contributor(s) and not of MDPI and/or the editor(s). MDPI and/or the editor(s) disclaim responsibility for any injury to people or property resulting from any ideas, methods, instructions or products referred to in the content. |
© 2023 by the authors. Licensee MDPI, Basel, Switzerland. This article is an open access article distributed under the terms and conditions of the Creative Commons Attribution (CC BY) license (https://creativecommons.org/licenses/by/4.0/).