Abstract
The exponential increase in production and consumption of plastic has led to accumulation of plastic waste in the environment, resulting in detrimental impacts on human health and the natural environment. Plastic pollution not only stems from discarded plastics but also from the chemicals released during plastic production and decomposition. Various waste management strategies exist for plastic waste, including landfilling, recycling, conversion to liquid fuel, and upcycling. Landfilling, which is a prevalent method, contributes to long-term environmental degradation. Recycling is practiced worldwide, but its percentage remains low, particularly in regions like South Asia. Conversion to liquid fuel through pyrolysis has been explored as a viable solution, although commercialization faces challenges. Upcycling, which involves depolymerization and repolymerization, offers an avenue to recycle plastic waste into valuable chemicals, specifically focusing on high-density polyethylene (HDPE) and low-density polyethylene (LDPE). Currently, HDPE and LDPE make up 36% of all plastic trash by mass, but they have the potential to account for far more. When plastic waste is incinerated or buried in the earth, it generates carbon dioxide and heat, which pollute our environment. Depolymerization is a way to chemically recycle plastic waste into monomers, but this process requires a large amount of energy. Controlled partial depolymerization can transform PE into new, high-quality products at a temperature of more than 400 °C with or without a catalyst. In this study, we provide a novel approach for the conversion of plastic waste, particularly HDPE and LDPE, into valuable alkyl aromatics. By implementing controlled partial depolymerization, we propose a plant design capable of transforming plastic waste into high-quality chemicals. The design aims to optimize energy consumption, process efficiency, and product quality. The research findings contribute to sustainable plastic waste management and the reduction in environmental pollution caused by plastic waste.
1. Introduction
Plastic, originating from the Greek term meaning “moldable objects”, possesses unique characteristics, such as poor electrical conductivity, durability, low density, and recyclability [1]. Plastics are classified as either commodity or specialty resins. Commodity resins, including plastic, nylon, polyvinyl chloride, and polystyrene, are extensively used in high-volume production of consumer goods and packaging materials [2]. Specialty resins, such as engineering plastics (e.g., polyacetal, polyamide, and polycarbonate), are employed in specific applications, albeit in lower volumes and at higher costs [3]. Engineering plastics (or resins) can compete with die-cast aluminum in a various settings, including building construction, metal fabrication, and vehicle manufacturing [3]. Another category is thermoplastic elastomers, combining rubber-like elasticity with the ability to be molded upon heating.
1.1. Types of Plastic
Plastics are marked with a triangle symbol, denoting a number from 1 to 7, representing the specific resin used in the product. However, not all plastics can be recycled due to their non-degradability, leading to accumulation and environmental issues. This section provides an overview of various types of plastics and their recycling capabilities.
- Polyethylene terephthalate (PET): Commonly found in beverage containers and packaging, PET is single-use due to leaching and contamination risks. It can be recycled into textile fibers and various products [4].
- High-density polyethylene (HDPE): Used in water jugs, product bottles, and various durable items, HDPE exhibits excellent recyclability and is often reused for multiple purposes [5].
- Polyvinyl chloride (PVC): PVC is a flexible plastic utilized in various applications, including food wrapping, construction materials, and tubing. It has limited recyclability and is considered environmentally hazardous. Also named “poison plastic”, PVC contains multiple toxins that can be released throughout the course of a product’s lifetime. Less than 1% of PVC is recycled, as objects made from it cannot be reused or recycled [6].
- Low-density polyethylene (LDPE): LDPE is commonly found in plastic bags, shrink wraps, and other packaging materials. While it poses fewer risks, LDPE recycling is currently limited but emerging.
- Polypropylene (PP): PP’s heat resistance makes it suitable for a wide range of products, but its recycling rate remains low. It serves as a barrier against liquids, oils, and other corrosive substances so that cereal, for example, can stay fresher for longer. PP can be found in a wide variety of everyday items, including baby nappies, plastic bottle caps, cheese and yoghurt bottles, snack bags, straws, packaging tape, and rope. Although PP is one of the most widely used plastics, comprising at least 20% of the market share [7], the recycling rate remains very low due to its rigidity and inclusion in complex products [8]. Landscaping border stripping, battery casings, brooms, bins, and trays are products that can benefit from recycled PP.
- Polystyrene (PS): Many different items can be made from PS because of its inexpensive price, light weight, and malleability. Egg cartons, polyurethane picnic utensils, foam packing, and “peanuts” used to stuff packages are just a few examples. Rigid cellulose insulation and laminate underlay sheets are two more common uses for PS. PS is easily broken down and dispersed throughout the natural environment because of its structural instability and light weight.
- Polycarbonate (PC) and Lexan: PC is well known and is widely utilized because of its strength and durability. Sunglasses, sports goggles, and safety glasses are just a few of the many products that benefit from PC lenses. It can also be found in compact discs (CDs) and mobile phones. This resin’s leaching causes the production of bisphenol A, a chemical that is suspected of being detrimental to the environment when heated to high degrees, and as a result, its use has been contentious in recent years. In addition, BPA does not break down in landfills, so it will persist in the environment for long periods and ultimately end up in water sources, where it can cause contamination.
1.2. Plastic Pollution
Plastic pollution occurs when synthetic plastic items accumulate in the environment, endangering wildlife, habitats, and animal populations. Even if plastic is not discarded, the chemicals used to make it contribute to pollution. Air and water pollution caused by solubilized chemicals from plastics is a growing issue. Compounds like plasticizers, polyamorous A, and peg diphenyl ether (PBDE) associated with plastics have been investigated and regulated. Plastic products require plasticizers, also known as phthalates or softeners, to prevent breakage. Phthalates can be found in various items, like medical devices, food packaging, automobile upholstery, computer components, perfumes, and cosmetics. BPA is present in packaging, bottles, CDs, CD liners, medical equipment, and food container linings [8]. This chemical is used to produce strong polyester resins, adhesives, and durable PC plastics. All these substances are harmful to the endocrine system and have been detected in humans. Toxic chemicals, including antiandrogen phthalates, estrogen-mimicking BPA, and thyroid-disrupting PBDE, have been linked to health problems. Humans, especially children and women of childbearing age, are particularly vulnerable to the effects of hormone-disrupting chemicals.
1.3. Diverse Avenues for Plastic Waste Management
The concept of waste management encompasses the systematic elimination of human-generated waste from the environment. It entails employing various processes and actions to minimize waste at its source, ensuring its appropriate handling, and, ultimately, disposing of it in designated areas. The crucial objective is to prevent waste from accumulating or being exposed in inhabited regions, as it poses potential harm to living organisms. Disposal is carried out in carefully selected locations, away from cities and residential areas, where waste materials cannot jeopardize lives [9].
Waste management is a broad field that encompasses different types of waste, including plant, animal, and plastic waste. In this discussion, our focus lies on plastic waste management, which represents 18% of the total waste as shown in Figure 1. Annually, an immense quantity of plastic waste is generated globally, demanding effective management strategies to avert its accumulation in the environment. Various approaches are available to manage plastic waste.
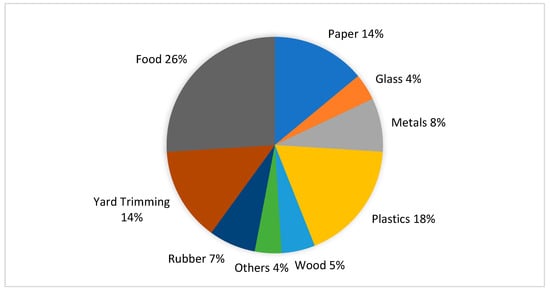
Figure 1.
Composition of solid waste.
1.4. Landfill
Plastic waste has emerged as a global crisis, necessitating serious consideration. This type of waste can be classified into two categories: recyclable and nonrecyclable. Nonrecyclable plastics are also nondegradable, persisting in the environment for hundreds of years. Astonishingly, approximately 70% of total plastic waste ends up in landfills, resulting in the degradation of land that becomes infertile and unsuitable for cultivation due to the protracted decomposition period of plastic waste. A study revealed that a significant portion of plastic waste in South Asia is mismanaged, with Oman demonstrating the highest percentage. Oman generates approximately 3.9 million tons of plastic waste annually, and this number is increasing by 2% each year. Mismanagement of plastic waste in Oman exceeds that in India by 2%, Sri Lanka by 6%, Bangladesh by 7%, and Iran by 11% [10]. Nonrecyclable plastics predominantly consist of single-use bags made from low-density polyethylene (LDPE), which is the focal point of our concern and will be utilized in our proposed process [10].
1.5. Recycling
Recycling is an alternative pathway for plastic waste management that involves converting waste materials into reusable forms. Comparable to paper recycling, plastic objects are recycled worldwide, although the current percentage remains relatively low, especially in the South Asian region. Recyclable plastic waste primarily comprises polyethylene terephthalate (PET), which is prominently sourced from the beverage and packaging industries, as reported by the World Bank. Recycled PET can be transformed into a variety of materials, such as car bumpers and carpet fibers. However, Oman lacks the necessary infrastructure to recycling plastic waste. As of 2020, only 20–25% of Oman’s total plastic waste is recycled, with the majority being directed to landfills [10]. Typically, individuals retain and sell the waste generated in their households to waste dealers for recycling. Scavengers collect discarded waste, earning INR 100–200 per day by selling it. Nonetheless, ample potential for recycling exists, as indicated by a 1999 report from the Environmental Management Policy Committee (EPMC) regarding the recycling prospects of various cities [11].
1.6. Conversion to Liquid Fuel
The conversion of plastic waste into liquid fuel represents another waste treatment technique currently practiced in numerous regions worldwide. Plastics mainly consist of polyethylene, a major component of fuel oils, containing numerous valuable hydrocarbons. Consequently, the fuel derived from treating plastic waste serves as a substitute for conventional organic fuels. Pyrolysis, a crucial technique employed in the conversion process, involves the thermal degradation of plastic at elevated temperatures ranging from 300 to 900 K in an oxygen-free environment. The final obtained product is liquid fuel. Despite the extensive research conducted in this field over the years, the commercialization of plastic-to-fuel conversion is still in its early developmental stages. Several factors, such as fuel yield, production costs, and the presence of sulfur and other chemical constituents, contribute to this ongoing process. The simplified block flow diagram presented in Figure 2 illustrates the conversion process [10].
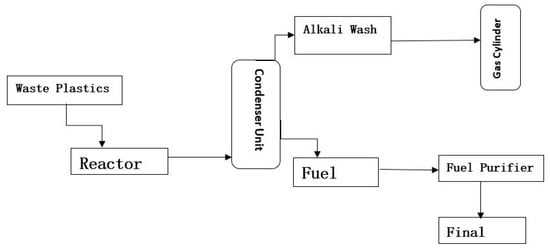
Figure 2.
Process flow diagram for fuel production from plastic waste.
1.7. Upcycling
In the past 70 years, plastics made from synthetic petroleum have seen a dramatic increase in production around the world. In 2020, it was expected that 367 million tons of plastic waste would be produced globally—up from less than 2 million tons in 1950—and by 2030, that number is expected to increase by a factor of 19 [12]. Roughly 40% of all plastics are single-use items that cannot be recycled. They typically wind up in dumps and similar locations, where they can remain for countless generations. However, the amount of energy gained from burning this trash is less than what was used during production if it is converted into fuel first. Recovering the plastic’s original monomer through a process called depolymerization, also known as chemical or material recycling, then repolymerizing it can result in a product with the same qualities as the original polymer, but a large amount of energy is needed for this procedure when working with polyethylene and PP. Nevertheless, plastic trash can be recycled into useful chemicals through a process called controlled partial depolymerization. Increasing the cycle is referred to as upcycling.
HDPE products, such as bottles and cans and other types of plastics, make up a significant portion of plastic trash. LDPE products, such as polyethylene bags, comprise a considerable portion of this trash as well. Above 400 °C, pyrolysis can depolymerize them, but the resulting gas, crude oils, and char are of little value and can be difficult to use. This can be accomplished with or without the use of a catalyst. At lower temperatures, catalytic hydrogenolysis or double catalytic alkane metathesis can achieve somewhat more selective disassembly; however, the products of these reactions are all low-value alkanes, making it unlikely that their production costs can be recouped. Partial depolymerization can obtain more valuable aromatics, and naphtha reforming is the standard method of producing aromatics [13]. This process consumes a considerable amount energy and generates a mixture known as benzene–toluene–xylenes (BTX) at temperatures of 500–600 °C. It is alkylated to produce linear alkyl-benzenes. Manufacturing of BTX by linear alkanes is a reaction that requires harsh conditions and high temperatures of up to 800 °C. Under these harsh conditions, the catalyst tends to deactivate rapidly. New catalysts have been developed, which convert certain materials into BTX at lower temperatures, but they are not cost-effective, with slow rates, low yields, and high hydrogen requirements.
1.8. Purpose of the Study
The purpose of this study is to design a plant that converts plastic waste, specifically high-density polyethylene (HDPE) and low-density polyethylene (LDPE), into valuable chemicals known as alkyl aromatics. The rapid increase in plastic production and consumption has resulted in a significant accumulation of plastic waste, leading to harmful effects on both human health and the natural environment. In this study, we acknowledge that plastic pollution arises not only from discarded plastics but also from the chemicals released during plastic production and decomposition. Various waste management strategies, including landfilling, recycling, conversion to liquid fuel, and upcycling, are explored. However, landfilling contributes to long-term environmental degradation, recycling rates remain low in certain regions, and the commercialization of plastic-to-liquid fuel conversion faces challenges. Upcycling, specifically depolymerization and repolymerization, presents an opportunity to transform plastic waste into valuable chemicals. HDPE and LDPE, which constitute a significant portion of plastic waste, are the focus of this study. By implementing controlled partial depolymerization, we propose a plant design that optimizes energy consumption, process efficiency, and product quality. The goal is to contribute to sustainable plastic waste management and reduce environmental pollution caused by plastic waste.
2. Materials and Methods
The proposed plant design incorporates dimensionless numbers, including the Prandtl number (Pr), Reynolds number (Re), and Nusselt number (Nu), to inform decisions about system parameters, equipment selection, and performance optimization. The Prandtl number helps to understand the importance of conduction and convection in heat transfer, aiding in heat exchanger design. The Reynolds number determines the flow regime and assists in designing fluid transportation systems, while the Nusselt number evaluates heat transfer efficiency and aids in optimizing heat exchangers and cooling systems. These numbers provide valuable insights for fluid behavior and heat transfer, leading to improved processes, cost reduction, and increased productivity.
2.1. Process
First, polyethylene is preheated in a furnace. Afterward, the aromatization reaction takes place in a reactor, where long-chain alkyl aromatics and hydrocarbons are formed at 280 °C within 24 h. The gaseous mixture is cooled, then sent for distillation to separate methane and toluene. Liquid waxes from the reactor are separated in an adsorption column; then, a series of distillation columns is used to separate the different alkyl aromatic products.
2.2. Steps of Pyrolysis
The pyrolysis process is divided into many phases (see Figure 3 for detailed process flow), as follows:
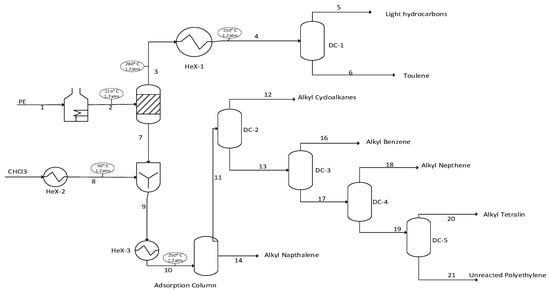
Figure 3.
Process flow diagram.
- Pretreatment of the plastic;
- Pyrolysis in the pyrolysis reactor;
- Separation of the gaseous and liquid phases;
- Separation of the liquid mixture based on the boiling point.
2.3. Pretreatment of the Plastic
Plastic waste production is a problem worldwide, and its production has been increasing with time. According to reports, in the year 2020, more than 380 million tons of plastic waste were produced worldwide. In Oman, about 3.8 million tons of plastic waste were produced in the same year, which shows that the availability of plastic is not an issue. It can be easily gained from landfills and other dumping areas. The next step is the pretreatment of the plastic, which is further divided into three steps [13].
- Cleaning
The methods for dirt and dust particle removal when recycling HDPE and LDPE plastics include sorting and prewashing to manually remove large debris and contaminants, as well as rinsing with water or mild detergent. Mechanical cleaning methods like sieving or screening with vibrating screens or sieves can separate plastic particles from dirt. Washing and rinsing with water and detergents, along with agitation, can dislodge stubborn dirt particles. Floatation or density separation techniques using water or air can separate plastic from heavier contaminants. Air classification systems use air currents to blow away fine particles, and electrostatic separation utilizes electrical charges to attract or repel dust particles from the plastic waste.
- Drying
Since dry material melts and degrades easily, the plastic is dried to boost the thermal efficacy of the reaction. Drying the plastic in open sunlight is possible, but this may again introduce dust into the plastic. Drying may also be achieved by introducing hot air to plastic. This is a somewhat pricey but practical approach.
- Shredding
Most of the plastic collected from landfills is in the shape of large lumps. These lumps can delay the pyrolysis process by generating resistance in heat breakdown and causing an increase in residence time. To lessen this issue, plastic trash is shredded into smaller pieces, which decreases the aggregated material into smaller and separated particles with more surface area. These particles can readily transmit heat and are thermally destroyed quickly.
2.4. Thermal Treatment or Pyrolysis in the Reactor
In a pyrolysis reactor, the plastic feed is thermally degraded at a high temperature of more than 500 °C into a variety of gaseous, solid, and liquid products. The retention time decreases as the temperature is increased from 400 °C for 760 min to 450 °C for 290 min, then 500 °C for 68 min and 550 °C for 54 min. However, the technique can benefit from additional reductions in temperature and retention time. Both thermal and catalytic processes can be used to accomplish pyrolysis. The following reactors are used for pyrolysis [14]:
- Fixed-Bed Reactor
Since fixed-bed furnaces are simple to construct, they are the go-to choice for small-scale studies conducted in the lab. The feedstock is placed in the reactor (usually made of stainless steel) and heated outside. An electric furnace is the most popular option. To create anaerobic conditions, the engine is flooded with an inert gas (such as nitrogen or argon) before the experiment begins, and the supply line is maintained throughout the entire operation [13]. Char is typically removed after pyrolysis, but the collected gases and vapors are released during the process. A characteristic of the batch reactor is a relatively slow rate of heating. In addition, the feedstock remains stationary during the process, making large-scale, consistent heating of municipal solid waste (MSW) challenging to predict.
- Fluidized Bed Reactor
Studies of rapid pyrolysis behavior and secondary oil cracking at extended residence durations are common applications of fluidized bed reactors. The feedstock is heated rapidly and thoroughly mixed in a fluidized bed reactor. Such reactors are widely used in laboratory experiments to characterize the effect of the calcination temperature on pyrolysis behavior and products. For the pyrolysis of unwanted polymers, this type of reactor appears to be a viable choice. Since polymers have very poor high-thermal-stability viscosity, polymer combustion in a deionization reactor may yield noticeable benefits over other reactors, where heat is not transmitted as well for the shattering of polymers.
- Spouted Bed Reactor
This reactor works well with irregularly shaped, small particles, as well as materials that stick together and have a large size range. In addition, the system’s gas flow is highly variable, allowing it to function with minimal gas residence times. This reactor is well-suited for flash pyrolysis because of the good movement of the materials within it, which results in rapid transfer rates of heat between phases. For larger-scale applications of biomass pyrolysis, the octagonal spouted bed reactor’s suitability for continuous operation is of paramount importance.
- Rotary Kiln Reactor
Facility locations in Germany and Japan, among others, have used rotary kiln reactors for the slow degradation of MSW. The typical treatment temperature is around 500 °C, and the typical residence time is around 1 h. This type of reactor is the only one that has been widely implemented as a practical industrial solution across a range of scales. However, it may sometimes call for multistage entropy (MSE) pretreatment before pyrolysis can begin. Waste needs to be sorted, then shredded to get rid of junk.
- Microwave-assisted Reactors
Microwaves can be found in electromagnetic, infrared, and radio waves. Microwaves have a frequency of about 300 GHz and a wavelength of about 1 m. Both 915 MHz and 2.45 GHz are widely used in the microwave industry. Most home microwave ovens use electricity as a source of microwave energy and have a frequency of 2.45 GHz. Lam and Chase investigated the use of microwave pyrolysis in waste-to-energy systems [11]. They were able to define the process, but they also noted that advancements in commercial microwave equipment for this type of pyrolysis are hampered by a general lack of understanding of high-frequency applications and the technical details required for their construction.
- Plasma Reactors
Most people consider ionized plasma, which is what plasma is, to be the final state of matter, alongside solids, liquids, and gases. Plasma can be created by subjecting a gas to high temperatures or a strong electromagnetic field, and the result is a gaseous mixture of subatomic particles and positively charged ions. High-temperature or fusion solitons and low-temperature plasmas, such as gas discharges, are the two main types of plasmas that can be distinguished. Direct current, alternating current, radio-frequency induction, and microwave discharge can all be used to generate thermal plasma. For plasma generation, even a 2 GHz magnetron from a regular microwave oven will do.
2.5. Selection of Catalyst
Catalyst contact during the pyrolysis of plastic waste can be broken down into two distinct categories: liquid-phase contact and vapor-phase contact. In a liquid-phase reaction, melted polymers encounter a fine powder-type catalyst with a large external surface area in which the polymer chain is broken down into light products [15]. The catalyst is the key ingredient in this process; hence, its price is proportional to the volume used. After the polymer fragments are cracked, they are linked to the catalyst contained in the fluidized bed reactor, which reforms the polymer fragments produced by heat degradation. The two processes use different types of catalysts, which are classified as zeolite, oxide, porous, fluid catalytic cracking (FCC), and reform catalysts, among others. Heavy hydrocarbons are typically cracked using acidic catalysts, such as alumina, silica-alumina with mesopores, and zeolite with microspores [16]. The professional petroleum industry is their main place of employment. While the catalyst’s chemical characteristics are certainly important, the catalyst’s physical features have a much larger impact on catalytic activity and product selectivity. Land area, pore size, tunable pore size, and pore structure are examples of these features. Platinum-supported alumina is used as our catalyst, since it maximizes the production of alkyl aromatics [17]. In addition, it has everything needed to improve both product and process quality.
2.6. Material Selection
Various plastics have distinct physical structures and varied chemical contents. Consequently, different temperature and pressure conditions with different kinds of plastics have different effects on pyrolysis. Our key choice for the procedure is polyethylene. Overall, plastic waste mostly consists of polyethylene waste, accounting for about 69% [18]. Polyethylene is categorized into two types: LDPE and HDPE. A survey showed that the major fraction (70%) of polyethylene waste from household waste is LDPE, and 30% is HDPE [14]. However, the overall production of HDPE is greater than that of LDPE as shown in Figure 4. We use LDPE as our raw material because fuel production and energy recovery from LDPE are higher, at 60%.
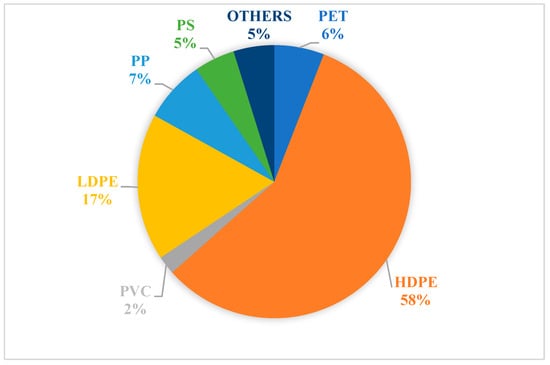
Figure 4.
Plastic waste composition.
2.7. Design Overview
2.7.1. Estimation of Design Parameters
The heart of every engineering process is its design. The major components of the plant are:
- Batch catalytic reactor;
- Shell and tube heat exchanger;
- Distillation column.
2.7.2. Design of Heat Exchanger
The following selection criteria are implemented for the heat exchanger:
- Thermal and hydraulic requirements;
- Material capability;
- Operational maintenance;
- Availability.
2.8. Shell and Tube Heat Exchanger
To heat or cool a fluid, plate-type heat absorbers use a series of tubes. A second fluid is circulated in a system surrounding the tubes that require heating or cooling. The tubes in the tube bundle can be either plain or longitudinally finned, but they can also be a combination of the two. Shell and tube heat exchangers are often used in high-pressure settings, and they are exceptionally long-lasting because of their construction. During the development of the plant for the conversion of plastic trash into useful chemicals (alkyl aromatics), several heating design considerations must be taken into account when designing the tubes in the thermal systems. Different configurations of shells and tubes are possible. Metal eyelets in tube sheets are often used to link the ends of individual tubes to plenums (sometimes called water boxes). U-shaped tubes (or U tubes) can be either straight or curved, and high pressures are no match for their fabricated and engineered forms. They can withstand thermal shocks, can be made to operate in extreme temperatures, are thermally shock-resistant, and have a design that is both flexible and stable. The diameter of the pipes, the number of pipes, the length of the pipes, the pitch of the pipes, and the arrangement of the pipes may all be modified, and there is no size restriction. In this way, tube heat exchangers can take on various forms.
2.9. Design Data
We selected chloroform as the process fluid on the tube side, with water as the fluid on the shell side. Table 1 shows the fluid conditions for the tube side, and Table 2 shows the fluid conditions for the shell side.

Table 1.
Tube-side fluid conditions.
Table 2.
Shell-side fluid conditions.
The heat-duty Q of the heat exchanger is
where Q = 27,048 watts.
2.10. Sadik–Kakac Method
The intake and output temperatures of the two fluids are crucial pieces of information for successful employment of the procedure. Table 3 illustrates the properties of chloroform.
Table 3.
Properties of chloroform.
The log mean temperature difference formula is as follows:
LMTD = 7.21 °C
Tube-side calculations are shown below:
Prandtl number:
where Pr = 0.85.
Reynolds number:
where Re = 14,130.19.
Turbulent flow calculation are shown below:
Nusselt number:
where Nu = 57.38.
Overall heat transfer coefficient inside the tube:
where hi = 1672.92 W/m2∙K
2.11. Shell-Side Calculation
Shell-side flow area:
where FA = 0.0093 m2.
Mass velocity:
G = 46.30 kg/s∙m2
Prandtl number:
where Pr = 3.644819315.
Reynolds number:
where Re = 2.08 × 10³.
Nusselt number:
where Nu = 36.88246796.
Overall heat transfer coefficient on the shell side:
where hi = 942.1227208 W/m2∙K.
Table 4 summarizes the properties of water at the operating temperature and pressure of the reactor. The properties are important for understanding the behavior of the water in the reactor and for designing the reactor components.
Table 4.
Properties of water.
Table 5 summarizes the fouling resistance for the tube side and shell side of the reactor. The fouling resistance is important for determining the heat transfer coefficient and for designing the reactor components.
Table 5.
Fouling resistance.
2.12. Design Specifications
The following tables (Table 6 and Table 7) summarizes the tube-side and tube-shell specifications for the proposed design. The tube-side and shell-side specifications are important because they determine the performance of the reactor.
Table 6.
Tube-side specifications.
Table 7.
Shell-side specifications.
2.13. Design of Distillation Column
In order to separate a liquid mixture into its component parts or fractions based on differences in volatilities, a distillation column is required. A simple example is when water vapor from a boiling kettle condenses into droplets on a cool surface. The process of separating two or more liquids with different boiling points, like gasoline, kerosene, and petroleum distillates from crude oil, involves the separation of solvents from nonvolatile particles, like ethanol from fermented materials. Formaldehyde and phenol are two compounds that can be processed using membrane technology, which has many industrial uses, such as desalination of salt water.
The following steps are considered in the design of a distillation column:
- Calculation of the number of plates;
- Estimation of the column diameter;
- Estimation of the liquid flow pattern;
- Provisional plate design;
- Calculation of the weeping point;
- Calculation of the plate pressure drop;
- Calculation of the downcomer liquid backup;
- Calculation of the height of the column;
- Trail layout perforated area;
- Tray column specification sheet.
2.14. Calculation of the Number of Plates
For the calculation of the number of plates, the Fenske–Underwood–Gilliland (FUG) method is used. It is not a simple method but a mixture of three equations, namely the Fenske, Underwood, and Gilliland equations.
Table 8 summarizes the specifications for the distillation column, including the feed temperature, pressure, and composition. The specifications are important for determining the number of plates required for the column. Table 9 summarizes the composition of the feed stream to the distillation column.
Table 8.
Specifications.
Table 9.
Feed composition.
Here as shown in Table 10, we use methane as the light key and toluene as the heavy key.
Table 10.
Light key (LK) and heavy key (HK).
The minimum number of plates is calculated using the Fenske equation:
where Nmin = 7.28 stages.
Calculations of the minimum and actual reflux ratio are shown below.
The minimum reflux ratio is calculated using the Underwood method.
where Rmin = 0.191047619.
Assume that
R = 1.4 × Rmin
R = 1.4 × 0.19
R = 0.26. Here, R is the actual reflux ratio.
2.15. Calculation of the Theoretical Number of Plates
Using the Gilliland equation, we can calculate the actual number of stages:
where:
R − Rmin/R + 1 = 0.060;
N − Nmin/N + 1 = 0.597;
N = 20.56 stages.
2.16. Feed Tray Location
According to the Kirkbride method, the feed tray is now within reach. The bottom and distillate molar flow rates (B and D, respectively) and the number of flow rates (NW and ND) both above and beneath the feed tray (13 stages above and 7 stages below, with the feed entering at stage 13) are correlated:
where:
ND/NW = 0.53;
NW = 13.43 plates;
ND = 7.12 plates.
2.17. Tray Selection
There are three types of trays [19]:
- Bubble cap;
- Sieve tray;
- Valve.
The net vapor velocity under flood condition is presented in Table 11. However, Table 12 and Table 13 are illustrating the net column area and the height of the column, respectively.
Table 12.
Net column area.
Table 13.
Height of the column.
Table 11.
Net vapor velocity under flood conditions.
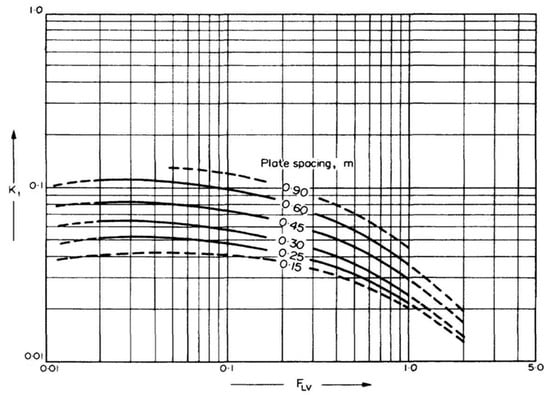
Figure 5.
Tray spacing under flooding condition.
Table 11.
Net vapor velocity under flood conditions.
| Parameter | Value | Unit |
|---|---|---|
| Pv | 0.657 | kg/m3 |
| Pl | 867 | kg/m3 |
| (L/V) × (pV/pL)0.5 | 0.0058 | --- |
| From Figure 5 | ||
| Csb | 0.08 | m/s |
| Surface tension | 6 | dyne/cm |
| Vn, f | 2.28 | m/s |
Net Velocity
The net velocity is between 50% and 90%.
V, n = 1.826696832 m/s
Cross-Sectional Area
The downcomer area occupies 15% of the cross-sectional area:
Ac = 395.9615673 m2.
Diameter of the Column:
D = 6.468041363 m.
Pressure drop calculation is shown in Table 14 as follows:
Table 14.
Pressure drop calculation.
All the specifications are provided in Table 15 below.
Table 15.
Data specifications.
2.18. Design of Catalytic Batch Reactor
The localized fluctuations in temperature and species concentration in a batch reactor can be ignored because of the high degree of mixing that occurs during the process. The reactor’s construction details are outlined below. The various reactor design equations are represented by the letters A–F, as shown below:
Reactor design equations:
2.19. Mole Balance
The molecular balances of the reactants and products are illustrated in Table 16 as follows:
Table 16.
Mole balance of the reactions.
2.20. Net Rate Laws
This section presents the net rate laws for the proposed reaction. Table 17 illustrates the rate law applied formula’s.
Table 17.
Rate law applied.
2.21. Rate Laws
The net rate laws are used to calculate the rate of reaction and to determine the optimum operating conditions for the reactor as shown in Table 18.
Table 18.
Reaction rate.
The conclusive rate constants of the reaction are shown in Table 19.
Table 19.
Reaction rate constants.
2.22. Stoichiometry Calculations
This section presents the stoichiometry calculations for the proposed reaction. Table 20 represents the stoichiometry calculations that are used to determine the moles of each reactant and product that are produced in the reaction.
Table 20.
Stoichiometry.
2.23. Reactor Component Compositions
This section presents the reactor component compositions for the proposed reaction. The reactor component compositions are used to determine the concentration of each reactant and product in the reactor. Table 21 shows the mole fractions of each reactant and product in the reactor at different time intervals.
Table 21.
Composition of reactor components.
2.24. Pressure Drop Calculations
The pressure drop calculations section presents the pressure drop calculations for the proposed reactor. The pressure drop is affected by the catalyst specifications and the steam requirements for heating. Table 22 lists the properties of the catalyst, which affect the rate of reaction. Table 23 lists the amount of steam required to heat the reactor, which also affects the pressure drop. The pressure drop can be calculated using the Ergun differential equation:
dy/dw = −(α/2y) × (T/To) × (FT/FTo).
Table 22.
Catalyst specifications.
Table 23.
Steam requirements for heating.
The pressure drop is 200 Pa.
3. Results and Discussion
Pyrolysis is an effective method for converting plastic waste into alkyl aromatics. During pyrolysis, long-chain compounds in plastics are broken down into alkenes, alkanes, and high-boiling-point compounds, which are heavy fuel fractions commonly used in the energy industry. However, the primary products obtained in our controlled reaction are alkyl aromatics [20].
Plastic waste can also be transformed into various carbon compounds, including amorphous and multiwalled carbon nanotubes. Graphitic carbon materials such as carbon nanotubes and graphene, as well as amorphous carbons like activated carbon, spherical carbon, and carbon fibers, can be derived from plastic waste. These carbonization processes involve pyrolysis and carbonization, generating hydrocarbon (HC) gases and a carbon-rich byproduct (carbon material). The three main types of carbonization processes are anoxic hydrolysis, catalytic carbonization, and pressure carbonization.
Through pyrolysis, the plastic waste is converted into alkyl aromatics. Pyrolysis breaks long-chain compounds into alkenes, alkanes, and high-boiling-point compounds, which are composed of carbon, with a carbon number greater than or equal to 24. These fractions are typically classified as heavy fuel fractions and are put to extensive use in the energy industry. In contrast, the reaction proposed herein occurs under strictly controlled circumstances, and the primary products are alkyl aromatics [20].
Carbon compounds such as amorphous and multiwalled carbon nanotubes can be created from plastic waste. Carbon nanotubes and graphene are examples of graphitic carbon materials, while amorphous carbons like activated carbon, spherical carbon, and carbon fibers fall into another category.
Carbonization refers to a group of procedures used to create carbon materials; these processes often involve pyrolysis and carbonization. This procedure generates several types of hydrocarbon (HC) gases and a carbon-rich byproduct (carbon material). There are three main types of carbonization processes: anoxic hydrolysis, catalytic carbonization, and pressure carbonization.
3.1. Reactor
The material and energy balance of the reactor is an important tool for understanding the performance of the reactor. Table 24 summarizes the mass and energy flows into and out of the reactor. The table also shows the heat of reaction and the heat losses from the reactor.
Table 24.
Material and energy balance of the reactor.
3.2. Absorption Column
The material and energy balance of the absorption column is an important tool for understanding the performance of the column. Table 25 summarizes the mass and energy flowing into and out of the column. The table also shows the heat of absorption and the heat losses from the column.
Table 25.
Material and energy balance of the absorption column.
3.3. Distillation Column
The material and energy balance of the distillation column is an important tool for understanding the performance of the column. Table 26 summarizes the mass and energy flowing into and out of the column. The table also shows the heat of condensation and the heat losses from the column.
Table 26.
Material and energy balance of the distillation column.
Figure 6 shows that as the weight of the catalyst increases, the conversion rate of the reaction increases because the number of active sites available for the reaction also increases.

Figure 6.
Conversion versus catalyst weight.
Likewise, Figure 7 shows that as the volume of the reactor increases, the conversion rate of the reaction increases because the number of active sites available for the reaction also increases.
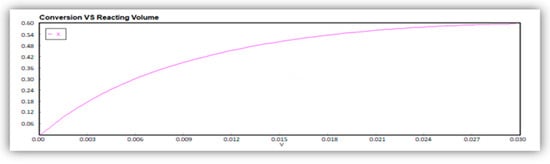
Figure 7.
Conversion versus reactor volume.
3.4. Comparisons
The proposed plant design is similar to other pyrolysis plants in that it uses a high temperature to convert plastic waste into valuable chemicals. However, the proposed plant design differs from other pyrolysis plants in the following ways:
- The proposed plant design uses controlled partial depolymerization, which results in a higher yield of alkyl aromatics;
- The proposed plant design uses dimensionless numbers to optimize the process, resulting in improved energy efficiency and product quality.
Table 27 compares the proposed plant design with other pyrolysis plants:
Table 27.
Comparison of the proposed plant design with other pyrolysis plants.
4. Conclusions
In this study, we have presented the design overview and estimation of design parameters for a plant aimed at converting plastic waste into useful chemicals, specifically alkyl aromatics. The major components of the plant include a batch catalytic reactor, a shell and tube heat exchanger, and a distillation column. Regarding the design of the heat exchanger, we considered various selection criteria, such as thermal and hydraulic requirements, material capability, operational maintenance, and availability. Shell and tube heat exchangers were chosen due to their durability and high-pressure capabilities. The design considerations for the tubes in the thermal systems included different configurations, diameters, number, length, pitch, and arrangements. Tube-side calculations were performed to determine parameters such as the Prandtl number, Reynolds number, Nusselt number, and overall heat transfer coefficient.
For the distillation column design, we followed a step-by-step process, including calculations of the number of plates, column diameter, liquid flow pattern, provisional plate design, weeping point, plate pressure drop, downcomer liquid backup, and column height. The Fenske–Underwood–Gilliland (FUG) method was used to calculate the minimum number of plates, and the Kirkbride method was used to determine the feed tray location. Tray type, net vapor velocity, and column area were also determined. In the design of the catalytic batch reactor, rate laws and stoichiometry calculations were employed to analyze the reactions and determine the reaction rate constants. Material and energy balances were performed for the reactor, absorption column, and distillation column. Pressure drop calculations were conducted using the Ergun equation.
The results and discussions presented quantitative data, including mass flow rates, the molar flow rates, heat duties, and compositions of various components in the reactor, absorption column, and distillation column. Additionally, graphs were provided to visualize the relationship between catalyst weight and conversion rate, as well as reactor volume and conversion rate. Based on the obtained results, we conclude that the proposed plant design for the conversion of plastic waste into alkyl aromatics is highly efficient in terms of energy utilization and product quality. The use of controlled partial depolymerization at a temperature of 280 °C allows for a higher yield of alkyl aromatics compared to other pyrolysis plants operating at higher temperatures. Design optimization using dimensionless numbers further contributes to improved energy efficiency and product quality.
Our process of converting waste plastic into alkyl aromatics offers several positive socioeconomic implications. First, it has the potential to generate employment opportunities in various sectors, such as municipal, engineering, commercial, and industrial sectors. This can have a significant impact on the local economy, particularly in Oman, where there is a high demand for alkyl aromatics and a need to address the issue of plastic waste. The cost-effectiveness of our process allows for the production of alkyl aromatics at low prices, making the project profitable and economically viable. Furthermore, the alkyl aromatics produced through our process possess several environmentally friendly characteristics. These include their hardness, light weight, resilience to water and chemicals, heat and cold resistance, low electrical and thermal conductivity, simplicity of production, impressive color variety, design versatility, durability, and energy efficiency. These properties make them a desirable alternative to traditional materials in various applications, such as packaging materials, agriculture, construction, insulation, the car industry, electrical gadgets, textiles, sports equipment, and toys. However, there are certain limitations and challenges that should be considered for future research and implementation. The current study focused on the conversion process itself and its socioeconomic implications, but further research is needed to address issues such as scalability, waste management, and the long-term environmental impact of the process. Additionally, more in-depth analyses and quantitative results should be conducted to provide a comprehensive understanding of the technique and its potential benefits.
Looking ahead, it is essential to have a clear vision for the future of this research. Future studies should aim to overcome the limitations and challenges identified herein, working towards a sustainable and efficient solution for plastic waste management. The development of more theoretical contributions should be considered, exploring novel approaches and technologies that can further improve the conversion process and enhance the environmental and socioeconomic outcomes. In summary, our project aims to tackle the global problem of plastic pollution while creating value from waste materials. By converting waste plastic into alkyl aromatics, we can contribute to the economy, reduce plastic waste, and offer environmentally friendly alternatives for various applications. Continued research and development in this field are crucial to fully realize the potential of this innovative approach and address the challenges associated with plastic waste.
Author Contributions
Conceptualization, S.A.S.A.; Methodology, S.A.S.A. and K.M.A.; Validation, M.K.M.B.J.A.; Formal analysis, M.K.M.B.J.A.; Writing—original draft, K.M.A. All authors have read and agreed to the published version of the manuscript.
Funding
This research received no external funding.
Institutional Review Board Statement
Not Applicable.
Informed Consent Statement
Not Applicable.
Data Availability Statement
Not Applicable.
Conflicts of Interest
The authors declare no conflict of interest.
References
- Zhang, F.; Zeng, M.Z.; Yappert, R.D.; Sun, J.; Lee, Y.-H.; LaPointe, A.M.; Peters, B.; Abu-Omar, M.M.; Scott, S.L. Polyethylene upcycling to long-chain alkylaromatics by tandem hydrogenolysis/aromatization. Science 2020, 370, 437–441. [Google Scholar] [CrossRef]
- Yang, W.; Kim, K.-H.; Lee, J. Upcycling of Decommissioned Wind Turbine Blades through Pyrolysis. J. Clean. Prod. 2022, 376, 134292. [Google Scholar] [CrossRef]
- Attanayake, D.D.; Sewerin, F.; Kulkarni, S.; Dernbecher, A.; Dieguez-Alonso, A.; van Wachem, B. Review of Modelling of Pyrolysis Processes with CFD-DEM. Flow Turbul. Combust. 2023, 111, 355–408. [Google Scholar] [CrossRef]
- Abreu, A.; Pedrotti, M.L. Microplastic in the oceans: The solution lie on land. Field Actions Sci. Rep. 2019, 2, 62–67. [Google Scholar]
- Jubinville, D.; Esmizadeh, E.; Tzoganakis, C.; Mekonnen, T. Thermo-mechanical recycling of polypropylene for the facile and scalable fabrication of highly loaded wood plastic composites. Compos. Part B Eng. 2021, 219, 108873. [Google Scholar] [CrossRef]
- Bora, R.R.; Wang, R.; You, F. Waste Polypropylene Plastic Recycling toward Climate Change Mitigation and Circular Economy: Energy, Environmental, and Technoeconomic Perspectives. ACS Sustain. Chem. Eng. 2020, 8, 16350–16363. [Google Scholar] [CrossRef]
- Li, P.; Wang, X.; Su, M.; Zou, X.; Duan, L.; Zhang, H. Characteristics of Plastic Pollution in the Environment. Bull. Environ. Contam. Toxicol. 2020, 107, 577–584. [Google Scholar] [CrossRef]
- Vollmer, I.; Jenks, M.J.F.; Roelands, M.C.P.; White, R.J.; van Harmelen, T.; de Wild, P.; van der Laan, G.P.; Meirer, F.; Keurentjes, J.T.F.; Weckhuysen, B.M. Giving New Life to Plastic Waste. Angew. Chem. Int. Ed. Engl. 2020, 59, 15402–15423. [Google Scholar] [CrossRef]
- Allen, S.; Allen, D.; Phoenix, V.R.; Le Roux, G.; Jiménez, P.D.; Simonneau, A.; Binet, S.; Galop, D. Atmospheric transport and deposition of microplastics in a remote mountain catchment. Nat. Geosci. 2019, 12, 339–344. [Google Scholar] [CrossRef]
- Syafrudin, N.H.A. A Review on Landfill Management in the Utilization of Plastic Waste as an Alternative Fuel. E3S Web Conf. 2018, 31, 6. [Google Scholar]
- Sakulkit, P.; Palamanit, A.; Dejchanchaiwong, R.; Reubroycharoen, P. Characteristics of Pyrolysis Products from Pyrolysis and Co-Pyrolysis of Rubber Wood and Oil Palm Trunk Biomass for Biofuel and Value-Added Applications. J. Environ. Chem. Eng. 2020, 8, 104561. [Google Scholar] [CrossRef]
- Akdogan, Z.; Guven, B. Microplastics in the environment: A critical review of current understanding and identification of future research needs. Environ. Pollut. 2019, 254, 113011. [Google Scholar] [CrossRef] [PubMed]
- Bai, M.; Li, D. Quantity of plastic waste input into the ocean from China based on a material flow analysis model. Anthr. Coasts 2020, 3, 1–5. [Google Scholar] [CrossRef]
- Raza, M.; Inayat, A.; Ahmed, A.; Jamil, F.; Ghenai, C.; Naqvi, S.R.; Shanableh, A.; Ayoub, M.; Waris, A.; Park, Y.-K. Progress of the Pyrolyzer Reactors and Advanced Technologies for Biomass Pyrolysis Processing. Sustainability 2021, 13, 11061. [Google Scholar] [CrossRef]
- Hasan, M.M.; Rasul, M.G.; Khan, M.M.K.; Ashwath, N.; Jahirul, M.I. Energy Recovery from Municipal Solid Waste Using Pyrolysis Technology: A Review on Current Status and Developments. Renew. Sustain. Energy Rev. 2021, 145, 111073. [Google Scholar] [CrossRef]
- Seay, J. Emerging Economies Convert Plastic Waste into Fuel; Engineering for Change: New York, NY, USA, 2019. [Google Scholar]
- Cai, L.; Wang, J.; Peng, J.; Wu, Z.; Tan, X. Observation of the degradation of three types of plastic pellets exposed to UV irradiation in three different environments. Sci. Total Environ. 2018, 628, 740–747. [Google Scholar] [CrossRef]
- De la Rosa, J.M.; Sánchez-Martín, Á.; Campos, P.; Miller, A.Z. Effect of Pyrolysis Conditions on the Total Contents of Polycyclic Aromatic Hydrocarbons in Biochars Produced from Organic Residues: Assessment of Their Hazard Potential. Sci. Total Environ. 2019, 667, 578–585. [Google Scholar] [CrossRef]
- Maqsood, T.; Dai, J.; Zhang, Y.; Guang, M.; Li, B. Pyrolysis of Plastic Species: A Review of Resources and Products. J. Anal. Appl. Pyrolysis 2021, 159, 105295. [Google Scholar] [CrossRef]
- Gwada, B.; Ogendi, G.; Makindi, S.M.; Trott, S. Composition of plastic waste discarded by households and its management approaches. Glob. J. Environ. Sci. Manag. 2019, 5, 83–94. [Google Scholar]
- Palamanit, A.; Khongphakdi, P.; Tirawanichakul, Y.; Phusunti, N. Investigation of Yields and Qualities of Pyrolysis Products Obtained from Oil Palm Biomass Using an Agitated Bed Pyrolysis Reactor. Biofuel Res. J. 2019, 6, 1065–1079. [Google Scholar] [CrossRef]
- Gholizadeh, M.; Li, C.; Zhang, S.; Wang, Y.; Niu, S.; Li, Y.; Hu, X. Progress of the Development of Reactors for Pyrolysis of Municipal Waste. Sustain. Energy Fuels 2020, 4, 5885–5915. [Google Scholar] [CrossRef]
- Sharifzadeh, M.; Sadeqzadeh, M.; Guo, M.; Borhani, T.N.; Murthy Konda, N.V.S.N.; Garcia, M.C.; Wang, L.; Hallett, J.; Shah, N. The Multi-Scale Challenges of Biomass Fast Pyrolysis and Bio-Oil Upgrading: Review of the State of Art and Future Research Directions. Prog. Energy Combust. Sci. 2019, 71, 1–80. [Google Scholar] [CrossRef]
- Garg, S.; Nayyar, A.; Buradi, A.; Shadangi, K.P.; Sharma, P.; Bora, B.J.; Jain, A.; Asif Shah, M. A Novel Investigation Using Thermal Modeling and Optimization of Waste Pyrolysis Reactor Using Finite Element Analysis and Response Surface Methodology. Sci. Rep. 2023, 13, 10931. [Google Scholar] [CrossRef] [PubMed]
- Wang, S.; Wu, K.; Chu, S.; Yu, J.; Wang, Y.; Luo, B.; Zhang, H. Comprehensive DEM-CFD Model and Thermal Uniformity Optimization for Biomass Catalytic Pyrolysis Reactor. Energy Convers. Manag. 2023, 291, 117321. [Google Scholar] [CrossRef]
- Jalalifar, S.; Masoudi, M.; Abbassi, R.; Garaniya, V.; Ghiji, M.; Salehi, F. A Hybrid SVR-PSO Model to Predict a CFD-Based Optimised Bubbling Fluidised Bed Pyrolysis Reactor. Energy 2020, 191, 116414. [Google Scholar] [CrossRef]
- Gao, N.; Wang, F.; Quan, C.; Santamaria, L.; Lopez, G.; Williams, P.T. Tire Pyrolysis Char: Processes, Properties, Upgrading and Applications. Prog. Energy Combust. Sci. 2022, 93, 101022. [Google Scholar] [CrossRef]
- Wang, Y.; Yu, H.-Q.; Ke, L.; Peng, Y.; Liu, Y.; Wu, Q.H.; Tian, X.; Dai, L.; Ruan, R.; Jiang, L.J. Review on the Catalytic Pyrolysis of Waste Oil for the Production of Renewable Hydrocarbon Fuels. Fuel 2021, 283, 119170. [Google Scholar] [CrossRef]
- Jahirul, M.I.; Rasul, M.G.; Schaller, D.; Khan, M.M.K.; Hasan, M.M.; Hazrat, M.A. Transport Fuel from Waste Plastics Pyrolysis—A Review on Technologies, Challenges and Opportunities. Energy Convers. Manag. 2022, 258, 115451. [Google Scholar] [CrossRef]
Disclaimer/Publisher’s Note: The statements, opinions and data contained in all publications are solely those of the individual author(s) and contributor(s) and not of MDPI and/or the editor(s). MDPI and/or the editor(s) disclaim responsibility for any injury to people or property resulting from any ideas, methods, instructions or products referred to in the content. |
© 2023 by the authors. Licensee MDPI, Basel, Switzerland. This article is an open access article distributed under the terms and conditions of the Creative Commons Attribution (CC BY) license (https://creativecommons.org/licenses/by/4.0/).