Article

Development of Prediction Models for the Pasting Parameters of Rice Based on Near-Infrared and Machine Learning Tools

1
Instituto Nacional de Investigação Agrária e Veterinária (INIAV), Av. da República, Quinta do Marquês, 2780-157 Oeiras, Portugal
2
GREEN-IT BioResources for Sustainability Unit, Institute of Chemical and Biological Technology António Xavier, ITQB NOVA, Av. da República, 2780-157 Oeiras, Portugal
3
Computação e Cognição Centrada nas Pessoas, BioRG—Biomedical Research Group, Lusófona University, Campo Grande, 376, 1749-019 Lisbon, Portugal
4
Centre for the Research and Technology of Agro-Environmental and Biological Sciences, University of Trás-os-Montes and Alto Douro (CITAB-UTAD), 5000-801 Vila Real, Portugal
*
Author to whom correspondence should be addressed.
Appl. Sci. 2023, 13(16), 9081; https://doi.org/10.3390/app13169081
Submission received: 12 March 2023 / Revised: 11 June 2023 / Accepted: 14 June 2023 / Published: 9 August 2023
(This article belongs to the Special Issue Spectral Detection: Technologies and Applications)

Abstract

:
Due to the importance of rice (Oryza sativa) in food products, developing strategies to evaluate its quality based on a fast and reliable methodology is fundamental. Herein, near-infrared (NIR) spectroscopy combined with machine learning algorithms, such as interval partial least squares (iPLS), synergy interval PLS (siPLS), and artificial neural networks (ANNs), allowed for the development of prediction models of pasting parameters, such as the breakdown (BD), final viscosity (FV), pasting viscosity (PV), setback (ST), and trough (TR), from 166 rice samples. The models developed using iPLS and siPLS were characterized, respectively, by the following regression values: BD (R = 0.84; R = 0.88); FV (R = 0.57; R = 0.64); PV (R = 0.85; R = 0.90); ST (R = 0.85; R = 0.88); and TR (R = 0.85; R = 0.84). Meanwhile, ANN was also tested and allowed for a significant improvement in the models, characterized by the following values corresponding to the calibration and testing procedures: BD (Rcal = 0.99; Rtest = 0.70), FV (Rcal = 0.99; Rtest = 0.85), PV (Rcal = 0.99; Rtest = 0.80), ST (Rcal = 0.99; Rtest = 0.76), and TR (Rcal = 0.99; Rtest = 0.72). Each model was characterized by a specific spectral region that presented significative influence in terms of the pasting parameters. The machine learning models developed for these pasting parameters represent a significant tool for rice quality evaluation and will have an important influence on the rice value chain, since breeding programs focus on the evaluation of rice quality.

1. Introduction

The assessment of quality traits in rice (Oryza sativa L.) can be considered a very important issue, as these parameters play an important role for both consumers and industry. The assessment of these traits can be performed by the measurement of the physical parameters of the grain, its biochemical composition, its cooking properties, and its milling performance. The most interesting quality parameters are related to physical properties (weight, grain volume), appearance (color, size, shape, smoothness, and hardness), flow properties, biochemical composition (moisture, lipids, protein, ash, and amylose content), temperature of gelatinization, pasting viscosity, and gel consistency [1]. The pasting properties of rice are by far some of the most interesting rice quality traits, as they define the capacity of the rice for applications in food processing and other industries, and they are also used to explain rice aging [2]. The pasting profile displays the physicochemical changes in the aqueous suspension of starch at a certain temperature and time, allowing for an evaluation of the apparent viscosity [3]. In the food industry, the Rapid Visco Analyzer (RVA) is a suitable tool used to obtain information linked to the apparent viscosity, allowing for simulations of processing focusing on the structural properties and functionality [4]. The final viscosity (FV) is usually used to characterize the quality of samples and their capacity to develop into a viscous gel after cooking and cooling processes. The setback (ST) region is commonly defined as the pasting curve region between the trough (TR) and FV. The breakdown (BD) parameter, which represents the difference between the pasting viscosity (PV) and TR, evaluates the ease of upsetting swollen starch granules, showing the stability degree through cooking [5]. The peak time and PV, as integral parts of the pasting profile, have been linked with water absorption capacity—which is considered an important parameter for the development of rice-based products—as they may inform the future behavior of a paste during and after processing. Pasting properties are also related to other sensory qualities of rice besides texture, as rice with a higher taste evaluation tends to present a significant amylose content, which presents a correlation with PV, hold viscosity, FV, and BD, as well as the pasting temperature, peak time, and protein content [6]. The viscosity of a gel depends on the gelatinization stage of the starch and the extent of its molecular BD. Starch gelatinization and degradation can be related to a decrease in the PV and the FV, depending on the rice type. The end-use quality of food, such as the texture of cooked rice and noodles, has also been evaluated on the basis of its pasting properties [4].
Considering that the RVA procedure is a time-consuming process, rapid methodologies, such as near-infrared (NIR) spectroscopy, have been explored through routinary models for the evaluation of quality properties in cereals [7]. The infrared spectra methodology is considered a detailed analysis tool for quality control and represents excellent potential for use in the assessment of sample properties in breeding programs and industry based on reliable and fast techniques [8]. For agricultural product analysis, NIR spectroscopy has been broadly used due to its advantages related to sample preparation, including being faster and easier to manipulate, non-destructive, and accurate. This technology, based on a single spectrum, also allows for the evaluation of several properties relating to rice quality [9,10].
Partial least squares (PLS) regression is an algorithm that estimates and quantifies the components in a particular sample [11]. By using suitable algorithms, it is possible to select the spectral region associated with a significant improvement in the performance of the full-spectrum calibration techniques, preventing non-modelled interference and creating an adjusted model [12]. A significant improvement to the calibration step, using the full spectrum, is possible based on a suitable algorithm [12]. These methods can be categorized as one wavelength or interval wavelength selection, such as interval PLS (iPLS) and synergy interval PLS (siPLS) [13].
Artificial neural networks (ANNs) are defined as non-parametric regression models that take any phenomenon to any accuracy degree without previous data on the phenomena. ANNs are especially useful for classification and function approximation/mapping problems, which are tolerant of some imprecision and have many training data available, but to which hard and fast rules cannot easily be applied [14]. A neural network is an adaptable system that learns relationships from input and output data sets and then can predict previously unseen experimental results with similar characteristics to the input set. ANNs accurately fit nonlinear variables, which is an advantage compared to multivariate linear analysis [14]. The quality analysis methods used in the food industry are time-consuming and highly expensive, as they require specific equipment and specialized labor. For this reason, the main goal of this study was to develop different models based on machine learning algorithms, such as iPLS, siPLS, and back-propagation ANN, combined with NIR spectroscopy to examine the rice pasting properties BD, FV, PV, TR, and ST, with each model characterized by a specific spectral region that presents a significative influence in terms of these pasting parameters. This strategy represents an important impact on the rice value chain (breeding programs, industry, and consumers), focusing on a non-destructive technique for the evaluation of rice quality.

2. Materials and Methods

2.1. Rice Sample Preparation and Quality Evaluation

The 166 rice samples used in this study belonged to the Portuguese Rice Breeding Program and were harvested in three regions (Alcácer do Sal, Salvaterra-de-Magos, and Montemor-o-Velho, Portugal) in 2014–2016. Samples were previously de-husked in a Satake mill (THU, Satake, Taito, Japan) and polished (Suzuki MT98, Santa Cruz do Rio Pardo, São Paulo, Brazil) to assess the milling yields and obtain milled (polished) rice. A Cyclone Sample Mill (falling number 3100, Perten, Stockholm, Sweden) with a 0.8 mm screen was used to obtain ground rice samples. The quality evaluation of the samples was performed immediately after the harvesting process. The moisture content of the rice samples ranged within 12–12.5%, as determined by the AACC International Method 44-15.02. A viscosity analyzer (RVA-4, Newport Scientific, Warriewood, Australia) was used to assess the paste gelatinization and viscosity properties. The AACC International Approved Method 61-02.01 was used to evaluate the PV, ST, BD, TR, and FV parameters [15].

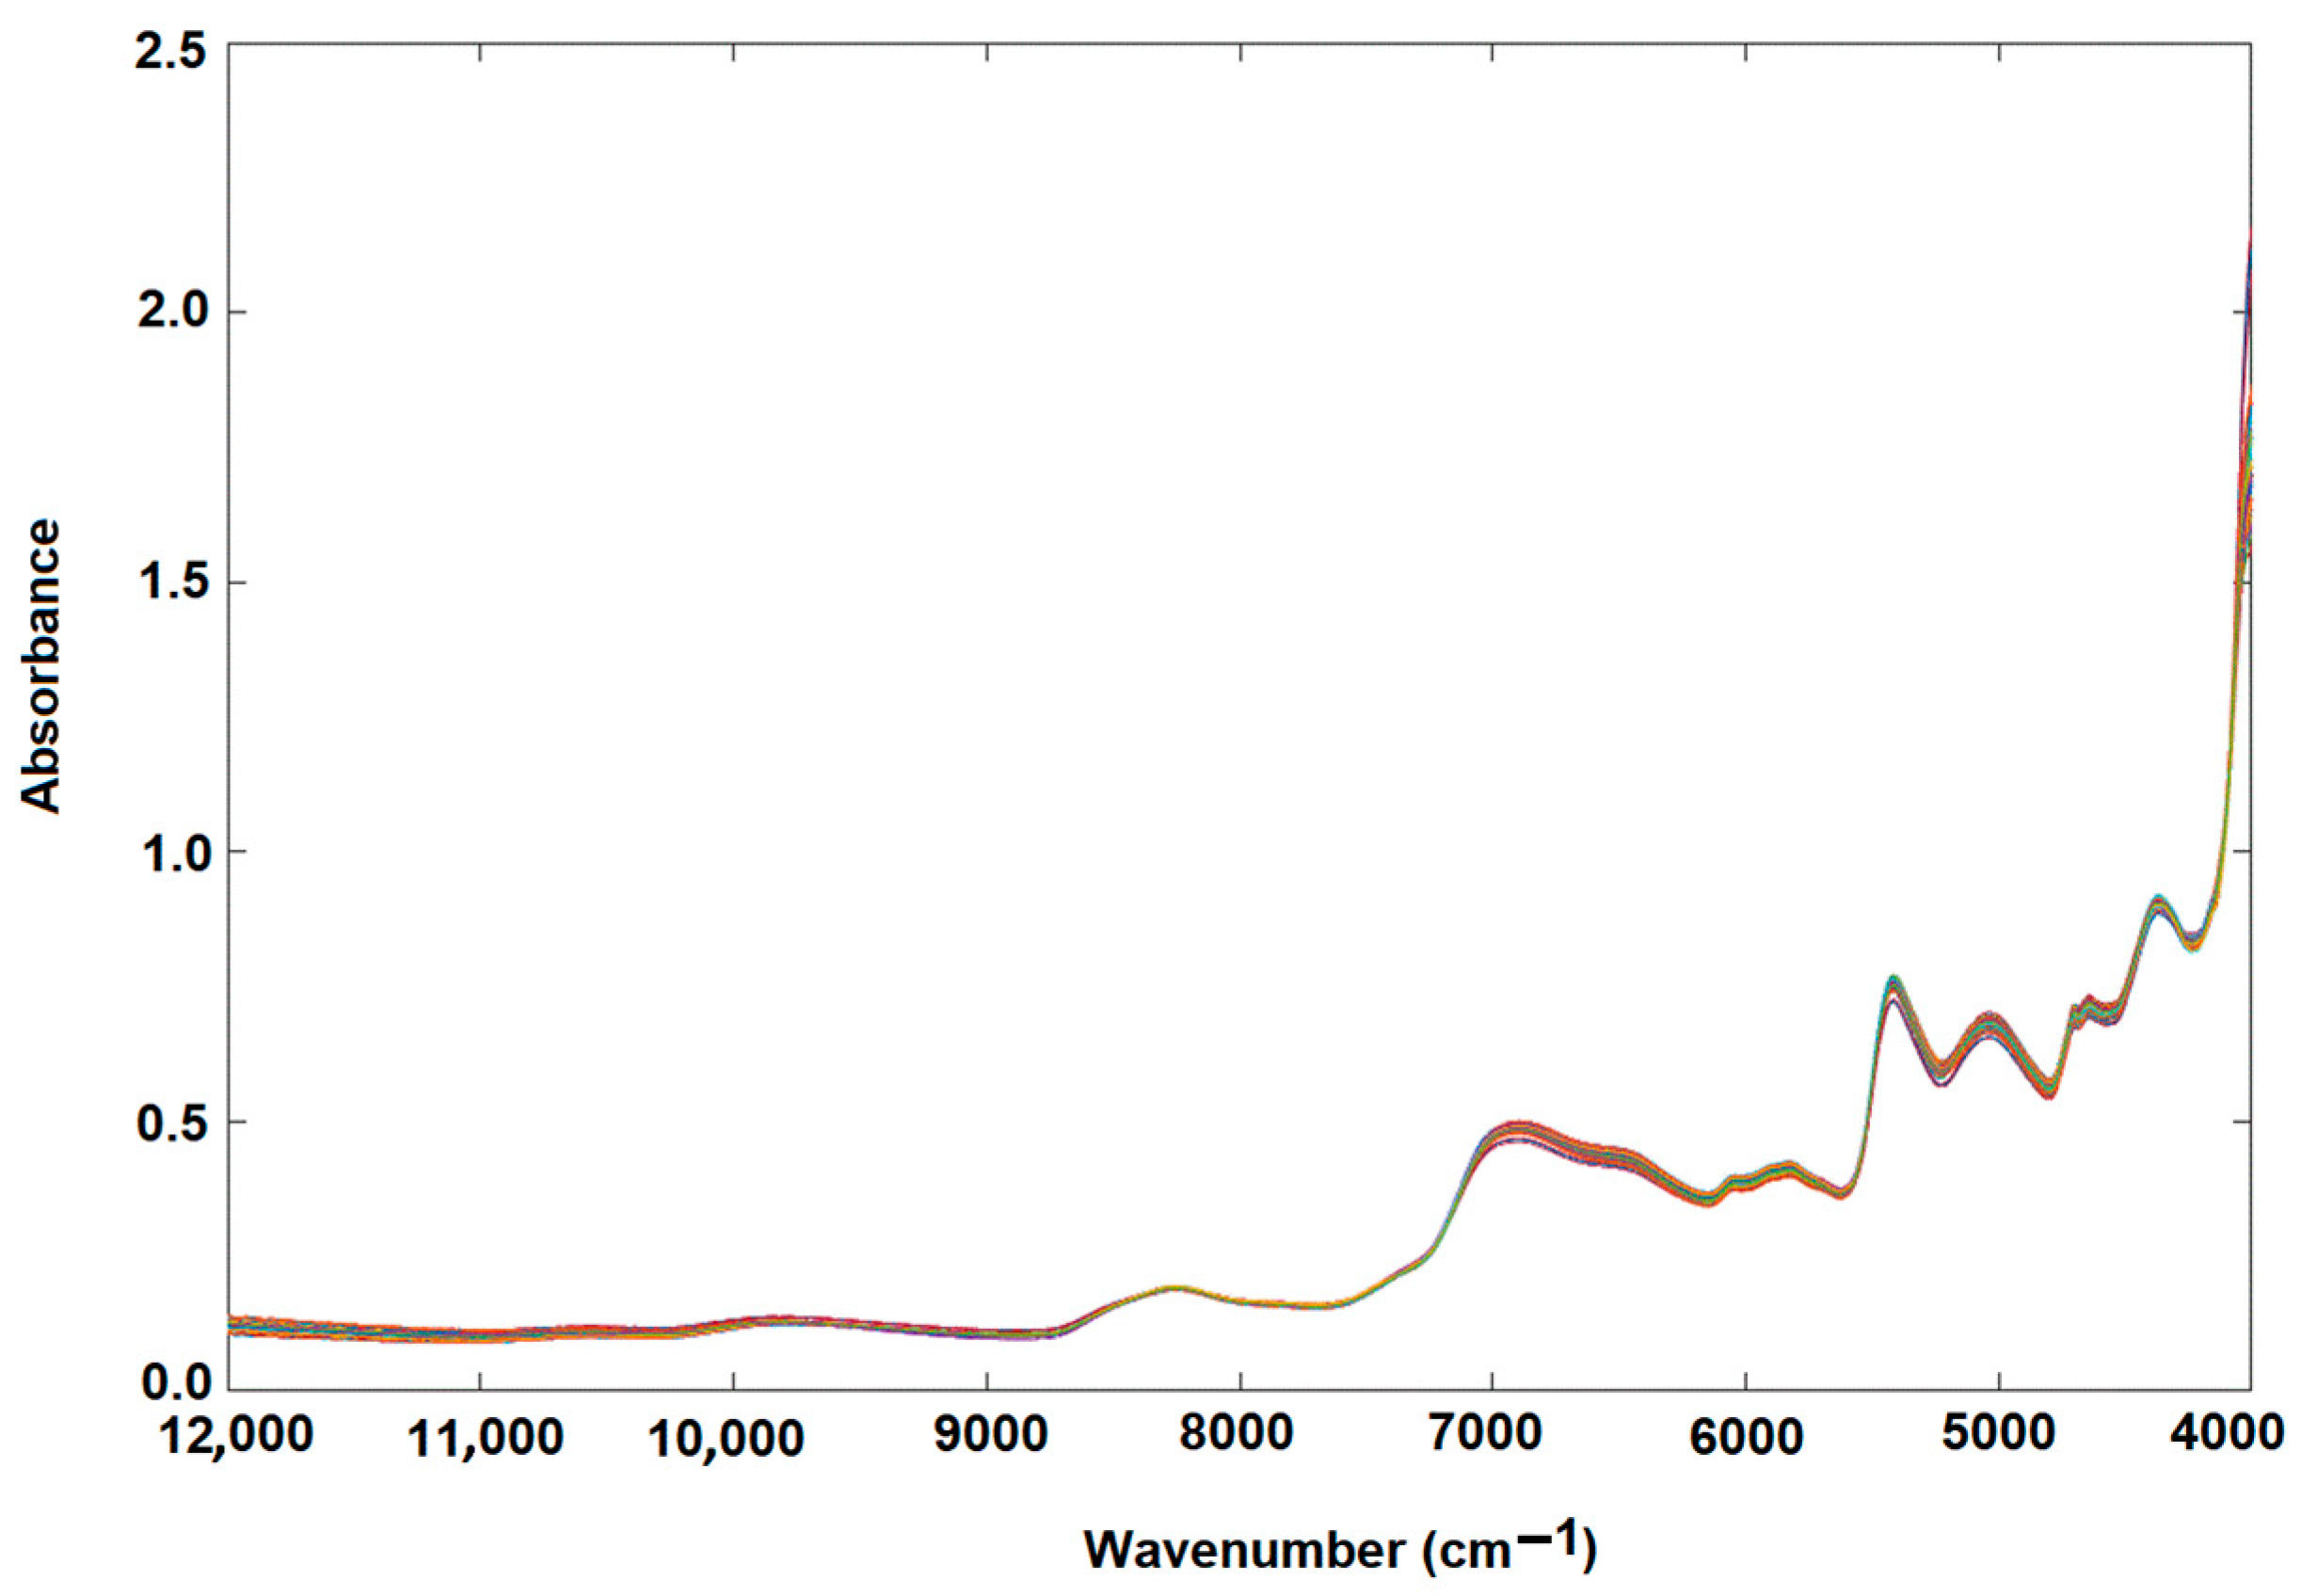
2.2. Near-Infrared Spectroscopy Analysis

An NIR transflection MPA apparatus (Bruker Optics, Ettlingen Germany) was used to register the infrared spectra of the rice flours. To register the spectrum for each sample, around 5 g of flour was introduced in the specific NIR container and compacted to obtain a similar packing density. NIR spectra were acquired in the range of 12,000–4000 cm−1, with a spectral resolution of 16 cm−1 and 16 scans [9]. The wavenumber range was segmented into 1154 data sets, where each interval represents 6.93 cm−1.

2.3. Data and Multivariate Analysis

Different algorithms, such as standard normal variate (SNV) transformation, multiplicative scatter correction (MSC), and smoothing derivative (1st and 2nd derivative), were used to improve the signal of the NIR raw spectra. This strategy is fundamental to obtaining reliable quantitative models [16]. MSC first performs a regression of a measured spectrum against the reference spectrum and then corrects the measured spectrum using the constructed linear regression model. MSC is carried out using Equations (1) and (2):
x i = 1 a i + X ¯ b i
x i M S C = ( x i 1 a i ) / b i
where xi represents the spectrum of sample i; ai and bi denote the intercept and slope, respectively; X ¯ is the mean of all spectra registered; the corrected spectrum is denoted by x i M S C ; and 1 is a vector of ones. The SNV transformation allows us to reduce the multiplicative effects of scattering of the particle size and, consequently, the differences in the global signals. Each spectrum is centered and scaled by dividing by its standard deviation. SNV is calculated using Equations (3) and (4):
x i ¯ = j = 1 m x i j m
x i j S N V = x i j x i ¯ j = 1 m x i j x i ¯ 2 m 1
where m represents the number of wavelengths, while xij and xij (SNV) are the measured and corrected reflectance, respectively, of the jth wavelength for sample i.

2.4. Partial Least Squares—Selection of the Wavenumber Interval

The PLS algorithm relies on the entire NIR spectrum to estimate the sample composition, being based on latent variables (LVs) [11]. The iPLS and siPLS algorithms allow an improvement in PLS performance and the elimination of inappropriate spectral variables. The iPLS models were constructed in 20 spectral intervals of a similar width, generating a graphical representation indicating the optimum number of LV and RMSECV values in each interval. The selected sub-intervals presented the lowest RMSECV values. The siPLS models were developed based on the spectral set divided into 20 intervals and combinations of 3 intervals. The combined sub-intervals defined by the lowest RMSECV values were selected [13]. The performance of the final PLS model was evaluated based on the RMSECV and the correlation coefficient (R), defined by
RMSECV = i = 1 n ( y i y ^ i ) 2 n 1
where n is the number of samples in the test set validation, yi corresponds to the reference measurement for the test set of sample i, and ŷi represents the estimated values for test sample i. The performance of the final iPLS and siPLS models was evaluated using the root-mean-square error of prediction (RMSEP) and the coefficient of determination (R2). RMSEP is defined as
RMSEP = i = 1 n ( y i y ^ i ) 2 n
The correlation coefficient (R) for calibration and test set evaluation is related to the predicted and measured data (Equation (7)). The parameter ȳ is the average of the reference data for all samples.
R = 1 i = 1 n ( y ^ i y i ) 2 i = 1 n ( y i y ¯ ) 2

2.5. Artificial Neural Network (ANN)

An ANN is defined by input, hidden, and output layers. The number of nodes in the input layer corresponds to the variables evaluated, while the number of neurons in the output layer is related to the parameters. In the hidden and output layers, each neuron is connected to all the nodes by an associated numerical weight. The input layer receives the initial data (spectral segment), the hidden layer processes the data, and the output layer presents the results of the model [14]. The number of neurons in the hidden layers was determined herein once the maximum values of the correlation coefficients were observed. Neural structures characterized by 10 hidden layers were selected. The wavenumber interval [12,000–4000 cm−1] was segmented into 1154 data sets, which were used as the input data for the ANN model. The output layer (1) was similar for all the models (1154:10:1). Multilayer perceptron (MLP) was used for the regression models, namely, the backpropagation learning algorithm. The Levenberg–Marquardt algorithm was used to train the neural networks, using 70% of a total of 326 input spectra. For each validation and testing step, 15% (49 spectra) were used. The multilayer feed-forward was trained using the Broyden–Fletcher–Goldfarb–Shanno (BFGS) learning algorithm (200 epochs). According to the correlation and root-mean-square error (RMSE), the best ANN models were developed, as defined by n (the number of observations) and ŷ (the output values in the test data), while y corresponds to the predicted output value (Equation (8)). A significance level of α = 0.05 was defined.
R M S E = i = 1 n y ^ y 2 n

2.6. Statistical Analysis

The iPLS, siPLS, and ANN models were defined and tested using MATLAB® software (R2017a) (MathWorks, Inc.; Natick, MA, USA). The iToolbox for MATLAB was used for interval selection URL (https://ucphchemometrics.com/186-2/algorithms/, accessed on 23 April 2023). The pasting properties were assessed in triplicate.

3. Results and Discussion

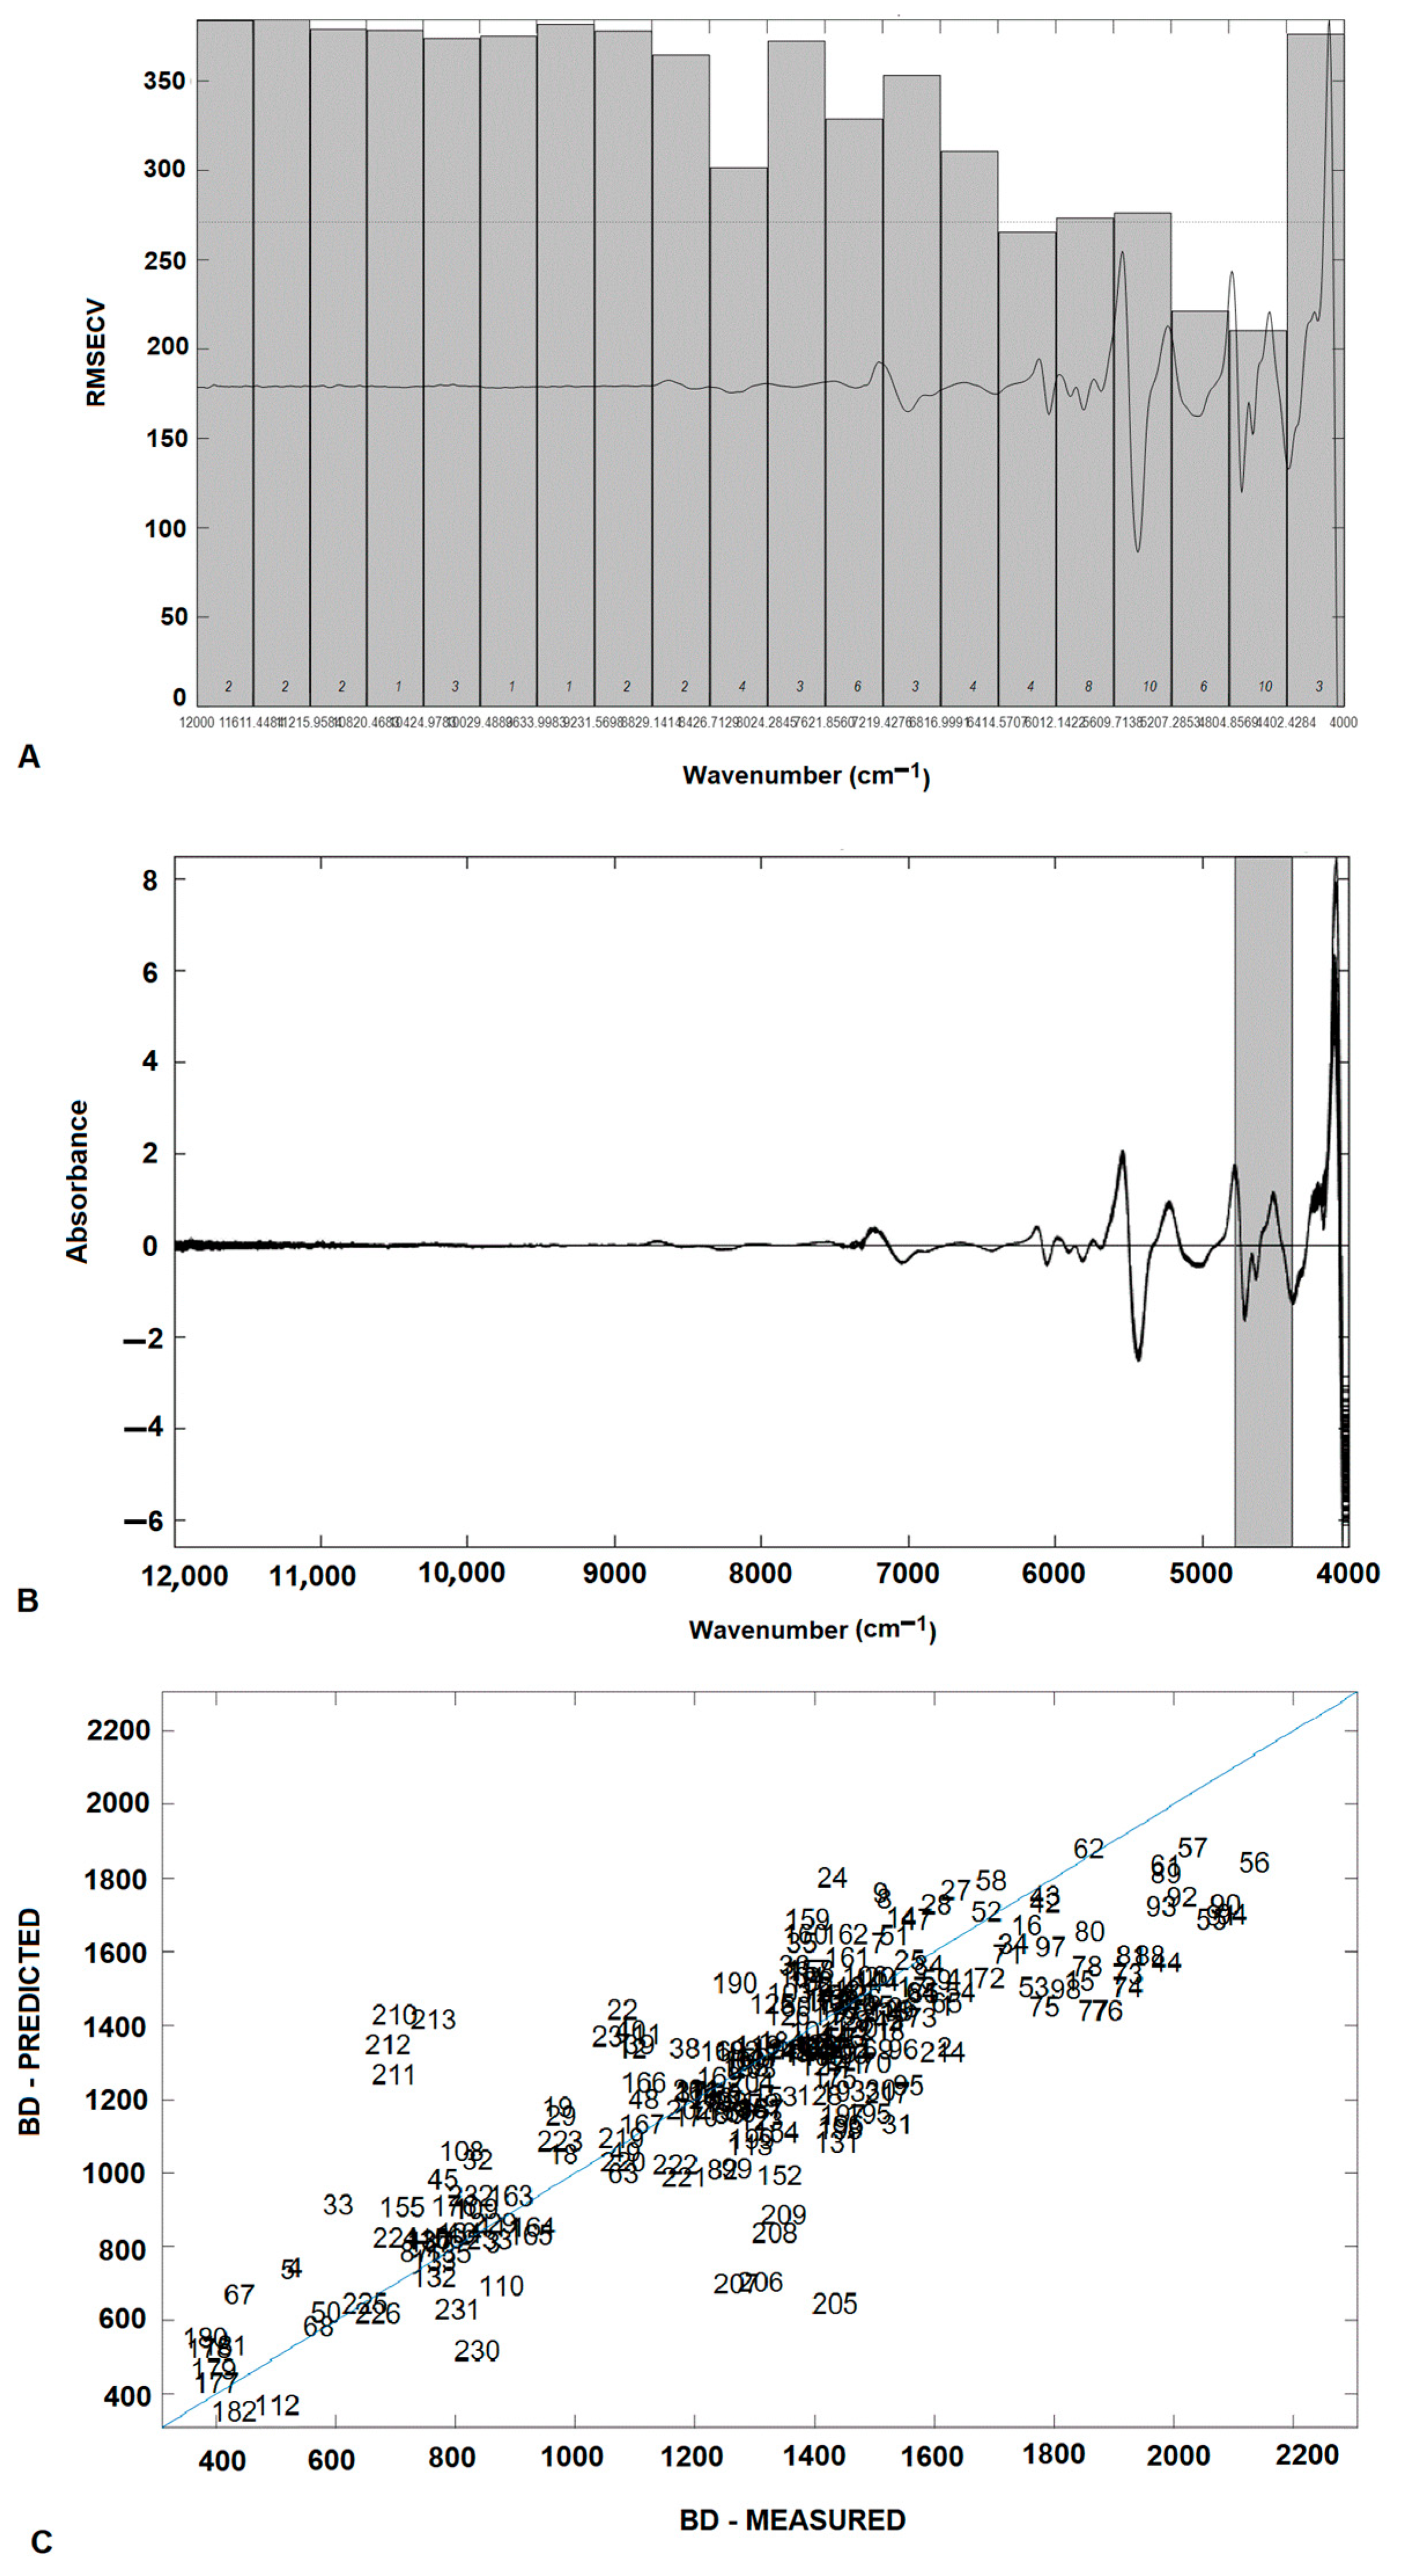
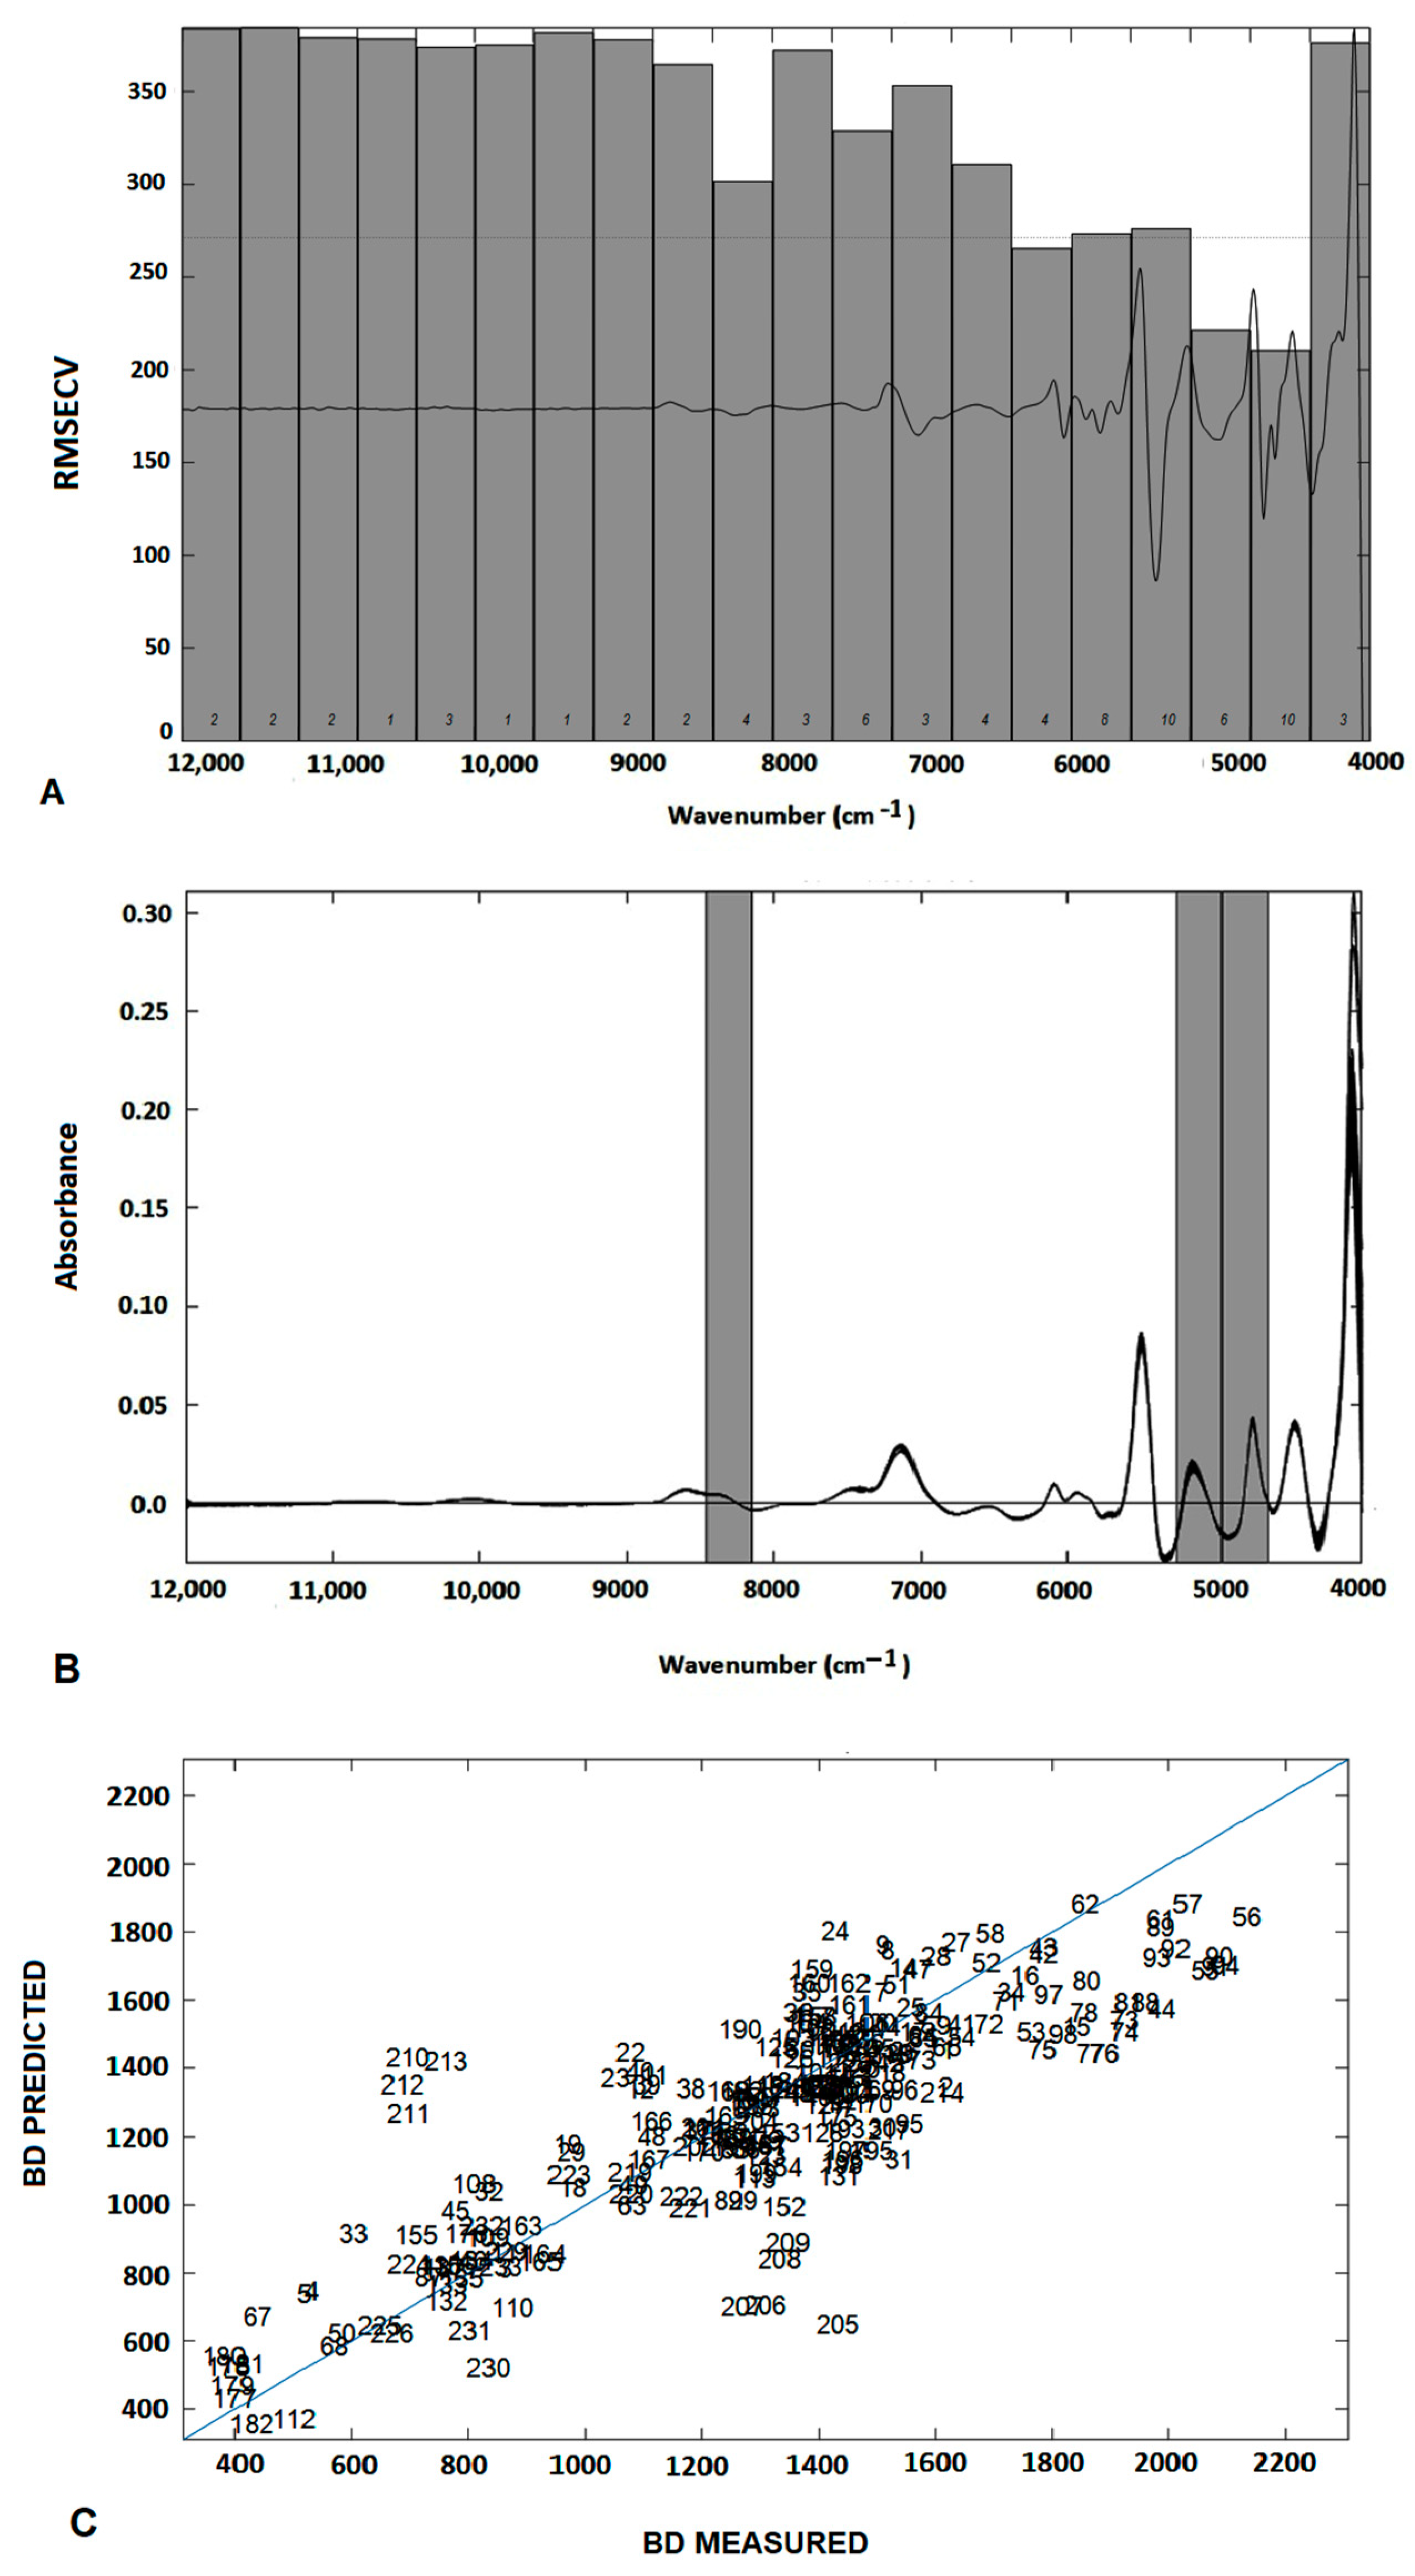
3.1. iPLS and siPLS Models

Different strategies were used to develop a suitable model for the evaluation of rice quality for industrial purposes. The raw NIR spectra of native rice flour were subjected to pre-processing procedures such as MSC plus second derivative and SNV plus second derivative, allowing for the removal of spectral noise and highlighting the differences among them (Figure 1).
The irrelevant spectral variables were removed by applying the iPLS and siPLS algorithms. The subintervals characterized by the optimum number of LVs and lowest RMSECV values were selected (Figure 2 and Figure 3). The iPLS algorithm allowed us to split the spectral region into 20 intervals of the same width; consequently, several PLS regression models were developed (Figure 2). The R and RMSECV for each sub-interval were established, and the region with the lowest RMSECV was selected (Table 1). The iPLS model for grain BD was developed after MSC plus second derivative spectral pre-processing and was characterized by R = 0.84, RMSECV = 102, and LV = 10. The RMSECV values were registered along several spectral intervals, being lowest at the region defined by 4784–4395 cm−1 (Figure 2A,B). The correlation between the reference and predicted values is presented in a scatter plot in Figure 2C. Meanwhile, the siPLS models were constructed after the spectrum was split into 20 equal intervals, characterized by high R and the lowest RMSECV values (Table 1). The model for the BD parameter (R = 0.88; RMSECV = 180, and 10 LV) was developed as a combination of different intervals characterized by the lowest RMSECV values, for wavenumber ranges 8480–8180 cm−1 and 5280–4640 cm−1, obtained after SNV plus second derivative (Figure 3; Table 1). According to Bao et al. (2007), BD at 5176 cm−1 and 4363 cm−1 was characterized by R = 0.98 and 0.65, respectively, being defined at 6548 cm−1 and 4764 cm−1 [17]. The absorption peaks at 10,792 cm−1 and 6872 cm−1 are related to the C–H second overtone and combinations of amylose. The main absorption bands at wavelengths 8340 cm−1, 5714 cm−1, 4776 cm−1, and 4357 cm−1 can be attributed to PV, which is similar to the results reported by Osborne et al. (1993) [18]. The C–H, O–H, and N–H vibrational bands found in the infrared spectra describe the combination of CH stretching and CH bending in amylose molecules [19]. The BD parameter represents the capacity of rice flour paste to reorganize, influenced by high temperature and by shear force, representing the strength of reconstituted rice paste and the damage degree of the particles through gelatinization [20].
The iPLS model for the parameter FV was developed after spectral processing based on the SNV plus second derivative algorithm and was characterized by R = 0.57, RMSECV = 270, and LV = 10 for the spectral region 5970–4396 cm−1. Meanwhile, the siPLS model for FV was characterized by R = 0.64, RMSECV = 251, and 10 LVs for the spectral regions 7840–7520 cm−1 and 4960–4320 cm−1. FV is the most useful parameter to represent the quality of the sample, displaying the capacity of the material to produce a gelatinous gel after cooking and cooling. The siPLS model for the parameter FV showed a strong dependence on the species that absorb energy in the spectral regions 7515 cm−1, 7591 cm−1, 6385 cm−1, and 6094 cm−1, while the TR model was based on the bands characterized by peaks at 7515 cm−1, 6530 cm−1, 5947 cm−1, 4909 cm−1, and 4867 cm−1. The quantity and quality of these factors may affect the gelatinization and retrogradation processes of rice flour. The protein content is one of the main factors affecting the gelatinization properties of starch [1]. The iPLS model for the parameter PV, characterized by R = 0.85, RMSECV = 332, and LV = 10, was developed after SNV plus second derivative processing for the spectral region 4784–4396 cm−1. Meanwhile, the optimal siPLS model for PV was defined for the spectral region 5280–4320 cm−1 and was characterized by R = 0.90, RMSECV = 275, and 10 LVs. The peaks registered at 7882 cm−1, 5997 cm−1, 4908 cm−1, and 4867 cm−1 presented a strong influence on the model. The correlation with amylose showed an opposite behavior due to the specific properties Finally, for both parameters ST and TR, the iPLS models defined after second derivative pre-processing were characterized by R = 0.85 and RMSECV = 332 (Table 1). Both iPLS models were defined for the spectral region 4784–4396 cm−1. The bands at 6545 and 4762 cm−1 are typically due to starch, the major component of rice, showing a significant correlation with pasting properties [7,18]. The siPLS model for ST was characterized by R = 0.88, RMSECV = 297, and 9 LVs, defined by the spectral region 5280–4320 cm−1, while, for the TR, the model was developed for a similar spectral region and characterized by R = 0.84, RMSECV = 154, and 10 LVs. The parameter ST showed a significative and positive correlation with amylose. Prior studies showed a correlation between pasting properties, such as PV and ST, and amylose fractions [7,21]. Focusing on these parameters, the siPLS regression models presented significant accuracy compared with the iPLS models and can thus be considered a suitable tool for determining pasting properties in a huge variety of rice (Figure 3A,B). The pasting properties can explain the performance of rice flour and starch during processing (heating and/or cooling) once the rice pasting quality is defined on the basis of starch quality.
In the models, selecting spectral intervals that include significant biochemical information allowed us to develop predictive models characterized by high correlation and low prediction error. The second overtone for the methyl group (–CH3), characterized by the interval 8941–8194 cm−1, is close to the interval 8183–6850 cm−1 (Figure 3B). The spectral region defined by the C–H second overtone corresponds to the amylose molecules [22]. The selected spectral range 5592–5054 cm−1 is close to the interval 5875–5495 cm−1, which can be related to amylose molecules [23,24]. The appearance and eating quality of rice cultivars are directly correlated with their fat content [25]. Higher amounts of fat represent higher rice quality, representing an excellent target attribute in breeding programs [20]. The fat models at 7503–5447 cm−1 are defined by the primary components C–H, N–H, and O–H. The pasting parameters and specific biochemical traits showed a negative correlation between amylose and PV, TR, and BD, while ST was characterized by a positive correlation. In terms of specific loading, the models showed strong spectral regions at 8200–7440 cm−1, 6500–5700 cm−1, 5095, and 4570 cm−1. Several works have revealed that PV, BD, FV, and ST values are directly proportional to the protein present in rice flour [26]. The viscosity registered during heating or pasting processes is associated with the PV. This value is reached at the end of the heating phase when a significant number of swollen starch granules results in pasting. PV indicates the water-holding capacity of the starch or mixture and is commonly linked with other quality components [27]. Previous studies showed a positive correlation between amylose and ST [28] but a negative correlation with PV and BD [29].
Meanwhile, the rheological properties related to the rice varieties are dissimilar not only because of the different amylose and amylopectin contents but also due to the molecular structures and properties of starch molecules [30]. Studies carried out by Burestan et al. (2021) showed that the suggested technique had acceptable performance in predicting several parameters such as BD and ST, being characterized by a suitable accuracy for rice quality parameters (R2 ≥ 0.80 and R2 ≥ 0.71). The results of the present research demonstrated that NIRS is a suitable technique for predicting the quality characteristics of rice and its flour [31]. Based on the siPLS and iPLS models, similar spectral regions were selected, which proves that the biomolecular data present in those intervals is fundamental for the construction of the respective models, reinforcing the importance of fractional analysis of the spectrum. Meanwhile, the siPLS models showed unparalleled advantages by combining three intervals, achieving better models defined by a reduced total number of variables (elimination of spectral noise) and better predictive capacity.

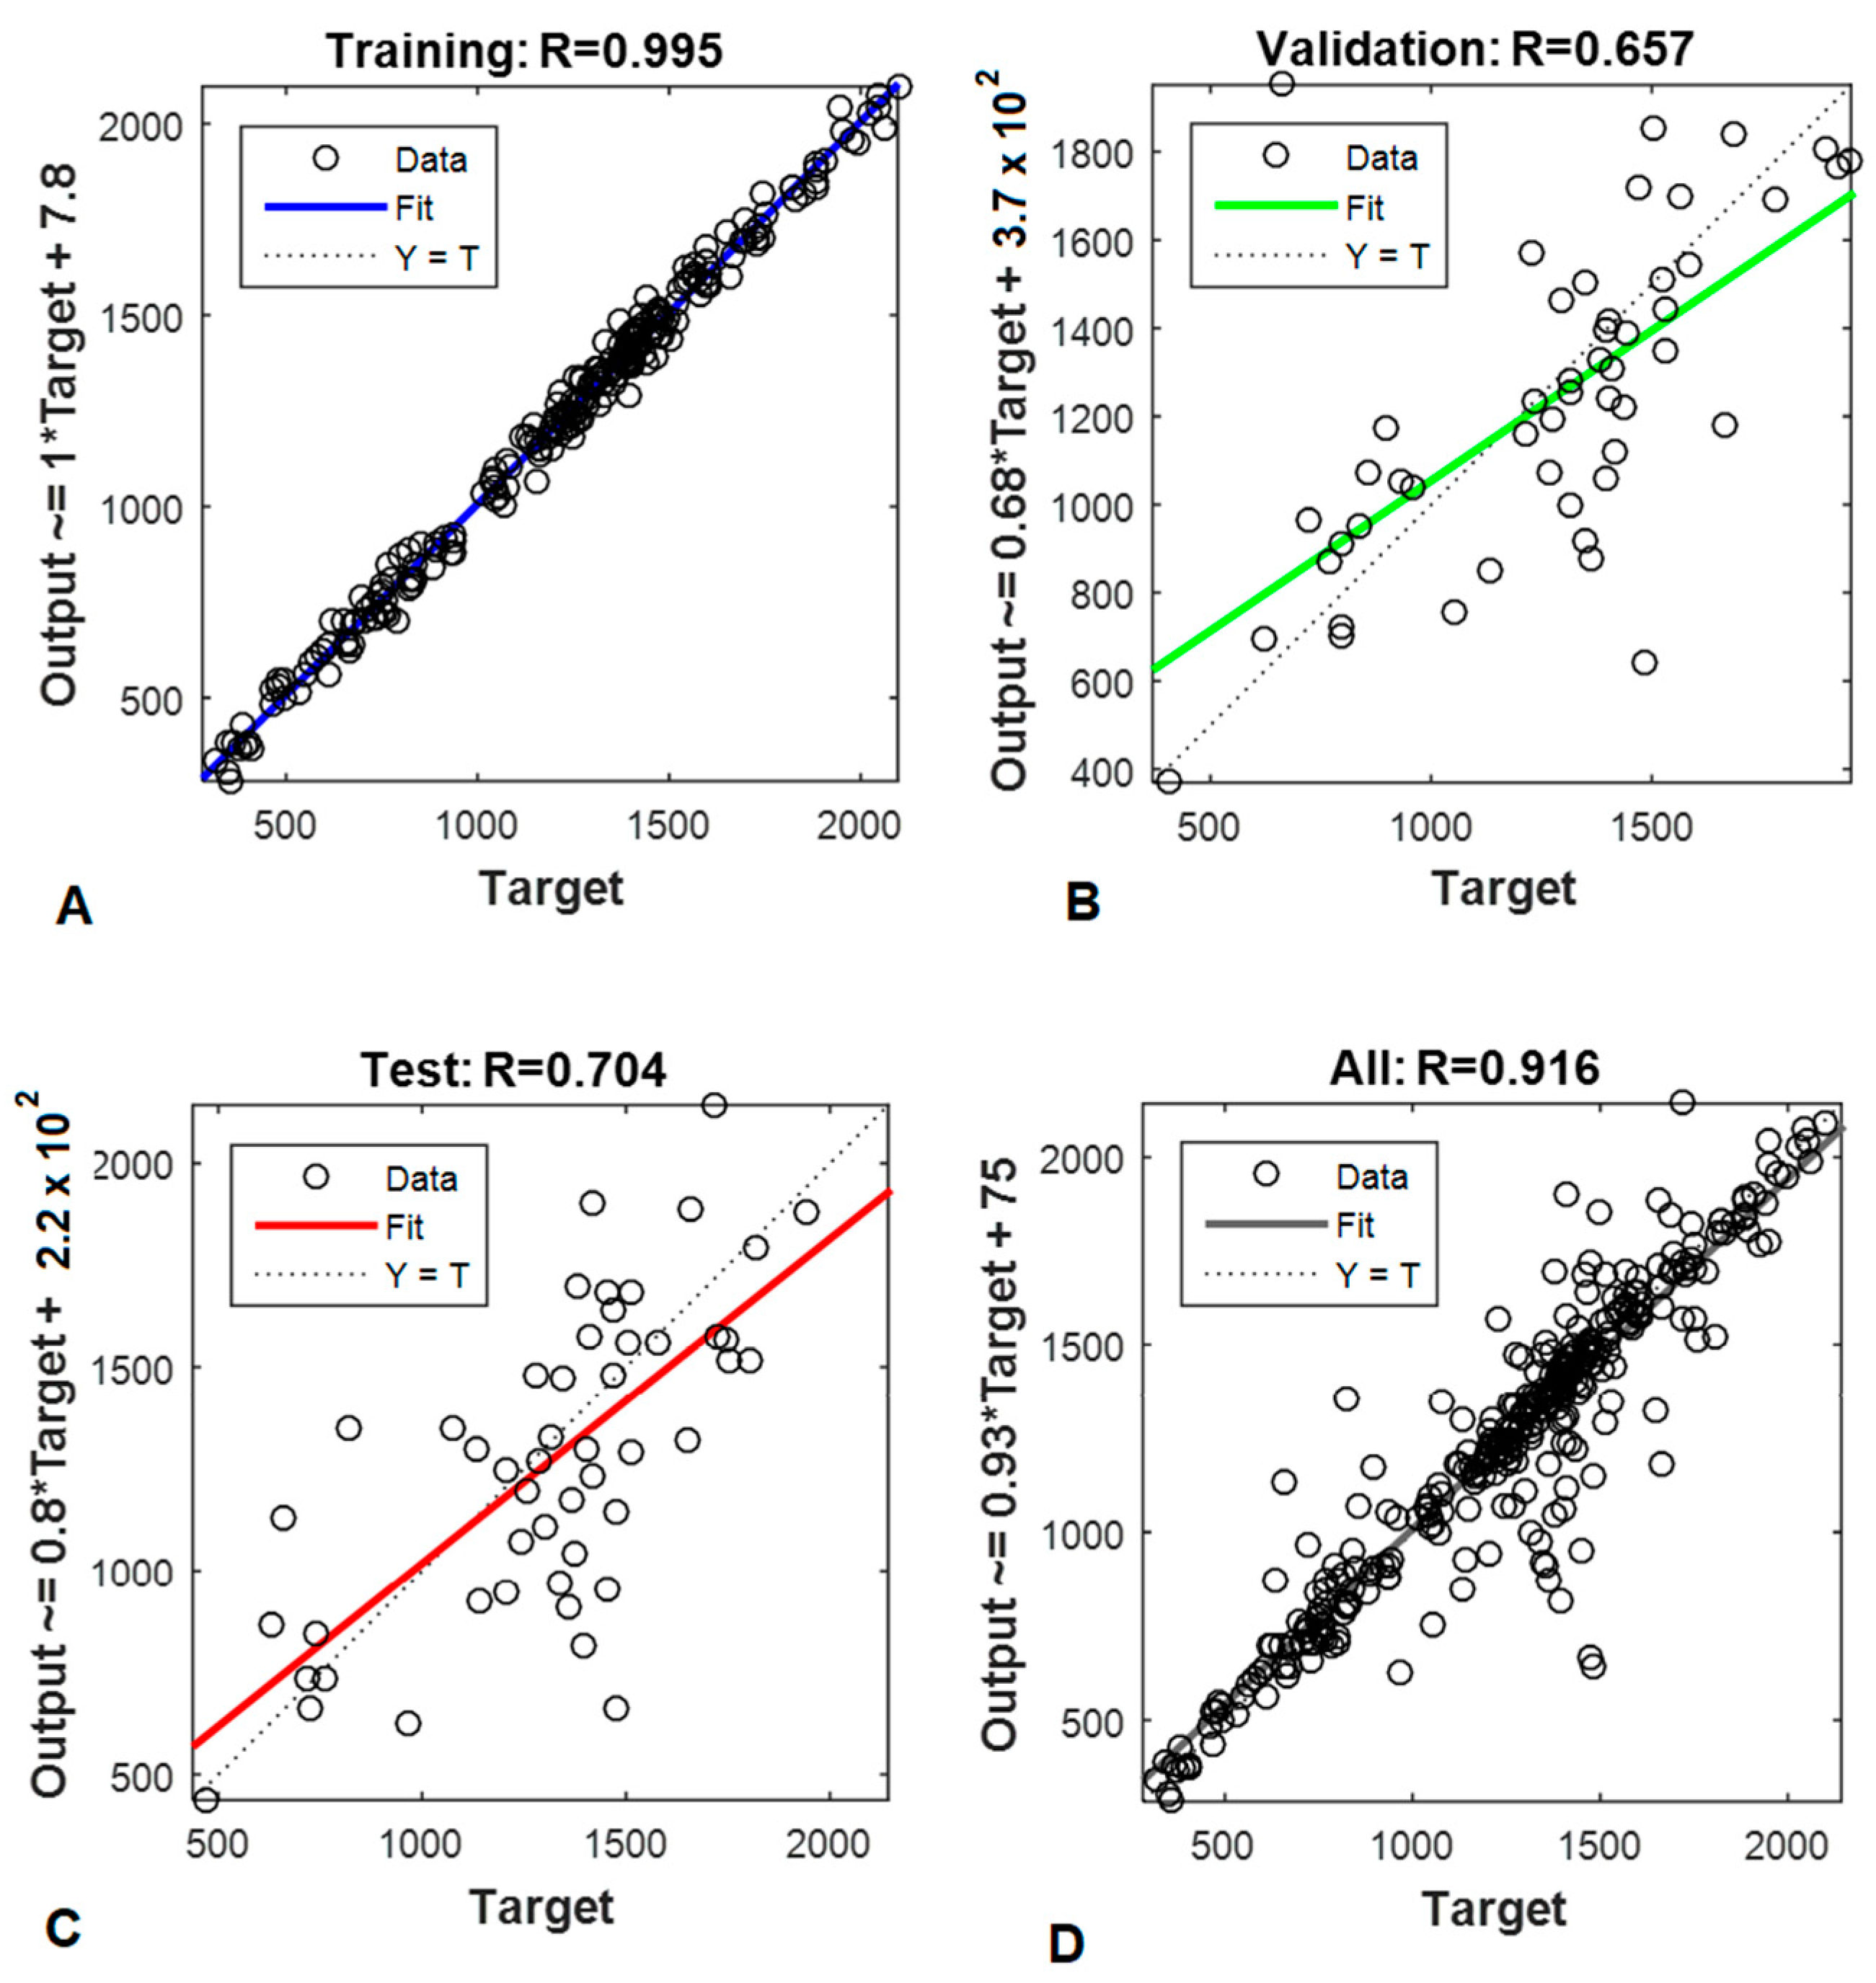
3.2. Artificial Neural Network

Artificial neural networks (ANNs) based on the full spectra were also studied, allowing for the development of a regression model of rice pasting properties. The noise present in the spectral data was previously eliminated using pre-processing methods (SNV, MSC, and smoothing derivative). Five models were developed separately to predict the pasting parameters (BD, ST, TR, PV, and FV) based on the NIR spectra. The best ANN models were characterized by a network model with 10 hidden nodes, presenting higher R values for the calibration step—BD (0.99; 38.7), FV (0.99; 161), PV (0.99; 107), ST (0.99; 5.1), and TR (0.99; 5.7)—than those attained by Burestan et al. (2021) in rice flour (0.96 for BD and ST) [10].
The correlation coefficient (R = 0.99) showed a suitable fit between the observed and predicted data, showing that the MLP algorithm associated with the Broyden–Fletcher–Goldfarb–Shanno learning algorithm can be helpful in modeling the pasting properties, as compared with iPLS and siPLS (Table 2, Figure 4A–D). The ANN algorithm was also applied to develop models to predict the pasting profiles as part of a faster and more accurate method for rice quality analysis [31]. Based on the ANN model, we constructed an optimized regression model characterized by low prediction error and, consequently, a suitable accuracy. Neural networks may recognize complex relationships and generalize outcomes from a specific pattern of data and are therefore considered a suitable technique for modeling complex systems. Compared with the iPLS and siPLS models for the different pasting parameters, the models developed using ANNs can be considered appropriate tools for industrial agents for rice quality evaluation, allowing them to save time and reduce associated costs. This strategy, due to its feasibility and quickness, could be replicated in other products to examine industrial parameters.

3.3. External Testing of the Models

The iPLS, siPLS, and ANN models were tested using 93 external rice spectra and evaluated in terms of their R2 and RMSE values (Table 3, Figure 5). According to the values obtained, the ANN method is significantly acceptable and suitable for pasting parameter prediction and, consequently, rice quality evaluation (Table 3). These models can be considered a significant strategy for rice quality evaluation, characterized by accuracy for different rice types. This shows the applicability of NIR spectroscopy and machine learning tools to fast-mode rice quality assessments. In the food industry, the methodologies applied to evaluate the quality of products are considered time-consuming and highly expensive due to the special testing methodologies required. For this reason, the main goal of this study was to develop different prediction models, based on machine learning algorithms, relating to the rice pasting properties BD, FV, PV, TR, and ST, which define the quality of rice.
After the development of the prediction models, testing with selected samples allowed us to estimate with significant accuracy the values of each pasting property. The rice samples were of different varieties, which proves that the models are suitable for rigorous evaluation regardless of rice origin or composition. From the evaluation comparing the experimental and estimated values for each property, it should be noted that the difference was greater for the models developed using the iPLS algorithm, while the difference between the experimental and estimated data was smaller for the models developed using an ANN (Table 4).

4. Conclusions

The results obtained herein for different rice varieties show that NIR spectroscopy in combination with machine learning algorithms, such as ANN, is suitable for the development of prediction models for rice pasting properties. This represents a promising approach to estimating rice quality and is considered an interesting advancement for industry and consumers. The strategy developed in this study could be applied to other systems, allowing for the evaluation of physicochemical parameters of commercial interest and saving time and resources in the process.

Author Contributions

Conceptualization, P.S.S. and C.B.; methodology, P.S.S., B.C. and C.B.; software, P.S.S.; validation and formal analysis, P.S.S.; investigation, P.S.S., B.C. and C.B.; resources, C.B.; writing—original draft preparation, P.S.S.; writing—review and editing, P.S.S., B.C. and C.B.; visualization, P.S.S.; supervision, C.B.; project administration, C.B.; funding acquisition, C.B. All authors have read and agreed to the published version of the manuscript.

Funding

Funding for this research was received from TRACE-RICE—Tracing rice and valorizing side streams along with Mediterranean blockchain, grant no. 1934 (call 2019, Section 1 Agrofood)—of the PRIMA Program supported under Horizon 2020, the European Union’s Framework Program for Research and Innovation. This work was also supported by FCT, the Portuguese Foundation for Science and Technology through the R&D Unit, UIDB/04551/2020 (GREEN-IT, Bioresources for Sustainability) and project UIDB/04033/2020. P.S. Sampaio acknowledges the financial support of the postdoctoral research grant included in this project RECI/AGR-TEC/0285/2012, BEST-RICE-4-LIFE project.

Institutional Review Board Statement

This work does not present any studies involving human or animal participants.

Data Availability Statement

The experimental data cannot be shared due to privacy restrictions and regulations.

Acknowledgments

The authors are grateful to Ana Sofia Almeida and COTARROZ for providing the rice samples and to Andreia Soares for technical assistance.

Conflicts of Interest

The authors (Pedro S. Sampaio, Bruna Carbas, and Carla Brites) do not have any relationship or interest with other organizations or financial persons that could improperly impact or prevent the discovery and publication of the experimental outcomes of this work.

References

  1. Zhao, Y.; Dai, X.; Mackon, E.; Ma, Y.; Liu, P. Impacts of protein from high-protein rice on gelatinization and retrogradation properties in high- and low-amylose reconstituted rice flour. Agronomy 2022, 12, 1431. [Google Scholar] [CrossRef]
  2. Zhu, L.; Zhang, Y.; Wu, G.; Qi, X.; Dag, D.; Kong, F.; Zhang, H. Characteristics of pasting properties and morphology changes of rice starch and flour under different heating modes. Int. J. Biol. Macromol. 2020, 149, 246–255. [Google Scholar]
  3. Zhu, L.; Wu, G.; Zhang, H.; Wang, L.; Qian, H.; Qi, X. Using RVA-full pattern fitting to develop rice viscosity fingerprints and improve type classification. J. Cereal Sci. 2018, 81, 1–7. [Google Scholar]
  4. Srivastava, Y. Advances in Food Science and Nutrition; Queen’s College of Food Technology & Research Foundation: Maharashtra, India, 2013. [Google Scholar]
  5. Jiranuntakul, W.; Puttanlek, C.; Rungsardthong, V.; Puncha-arnon, S.; Uttapap, D. Microstructural and physicochemical properties of heat-moisture treated waxy and normal starches. J. Food Eng. 2011, 104, 246–258. [Google Scholar]
  6. Shi, S.; Wang, E.; Li, C.; Cai, M.; Cheng, B.; Cao, C.; Jiang, Y. Use of protein content, amylose content, and RVA parameters to evaluate the taste quality of rice. Front. Nutr. 2022, 8, 758547. [Google Scholar] [CrossRef]
  7. Osborne, B.G. Applications of near-infrared spectroscopy in the quality screening of early-generation material in cereal breeding programs. J. Near Infrared Spectrosc. 2006, 14, 93–101. [Google Scholar]
  8. Sampaio, P.N.; Soares, A.; Castanho, A.; Almeida, A.S.; Oliveira, J.; Brites, C. Optimization of rice amylose determination by NIR-spectroscopy using PLS chemometrics algorithms. Food Chem. 2018, 242, 196–204. [Google Scholar] [CrossRef]
  9. Le Nguyen Doan, D.; Nguyen, Q.C.; Marini, F.; Biancolilla, A. Authentication of rice (Oryza sativa L.) using near-infrared spectroscopy combined with different chemometric classification strategies. Appl. Sci. 2021, 11, 362. [Google Scholar]
  10. Burestan, N.F.; Afkari Sayyah, A.H.; Taghinezhad, E. Prediction of some quality properties of rice and its flour by near-infrared spectroscopy (NIRS) analysis. Food Sci. Nutr. 2021, 9, 1099–1105. [Google Scholar] [CrossRef]
  11. Wold, S.; Sjostrom, M.; Eriksson, L. PLS-regression: A basic tool of chemometrics. Chemometr. Intell. Lab. Syst. 2001, 58, 109–130. [Google Scholar]
  12. Norgaard, L.; Saudland, A.; Wagner, J.; Nielsen, J. Interval Partial least-squares regression (iPLS): A comparative chemometric study with an example from near-infrared spectroscopy. Appl. Spectrosc. 2000, 54, 413–419. [Google Scholar] [CrossRef]
  13. Leardi, L.; Nørgaard, J. Sequential application of backward interval partial least squares and genetic algorithms for the selection of relevant spectral regions. J. Chemometr. 2004, 18, 486–497. [Google Scholar]
  14. Vrahatis, M.N.; Magoulas, G.D.; Parsopoulos, K.E.; Plagianakos, V.P. Introduction to Artificial Neural Networks Training and Applications. In Proceedings of the 15th Annual Conference of Hellenic Society for Neuroscience, Neuroscience 2000, Patras, Greece, 27–29 October 2000. [Google Scholar]
  15. Ferreira, A.R.; Oliveira, J.; Pathania, S.; Almeida, A.S.; Brites, C. Rice quality profiling to classify germplasm in breeding programs. J. Cereal Sci. 2017, 76, 17–27. [Google Scholar] [CrossRef]
  16. Barnes, R.J.; Dhanoa, M.S.; Lister, S.J. Standard Normal Variate Transformation and De-trending of Near-Infrared Diffuse Reflectance Spectra. Appl. Spectrosc. 1989, 43, 772–777. [Google Scholar] [CrossRef]
  17. Bao, J.S.; Wang, Y.; Shen, Y. Determination of apparent amylose content, pasting properties, and gel texture of rice starch by near-infrared spectroscopy. J. Sci. Food Agric. 2007, 87, 2040–2048. [Google Scholar] [CrossRef]
  18. Osborne, B.G.; Fearn, T.; Hindle, P.H. Practical NIR Spectroscopy with Applications in Food and Beverage Analysis, 2nd ed.; Near-Infrared Calibration II; Longman Scientific and Technical: Essex, UK, 1993; pp. 121–144. [Google Scholar]
  19. Mishra, P.; Woltering, E.J. Identifying key wavenumbers that improve prediction of amylose in rice samples utilizing advanced wavenumber selection techniques. Talanta 2021, 224, 121908. [Google Scholar] [CrossRef]
  20. Wang, L.; Zhang, L.; Wang, H.; Ai, L.; Xiong, W. Insight into protein-starch ratio on the gelatinization and retrogradation characteristics of reconstituted rice flour. Int. J. Biol. Macromol. 2020, 146, 524–529. [Google Scholar] [CrossRef]
  21. Siriphollakul, P.; Kanlayanarat, S.; Rittiron, R.; Wanitchang, J.; Suwonsichon, T.; Boonyaritthongchai, P.; Nakano, K. Pasting properties by near-infrared reflectance analysis of whole grain paddy rice samples. J. Innov. Opt. Health Sci. 2015, 8, 1550035. [Google Scholar] [CrossRef] [Green Version]
  22. Bagchi, T.B.; Sharma, S.; Chattopadhyay, K. Development of NIRS models to predict protein and amylose content of brown rice and proximate compositions of rice bran. Food Chem. 2016, 191, 21–27. [Google Scholar] [CrossRef]
  23. Fertig, C.C.; Podczeck, F.; Jee, R.D.; Smith, M.R. Feasibility study for the rapid determination of the amylose content in starch by near-infrared spectroscopy. Eur. J. Pharm. Sci. 2004, 21, 155–159. [Google Scholar] [CrossRef]
  24. Vichasilp, C.; Kawano, S. Prediction of starch content in meatballs using near-infrared spectroscopy (NIRS). Int. Food Res. J. 2015, 22, 1501–1506. [Google Scholar]
  25. Chen, H.; Siebenmorgen, T.J.; Griffin, K. Quality characteristics of long-grain rice milled in two commercial systems. Cereal Chem. 1998, 75, 560–565. [Google Scholar]
  26. Martin, M.; Fitzgerald, M.A. Proteins in rice grains influence cooking properties. J. Cereal Sci. 2002, 36, 285–294. [Google Scholar]
  27. Cozzolino, D. The use of the rapid visco analyser (RVA) in the breeding and selection of cereals. J. Cereal Sci. 2016, 70, 282–290. [Google Scholar] [CrossRef]
  28. Juliano, B.O.; Gloria, M.B.; Lugay, J.C.; Reyes, A.C. Studies on the physicochemical properties of rice. J. Agric. Food Chem. 1964, 12, 131–138. [Google Scholar] [CrossRef]
  29. Tong, C.; Liu, L.; Waters, D.L.; Rose, T.J.; Bao, J.; King, G.J. Genotypic variation in lysophospholipids of milled rice. J. Agric. Food Chem. 2014, 62, 9353–9361. [Google Scholar]
  30. Lin, Q.; Liu, Z.; Xiao, H.; Li, L.; Yu, F.; Tian, W. Studies on the Pasting and Rheology of Rice Starch with Different Protein Residual. In Computer and Computing Technologies in Agriculture III. CCTA 2009. IFIP Advances in Information and Communication Technology; Li, D., Zhao, C., Eds.; Springer: Berlin/Heidelberg, Germany, 2010; Volume 317. [Google Scholar]
  31. Sampaio, P.N.; Almeida, A.S.; Brites, C. Use of artificial neural network model for model for rice quality prediction based on grain physical parameters. Foods 2021, 10, 3016. [Google Scholar]
Figure 1. Representation of NIR spectra after MSC processing. Each color represents the spectra for each samples rice.
Applsci 13 09081 g001
Figure 2. Evaluation of the RMSECV values related to each spectral region. The dotted line represents the RMSECV (10 LVs) for the full model. Italic numbers represent the optimal LV values for each interval model (A). Specific region of the NIR spectra for the iPLS model characterized by RMSECV = 102 (B). Correlation between measured and predicted BD values after MSC plus 2nd derivative spectral pre-processing treatment and RMSECV evaluation in the spectral interval (C).
Applsci 13 09081 g002
Figure 3. Evaluation of the RMSECV values related to each spectral region. The dotted line represents the RMSECV (10 LVs). Italic numbers represent the optimal number of LVs in each interval model (A). For the siPLS model, specific regions in the NIR spectra present the lowest RMSECV values (B). Correlation between measured and predicted BD values after SNV plus 2nd derivative spectral pre-processing treatment and RMSECV evaluation in several spectral intervals (R = 0.88; RMSECV = 180; 8480–8180 cm−1; 5280–4640 cm−1) (C).
Applsci 13 09081 g003
Figure 4. ANN models related to the pasting parameter of breakdown: calibration step (A); test set (B); validation (C); all processes (D).
Applsci 13 09081 g004
Figure 5. Graphical representation of the external testing procedure related to the pasting parameter of breakdown.
Applsci 13 09081 g005
Table 1. Statistical parameters determined for each pasting model after specific pre-processing steps.
ParameterSpectral ProcessingRcalRMSECRMSECVRpredRMSEPSpectral Region (cm−1)
BDiPLS (MSC + 2nd Derivative)0.842381020.772844784–4395.5
siPLS (SNV + 2nd Derivative)0.881821800.733088480–8180; 5280–4640
FViPLS (SNV+ 2nd Derivative)0.572732700.473585970–4395.5
siPLS (SNV + 2nd Derivative)0.642532510.652337840–7520; 4960–4320
PViPLS (SNV + 2nd Derivative)0.852893320.863214784–4395.5
siPLS (SNV + 2nd Derivative)0.902592750.903215280–4320
STiPLS (2nd Derivative)0.852993320.813254784–4395.5
siPLS (SNV + 2nd Derivative)0.882532970.753295280–4320
TRiPLS (2nd Derivative)0.851523320.642554784–4395.5
siPLS (SNV + 2nd Derivative)0.841411540.881195280–4320
BD—breakdown; FV—final viscosity; PV—pasting viscosity; ST—setback; TR—trough; MSC—multiplicative scatter correction; SNV—standard normal variate; RMSECV—root-mean-square error of cross-validation; RMSEC—root-mean-square error of calibration; RMSEP—root-mean-square error of prediction; LVs—latent variables.
Table 2. ANN models for different rice pasting parameters.
Pasting ParameterRCalibrationRMSERValidationRMSERTestingRMSE
BD0.9938.70.662970.70296
FV0.991610.553800.85330
PV0.991070.801460.80455
ST0.995.10.773500.76424
TR0.995.70.622890.72911
BD—breakdown; FV—final viscosity; PV—pasting viscosity; ST—setback; TR—trough; RMSE—root-mean-square error.
Table 3. Models for different parameters determined after model development.
Pasting ParameterModelExperimental DataPredicted DataR2RMSE% (RMSE)
BDiPLS1238 ± 3961155 ± 4590.95766.8
siPLS1134 ± 4130.97433.8
ANN1133 ± 4230.98433.8
FViPLS2984 ± 3492887 ± 4330.95913.1
siPLS2903 ± 4680.911174.0
ANN2889 ± 4190.95873.0
PViPLS2657 ± 6522474 ± 7200.979719.0
siPLS2503 ± 7850.961409.6
ANN2468 ± 7380.971257.6
STiPLS327 ± 514436 ± 5580.97664.0
siPLS419 ± 5360.98536.0
ANN407 ± 5280.99505.0
TRiPLS1419 ± 2821344 ± 3130.95665.0
siPLS1326 ± 3300.97574.2
ANN1333 ± 3060.98423.1
iPLS—interval PLS; siPLS—synergy interval PLS; ANN—artificial neural network.
Table 4. Pasting properties predicted using the various developed models.
Rice TypeBreakdown (cP)iPLSsiPLSANN
Sprint957958957952
Sprint941940941936
OP 1203-Ceres1654173516651673
OP 1203-Ceres1748184017601770
ARIETE 1041249128412541254
ARIETE 1051242127612471247
Rice typeFinal Viscosity (cP)iPLSsiPLSANN
Sprint3235324832923238
Sprint3261327733233266
OP 1203-Ceres3143314631823139
OP 1203-Ceres3249326333093253
ARIETE 1043080307731073072
ARIETE 1053051304430723041
Rice typePeak Viscosity (cP)iPLSsiPLSANN
Sprint2235221522192201
Sprint2264224522532232
OP 1203-Ceres3229324133393248
OP 1203-Ceres3401341835313428
ARIETE 1042774277228262769
ARIETE 1052745274227932738
Rice typeSetback (cP)iPLSsiPLSANN
Sprint1000107510321010
Sprint997107110281007
OP 1203-Ceres−87−103−98−102
OP 1203-Ceres−152−173−166−169
ARIETE 104306323310299
ARIETE 105306322309299
Rice typeTrough (cP)iPLSsiPLSANN
Sprint1278127812581265
Sprint1323132513061310
OP 1203-Ceres1576158315781561
OP 1203-Ceres1652166116601638
ARIETE 1041525153115231511
ARIETE 1051503150914991489
Sprint, OP1203-Ceres, and ARIETE correspond to the rice varieties tested in the study. iPLS—interval PLS; siPLS—synergy interval PLS; ANN—artificial neural network.
Disclaimer/Publisher’s Note: The statements, opinions and data contained in all publications are solely those of the individual author(s) and contributor(s) and not of MDPI and/or the editor(s). MDPI and/or the editor(s) disclaim responsibility for any injury to people or property resulting from any ideas, methods, instructions or products referred to in the content.

