Abstract
Open-die forging holds a pivotal role in shaping machine parts within industrial applications. This study focuses on the assessment of stress–strain curves for C45 material at different elevated temperatures and strain rates through numerical simulations employing the finite element method (FEM). Specifically, the research investigates how the flow curve of materials at elevated temperatures and individual strain rates impacts the forming force during the flange forming of C45 billet tubes. By comparing the simulation results with experimental data on the flange-forming force, this study observes that optimal outcomes arise when considering both elevated temperature and strain rates in the flow curve of materials. The study then conducts simulations for C45 billet tubes with varying upsetting ratios (H0/D0), (S0/D0), and the punch’s pitch angle (α), aiming to address optimization challenges related to the flange-forming force. Consequently, a mathematical model is developed to represent the relationship between the flange-forming force and geometric parameters (H0/D0, S0/D0, and α). This model accurately predicts the forming force under various flange-forming conditions, demonstrating high precision with a maximum error of 4.26% compared with the experimental results. This study significantly contributes to the advancement of flange-forming technology in open-die forging through numerical simulation, enabling the optimization of the flange-forming force and the selection of appropriate equipment. These findings pave the way for more effective and efficient industrial processes, fostering innovation and progress in the field.
1. Introduction
Open-die forging, as an initial preliminary forming step, often employs a simple mold design, prioritizing speed over shape accuracy. Consequently, block forging is frequently considered a standalone process in the context of original research and block stamping technology [1]. However, identifying the blank in open-die forging can significantly impact the reduction of finishing stamping operations. Following open-die forging, precise block pressing takes place in close-die forging [2,3]. Aydin Tuzun has developed open-die forging technology for billet tubes, incorporating analytic calculations and simulations to assess the forming ability during billet tube shaping. The thin walls of billet tubes necessitate careful shaping calculations and multiple forging steps to avoid instability [4].
In the pursuit of determining crucial technological parameters, particularly the flange-forming force, and performing numerical simulations for formability analysis, researchers often construct constitutive models for materials under varying temperature conditions, tailored to specific technological processes. Material modeling frequently involves the utilization of established frameworks such as the Ludwig or Swift models [5,6], while the Johnson–Cook model (JC) [7,8,9,10,11,12,13,14] finds widespread application in high-temperature machining scenarios. Constitution models are typically derived and calibrated through well-lubricated cylindrical workpiece compression methods, aiming to minimize the impact of contact friction. Noteworthy contributions have been made in this domain. For instance, R. Dindorf [15] and colleagues proposed an energy-efficient solution for industrial hydraulic forging presses, forecasting forging force based on the steel forging height’s strain–temperature behavior and various strain rates. N. Reinisch [16] et al. harnessed the Q-learning algorithm in multi-objective optimization, employing pre-pressing techniques to minimize transmission line count during production. G. Winiarski [17] introduced an innovative approach for shaping hollow flanged products, incorporating tube movement counter to the punch’s direction. This investigation examined the effects of parameters such as flange diameter, pipe height, and bevel angle on forming stability. Prior studies and innovations encompass localized stamping, composite materials in stamping, and symmetrical stamping methodologies [18,19,20].
Notably, L.M. Alves et al. found that while thick billets with a core-equipped die undergo easy deformation, thin billet tubes exhibit unstable bending during the forging process [21,22]. This issue has been extensively studied by technicians worldwide, leading to analytical formulas for stress distribution, strain, and flange-forming force [23,24,25,26]. Although research from the 21st century onwards mainly focuses on specific technology calculations and numerical methods to provide clear visual results [27,28,29,30,31], the investigation of solid forging problems tends to lack specific analysis for billet tube forging problems.
Friction at the contact surface between the workpiece and the tool in open-die forging significantly influences uneven deformation and workpiece swelling. Numerous studies have explored the effect of friction on stress distribution, drum bulge degree, and deformation distribution on the workpiece [32,33,34,35,36]. Studies involving solid cylindrical workpieces indicate that without friction, the stress distribution is uniform and the normal stress at the contact surface equals the yield stress. However, the presence of friction results in a pyramidal stress distribution. Determining the effect of friction on drum bulge during deformation proves challenging analytically; thus, numerical simulations have been employed to assess the influence of friction on uneven strain distribution and drum bulge degree [33,37,38]. To reduce friction in the forging process, researchers have investigated lubricants under different conditions and temperature changes [36]. Defects in solid blank stamping, such as longitudinal and transverse cracking and surface defects caused by excessive deformation, have been extensively studied [39]. The instability when forming bars with a forging ratio greater than 2.5, leading to bending and folding defects, has also been a subject of research [40]. Studies address the issue of instability during tube forging, which creates folding defects [41,42,43]. Additionally, researchers have focused on tube forging in mold cavities and the influence of mold shape on instability and folding defects [43].
Temperature during forging [44,45,46,47,48] alters the contact state between the workpiece and the tool, impacting friction and deformation uniformity while reducing the forming force due to decreased yield stress of the metal [49,50,51]. For forming complex parts requiring significant deformation, hot forming is typically employed. On the other hand, metals with excellent deformability that require less deformation are processed in the cold state. Vladimir Galkin and colleagues have studied the feasibility of forming technology in open-die, round forging using ductile iron, employing mathematical modeling and microstructural analysis [52].
Prominent global thermomechanical simulation software, such as Deform 3D, Abaqus, Marc, Ansys, and others, has found widespread application in the prediction, assessment, and simulation of various needle machining techniques, including bending forming simulation [53], plate stamping [54,55], and block stamping [56,57,58,59]. This research emphasizes the dependability of stamping simulation by focusing on stress–strain curves for C45 material at elevated temperatures and strain rates, utilizing numerical simulations based on the finite element method (FEM). The investigation specifically delves into the influence of material flow curves at heightened temperatures and distinct strain rates on the formative force during C45 billet tube flange forming. Comparative analysis between simulation outcomes and experimental data concerning flange-forming force highlights that optimal results manifest when both elevated temperature and strain rates are considered within the material’s flow curve. Moreover, the study undertakes simulations for C45 billet tubes, varying upsetting ratios (H0/D0), (S0/D0), and the punch’s pitch angle (α), with the intent of addressing optimization challenges pertinent to the flange-forming force. This endeavor culminates in the development of a mathematical model representing the intricate interplay between the flange-forming force and geometric parameters (H0/D0, S0/D0, and α).
2. Materials and Methods
2.1. Materials
In this research involving numerical simulation to determine stress and strain in the workpiece and flange-forming force, a focus is placed on manufacturing operations for small and medium-sized gears made of C45 steel billet tubes. The chemical composition and mechanical properties of C45 steel, according to TCVN 1766-75 standards [60], are presented in Table 1 and Table 2, respectively. The dimensional specifications of the deformed product are depicted in Figure 1.

Table 1.
Chemical composition of C45 material.
Table 2.
Experimentally determined properties of C45 material.
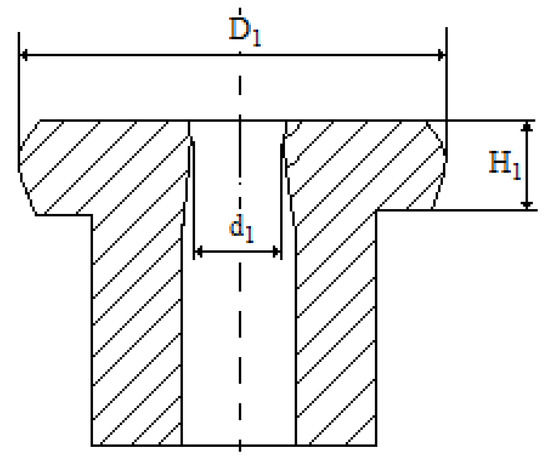
Figure 1.
The dimensional specifications of the deformed product from billet tubes.
Prior research by K. Laber et al. [61] conducted tensile tests on C45 material from 800 °C to 1200 °C with strain rates of 0.1 S−1, 1.0 S−1, and 10.0 S−1. In response, our experiment heated the workpiece to 1100 °C using matching strain rates. Equation (1) approximated the outcomes, establishing links between yield stress, strain, strain rate, and temperature. The coefficients of the Equation (1) are presented in Table 3. The resulting stress–strain curves at elevated temperatures and diverse strain rates simulated forging processes and validated against the experimental data. This study clarifies the rationale behind adopting Equation (1). In open-die forging, understanding material flow stress behavior under uniaxial stress conditions—considering strain, strain rate, and temperature—is vital. Different techniques, such as tensile, compressive, and torsion tests, ascertain yield stress values with respect to these variables. The torsion test, noted in reference [61], offers a practical way to determine flow stress curves under high temperatures and varying strain rates. Thus, we employed a stress function (Equation (1)) incorporating torsion-derived parameters—strain, strain rate, and temperature—to characterize material behavior:
where —yield stress, T—temperature, ε—true strain, —strain rate, A, m1÷m8—coefficients of the function.
Table 3.
Values of parameters used for determining yield stress values of C45 steel in Equation (1) [61].
2.2. FE Simulation Model and Testing of Open-Die Forging Process
Geometric models of the punch, die, and billet tube are meticulously constructed to meet the precise shape and size requirements of the product, as depicted in Figure 2a.
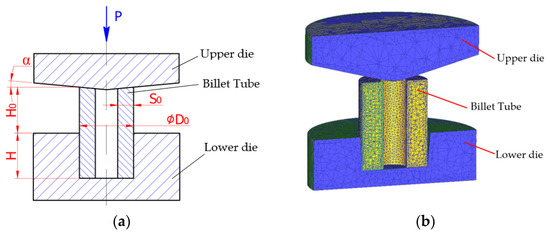
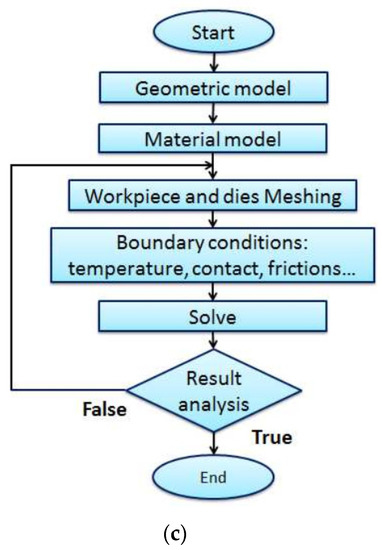
Figure 2.
Geometric model of the mold and billet tubes (a), the numerical simulation model (b), and the simulation algorithm (c) for advancing flange-forming technology in open-die forging through numerical simulation.
As shown in Figure 2b, the geometric models of the workpiece, punch, and die are developed using Catia software and formatted as *.STL files to be integrated into the simulation environment. To initiate the initial experimental study, assess the research model’s suitability, and analyze and identify potential instability and form folding defects in the workpiece after stamping, the geometrical parameters of the workpiece and forming tool are set during both simulation and experiment. Specifically, the upsetting ratios are H0/D0 = 0.6 and S0/D0 = 0.35, while the tilt angle of the punch is set to α = 15° degrees. The numerical simulation software employed in this study is DEFORM-3D. To compute stress distribution, strain, displacement, and material flow velocities using the finite element method, a mesh of the workpiece and die is required. In our approach, the workpiece was discretized into 75,000 elements, the punch into 10,000 elements, and the mold into 20,000 elements. For the simulation setup, the initial temperature of the workpiece was set at 1100 °C, while the upper and lower die temperatures were maintained at 25 °C. The lower die was immobilized, and the upper die was set to move at a velocity of 100 mm/s. The interaction between the workpiece and die followed the Tresca contact condition with a friction coefficient of 0.4. Additional material conditions were configured in accordance with the values outlined in Table 2. Notably, this study introduced variable strain rate and temperature conditions that are contingent on stress and variation, as detailed by Equation (1). The simulation procedures (Figure 2c) were executed using DEFORM-3D software, and the simulation model is visually depicted in Figure 2b.
To ensure congruence with the experimental setup, the mold used in the simulation is designed to match the shape and size of the actual experimental mold. The test equipment is tailored to match real production conditions. The equipment clusters are modularized and easily interconnected to form a complete system. The schematic diagram illustrating the main modules and components of the experimental system is displayed in Figure 3. The integration of these main modules allows for efficient control of the shaping process, facilitating convenient adjustments during experimentation. The experimental diagram is straightforward, enabling swift parameter adjustments. Data measurement and storage are automated and conducted concurrently with the forming process, yielding rapid results displayed on the screen.
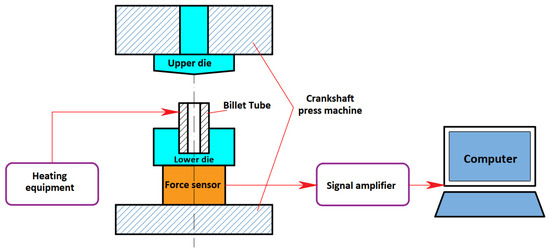
Figure 3.
Diagram depicting experimental equipment and process.
With the modules calculated, designed, and selected, the next step is to assemble these modules sequentially. Initially, the complete set of molds is assembled, positioned, and clamped on the slide and table of the FCP-160-ton crankshaft press. Subsequently, the sensor is placed beneath the intermediate die and clamped to the lower die assembly. Through cables and wires, the sensor is connected to other modules in the mold and measuring device system. The experimental system is finalized, as depicted in Figure 4a, and the forming punches feature different angles of inclination, shown in Figure 4b.
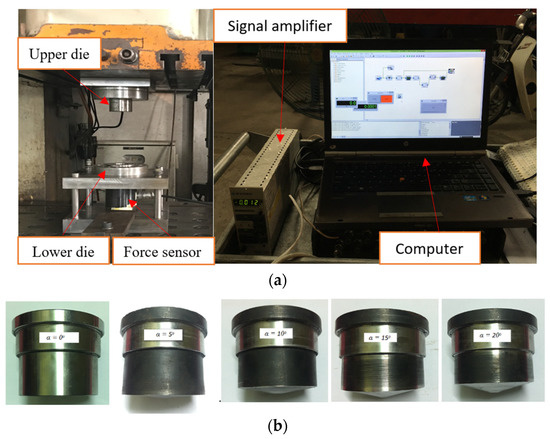
Figure 4.
(a) Experimental system and (b) forming punch with varying tilt angles (α = 0° to 20°).
3. Results and Discussion
3.1. Evaluation of the Accuracy of Stress–Strain Models
The accuracy of stress–strain models for material C45 was evaluated by comparing the yield curve at different individual strain rates and considering both elevated temperature and strain rates. The forming force during open-die forging of simulated billet tubes was compared with experimental results to calculate the deviation between the experimental value () and the simulated value () in flange-forming force (ΔP(%)) using Equation (2). Figure 5a,b show images of simulation and experimental results at strain rates of 1.0 S−1 and 10 S−1, respectively. Figure 5c represents the simulation and experimental results considering both elevated temperature and strain rates (Equation (1)). The comparison of the flange-forming force graph between simulation and experiment is displayed in Figure 5d.
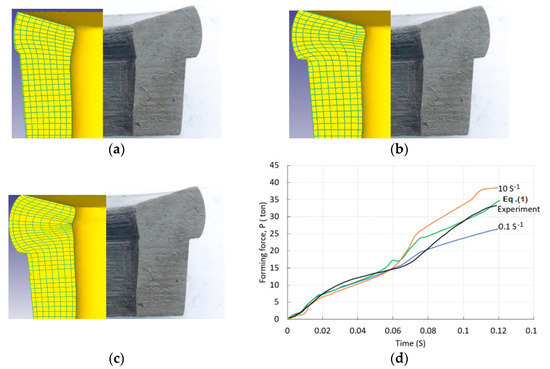
Figure 5.
The deformed shape obtained from both simulation and experiment: (a) strain rate of 0.1 S−1, (b) strain rate of 10 S−1, (c) the simulation results considering both elevated temperature and strain rates equation, and (d) flange-forming force graph from simulation along with the corresponding experimental data.
Additionally, the table labeled Table 4 provides a comparison of the flange-forming force when simulating the flange forming of C45 billet tubes using different stress–strain curve inputs and experimental data.
Table 4.
Flange-forming force obtained from simulations using flow models.
Table 4 presents a comparative analysis of the forming force obtained from simulations using flow models at strain rates 0.1 S−1 and 10 S−1 and considering both elevated temperature and strain rates, compared with the test results. The largest deviation from the experimental forming force is observed at strain rate 0.1 S−1, with a value of 21.36%, followed by 14.54% for strain rate 10 S−1, and the smallest deviation of 4.19% is observed for the flow model considering both elevated temperature and strain rates (Equation (1)). Therefore, the flow model considering both elevated temperature and strain rates (Equation (1)) will be used in numerical simulations to optimize process parameters during the flange forming of C45 billet tubes.
3.2. Effect of Varying Upsetting Ratios and Punch’s Pitch Angle on Flange-Forming Force
The study investigated the influence of initial geometry parameters, including upsetting ratios (H0/D0, S0/D0) and punch’s pitch angle (α), on the flange-forming force in the flange forming of C45 billet tubes. Table 5 presents the input and output parameters for the flange-forming process.
Table 5.
The input and output parameters for the flange-forming process.
The experimental design adhered to the planning method based on Taguchi [62], using the L16 orthogonal array to study three factors simultaneously (H0/D0, S0/D0, and α) with four levels for each factor. Table 6 shows the structure and options for conducting the experiments.
Table 6.
Structure and options for conducting the experiments.
Simulation results are analyzed statistically through the signal-to-noise ratio (S/N) calculation. S/N ratio represents the signal mean (S) divided by the standard deviation (N) and gauges the impact of input factors on the objective function. Optimization of the S/N ratio minimizes the loss function, enhancing system quality. The S/N ratio is tailored to the objective function, categorized into “Larger is better” (Equation (3)), “Normal is best” (Equation (4)), and “Smaller is better” (Equation (5)), with the latter chosen for the study’s purpose:
Here, “S/N” symbolizes the signal-to-noise ratio, a standard metric for gauging data reliability in experimental analysis. The variable “yi” signifies the measured value from the i-th trial, obtained by averaging multiple measurements within that trial. The variable “n” denotes the total count of conducted tests or experiments.
The (S/N) ratio (Equation (5)) is computed for each trial, signifying product deformation degree. The objective function is the flange-forming force (P) post-forging, influenced by H0/D0, S0/D0, and α, each with four levels detailed in Table 7. Forming force and S/N ratios are tabulated in Table 8. The mean signal/noise ratios per factor level are determined as Equation (6), displayed in Table 9. Figure 6 illustrates the impact levels of H0/D0, S0/D0, and α on flange force:
where denotes the average of noise ratios at each level i (i = 1, 2, 3); j represents the influencing parameters (j = A, B, C).
Table 7.
Levels of the influencing factors along with their corresponding values.
Table 8.
Experimental cases along with the corresponding flange-forming force results and the signal-to-noise (S/N) ratio.
Table 9.
Analysis of variance (ANOVA) table, which assesses the impact of factors on the flange-forming force.
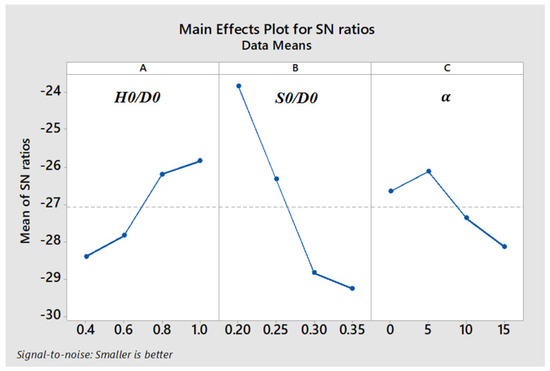
Figure 6.
Influence levels of parameters H0/D0, S0/D0, and α on the flange-forming force.
To assess factor influence (Table 9), the sum of squares is calculated using Equations (7)–(9). This forms the basis for comparing mean-centered variation (Equation (10)), leading to percentage factor influence determination (Equation (11)):
where Yi is the measurement at test condition i; n is total trials; nji is factor j’s trial number at level i; and ji is factor j’s sum at level i.
The analysis of the factors’ influence reveals that the most significant factor affecting the flange-forming force is S0/D0, accounting for 65% of the variation. H0/D0 follows with 21.1% influence, while α has a comparatively smaller impact at 13.9%. Therefore, achieving the minimum flange-forming force requires setting the parameters at H0/D0 = 1, S0/D0 = 0.2, and α = 5°. These optimized parameters are then utilized for simulation and experimental verification.
The simulation and experimental results using the optimized parameter set are presented in Figure 7a, showing a simulated flange-forming force of 10.6 tons and experimental verification of 10.2 tons, as displayed in Figure 7b. Consequently, the simulated flange-forming force results exhibit high accuracy when compared with the experimental results, with a deviation of only 3.92% according to expression (2).
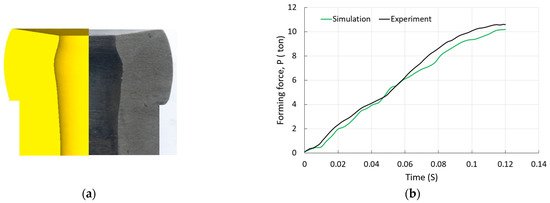
Figure 7.
Comparison between the deformed shape (a) and flange-forming force (b) obtained from both simulation and experimental data for the optimal case.
3.3. Development of a Mathematical Model for Flange-Forming Force
The flange-forming force of the product after the flange forming of C45 billet tubes is influenced by the parameters H0/D0, S0/D0, and α. The objective is to establish a mathematical relationship between these three parameters and the flange-forming force (PM) of the product. This allows us to analyze the influence trend and evaluate the impact of these parameters on the objective function. To achieve this, we employ the least squares method, which involves building a polynomial model of degree 3 between the flange-forming force (PM) and the parameters H0/D0, S0/D0, and α. Higher-order polynomials are not suitable for this purpose, as they may yield numerous extremes and lack practicality. The model is represented by the following Equation (12):
Using the least squares method and solving the equation with Matlab software, we obtain the values for the 12 coefficients as follows:
To assess the reliability of the regression function (Equation (13)), we conduct an ANOVA analysis. The results are shown in Table 10, indicating that the regression coefficient R2 is 0.98 and the Fisher coefficient F is 1.6741. Both values are lower than the critical value of 8.7 (based on the Fisher criteria), demonstrating high confidence in the mathematical model’s dependence on the parameters H0/D0, S0/D0, and α.
Table 10.
ANOVA analysis.
By employing the Matlab software, a graphical representation (Figure 8) of the relationship between the flange-forming force and the forming process parameters (H0/D0, S0/D0, and α) for the flange forming of C45 billet tubes can be readily generated. The graphical analysis reveals that the flange-forming force exhibits direct proportionality with the pitch angle of the bottom of the punch (α), while displaying an inverse relationship with both H0/D0 and S0/D0.
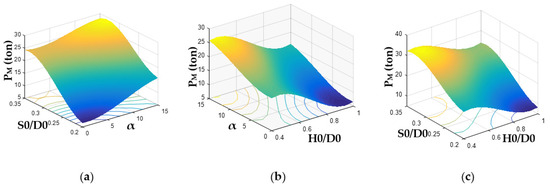
Figure 8.
Relationship between the flange-forming force and the forming process parameters: (a) fixed H0/D0 = 1.0; (b) fixed S0/D0 = 0.2; (c) fixed α = 5°.
Moreover, this study encompasses a comparative assessment between the flange-forming force values derived from the formulated mathematical model (Equation (11)) and the corresponding experimental outcomes. For this evaluation, three sets of randomized parameters are employed for both simulation and testing. Employing the input parameters (H0/D0 = 0.6; S0/D0 = 0.2; and α = 0°), the simulated and experimental profiles presented in Figure 9a exhibit a close similarity to the shape of the flange after the forming process for C45 billet tubes. The discrepancy in the flange-forming force between these two instances amounts to 2.96%, as indicated in Table 11 and illustrated in Figure 9b. In the subsequent case, employing parameters (H0/D0 = 0.6; S0/D0 = 0.2; and α = 0°), the simulated and experimental profiles reveal creases during the flange-forming process, as depicted in Figure 9c. The deviation in forming force between these profiles reaches 3.52%, as illustrated in Figure 9d. Finally, when utilizing the parameter set (H0/D0 = 0.4; S0/D0 = 0.3; and α = 20°), corresponding to the largest punch angle among the cases, the simulated and experimental profiles in Figure 9e demonstrate a consistent geometry of the flange detail during the forming process for C45 billet tubes. The deviation in forming force between these profiles is the smallest, with a value of 1.42%, as depicted in Figure 9f. Additionally, a comparison of forming force results between the mathematical model and the experiment is presented in Table 11 and Figure 10. Notably, the largest deviation of 4.26% is observed for the mathematical model when compared with the experimental results. These findings provide robust evidence for the high dependability of the mathematical model in effectively characterizing the flange-forming force during the flange-forming process of C45 billet tubes, based on the pertinent geometric parameters of the procedure.
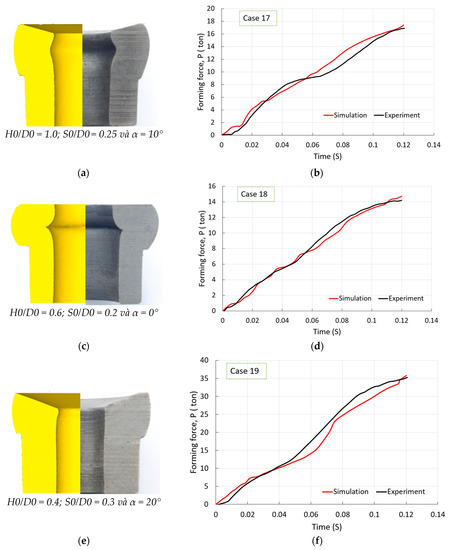
Figure 9.
Comparison between the deformed shapes and corresponding flange-forming force for different case No. 17 (a,b), No. 18 (c,d) and No. 19 (e,f).
Table 11.
Comparison of the flange-forming force during the flange forming of C45 billet tubes, determined from both mathematical and experimental models.
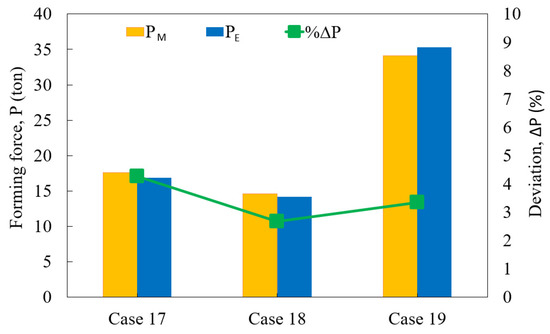
Figure 10.
Comparison between the flange-forming force obtained from regression and experimental functions for different cases.
4. Conclusions
In this study, the influence of stress–strain curves for C45 material at different strain rates on the flange-forming force during the flange forming of C45 billet tubes was analyzed. Additionally, the optimization of the flange-forming process for C45 billet tubes was performed through simulation and experimental verification. The following key conclusions are highlighted:
The stress–strain curve model for C45 material significantly affects the simulation results. The best comparison between simulated and experimental flange-forming force and deformed shape was achieved by using the flow curve equation of materials considering both elevated temperature and strain rates, with a small deviation of 4.19% in the flange-forming force of the product.
S0/D0 has the most significant influence on the flange-forming force of C45 billet tubes at 65%, while H0/D0 and α have lesser effects with impact percentages of 21.1% and 13.9%, respectively.
The optimal parameter set for minimizing the flange-forming force is H0/D0 = 1.0, S0/D0 = 0.2, and α = 5°. This parameter set was simulated and experimentally verified, yielding results with a deviation of 3.92%.
A mathematical model representing the relationship between the input parameters (H0/D0, S0/D0, α) and flange-forming force was developed and evaluated for reliability using the Fisher quality coefficient. The values of the flange-forming force determined from the regression equation were validated against corresponding experimental values, resulting in a maximum deviation of 4.26% in all three cases. Thus, the mathematical model demonstrates high reliability.
Author Contributions
Conceptualization, T.-H.-L.P. and T.-T.L.; Methodology, T.-H.-L.P., T.-T.L. and D.-T.N.; Software, T.-H.-L.P.; Validation, T.-T.L.; Formal analysis, T.-H.-L.P.; Investigation, D.-T.N.; Resources, T.-T.L.; Data curation, T.-T.L.; Writing—original draft, T.-H.-L.P. and T.-T.L.; Writing—review & editing, D.-T.N.; Visualization, D.-T.N.; Supervision, D.-T.N.; Project administration, T.-H.-L.P.; Funding acquisition, T.-H.-L.P. All authors have read and agreed to the published version of the manuscript.
Funding
This research was funded by Hung Yen University of Technology and Education, Vietnam, under grant number UTEHY.L.2021.15.
Conflicts of Interest
The authors declare no conflict of interest.
References
- Mannesmann Demag Hüttentechnik. MD-Dataforge—The Program Control System for MD-Open Die Forge Plants; Mannesmann Demag Hüttentechnik: Mönchengladbach, Germany, 1990. [Google Scholar]
- Politis, N.J.; Politis, D.J.; Davies, C.M.; Lin, J.; Dean, T.A. An experimental and numerical investigation into forming force reduction in precision gear forging. Key Eng. Mater. 2014, 622–623, 165–173. [Google Scholar] [CrossRef]
- Cai, J.; Dean, T.A.; Hu, Z.M. Alternative die designs in net-shape forging of gears. J. Mater. Process. Technol. 2004, 150, 48–55. [Google Scholar] [CrossRef]
- Tüzün, A. Analysis of Tube Upsetting; CWL Publ. Enterp. Inc.: Madison, WI, USA, 2004; Volume 2004, p. 352. [Google Scholar]
- Reddy, P.; Reddy, G.; Prasad, P. A Review on Finite Element Simulations in Metal Forming. Int. J. Mod. Eng. Res. 2012, 2, 2326–2330. [Google Scholar]
- Altan, T.; Ngaile, G.; Shen, G. Cold and Hot Forging: Fundamentals and Applications; AMS International: Dubai, United Arab Emirates, 2005; Volume 1, p. 341. [Google Scholar]
- Totry, E.; Molina-Aldareguía, J.M.; González, C.; Llorca, J. Effect of fiber, matrix and interface properties on the in-plane shear deformation of carbon-fiber reinforced composites. Polym. Test. 2022, 70, 105042. [Google Scholar] [CrossRef]
- Du, C.; Shu, D.; Du, Z.; Gao, G.; Wang, M.; Zhu, Z.; Xu, L. Effect of L/D on penetration performance of tungsten fibre/Zr-based bulk metallic glass matrix composite rod. Int. J. Refract. Met. Hard Mater. 2019, 85, 105042. [Google Scholar] [CrossRef]
- Chen, F.; Ou, H.; Gatea, S.; Long, H. Hot tensile fracture characteristics and constitutive modelling of polyether-ether-ketone (PEEK). Polym. Test. 2017, 63, 168–179. [Google Scholar] [CrossRef]
- Mac, T.-B.; Luyen, T.-T.; Nguyen, D.-T. A Study for Improved Prediction of the Cutting Force and Chip Shrinkage Coefficient during the SKD11 Alloy Steel Milling. Machines 2022, 10, 229. [Google Scholar] [CrossRef]
- Liu, L.; Wu, W.; Zhao, Y.; Cheng, Y.; Xiaojun, D.; Ma, S. Experimental study on dynamic recrystallization of titanium alloy Ti6Al4V at different strain rates. Mater. Res. Express 2022, 9, 046526. [Google Scholar] [CrossRef]
- Wang, L.; Wang, Z.L.; Zhang, S.Y.; Lin, Y.C.; Fu, M.Y. Springback prediction model of Ti-6Al-4V tube warm bending based on modified JC model considering variable temperature field. IOP Conf. Ser. Mater. Sci. Eng. 2022, 1270, 012048. [Google Scholar] [CrossRef]
- Wang, H.; Ding, Z.; Liu, H.; Li, N. Error analysis of stress-strain characterisation on solid-state polymers under simple shear deformation using V-Notched Rail shear test. Engrxiv 2022, 1–27. [Google Scholar] [CrossRef]
- Shokry, A.; Gowid, S.; Mulki, H.; Kharmanda, G. On the Prediction of the Flow Behavior of Metals and Alloys at a Wide Range of Temperatures and Strain Rates Using Johnson–Cook and Modified Johnson–Cook-Based Models: A Review. Materials 2023, 16, 1574. [Google Scholar] [CrossRef] [PubMed]
- Wos, P.; Dindorf, R. Energy-Saving Hot Open Die Forging Process of Heavy Steel Forgings on an Industrial Hydraulic Forging Press. Energies 2020, 13, 1620. [Google Scholar] [CrossRef]
- Reinisch, N.; Rudolph, F.; Günther, S.; Bailly, D.; Hirt, G. Successful pass schedule design in open-die forging using double deep Q-learning. Processes 2021, 9, 1084. [Google Scholar] [CrossRef]
- Winiarski, G. Theoretical and Experimental Study on the Effect of Selected Parameters in a New Method of Extrusion with a Movable Sleeve. Materials 2022, 15, 4585. [Google Scholar] [CrossRef]
- Miłek, T. Effect of Workpiece Slenderness on the Numerical Flow Lines Distribution in the Cross-Section of a Circular-Symmetric Part Hot Die Forged with a Hammer. Adv. Sci. Technol. Res. J. 2022, 16, 108–117. [Google Scholar] [CrossRef]
- Behrens, B.A.; Uhe, J.; Ross, I.; Peddinghaus, J.; Ursinus, J.; Matthias, T.; Bährisch, S. Tailored Forming of hybrid bulk metal components. Int. J. Mater. Form. 2022, 15, 42. [Google Scholar] [CrossRef]
- Khan, W.A.; Hayat, Q.; Ahmed, F.; Ali, M.; Zain-ul-Abdein, M. Comparative Assessment of Mechanical Properties and Fatigue Life of Conventional and Multistep Rolled Forged Connecting Rods of High Strength AISI/SAE 4140 Steel. Metals 2023, 13, 1035. [Google Scholar] [CrossRef]
- Alves, L.M.; Afonso, R.M.; Silva, C.M.A.; Martins, P.A.F. Boss forming of annular flanges in thin-walled tubes. J. Mater. Process. Technol. 2017, 250, 182–189. [Google Scholar] [CrossRef]
- Alves, L.M.; Afonso, R.M.; Silva, C.M.A.; Martins, P.A.F. Joining tubes to sheets by boss forming and upsetting. J. Mater. Process. Technol. 2018, 252, 773–781. [Google Scholar] [CrossRef]
- DIN EN ISO 9445-1:2010-06; Continuously Cold-Rolled Stainless Steel-Tolerances on Dimensions and Form-Part 1: Narrow Strip and Cut Lengths (ISO 9445-1:2009). Beuth Verlag: Berlin, Germany, 2010.
- Wang, Z.J.; Cheng, L.D. Effect of material parameters on stress wave propagation during fast upsetting. Trans. Nonferrous Met. Soc. China 2008, 18, 1189–1195. [Google Scholar] [CrossRef]
- Corporation, B.S. Physical modeli g of the upsetting process in open-die p ress forging. J. Mech. Work. Technol. 1989, 19, 195–210. [Google Scholar]
- Essa, K.; Kacmarcik, I.; Hartley, P.; Plancak, M.; Vilotic, D. Upsetting of bi-metallic ring billets. J. Mater. Process. Technol. 2012, 212, 817–824. [Google Scholar] [CrossRef]
- Su, Y.L.; Yang, W.Z.; Wang, C.P. Upsetting process analysis and numerical simulation of metal pipe’s end. Appl. Mech. Mater. 2013, 364, 488–492. [Google Scholar] [CrossRef]
- Kajtoch, J. Strain in the Upsetting Process. Met. Foundry Eng. 2007, 33, 51. [Google Scholar] [CrossRef]
- Luyen, T.T.; Mac, T.B.; Nguyen, D.T. Simulation and experimental comparison study based on predicting forming limit curve of SUS304 sheet material. Mod. Phys. Lett. B 2023, 2340001. [Google Scholar] [CrossRef]
- Tang, H.; Hao, C.; Jiang, Y.; Du, L. Forming process and numerical simulation of making upset on oil drill pipe. Acta Metall. Sin. (Engl. Lett.) 2010, 23, 72–80. [Google Scholar]
- Bricout, J.P.; Oudin, J.; Liebaert, P.; Ravalard, Y. Hot-upsetting tests on steel cylinders after solidification. J. Mater. Process. Technol. 1992, 30, 315–328. [Google Scholar] [CrossRef]
- Yahaya, A.; Samion, S.; Abidin, U.; Kameil, M.; Hamid, A. Different Behaviors of Friction in Open and Closed Forging Test Utilizing Palm Oil-Based Lubricants. Lubricants 2023, 11, 114. [Google Scholar] [CrossRef]
- Mac, T.-B.; Luyen, T.-T.; Nguyen, D.-T. The Impact of High-Speed and Thermal-Assisted Machining on Tool Wear and Surface Roughness during Milling of SKD11 Steel. Metals 2023, 13, 971. [Google Scholar] [CrossRef]
- Bui, T.-A.; Pham, V.-H.; Nguyen, D.-T.; Bui, N.-T. Effectiveness of Lubricants and Fly Ash Additive on Surface Damage Resistance under ASTM Standard Operating Conditions. Coatings 2023, 13, 851. [Google Scholar] [CrossRef]
- Pop, M.F.; Neag, A.V.; Sas-Boca, I.M. Experimental and Numerical Study on the Influence of Lubrication Conditions on AA6068 Aluminum Alloy Cold Deformation Behavior. Materials 2023, 16, 2045. [Google Scholar] [CrossRef] [PubMed]
- Kotous, J.; Kubec, V.; Duchek, M.; Studecký, T. Optimization of workability technological testing for open-die Forg. Conf. Ser. Mater. Sci. Eng. 2020, 723, 012015. [Google Scholar] [CrossRef]
- Nagasekhar, A.V.; Kim, H.S. Analysis of T-shaped equal channel angular pressing using the finite element method. Met. Mater. Int. 2008, 14, 565–568. [Google Scholar] [CrossRef]
- Boroomand, B.; Parvizian, J.; Pishevar, A.R. Contact modeling in forging simulation. J. Mater. Process. Technol. 2002, 125–126, 583–587. [Google Scholar] [CrossRef]
- Wang, M.; Li, D.; Wang, F.; Zang, X.; Li, X.; Xiao, H.; Du, F.; Zhang, F.; Jiang, Z. Analysis of laminated crack defect in the upsetting process of heavy disk-shaped forgings. Eng. Fail. Anal. 2016, 59, 197–210. [Google Scholar] [CrossRef]
- Search, H.; Journals, C.; Contact, A.; Iopscience, M.; Simul, M.; Address, I.P. Simulation of three-dimensional bulk forming processes by finite element flow formulation. Inst. Phys. Publ. Model. Simul. Mater. Sci. Eng. 2003, 803. [Google Scholar] [CrossRef]
- Schiemann, T.; Liewald, M.; Beiermeister, C.; Till, M. Influence of process chain on fold formation during flange upsetting of tubular cold forged parts. Procedia Eng. 2014, 81, 352–357. [Google Scholar] [CrossRef]
- Pham, Q.T.; Kim, J.; Luyen, T.T.; Nguyen, D.T.; Kim, Y.S. Application of a Graphical Method on Estimating Forming Limit Curve of Automotive Sheet Metals. Int. J. Automot. Technol. 2019, 20 (Suppl. S1), 3–8. [Google Scholar] [CrossRef]
- Schiemann, T.; Liewald, M. Mechanisms of fold formation during flange upsetting of tubular parts Mechanisms of Fold Formation during Flange Upsetting of Tubular Parts. AIP Conf. Proc. 2013, 1532, 284–290. [Google Scholar] [CrossRef]
- Luyen, T.; Tong, V.; Nguyen, D. A simulation and experimental study on the deep drawing process of SPCC sheet using the graphical method. Alex. Eng. J. 2021, 61, 2472–2483. [Google Scholar] [CrossRef]
- The-Thanh, L.; Tien-Long, B.; The-Van, T.; Duc-Toan, N. A study on a deep-drawing process with two shaping states for a fuel-filter cup using combined simulation and experiment. Adv. Mech. Eng. 2019, 11. [Google Scholar] [CrossRef]
- Palmieri, M.E.; Galetta, F.R.; Tricarico, L. Study of Tailored Hot Stamping Process on Advanced High-Strength Steels. J. Manuf. Mater. Process. 2022, 6, 11. [Google Scholar] [CrossRef]
- Yi, L.; Yu, G.; Tang, Z.; Li, X.; Gu, Z. Investigation of the Hot Stamping-in-Die Quenching Composite Forming Process of 5083 Aluminum Alloy Skin. Materials 2023, 16, 2742. [Google Scholar] [CrossRef]
- Dong, T.; Toan, N.; Dung, N. Influence of heat treatment process on the hardness and material structure of SKD61 tool steel. Mod. Phys. Lett. B 2023, 37, 2340014. [Google Scholar] [CrossRef]
- Gebremeskel, S.; Uppala, R. Effect of Hot Forging on Chemical Composition and Metallographic Structure of Steel Alloys. Glob. J. Res. Eng. Mech. Mech. Eng. 2012, 12, 33–42. [Google Scholar]
- Mac, T.-B.; Luyen, T.-T.; Nguyen, D.-T. Assessment of the Effect of Thermal-Assisted Machining on the Machinability of SKD11 Alloy Steel. Metals 2023, 13, 699. [Google Scholar] [CrossRef]
- Durukan, İ. Effects of induction heating parameters on forging billet temperature. Master Sci. Mech. Eng. Dep. Middle East Tech. Univ. 2007, 46, 171–174. [Google Scholar] [CrossRef]
- Galkin, V.; Kurkin, A.; Gavrilov, G.; Kulikov, I.; Bazhenov, E. Investigation of the Technological Possibility of Manufacturing Volumetric Shaped Ductile Cast Iron Products in Open Dies. Materials 2022, 16, 274. [Google Scholar] [CrossRef]
- Mesbah, A. Formulation and evaluation a finite element model for free vibration and buckling behaviours of functionally graded porous (FGP) beams. Struct. Eng. Mech. 2023, 86, 291–309. [Google Scholar] [CrossRef]
- Katiyar, V.; Gupta, A.; Tounsi, A. Microstructural/geometric imperfection sensitivity on the vibration response of geometrically discontinuous bi-directional functionally graded plates (2D-FGPs) with partial supports by using FEM. Steel Compos. Struct. 2022, 45, 621–640. [Google Scholar] [CrossRef]
- Luyen, T.T.; Nguyen, D.T. Improved uniformity in cylindrical cup wall thickness at elevated temperatures using deep drawing process for SPCC sheet steel. J. Braz. Soc. Mech. Sci. Eng. 2023, 45, 348. [Google Scholar] [CrossRef]
- Rajesh, K.V.D.; Mishra, H.; Buddi, T. Finite Element Analysis of Chromium and Molybdenum Alloyed Steel Billets Forged on Multi Step Process Using Simufact Forming. Adv. Mater. Process. Technol. 2021, 8, 1260–1274. [Google Scholar] [CrossRef]
- Luyen, T.T.; Mac, T.B.; Banh, T.L.; Nguyem, D.T. Investigating the impact of yield criteria and process parameters on fracture height of cylindrical cups in the deep drawing process of SPCC sheet steel. Int. J. Adv. Manuf. Technol. 2023. [Google Scholar] [CrossRef]
- Rajesh, K.V.D.; Buddi, T.; Mishra, H. Finite element simulation of Ti-6Al-4V billet on open die forging process under different temperatures using deform-3d. Adv. Mater. Process. Technol. 2021, 8, 1963–1972. [Google Scholar] [CrossRef]
- Banaszek, G.; Bajor, T.; Kawałek, A.; Knapiński, M. Modeling of the Closure of Metallurgical Defects in the Magnesium Alloy Die Forging Process. Materials 2022, 15, 7465. [Google Scholar] [CrossRef] [PubMed]
- TCVN 1766:1975; High Quality Structural Carbon Steels—Marks and Specifications. TCVN: Hanoi, Vietnam, 1975.
- Laber, K.; Dyja, H.; Kawałek, A.; Sawicki, S. Determination of characteristics of plasticity of selected medium and high carbon steel grades in hot torsion test. Metalurgija 2016, 55, 635–638. [Google Scholar]
- Taguchi, G.; Chowdhury, S.; Wu, Y.; Taguchi, S. Hiroshi Yano. In Taguchi’s Quality Engineering Handbook; ASI Consult. Group: Bingham Farms, MI, USA, 2005. [Google Scholar]


Disclaimer/Publisher’s Note: The statements, opinions and data contained in all publications are solely those of the individual author(s) and contributor(s) and not of MDPI and/or the editor(s). MDPI and/or the editor(s) disclaim responsibility for any injury to people or property resulting from any ideas, methods, instructions or products referred to in the content. |
© 2023 by the authors. Licensee MDPI, Basel, Switzerland. This article is an open access article distributed under the terms and conditions of the Creative Commons Attribution (CC BY) license (https://creativecommons.org/licenses/by/4.0/).