Abstract
This paper presents a new type of wind guide barrier (WGB). Through wind tunnel experiments, the key parameters of three types of WGB were studied, as well as their effects on the aerodynamic characteristics of a high-speed train and blunt body box girder system, while the bridge deck wind field was investigated. The results show that the shielding effect is the main factor affecting the windproof performance of the WGB. When the WGB is installed, the mean wind pressure distribution on the train is comparable to that of using a vertical wind barrier while reducing barrier resistance and the resistance of the bridge–barrier system. At the same time, the WGB can guide the oncoming flow, resulting in an increase in the streamwise and vertical wind velocity ratios on the bridge deck, as well as an increase in the maximum aerodynamic coefficient on the train.
1. Introduction
With the construction and development of railways, it is inevitable that railway lines will pass through areas prone to frequent wind disasters, such as coastal areas and mountainous canyons. At the same time, new high-speed trains (HST) are becoming faster and lighter, which increases the operational risks of trains under strong crosswinds. Train accidents such as overturning and derailments occur frequently. Therefore, ensuring the operational safety of HST under strong wind conditions has become an important concern for high-speed railway operating departments. Compared with establishing a wind monitoring and early warning system and optimizing the aerodynamic shape of HST, setting up wind barriers is considered to be a more economical and applicable method to ensure the safe operation of HST. Therefore, research on the windproof performance of wind barriers is increasingly valued.
The shielding effect of wind barriers creates a relatively safe local wind environment for HST []. Researchers believe that the reduction of mean wind velocity and the variation of turbulence are two important factors that affect windproof performance [,,]. Barcala et al. [] used a visualization method to study the effect of wind barrier height and porosity on the flow field structure around bridges. Zhang et al. [] tested the wind velocity behind the wind barrier through wind tunnel experiments and found that low porosity can reduce wind velocity and lead to high turbulence. Kozmar et al. [] observed the distribution of mean wind velocity and vorticity behind the wind barrier using the particle image velocimetry (PIV) method; high turbulence and low wind velocity were observed near the bridge deck, with the wind velocity recovering at a height of 1 m. Similarly, by observing the wake structure after installing four types of wind barriers using the PIV method, Çoskun et al. [] believed that jet–wake–wall interaction had a significant influence on the mean wind characteristics and fluctuating wind characteristics. Gu et al. [] proposed a corrugated wind barrier and believed that the regular bending of the guide plate could reduce the intensity and kinetic energy of turbulence. Based on this research, Gu et al. [] conducted wind tunnel experiments considering wind barriers of different lengths and evaluated the influence of wind barrier length on the aerodynamic performance of trains, pointing out that at wind angles of 20° and 30°, the train would obtain relatively unfavorable aerodynamics. Xiang et al. [] evaluated the windproof performance of wind barriers using the data envelopment analysis (DEA) method, indicating that reasonable wind barrier height and porosity would enable HST to have better aerodynamic performance, and other studies have reached similar conclusions [,].
Bridges account for over 50% of newly built railway lines in China, as bridges are better adapted to complex geological structures and provide significantly improved ride comfort. However, the widespread use of bridges also brings new issues. Research by Zhang et al. [] showed that wind barriers transmitted wind loads to bridges, which significantly increased the bridge’s lateral force coefficient, as well as the train’s lateral force and lift coefficients on the bridge. Buljac et al. [] also pointed out that installing wind barriers will reduce the flutter stability of bridges with typical cross-sections, but the galloping stability remains essentially unchanged. Guo et al. [] found that the porosity of wind barriers significantly affects the vertical displacement of bridges and the derailment coefficient of trains. Ogueta-Gutiérrez et al. [] found that wind barriers with straight or curved pipes do not significantly change the aerodynamic performance of trains. Additionally, Guo et al. [] noted that the relative position of trains on bridges has a significant impact on the aerodynamic characteristics of the train–bridge system. Yu et al. [] conducted wind tunnel experiments on a non-uniform cross-section box girder and found that the cross-sectional shape of the bridge greatly affects the wind velocities above the track. To improve the wind resistance of trains and bridges, extensive research has been conducted. Ren et al. [] found that wind barriers with lower porosity at lower positions have better shielding effects by changing the porosity of different parts of the wind barrier. Dai et al. [] proposed a variable-shape glass-fiber-reinforced plastic (GFRP) wind barrier that can reduce wind loads on bridges. Liu et al. [] effectively improved the vortex-induced vibration performance of bridges by arranging wind barriers according to certain rules. Taylor et al. [] found that the turning effect of wind barrier blades significantly regulates the flow field on the bridge in their study of the aerodynamic performance of pedestrian bridges. Based on Taylor’s work, He et al. [,] proposed a new type of louvered wind barrier and found that louvered wind barriers with a certain inclination angle can regulate the surface wind pressure distribution of trains, thereby reducing the train’s moment coefficient under the premise of minimal aerodynamic changes to the bridge.
This paper studies a new type of WGB that deflects the airflow horizontally for aerodynamic design. This wind barrier has been applied to many new high-speed railway bridges. Through wind tunnel experiments, the study investigates the effects of three WGB parameters on the aerodynamic characteristics of HST and bridges. To reveal the windproof performance of the new WGB, we measured the mean wind pressure and pulsating wind pressure on the surface of the train and bridge. In addition, the wind field characteristics on the bridge deck were also tested, and the wind velocity and turbulence field after the wind barrier were analyzed, including the three-direction wind velocity components and turbulence intensity, to comprehensively evaluate the windproof performance. The rest of this paper is organized as follows: Section 2 introduces the outline of the experimental procedure. Section 3 describes the effect of the WGB on the aerodynamic characteristics of the train–bridge system. Section 4 analyzes the effect of the WGB on the wind field characteristics around the bridge deck. Finally, conclusions are drawn in Section 5.
2. Outline of the Experimental Procedure
2.1. Design Parameters of WGB
The design parameters of the new WGB are shown in Figure 1. This WGB is mainly composed of a guide plate, longitudinal connecting rods, and anchor devices. The guide plates are uniformly connected to the longitudinal connecting rods at a spacing of D1 to form a whole and are anchored to the foundation to be connected to the bridge. The guide plate consists of a main windward surface, a secondary guide angle, and reinforcement ribs on both sides. The shielding effect of the WGB is mainly provided by the main windward surface, and the transverse wind deflection angle θ1 of the main windward plate is set to guide the transverse wind direction to the side. The upper part of the windward plate is provided with a guide angle with a width of h1, which deflects the airflow inward by an angle of θ2 to guide it upwards and reduce the wind pressure on the barrier. In addition, there are pressure relief holes on the main windward plate and the secondary guide angle. The wind deflector adopts an outward inclination of 10°, which can enhance the wind resistance effect and reserve more operation space on the bridge. The distance D between the WGB and the centerline of the track can be freely adjusted according to engineering needs.
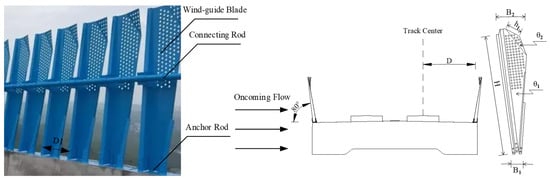
Figure 1.
Design parameters of WGB.
2.2. Section Model and Wind Velocity Measuring Points
As shown in Figure 2, we used prototypes of the CRH380 HST and a blunt box girder bridge to conduct wind tunnel experiments. To avoid distortion of test results due to the Reynolds number effects, HST and bridge models were made at a large scale of 1:15. Under a uniform oncoming flow of 12 m/s, the model Reynolds number can reach 1.9 × 10⁵. At this time, the bridge model is 0.23 m high and 0.97 m wide, and the train model size is 0.233 m (height) × 0.225 m (width). We set the measuring sections at 1/4, 1/2, and 3/4 of the model. Thirty measuring points were arranged for each train section, and 42 measuring points were arranged for each bridge section. To avoid the influence of distortion effects, the length of all pressure measurement tubes was set to 0.5 m. According to Xiang et al. [], the aperture size of the wind barrier may affect the test results. Considering that the aperture of the wind barrier model will be smaller than 2 mm after being scaled proportionally, it will affect the formation of the jet through the pressure relief hole. Therefore, under the premise of ensuring the same area of the ventilation surface, the pressure relief holes on the barrier are enlarged and rearranged in the corresponding positions. The wind tunnel experiments were carried out in the high-speed test section of the wind tunnel laboratory at Central South University. The size of the test section is 15.0 m (length) ×3.0 m (width) × 3.0 m (height). Considering the limitation of the maximum (max) blockage ratio of the wind tunnel experiment, the model length is defined as 2 m. The model is placed at a height of 1.6 m from the ground, and large end plates are placed on both sides to effectively avoid the interference of end effects and wind tunnel wall effects on the test results. All models are made of high-strength ABS sheets to ensure sufficient rigidity. The wind field test uses a mobile testing system independently developed by Central South University, which can accurately control the spatial position of the Cobra probe through the mobile measurement frame and self-developed control software. The wind velocity point layout scheme is shown in Figure 3, and a gradually denser layout is adopted from the top to the bottom. A total of 4 test surfaces and 44 wind velocity measurement points are arranged from the windward side to the leeward side of the track centerline. The sampling frequency of the Cobra probe manufactured and calibrated by Turbulent Flow Instruments (TFI) Company is set to 2048 Hz, and the sampling time was 20 s. Each measurement point collects 40,960 data points to ensure the reliability of wind velocity test results.
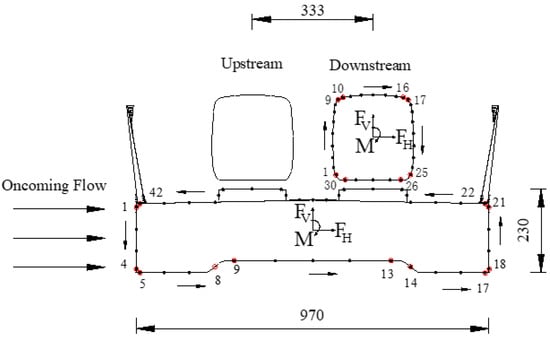
Figure 2.
Arrangements of pressure taps on the train and bridge cross-section (unit: mm).
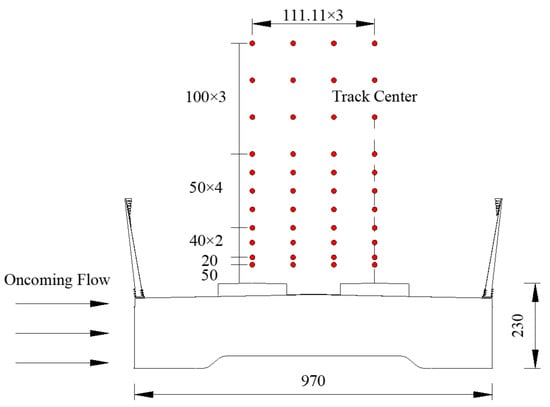
Figure 3.
Arrangement of wind velocity measuring points (unit: mm).
The following aspects will be tested in the experiments:
(1) Pressure measurement on trains and bridges. The pressure distribution on the surfaces of trains and bridges under crosswind was tested using PSI pressure scanning valves placed inside the model.
(2) Force measurement on bridges and wind barriers. Two ATI-type scales were installed on both sides of the model end plate to measure the aerodynamic forces of the bridge–barrier system.
(3) Wind velocity measurements on the bridge deck. A mobile testing system developed by Central South University was used to test the wind velocity on the bridge deck using a Cobra probe.
Considering the installation situation on the bridge in practical engineering, the effects of the upper width of the railing, the deflection angle of the secondary guide wind angle, the height of the barrier, the distance from the centerline of the track, and the installation spacing were only considered in this study under the conditions of B2 = 540 mm, θ2 = 20°, H = 3000 mm, D = 3200 mm, and D1 = 500 mm. The effects of five types of WGB on the aerodynamic characteristics of the train and bridge are considered, including three parameters: the angle θ1 of the main deflector plate, the size h1 of the upper deflector angle, and the WGB root width B1. In addition, tests were also conducted for the cases where no barriers were installed and where vertical wind barriers were installed, with the ventilation rate of the vertical wind barrier being the same as that of type 4, and the types of WGB tests have been listed in Table 1. Considering the significant influence of the train position on the windproof performance, this study investigated the cases where the train was located in windward, leeward, and without the train.

Table 1.
Types of WGB tests.
2.3. Data Processing
The mean wind pressure coefficient and fluctuating wind pressure coefficient (standard deviation) of measuring point i can be obtained from the converted wind pressure measured by the scanning valve according to Formulas (1) and (2).
where and P0 are the mean wind pressure and static pressure, respectively; and ρ and UH are the air density (ρ = 1.255 g/cm3) and wind velocity (UH = 12 m/s) during the experiment, respectively.
The aerodynamic coefficients of the train–bridge system can be approximately obtained by integrating the wind pressure coefficients at each measuring point. The aerodynamic force of the WGB can be obtained by subtracting the aerodynamic force of the bridge from the force measured by the ATI-type scale on the bridge–barrier system. The definition of the aerodynamic coefficients is as follows:
where CH, CV, and CM are the lateral force coefficient, lift coefficient, and moment coefficient in the body axis system, respectively; FH, FV, and FM are the aerodynamic forces measured by the ATI-type scale, respectively; Li is the integration length represented by measurement point i; α is the outer normal vector angle of the pressure measuring hole in the model section; H and B are the characteristic height and width of the train and bridge, respectively; the torsional moment coefficient of the train–bridge system is calculated with the centroid of the train and bridge as the reference point.
The original data collected by the Cobra probe includes a matrix of time series sequences of wind velocity in three directions: streamwise direction (u), bridge transverse direction (v), and bridge vertical direction (w). After removing bad data points, the mean wind velocity for each direction is calculated by taking the mean of the valid data points. The vector sum of the three mean wind velocity , , is used to obtain the overall mean wind velocity . The total turbulence intensity Itotal is equal to the ratio of the turbulent pulsation velocity to the mean velocity, Itotal is calculated according to Equation (10).
3. Train–Bridge System Aerodynamic Characteristics
3.1. The HST Aerodynamic Characteristics
3.1.1. Aerodynamic Coefficients of HST
The aerodynamic coefficients acting on a train can intuitively reflect the windproof performance of wind barriers. Figure 4 and Figure 5 show the mean and extreme aerodynamic coefficients of the train when it is located on the windward and leeward sides of the bridge. The red and blue lines in Figure 4 and Figure 5, respectively, represent the mean aerodynamic coefficient of the train without barriers and with a vertical wind barrier installed. For both train–bridge cases, installing a vertical wind barrier can effectively reduce the train’s drag. Moreover, when a type 4 WGB is installed, the mean aerodynamic coefficient of the train is close to that when a vertical wind barrier is installed, indicating that WGB can provide a similar windproof performance for trains as vertical wind barriers.
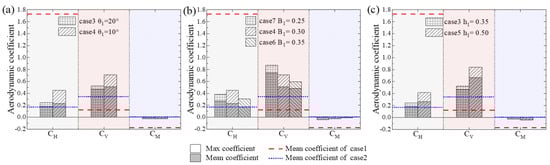
Figure 4.
Effect of WGB parameters on HST aerodynamic coefficients (windward): (a) angle of main deflector plate θ1; (b) width of WGB root B1; (c) size of upper deflector angle h1.
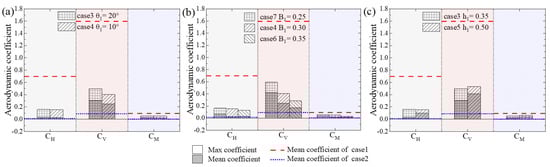
Figure 5.
Effect of WGB parameters on HST aerodynamic coefficient (leeward): (a) angle of main deflector plate θ1; (b) width of WGB root B1; (c) size of upper deflector angle h1.
In order to facilitate the comparison of the effects of different wind barrier parameters on the aerodynamic coefficients of the train, the comparison cases of each parameter were separately plotted. As shown in Figure 4a, when θ1 is slightly adjusted, the mean aerodynamic coefficient of the train remains almost unchanged, but the extreme aerodynamic coefficient of the train is greatly affected by the angle of the windward surface. When θ1 = 20°, the CH extreme value increases from 0.24 to 0.45, and at the same time, the CV extreme value increases from 0.52 to 0.71. As shown in Figure 4b, when B1 is increased from 0.25 m to 0.3 m, the mean CH and mean CV of the train will be reduced to varying degrees, but the extreme CH of the train will increase. At the same time, it should be noted that when B1 is further increased, the mean aerodynamic coefficient of the train does not change significantly, so the optimal value of B1 should be between 0.25 m and 0.3 m. As shown in Figure 4c, when h1 is increased from 0.35 m to 0.5 m, the mean and extreme aerodynamic coefficients of the train will increase. The max CV of the train increases by 60%, which will increase the train’s derailment coefficient. Overall, B1 and h1 are WGB parameters that have a relatively large impact on the aerodynamic coefficients of the train, while θ1 has a relatively small impact. When optimizing the WGB parameters, the adjustment of the first two parameters should be emphasized. It should be noted that the extreme aerodynamic coefficient is sometimes several times larger than the mean aerodynamic coefficient, which means that the extreme aerodynamic coefficient may become a controlling factor in wind barrier design.
When the train is on the leeward side of the track, due to the influence of the bridge deck on the wind field, different lane positions can also cause differences in the aerodynamic characteristics of trains []. As shown in Figure 5, the effects of various WGB parameters on the mean aerodynamic coefficient of the train are similar. However, the magnitude of the mean aerodynamic coefficient and the difference in the mean aerodynamic coefficient caused by the parameter changes are greatly reduced compared to when the train is on the upstream side. This may be because the entire train is in the low-pressure wake of the barrier, away from the flow separation point.
3.1.2. Wind Pressure Distribution on HST
Testing the surface pressure distribution of trains can help understand the reasons for changes in train aerodynamics. Figure 6 shows the distribution of mean wind pressure on HST upstream. When the train is on the upstream side of the track, Figure 6a shows that after installing the WGB, the leeward part of the train roof and bottom, as well as the mean wind pressure on the leeward side of the train, remain almost unchanged, but the mean wind pressure on the windward side of the train changes from positive to negative. Compared with vertical wind barriers, the installation of the guide vanes does not significantly change the overall wind pressure distribution of the train, which verifies the view that WGBs have the same train protection effect as the vertical wind barriers mentioned earlier. It is worth noting that when the WGBs are installed, there is an increase in suction force at the shoulder of the train, which may be due to the upward deflection effect of the secondary deflection angle on the airflow. When θ1 = 10°, as shown in Figure 6b, compared with θ1 = 20°, the barrier blocks more airflow, resulting in lower pressure in the low-pressure area behind the barrier, which enhances the overall negative pressure of the train. The shoulder part is more sensitive to the changes in the inflow as it is immersed in the separated airflow, so it shows more obvious differences, which can also be observed in cases when h1 is changed. Surprisingly, as shown in Figure 6c, changing B1 does not significantly affect the mean wind pressure on the bottom of the train. When B1 is increased from 0.25 m to 0.3 m, only the trend of the separation point moving up and the weakening of the suction force at the shoulder of the train can be observed, and further increasing B1 will not significantly change the mean wind pressure on the train.
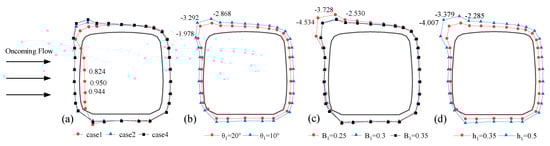
Figure 6.
Effect of WGB parameters on HST mean pressure (windward): (a) without a wind barrier; (b) angle of the main deflector plate θ1; (c) width of the WGB root B1; (d) size of the upper deflector angle h1.
When HST is on the downstream side of the track, as shown in Figure 7, compared with on the upstream side, the positive pressure on the windward side of the train decreases, and the negative pressure at the shoulder of the train increases to −7.328. After installing the WGB, the separation of airflow at the shoulder of the train essentially disappears, and the overall aerodynamic level of the train is reduced, with no significant pressure jumps at each measurement point, indicating that the various WGB used in the test can meet the windproofing needs of downstream trains. Overall, when HST is on the upstream side, it is the worst bridge–train system case and should be given priority consideration in design.
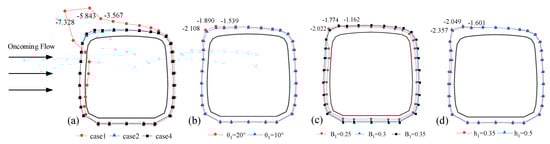
Figure 7.
Effect of WGB parameters on HST mean pressure (leeward): (a) without a wind barrier; (b) angle of the main deflector plate θ1; (c) width of the WGB root B1; (d) size of the upper deflector angle h1.
To further analyze the causes of the extreme aerodynamic forces on the train, we plotted the fluctuating wind pressure coefficient at each measurement point (Figure 8 and Figure 9). For ease of observation, the figures also show the differences in fluctuating wind pressure coefficients under different parameter configurations. When various types of WGB are installed, the max fluctuating wind pressure coefficient values are all found at measurement point 9. The max fluctuating wind pressure coefficient in all cases is less than 0.3 and only greater than 0.1 near the train shoulder. This indicates that the guide function of the WGB mainly affects the train shoulder and does not cause an increase in turbulence at the bottom of the train or on the leeward side. The variation in the fluctuating wind pressure coefficient at the train shoulder is the main cause of the extreme aerodynamic forces on the train. Overall, θ1 and h1 are the most important factors affecting the fluctuating wind pressure coefficient. A smaller B1 and a larger θ1 both increase turbulence at the train shoulder and increase the sensitivity of the flow field at the train shoulder to other WGB parameters.
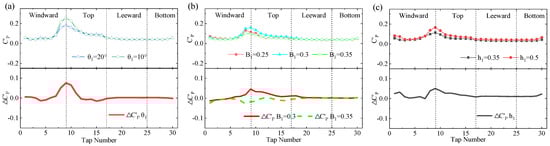
Figure 8.
Effect of WGB parameters on HST fluctuating pressure (windward): (a) angle of the main deflector plate θ1; (b) width of the WGB root B1; (c) size of the upper deflector angle h1.
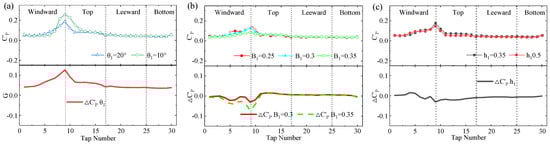
Figure 9.
Effect of WGB parameters on HST fluctuating pressure (leeward): (a) angle of the main deflector plate θ1; (b) width of the WGB root B1; (c) size of the upper deflector angle h1.
3.2. The Bridge Aerodynamic Characteristics
3.2.1. Aerodynamic Coefficients of Bridge
Wind barriers can ensure that trains travel in a safe wind environment, but when installing them on flexible bridges, the height of the wind barrier installed may approach or even exceed the height of the girder, which undoubtedly greatly increases the blunt characteristics of the barrier-bridge system, resulting in a significant change in the aerodynamics of the system. Figure 10 illustrates the CV and CH of the bridge–barrier system, as well as the CH of the WGB with different installations. Notably, the aerodynamic coefficient of the bridge is higher without the train or when the train is located downstream, but decreases when the train is upstream due to the forward separation point of the airflow. Generally speaking, the CH of the WGB roughly follows the law of increasing with B1 and decreasing with θ1 and h1. Compared with the vertical wind barrier, the installation of a WGB (type 4) with the same ventilation rate can reduce the max resistance and barrier resistance of the bridge–barrier system under various train–bridge combinations by 12% and 32%, respectively. Ultimately, the use of a WGB is more beneficial for the structural safety of both the bridge and wind barriers.
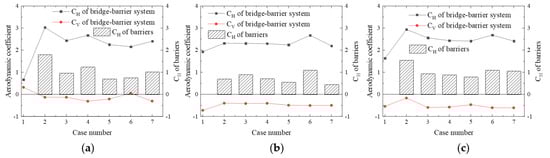
Figure 10.
Aerodynamic coefficients of bridge and barrier: (a) without train; (b) the train is located windward; (c) the train is located leeward.
3.2.2. Wind Pressure Distribution on Bridge
As shown in Figure 11, the bridge is divided into 12 zones based on the variation of the cross-section. Zone I is the windward side, zones II–IV are the bottom side, zone V is the leeward side, and zones VI–IX are the top side. For the bare bridge, positive wind pressure occurs throughout the windward side, with the max positive pressure appearing at measuring point 2 and the wind pressure coefficient reaching 0.94. The entire bottom and top of the bridge exhibit negative pressure, with a significant negative pressure zone appearing at the front edge of zones II–III on the bottom and the front edge on the top. The extreme negative pressure coefficients are −1.56 and −2.03, respectively, while the negative pressure decreases gradually from the rear to the leeward side. When WGBs are installed on the bridge, the positive pressure on the windward side decreases, the negative pressure on the bottom side increases, and the strong negative pressure zone on the bridge surface is suppressed. Meanwhile, the negative pressure decreases, leading to an increase in bridge CH and a decrease in CV. When there are trains on the bridge, the wake width of the train–bridge system increases, and the extreme wind pressure coefficient in zone IX changes from −0.83 to 0.53 when perforated wind barriers are installed. The pressure in zones VIII and VII (the ballast) is enhanced due to the acceleration of the train’s pressure airflow, especially when the train is located on the windward side of the track, and the extreme negative pressure increases from −1.03 to −1.45. Compared to the vertical wind barrier, the installation of WGB can suppress the strong negative pressure on the ballast and reduce the influence of train position on the wind pressure distribution of the bridge.
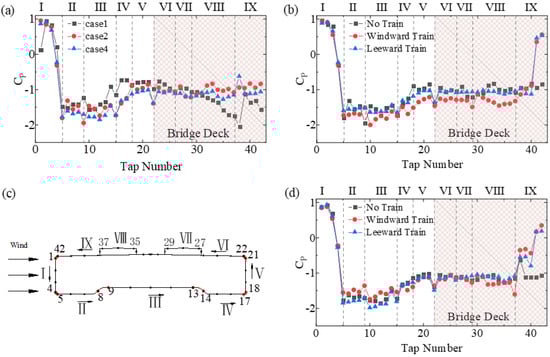
Figure 11.
Wind pressure distribution on the bridge: (a) with or without wind barriers (for upstream trains); (b) installing a WGB for different train and bridge combinations in Case 2; (c) bridge pressure zoning; (d) installing a WGB for different train and bridge combinations in Case 4.
As shown in Figure 11, when there is no train on the bridge and various types of WGB are installed, the overall distribution of wind pressure on the bridge is consistent: the entire windward surface shows positive pressure, with the max positive pressure appearing at the 2# measuring point on the windward surface; except for the 8#, 9#, 14#, and 15# measuring points in the corner area where the negative pressure is relatively small, the entire bottom surface shows strong negative pressure; the leeward side of the bridge shows relatively weak negative pressure, and the max negative pressure on the bridge surface appears near the 22# measuring point at the rear corner of the bridge, while the minimum negative pressure appears on the side of the windward track bed at the 38# point. From Figure 12, it can be seen that adjusting θ1 and h1 has almost no effect on the surface wind pressure distribution of the bridge. When B1 is increased, the airflow passing through the bottom of the wind barrier is reduced, the forward flow on the windward surface is slowed down, and the wind pressure on the windward surface is reduced. At the same time, the separation of the airflow in the system accelerates, resulting in an increase in negative pressure on the bottom surface and bridge surface.
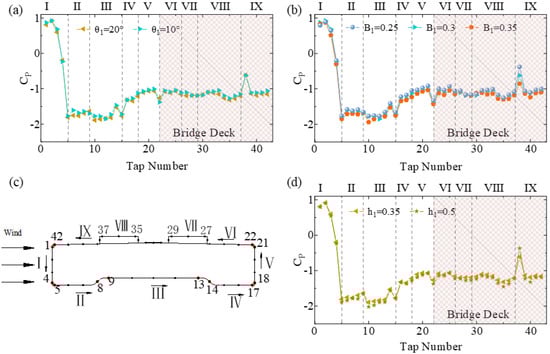
Figure 12.
Effect of WGB parameters on bridge wind pressure distribution: (a) angle of the main deflector plate θ1; (b) width of the WGB root B1; (c) pressure distribution zones on the bridge; (d) size of the upper deflector angle h1.
In summary, the wind-guiding effect of the WGB suppresses pressure fluctuations at the track, but adjusting the flow parameters such as θ1 and h1 will not have a significant impact on the overall wind pressure distribution of the bridge, while changes to some parameters such as B1 will affect the separation and flow around the oncoming airflow.
4. Flow Field Characteristics behind the WGB
4.1. Mean Wind Characteristics
4.1.1. Streamwise Velocity (u) Distributions
To investigate the effect of WGB on the flow field of bridge deck wake, this paper presents the contour lines of the three-direction wind velocity components in various cases. It can be seen in Figure 13 that the shielding effect of WGB is worse due to vertical wind barriers. Due to the flow around the WGB, a shear layer is formed above the barrier, and its height increases gradually from upstream to downstream. Moreover, the airflow passing through the gap at the bottom of the WGB forms a jet, which creates a high-speed area with a wind velocity ratio of over 0.6 at the bottom of the barrier. This jet may cause an increase in negative pressure at the bottom and windward sides of the train, leading to a decrease in CV and an increase in CH. The increased shielding area in the upper part of the WGB, coupled with the backflow effect behind the barrier, results in relatively lower wind velocity in that area.
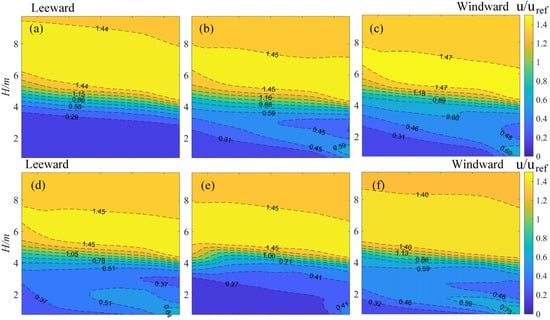
Figure 13.
Effect of various WGB cases on streamwise wind velocity for the bridge deck: (a) Case 2; (b) Case 3; (c) Case 4; (d) Case 5; (e) Case 6; (f) Case 7.
Regarding the effect of θ1, the test results of Cases 3 and 4 show that increasing θ1 will reduce the shielding efficiency of WGB, and the flow velocity in the backflow area near the top of the barrier gradually decreases. Regarding the effect of h1, the test results of Cases 3 and 5 show that when h1 increases, the projected windward area of the barrier decreases, and the bluff body characteristics weaken. Therefore, the total wind velocity within the height range of the barrier increases, and the airflow passing through the bottom of the barrier to the bridge deck enhances, resulting in an increase in wind velocity near the bridge deck. However, the wind velocity at the 1.65 m position on the windward side of the track is locally reduced due to the backflow effect behind the barrier. Regarding the effect of B1, the test results of Cases 4, 6, and 7 show that as B1 increases, the blocking effect of the WGB increases, and the jet at the bottom gradually weakens, effectively reducing the wind velocity in the flow direction near the bridge deck. When B1 increases from 250 mm to 300 mm, the influence on the external flow field above the shear layer is more obvious, and when B1 increases from 300 mm to 350 mm, the effect on the flow field near the top of the WGB is more obvious.
4.1.2. Transverse Velocity (v) Distributions
Figure 14 shows the effect of various WGB cases on the transverse wind velocity on the bridge deck. It can be observed that as the distance from the WGB increases, the transverse wind velocity gradually decreases. Compared with a vertical wind barrier, the flow-deflecting effect of WGB is significantly enhanced within the train height range. However, high transverse wind velocity still appears near the windward side of the bridge deck due to the influence of jet flow. Large-scale transverse airflow deflection also appears above the top of the WGB and below the shear layer, with a max transverse wind velocity of up to −0.25. Since there is no abrupt change in wind velocity in the external flow field of the shear layer, and the transverse wind velocity contour lines exhibit a trend of decreasing speed with increasing distance from the wind barrier in the external flow field, the difference in transverse wind velocity may be caused by changes in the pressure gradient.
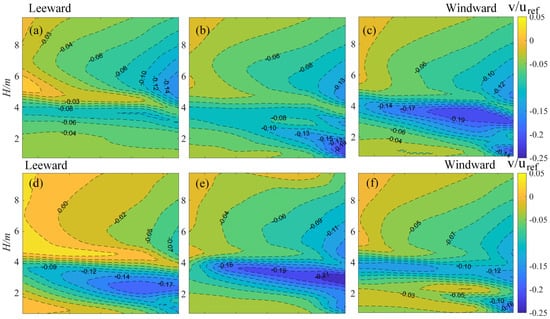
Figure 14.
Effect of various WGB cases on transverse wind velocity for the bridge deck: (a) Case 2; (b) Case 3; (c) Case 4; (d) Case 5; (e) Case 6; (f) Case 7.
Regarding the effect of θ1, the test results of Cases 3 and 4 show that as θ1 increases, the transverse wind velocity in the root of the WGB increases, and the absolute value of the transverse wind velocity at 1.65 m increases from −0.10 to −0.19. At the same time, the transverse wind velocity in the backflow area near the top of the barrier slightly decreases, ultimately resulting in a decrease in the flow-deflecting effect. Regarding the effect of h1, the test results of Cases 3 and 5 show that, compared with θ1, changing h1 leads to greater differences in transverse wind velocity, indicating that h1 is crucial for the airflow deflection effect of the WGB. Compared with h1 = 350 mm, when h1 = 500 mm, the max transverse wind velocity on the windward side decreases by more than 0.1, and the max value appears at a height of 1.65 m above the windward sidetrack. Regarding the effect of B1, the test results of Cases 4, 6, and 7 show that as B1 increases, the airflow deflection effect of the WGB gradually strengthens, and the transverse wind velocity on the upstream side of the WGB increases within the height range of the WGB, enhancing the flow-deflecting effect. However, the trend of the transverse wind velocity on the downstream side is opposite to that on the upstream side, which may be due to the influence of the downstream barrier.
4.1.3. Vertical Velocity (w) Distributions
Figure 15 shows the effect of various WGB cases on the vertical wind velocity on the bridge deck. It can be observed from Figure 15 that a higher vertical wind velocity occurs near the windward side of the bridge deck, which gradually decreases with increasing distance from the barrier, showing a trend of decreasing with distance. The distribution of vertical wind velocity is similar to that of transverse wind velocity, with a max wind velocity ratio of 0.18, slightly smaller than the lateral wind velocity ratio. Compared with vertical wind barriers, the vertical flow guidance effect of WGB with a height of more than 4 m is comparable to that of vertical wind barriers.
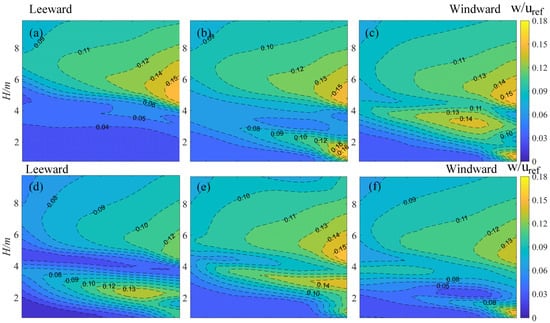
Figure 15.
Effect of various WGB cases on vertical wind velocity for the bridge deck: (a) Case 2; (b) Case 3; (c) Case 4; (d) Case 5; (e) Case 6; (f) Case 7.
Regarding the effect of θ1, the test results of Cases 3 and 4 show that increasing θ1 leads to an increase in the vertical wind velocity ratio in the root of the WGB. The vertical wind velocity ratio at 1.65 m increases from 0.1 to 0.15, which reduces the vertical flow guidance effect. At the same time, the vertical wind velocity in the backflow area near the top of the WGB gradually decreases. Regarding the effect of h1, the test results of Cases 3 and 5 show that changing h1 leads to greater differences in the distribution of vertical wind velocity, similar to that of lateral wind velocity. Compared with h1 = 350 mm, when h1 = 500 mm, the max vertical wind velocity ratio on the windward side decreases by more than 0.07, and the max vertical wind velocity also occurs 1.65 m above the windward side of the track. Regarding the effect of B1, the test results of Cases 4, 6, and 7 show that increasing B1 can effectively reduce the wind velocity near the bridge deck and enhance the flow guidance effect at a height of 3 m to 4 m. When B1 is increased from 250 mm to 300 mm, it has a more significant effect on the external flow field above the shear layer. When B1 is increased from 300 mm to 350 mm, it has a more significant effect near the top of the WGB.
4.2. Turbulence Characteristics
Figure 16 shows the effect of various WGB cases on the turbulence intensity around the bridge deck wind field. It can be observed from Figure 16 that the WGB causes higher turbulence intensity in the wind field compared to the vertical wind barrier. The larger zones of turbulence occur near the bridge deck, the shear layer near the middle jet, and the flow around the top of the barrier after the installation of WGB. The height of the shear layer is 4.5 m, and the zone below it is considered the effective windproof zone.
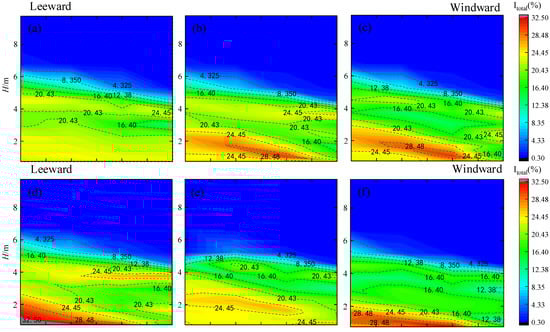
Figure 16.
Effect of various WGB cases on turbulence intensity for the bridge deck wind field: (a) Case 2; (b) Case 3; (c) Case 4; (d) Case 5; (e) Case 6; (f) Case 7.
Regarding the effect of θ1, the test results of Cases 3 and 4 indicate that changing θ1 does not significantly affect the turbulence intensity of the bridge wind field, but it will change the position of the stronger turbulence zone. Specifically, increasing θ1 will shift the position of the stronger turbulence zone upward in the middle jet of the WGB. Regarding the effect of h1, the test results of Cases 3 and 5 show that the max turbulence intensity occurs near the surface layer of the bridge and the bottom of the shear layer around the top of the barrier when h1 is changed. When h1 = 500 mm, the turbulence intensity near the downstream side of the bridge surface reaches 32.5%, and the wind velocity ratio is also higher than when h1 = 350 mm, which is not beneficial to windproofing. Regarding the effect of B1, the test results of Cases 4, 6, and 7 show that for the upstream track, the turbulence intensity near the bridge surface increases with the increase in B1, and the turbulence intensity at the top of the WGB reaches a max at 300 mm. For the downstream track, within the shear layer range, the turbulence intensity gradually decreases as B1 increases, and when the size increases from 300 mm to 350 mm, the height of the turbulence boundary layer decreases to 5 m.
5. Conclusions
This study investigates the effects of three main design parameters of the WGB, including the main wind deflector plate θ1, the upper deflector angle size h1, and the root width B1, on the aerodynamic characteristics of a train–bridge system through wind tunnel experiments. This study combines analysis of the mean and fluctuating wind pressure coefficients on the train and bridge surfaces, tests of the aerodynamics of the bridge and barrier, and wind field analysis on the bridge deck to draw the following conclusions:
(1) The WGB is a better wind barrier solution for bridges. It provides comparable windproof performance for the train while reducing barrier resistance and the resistance of the bridge–barrier system by 32% and 12%, respectively.
(2) The effect of changing θ1 on the aerodynamic characteristics of the train–bridge system is not significant. The design parameters B1 and h1 for the WGB have a significant impact on the mean aerodynamic coefficients of the train. Changing each installation parameter will affect the pulsating wind pressure at the shoulder of the train, and the extreme aerodynamic coefficients of the trains can also change, reaching up to 60%.
(3) The WGB can effectively reduce the wind velocity on the bridge and has a strong guiding effect on the airflow. The max values of the transverse wind velocity ratio and vertical wind velocity ratio behind the WGB can reach 0.25 and 0.17, respectively.
(4) Changing θ1 has a small effect on the wind field on the bridge, while h1 has a significant effect on the transverse and vertical guiding effects. When h1 is reduced, the max value of the transverse wind velocity ratio increases by more than 0.1. Increasing B1 enhances the blocking and guiding effects and suppresses the intensity of the jet near the bridge surface, which is beneficial for the windproofing of the train.
Author Contributions
Conceptualization, D.G., S.J. and Y.Z.; methodology, X.H.; software, D.G. and S.J.; resources, X.H.; writing—original draft preparation, D.G. and S.J.; writing—review and editing, Y.Z., X.H. and Q.L.; visualization, Q.L.; supervision, S.J.; funding acquisition, Y.Z. and X.H. All authors have read and agreed to the published version of the manuscript.
Funding
This research was funded by the National Natural Science Foundations of China (Grant No. 51925808), the Natural Science Foundation of Hunan Province (Grant No. 2022JJ10082), the Science and Technology Innovation Program of Hunan Province (Grant No. 2021RC3016), the Fundamental Research Funds for the Central Universities of Central South University (No. 2023ZZTS0952).
Institutional Review Board Statement
Not applicable.
Informed Consent Statement
Not applicable.
Data Availability Statement
Data are contained within the article.
Conflicts of Interest
The authors declare no conflict of interest.
References
- Kozmar, H.; Procino, L.; Borsani, A.; Bartoli, G. Optimizing height and porosity of roadway wind barriers for viaducts and bridges. Eng. Struct. 2014, 81, 49–61. [Google Scholar] [CrossRef]
- Takeda, K.; Asuda, K.; Takeuchi, M.; Kaneda, Y. Wind tunnel test on the performance of windbreak and snow fences. J. Wind Eng. 1985, 25, 15–32. [Google Scholar] [CrossRef][Green Version]
- Zhou, L.; He, X.; Chen, Z.; Xie, T.; Jing, H. Numerical study of effect of wind barrier on aerodynamic of bridge and train-bridge system. J. Cent. South Univ. 2018, 49, 1742–1752. [Google Scholar] [CrossRef]
- Dong, Z.; Luo, W.; Qian, G.; Lu, P.; Wang, H. A wind tunnel simulation of the turbulence fields behind upright porous wind fences. J. Arid Environ. 2010, 74, 193–207. [Google Scholar] [CrossRef]
- Barcala, M.; Meseguer, J. Visualization study of the influence of parapets on the flow around a train vehicle under cross winds. WIT Trans. Built Environ. 2008, 103, 797–806. [Google Scholar] [CrossRef]
- Zhang, J.; Zhang, M.; Li, Y.; Qian, Y.; Huang, B. Local wind characteristics on bridge deck of twin-box girder considering wind barriers by large-scale wind tunnel tests. Nat. Hazards 2020, 103, 751–766. [Google Scholar] [CrossRef]
- Kozmar, H.; Procino, L.; Borsani, A.; Bartoliet, G. Sheltering efficiency of wind barriers on bridges. J. Wind Eng. Ind. Aerodyn. 2012, 107–108, 274–285. [Google Scholar] [CrossRef]
- Çoşkun, Ş.; Hazaveh, H.; Uzol, O.; Kurc, O. Experimental investigation of wake flow field and wind comfort characteristics of fractal wind fences. J. Wind Eng. Ind. Aerodyn. 2017, 168, 32–47. [Google Scholar] [CrossRef]
- Gu, H.; Liu, T.; Jiang, Z.; Guo, Z. Research on the wind-sheltering performance of different forms of corrugated wind barriers on railway bridges. J. Wind Eng. Ind. Aerodyn. 2020, 201, 104166. [Google Scholar] [CrossRef]
- Gu, H.; Liu, T.; Jiang, Z.; Guo, Z. Experimental and simulation research on the aerodynamic effect on a train with a wind barrier in different lengths. J. Wind Eng. Ind. Aerodyn. 2021, 214, 104644. [Google Scholar] [CrossRef]
- Xiang, H.; Li, Y.; Chen, B.; Liao, H. Protection effect of railway wind barrier on running safety of train under cross winds. Adv. Struct. Eng. 2014, 17, 1177–1187. [Google Scholar] [CrossRef]
- He, X.; Zou, Y.; Wang, H.; Han, Y.; Shi, K. Aerodynamic characteristics of a trailing rail vehicles on viaduct based on still wind tunnel experiments. J. Wind Eng. Ind. Aerodyn. 2014, 135, 22–33. [Google Scholar] [CrossRef]
- Chu, C.; Chang, C.; Huang, C.; Wu, T.; Wang, C.; Liu, M. Windbreak protection for road vehicles against crosswind. J. Wind Eng. Ind. Aerodyn. 2013, 116, 61–69. [Google Scholar] [CrossRef]
- Zhang, T.; Guo, W.; Du, F. Effect of windproof barrier on aerodynamic performance of vehicle-bridge system. Proc. Eng. 2017, 199, 3083–3090. [Google Scholar] [CrossRef]
- Buljac, A.; Kozmar, H.; Pospíšil, S.; Machacek, M. Flutter and galloping of cable-supported bridges with porous wind barriers. J. Wind Eng. Ind. Aerodyn. 2017, 171, 304–318. [Google Scholar] [CrossRef]
- Guo, X.; Tang, J. Effects of wind barrier porosity on the coupled vibration of a train-bridge system in a crosswind. Struct. Eng. Int. 2019, 29, 268–275. [Google Scholar] [CrossRef]
- Ogueta-Gutiérrez, M.; Franchini, S.; Alonso, G. Effects of bird protection barriers on the aerodynamic and aeroelastic behaviour of high speed train bridges. Eng. Struct. 2014, 81, 22–34. [Google Scholar] [CrossRef]
- Guo, W.; Wang, Y.; Xia, H.; Lu, S. Wind tunnel test on aerodynamic effect of wind barriers on train-bridge system. Sci. China Technol. Sci. 2015, 58, 219–225. [Google Scholar] [CrossRef]
- YU, K.; HE, X.; CAI, C.; Yan, L.; Zou, Y. Aerodynamic characteristics of trains on a viaduct with non-uniform cross-section under crosswinds by wind tunnel tests. Adv. Struct. Eng. 2021, 24, 1769–1781. [Google Scholar] [CrossRef]
- Ren, W.; Duan, Q.; Ma, C.; Liao, H.; Li, Q. Experimental investigation of the protective effect of wind barriers on high-speed railway bridge in inland strong wind area. Adv. Struct. Eng. 2019, 22, 3306–3318. [Google Scholar] [CrossRef]
- Dai, Y.; Dai, X.; Bai, Y.; He, X. Aerodynamic Performance of an Adaptive GFRP Wind Barrier Structure for Railway Bridges. Materials 2020, 13, 4214. [Google Scholar] [CrossRef] [PubMed]
- Liu, L.; Zou, Y.; He, X.; Zhou, X.; Cai, C.; Yang, J. Effects of wind barriers on VIV performances of twin separated parallel decks for a long-span rail-cum-road bridge. J. Wind Eng. Ind. Aerodyn. 2023, 236, 105367. [Google Scholar] [CrossRef]
- Taylor, I.J.; Vezza, M. A numerical investigation into the aerodynamic characteristics and aeroelastic stability of a footbridge. J. Fluids Struct. 2009, 25, 155–177. [Google Scholar] [CrossRef]
- He, X.; Shi, K.; Wu, T.; Zou, Y.; Wang, H.; Qin, H. Aerodynamic performance of a novel wind barrier for train-bridge system. Wind. Struct. 2016, 23, 171–189. [Google Scholar] [CrossRef]
- He, X.; Fang, D.; Li, H.; Shi, K. Parameter optimization for improved aerodynamic performance of louver-type wind barrier for train-bridge system. J. Cent. South Univ. 2019, 26, 229–240. (In Chinese) [Google Scholar] [CrossRef]
Disclaimer/Publisher’s Note: The statements, opinions and data contained in all publications are solely those of the individual author(s) and contributor(s) and not of MDPI and/or the editor(s). MDPI and/or the editor(s) disclaim responsibility for any injury to people or property resulting from any ideas, methods, instructions or products referred to in the content. |
© 2023 by the authors. Licensee MDPI, Basel, Switzerland. This article is an open access article distributed under the terms and conditions of the Creative Commons Attribution (CC BY) license (https://creativecommons.org/licenses/by/4.0/).