Abstract
To study the influence of sand particles on the strength and dry–wet cycle characteristics of cement-solidified South China coastal soft clay, a series of cement-solidified South China coastal soft clay samples with different contents and sizes of sand particles were prepared, and unconfined compression strength (UCS) tests, dry–wet cycle tests under seawater and freshwater conditions, scanning electron microscopy tests, and X-ray diffraction tests were carried out. The test results show that the UCS of cement–sand-solidified soil (CS-SS) samples at 7, 14 and 28 d increase as sand particle content increases, and their 28 d strength increase as sand particle size decreases; the average mass loss rate of sand–cement samples ranges from 14% to 61%. The properties of strength and dry–wet cycle durability improve as the sand particle content increases and the sand particle size decreases. Moreover, the anti-dry–wet cycle ability of samples under freshwater conditions is better than those under seawater conditions. The scanning electron microscopy (SEM), X-ray diffraction (XRD), and ion chromatography test results show that the stiffness replacement effect (the high stiffness of sand particles replaces the low stiffness of soft clay), the interface cementation effect between the sand particles and cemented soil, and the microcrack expansion-obstructing effects of sand particles contribute to the improvement of the strength and dry–wet cycle durability of cement–sand solidified South China coastal soft clay.
1. Introduction
The coastal region of South China is located in the subtropics, suffering a warm and humid climate and flourishing vegetation, where the deposited soft soil is a thick layer and rich organic matter and has the “three high (high water content, high organic matter content, and high compressibility), two low (low bearing capacity, low permeability) and one long (long deformation stability time)” substantial regional characteristics. The engineering performances of this soft soil are extremely poor [1,2,3]. Therefore, the proposed pretreatment is required for engineering construction in the coastal soft soil area of South China. Various foundation treatment methods have been used for soft soils, among which cement mixing piles have been intensively studied [4,5,6] and widely used [7,8,9] because of their good reinforcement effect and simple construction. Engineering practice has found that the strength of cement mixing piles in South China’s organic-rich coastal soft soil region is very low, although the cement content is high. The main reason is that the hydration products of cement have difficulty in forming a continuous cementitious structure skeleton in soft soil with a high organic matter content [10,11,12].
South China’s coastal soft soil areas, especially the Pearl River Delta, have experienced three sedimentary cycles, forming geological inter-bedded layers of silty sand and soft clay [13]. The sand particles, which are used as a common aggregate, can be effectively mixed into the cement-solidified soils to improve the strength and deformation characteristics. Subramanian et al. [14] prepared cement-solidified artificial soft soil with different sand particle content and investigated the effect of the sand particle content on the deformation characteristics of cement-solidified soft soil by ultrasonic and bending element tests. They found that sand particles can effectively increase the shear modulus of the cement-solidified soft soil. Xu et al. [15] systematically summarized the effect of sand particle content on the unconfined compression strength (UCS) of cement-solidified soil and analyzed the microscopic control mechanism of the reinforcing effect of sand particles on cement-solidified soft soil in Lianyungang City by using the numerical simulation method. Chian et al. [16] conducted a series of UCS tests on the cement-solidified Singaporean marine soft clay with different sand particle content. The test results showed that the UCS of the cement-solidified samples decreases with increasing sand particle content, yielding findings opposite to those of Xu et al. [15]. Wang et al. [17] carried out a series of UCS tests and microscopic tests on solidified soft clay with different cement contents and sand particle contents. The test results showed that there is an optimal sand particle content for cement-solidified soil with different cement content; that is, the strength of the cemented soil increases first and then decreases with the increase of sand particle content. It is consistent with the research results of Liu et al. [18] and Fan et al. [19], but the optimal sand particle content is different. The above studies mainly investigate the influence of sand particle content on the strength of cemented soil. However, the influence of sand particle size on the mechanical properties of cemented soil has not been reported.
In addition, the cement mixing piles in the coastal soft soil region of South China inevitably undergo a dry–wet cycle cycle of seawater and freshwater when suffering ebb and flow, dry and flood seasons and changing seasons, leading to strength deterioration and even structural destruction [20,21]. The ability to resist the dry–wet cycle degradation directly determines the water stability and durability of cement mixing piles and then the success and failure of cement mixing pile reinforcement projects. However, the research results on the dry–wet cycle characteristics of cement–sand solidified soil (CS-SS) in the coastal region of South China are rarely reported. In the construction process of the Guangdong–Hong Kong–Macao Greater Bay Area, some housing construction and transportation infrastructure are bound to be built on the foundation of muddy, soft soils. However, the engineering properties of muddy, soft soil are very poor, and it is a difficult problem in engineering construction to ensure it meets the strength requirements of the foundation. At present, there are few studies on the deterioration law of the strength of the cement soil foundation in the coastal area of South China after the dry–wet cycles of freshwater and seawater during the flood tides and ebb tides. Therefore, it is necessary to carry out a systematic study on the durability of sand-mixed cement soil in the coastal area of South China.
In this regard, a typical coastal soft soil in South China is selected as the research object in the present work. A series of the CS-SS samples with different sand particle content and sand particle size are prepared to conduct UCS tests, dry–wet cycle tests and microscopic observation tests to investigate the influence of sand particles on the strength characteristics of the CS-SS in South China and to study the microscopic control mechanism of strength deterioration of the CS-SS in the dry–wet cycle of seawater or freshwater. The present work is expected to provide scientific support and an experimental basis for the application of cement–sand mixing piles in coastal soft soil regions of in South China.
2. Test Materials and Test Methods
2.1. Test Materials
For a brief analysis of the basic physical properties of soft soils in the South China coastal region, undisturbed soil samples were collected at 11 soil extraction points (as shown in Figure 1 in the South China coastal region, and the results of the basic physical properties are shown in Table 1. The data in Table 1 are not much different, and the basic performance is similar. Soft soils in coastal and river areas of Southern China are generally characterized by high water content (above 50%), high liquidity index (above 1.2), high compressibility, low permeability and high organic matter content.
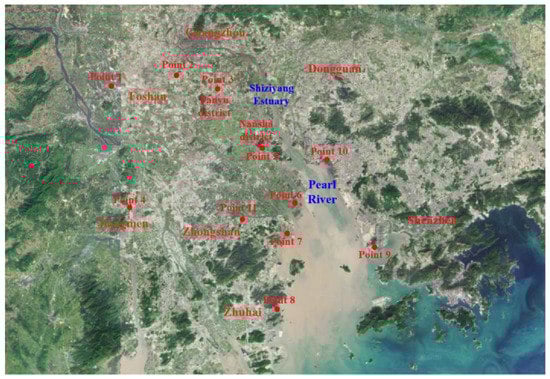
Figure 1.
Distribution map of soil collection points.

Table 1.
Physical and mechanical properties of South China coastal soft soil in different districts.
In the present work, the coastal soft soil in South China is taken from Zhongshan City, Guangdong Province (Extraction point 11 in Figure 1). The sample depth of the soft soil is 6~8 m. The specific physical and mechanical properties are shown in Table 1. The cement used in the present work is P.O 42.5R ordinary Portland cement, and the main chemical composition is shown in Table 2. The composition was evaluated by X-ray fluorescence (XRF). The water used for sample preparation is fresh water. The sand used in this paper is natural river sand, and three particle size combinations of 0.075~0.25 mm (fine sand), 0.25~0.5 mm (medium sand), and 0.5~1.0 mm (coarse sand) are sieved and prepared. Both freshwater and seawater are used for the dry–wet cycle test. The seawater is artificially configured in the laboratory, and the specific components are shown in Table 3.
Table 2.
Main chemical compositions of cement expressed as relative oxides of the elements by XRF analysis.
Table 3.
Compositions of artificial seawater, expressed as the concentration of salt in the water.
2.2. Sample Preparation
For the CS-SS samples, the properties of the cemented soil were controlled by the water content of the in situ soft soil, cement content, and water–cement ratio. The preparation of the CS-SS samples must strictly ensure that the properties of the cemented soil in the same test group remain unchanged. The soft soil was dried and crushed and passed through a 0.075 mm sieve. When preparing the samples, according to the test scheme, the corresponding masses of the dried soft soil particles, sand particles, cement, and water were weighed. The dry cement powder and sand particles were mixed into the dried soft soil particles first for thorough mixing, and they are placed into the cement mortar mixer. The appropriate amount of water was mixed with them thoroughly to ensure the sand particles were evenly distributed in the cemented soil to form the mixed slurry of the CS-SS samples. A clean three-flap mold was used and a thin layer of petroleum jelly was smeared on its inner walls. The mixed CS-SS slurry was evenly loaded into the mold three times. Each time after loading the mixed slurry, the mold was placed on the shaking table for 2 min vibrating to remove the air bubbles in the mixed slurry. Once the mixed slurry loading procedure was completed, it was covered with a plastic top cap, wiped with a damp cloth, and pasted with a test group label. After a 1 d curing period, the mold was removed and the CS-SS sample was formed. The prepared samples were sealed with plastic film and placed in a curing box with the temperature fixed at 20 °C ± 2 °C and relative humidity greater than 95% until the design curing age. The dimensions of the sample were 39.1 mm in diameter and 80 mm in height.
2.3. Test Scheme
In the present work, the influence of sand particles (content αs and size d) on the strength and anti-dry–wet cycle characteristics of the cement-solidified soil was studied. According to the research results of Pan et al. [22] and Liang et al [23], 15% cement content is both effective and economical for improving the unconfined compression strength (UCS) of soft soil; thus, this cement content was also used in the present work, whereas the water–cement ratio was set at 1:1. In the case of UCS tests, the sand particle content of the CS-SS samples were set at 0%, 2%, 5%, 10%, 15%, and 30%; the sand particle size were set at 0.075~0.25 mm (fine sand), 0.25~0.5 mm (medium sand), and 0.5~1.0 mm (coarse sand). Three parallel samples were prepared for each group of the test. A series of UCS tests were conducted for 135 CS-SS samples in 45 test groups. In the case of the dry–wet cycle tests, the sand particle content of the CS-SS samples was set at 0%, 5%, and 15%; and the sand particle size was set at 0.075~0.25 mm (fine sand), 0.25~0.5 mm (medium sand), and 0.5~1.0 mm (coarse sand), respectively. The CS-SS samples were subjected to two dry–wet cycles N (30 d/cycle) under seawater and freshwater conditions, three parallel samples were prepared for each group of the tests, and a total of 72 groups of the 216 samples were prepared for the dry–wet cycle tests. The specific test scheme is shown in Table 4, and the tests were carried out according to the Specification of the soil test (GB/T50123-2019) [24].
Table 4.
UCS tests and dry–wet cycle test schemes of the CS-SS samples.
2.4. Test Method
2.4.1. Strength Test Methods
- (1)
- Unconfined compression strength (UCS) test
The UCS tests were carried out on the CS-SS samples with specified design curing ages. The loading rate of the test was 0.8 mm/min (axial strain of 1%) [24]. The results of the UCS tests were the average value of the test results of the three parallel samples.
- (2)
- Dry–wet cycle test and strength loss rate
Dry–wet cycle tests were carried out on the CS-SS samples cured to 28 d. The samples were subjected to a dry–wet cycle test for 30 d. The dry cycle consisted of drying the samples at room temperature for 15 d, and the wet cycle consisted of immersing the samples in the container for 15 d. The control group samples were continuously placed in the curing box. The unconfined compression strength test was carried out after each dry–wet cycle to analyze the dry–wet cycle characteristics and strength degradation law of the CS-SS samples.
In order to analyze the anti-dry–wet cycle ability of the CS-SS samples under seawater and freshwater conditions, the average strength loss rate was used to evaluate the dry–wet cycle characteristics of the CS-SS samples [25]. Moreover, can be expressed as Equation (1):
where is the UCS of the CS-SS samples at the curing age of 28 d, and is the UCS of the CS-SS samples after N dry–wet cycles.
2.4.2. Microscopic Test Method
- (1)
- Scanning electron microscopy (SEM) and mineral composition analysis (XRD)
After the CS-SS samples were tested for UCS, they were placed in an oven and air-dried at a low temperature (60 °C ± 3 °C) for 24 h. The dried samples were taken out and broken apart, and representative samples were subjected to scanning electron microscopy (SEM, ZEISS GeminiSEM 300, Oberkochen, Germany); SEM images were taken at corresponding magnifications. The analysis of the mineral composition was realized by the XRD method, which is mainly used to analyze the change of mineral composition in the hardening process of cement mortar solidified soil and to study the reaction process by material change. Representative samples were subjected to X-ray diffraction (XRD) tests (Bruker, Germany), and XRD patterns of the samples were obtained. XRD patterns were processed using MDI Jade 6.0 software.
- (2)
- Ion chromatography test
In the present work, the mixture of the standard solution, composed of 2, 4, 10, 20 and 40 mg/L chloride ions () was first prepared, and the specific preparation procedures were as follows: according to the Water Quality-Determination of Inorganic Anions (HJ84-2016) [26], 1.6485 g of was accurately weighed and dissolved in water, transferred to a 1000 mL volumetric flask, diluted, fixed with water to the standard line, and shaken thoroughly. The 100 mg/L standard solution was prepared by precisely pipetting 100mL of the mixed reserve solution into a 1000 mL volumetric flask and adding water to the scale line. Firstly, 50 g of the air-dried sample was weighted and poured into a 500 mL conical bottle. Secondly, 250 mL of ultrapure water was added and the mixture was shaken for 3 min at 25 °C. Thirdly, the thoroughly shaken solution was poured into a 50 mL centrifuge tube and centrifuged at a speed of 4000 r/min for 5 min. Finally, the supernatant was filtered through a 0.45 μm microporous membrane into a sample tube for ion chromatography (ICS-900) analysis. Finally, 1.0, 2.0, 5.0, 10.0, and 20.0 mL of the standard solution were precisely pipetted into a 100 mL volumetric flask to prepare the 2, 4, 10, 20, and 40 mg/L of standard solutions. The ion concentration of the CS-SS sample was examined and the standard curve was constructed. They were injected into the ion chromatograph in the order of their concentration from low to high, and the peak area (or peak height) was recorded. The standard curve was plotted with the mass concentration of each ion as the abscissa and the peak area (or peak height) as the ordinate. The mass concentrations of anions were calculated from the standard curve by using Equation (2):
where is the mass concentration of anions in the sample (mg/L), is the peak area (or peak height) of the anions in the sample, is the peak area (or peak height) of the anion in the laboratory blank, is the intercept of the regression equation, is the slope of the regression equation, and is the dilution multiple of the sample. If the sample content was less than 1 mg/L, the results were retained to three decimal places. If the sample content is greater than or equal to 1 mg/L, the results retained three valid digits.
3. Test Result Analysis
3.1. Unconfined Compression Strength (UCS)
The relationship between the UCS of the CS-SS samples and the sand particle content and size is shown in Figure 2.
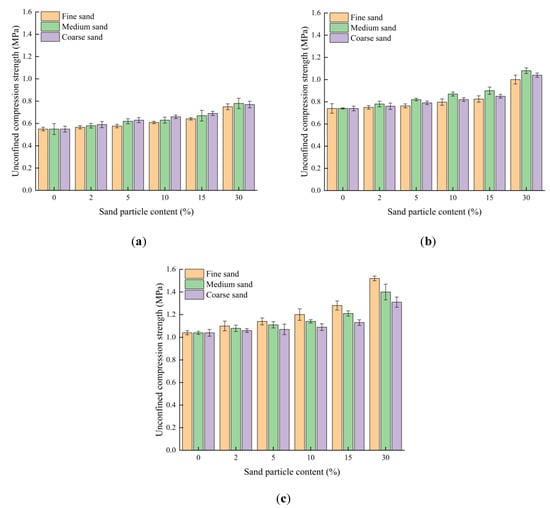
Figure 2.
Relationship between the UCS of the CS-SS samples and the sand particle content; (a) curing age 7 d; (b) curing age 14 d; (c) curing age 28 d.
3.1.1. Effect of Sand on the UCS of Cemented Soil
It is apparent from Figure 2a that the UCS of the CS-SS samples increased with the increase of sand particle content but showed different trends at different curing ages. For the curing age of 28 d, as the sand particle content increased from 0% to 30%, the UCS of the CS-SS samples with different sand particle sizes increased by 0.45 MPa (fine sand), 0.36 MPa (medium sand), and 0.27 MPa (coarse sand). For the curing age of 7 d, the UCS of the CS-SS samples increased by 0.15 MPa (fine sand), 0.18 MPa (medium sand), and 0.17 MPa (coarse sand) when sand particle content increased from 0% to 30%, and the sand particle size was more effective in enhancing the long-term strength of the cemented soil than the early strength.
It is apparent from Figure 2b,c that the sand particle size had a certain influence on the UCS of the CS-SS samples. For the 7 d and 14 d strengths, the effect of sand particle size on the UCS showed a certain degree of dispersion, and no regularity was found. For the long-term (28 d) strength, the UCS of the CS-SS samples increased obviously with the decrease in sand particle size, and all test groups of the CS-SS samples showed the same variation law.
3.1.2. Physical Explanation of Sand on Strengthening Mechanism of Cemented Soil
The strengthening mechanism of sand particles on cemented soil is mainly manifested in three aspects: (1) the modulus replacement effect (sand particles with large stiffness replaces soft soil with small stiffness), (2) the sand particle–cemented soil interface cementation effect, and (3) the microcrack expansion obstructing effect.
In order to analyze the microscopic control mechanism of sand particles on the solidification effect of the cemented soil, scanning electron microscope tests were performed on the CS-SS samples (medium sand, 15% sand particle content, and curing age 28 d) after conducting the UCS test, and the test results are shown in Figure 3. At lower magnification, it can be seen that the sand particles are embedded in the cemented soil, forming a tighter bond with the surrounding soil. The skeleton system originally constructed by soil particles is transformed into a support system with a sand particle-centered aggregate structure as the main skeleton. The sand particles were observed on a large scale, and different interfaces appeared around the sand particles. The surface of the sand particles was uniformly covered with C-S-H gel. The cemented soil and the sand particles form a stable structure through the hydration product C-S-H gel, which is also the reason why the sand particles promote the strength of the cemented soil to be greatly improved. Due to the large density and strength of sand particles, it plays the role of coarse aggregate in cemented soil. For the early-age (7 d) samples, the degree of hydration of the cement was low, the interface cementation strength of the interfaces between the sand particles and cemented soil was low, and the strengthening effect of sand particles on the cemented soil was mainly induced by the modulus replacement effect. With the increase in sand particle content, the degree of the modulus replacement effect increased, and the compaction effect of sand particles on the cemented soil was intensified. The UCS of the CS-SS samples increased with the increase of sand particle content, but the increased amplitude was limited. Meanwhile, it was slightly affected by the sand particle size. For the long-age (28 d) samples, the hydration of cement was more adequate, and a stronger interface cementation was achieved between the sand particles and the cemented soil through the cement hydration products, as shown in Figure 3c. The deformation coordination between the sand and cement soil was strengthened; that is, the high strength of sand can be transferred through interface cementation, and the modulus substitution effect of the sand is enhanced [14]. The UCS of the CS-SS samples increased with the increase of sand particle content, and the increase in amplitude was promising. The smaller the sand particles, the greater the specific surface area, and the greater the interface area, the more pronounced was the reinforcing effect of modulus replacement. The later UCS of the sample increased with the decrease in sand diameter.
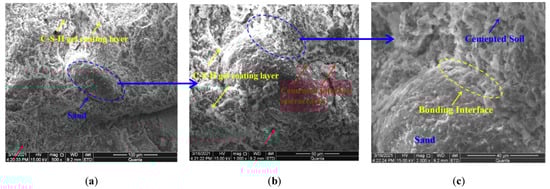
Figure 3.
SEM pictures of the CS-SS samples (medium sand, = 15%); (a) 500×; (b) 1000×; (c) 2000×.
3.1.3. Influence of Sand on the Failure Mode of the Cemented Soil
It was found in the test that the failure pattern of the CS-SS samples changed with the sand particle content, and the samples exhibited a column-cracking failure when the sand particle content was zero, a nuclear cracking failure when the sand particle content was 15%, and a shear-cracking failure when the sand particle content was 30%, as shown in Figure 4.
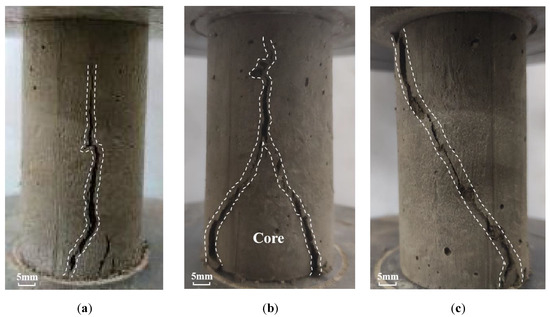
Figure 4.
Failure modes of the CS-SS samples; (a) , column split type; (b) , core split type; (c) , shear split type.
The hydration of the cement induced microcracks inside the cemented soil [25,27], and the failure of the samples started at the internal weak point under external load; the microcracks expanded and penetrated one another as the external load increased, leading to the macroscopic failure of the samples. For the cemented soil samples with zero sand particle content, the internal microcracks were free to expand with long extension lengths, easily forming wide cracks in line with the loading direction, and macroscopically showing a column-cracking failure pattern, as shown in Figure 4a. For the CS-SS samples, the extension of internal microcracks was blocked by the sand particles, and these microcracks were difficult to penetrate one another. When the sand content is high (such as 30 % in this paper), the distribution density of the sand particles in cement soil is large, and the long microcracks are divided into short and fine microcracks with dispersed distribution. At this time, the integrity of the samples is better, the shear characteristics are remarkable, and the macroscopic failure mode is a shear fracture, as shown in Figure 4c. When the sand content is low (such as 15% in this paper), the sand particles are sparsely distributed in the cement soil, and the microcracks in the cement soil easily expand between the sparse sand particles. The failure mode of the sample is between the column fracture failure of the pure cement soil sample and the shear fracture failure of the high sand content sample, and the macroscopic failure mode is the core fracture failure mode, as shown in Figure 4b.
3.2. Dry–Wet Cycle Test
The relationship between the number of dry–wet cycles N and the UCS of the CS-SS samples is shown in Figure 5.
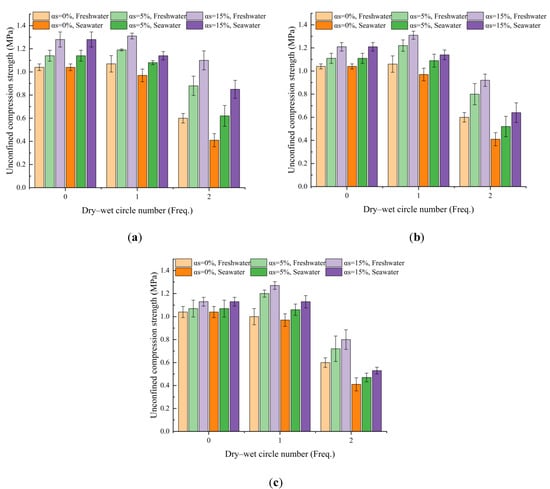
Figure 5.
Figure 5. Relationship between dry–wet cycles and UCS of the CS-SS samples; (a) fine sand; (b) medium sand; (c) coarse sand.
3.2.1. Influence of Sand on The Dry–Wet Cycle Characteristics of Cemented Soil
It is apparent from Figure 5 that the UCS of the CS-SS samples slightly increased first and then decreased with the increase of the number of dry–wet cycles under freshwater conditions, and decreased with the increase of the number of dry–wet cycles under seawater conditions, whereas the UCS of the control group samples increased with the increase of curing age. Moreover, the strength degradation of the CS-SS samples caused by the dry–wet cycle under seawater conditions was more remarkable than that under freshwater conditions. According to Equation (1), the average strength loss rate of the CS-SS samples after two dry–wet cycles could be obtained, as shown in Figure 6. Whether for freshwater or seawater dry–wet cycles, the average strength loss rate of the CS-SS samples after two dry–wet cycles increased with the increase of the sand particle size and decreased with the increase of sand particle content. When the sand particle size remained unchanged, the increase of sand particle content led to a denser distribution of sand particles in the cemented soil and more hydration products covering the surface of sand particles, forming a more compacted cementitious skeleton structure, which increases the ability to resist the structural destruction caused by the dry–wet cycle. When the sand particle content was kept unchanged, the sand particle size decreased, the specific surface area of sand particles increased, and the adhesion area of cement hydration products increased; this made the continuous bonding structure more compact, and the dry–wet cycle resistance of the sample increased. Therefore, the addition of fine sand can better improve the resistance of the cemented soil to the dry–wet cycle erosion when the sand particle content remains unchanged.
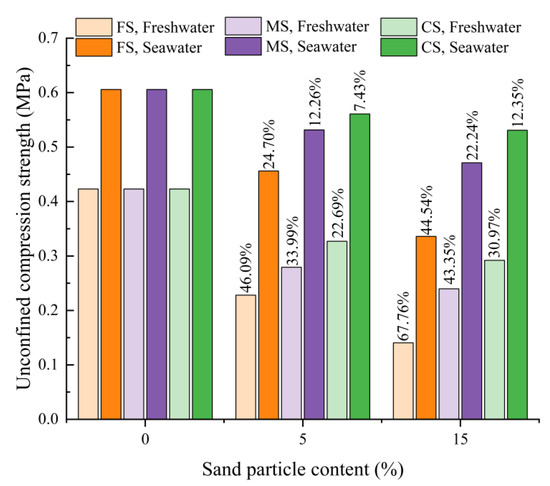
Figure 6.
Relationship between UCS and sand particle content of CS-SS samples after two dry–wet cycles (the number is the average strength loss rate after the dry–wet cycle).
3.2.2. Physical Mechanism Explanation of the Influence of Sand on the Dry–Wet Cycle Characteristics of Cemented Soil
To analyze the evolution of the microstructure and mineral composition of the CS-SS samples during the dry–wet cycle under seawater and freshwater conditions, the samples of the unconfined compression test corresponding to each round of dry–wet cycle were tested by SEM and XRD. The test results are shown in Figure 7, Figure 8, Figure 9, Figure 10 and Figure 11.
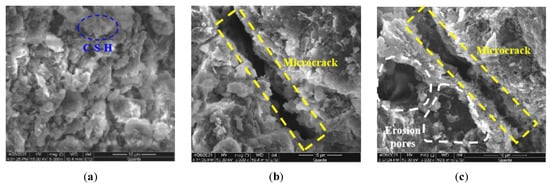
Figure 7.
SEM pictures of coarse sand-cement-solidified samples under different dry–wet cycles in seawater (αs = 15%); (a) curing age 28 d; (b) after a dry–wet cycle; (c) after two dry–wet cycles.
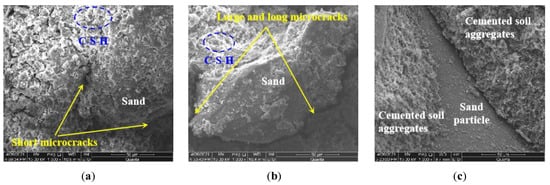
Figure 8.
SEM pictures of sand-cement-solidified samples with different sand particle sizes under two dry–wet cycles in freshwater (αs = 15%); (a) fine sand; (b) medium sand; (c) coarse sand.
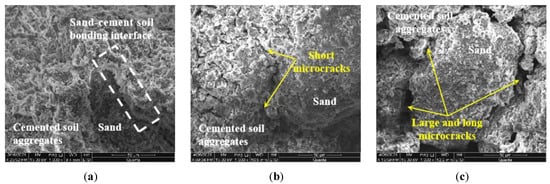
Figure 9.
SEM pictures of sand-cement-solidified samples with fine sand under two dry–wet cycles in freshwater and seawater (αs = 15%); (a) curing age 28 d; (b) freshwater, N = 2; (c) seawater, N = 2.
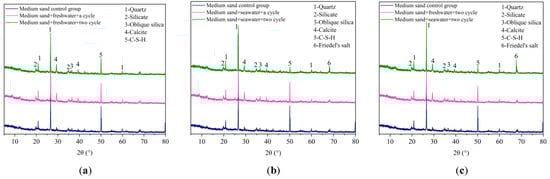
Figure 10.
Mineral composition of the CS-SS samples (medium sand, αs = 15%); (a) freshwater, different dry–wet cycles; (b) seawater, different dry–wet cycles; (c) N = 2, seawater and freshwater results.
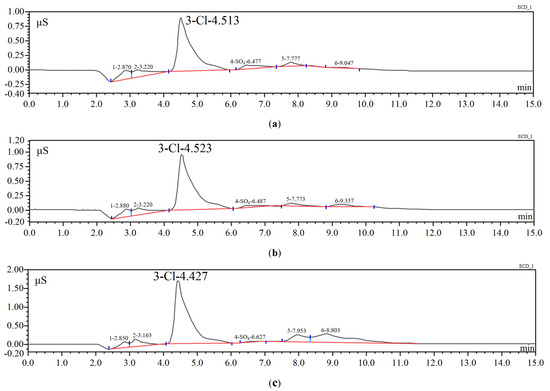
Figure 11.
Ion chromatography test results of the CS-SS samples under seawater conditions; (a) seawater, N = 1 (medium sand, αs = 5%), the peak area of is 0.47 μS·min; (b) seawater, N = 2 (medium sand, αs = 5%), the peak area of is 0.95 μS·min; (c) seawater, N = 2 (medium sand, αs = 15%), the peak area of is 0.82 μS·min.
Figure 7 shows the SEM images of the CS-SS samples with the coarse sand in seawater under different dry–wet cycles. The microstructure of the samples before the dry–wet cycle test was compacted, as shown in Figure 7a, and the hydration products of cement effectively cemented the soft soil particles to form an inlay-like cementitious structure with high strength. The XRD test results in Figure 10 show that the hydration product was C-S-H gel, and its diffraction peak decreased considerably with the increase of the number of dry–wet cycles, indicating that the C-S-H gel decreased with the increase of the number of dry–wet cycles. After one dry–wet cycle, with the decrease of hydration products, large microcracks appeared, as shown in Figure 7b, resulting in microstructure damage and strength degradation. After two dry–wet cycles, the microcracks in the samples continued to develop, the cemented soil aggregates cemented on the surface of the sand particles gradually peeled off (as shown in Figure 7c), the overall cementitious structure of the samples was destroyed, and the strength greatly decreased, which was consistent with the macroscopic test results given in Figure 5c.
Figure 8 shows the SEM images of the CS-SS samples with different sand particle sizes after two dry–wet cycles under freshwater conditions. After two dry–wet cycles, small and dense microcracks appeared in the cemented soil near the sand particles in the CS-SS sample with fine sand (as shown in Figure 8a), and the cementation of the sample was good, and the strength was high. In the medium sand samples, continuous large and long microcracks appeared in the cemented soil around the sand particles (as shown in Figure 8b), the cementation effect between sand particles and the cemented soil aggregates decreased, and the strength of the sample decreased. In the coarse sand samples, the cemented soil aggregates fell down from the sand particle surface (as shown in Figure 8c), the samples had large fractures, the microstructure was destroyed, and the strength was greatly reduced.
Figure 9 shows the SEM images of the CS-SS samples with fine sand after two dry–wet cycles under seawater and freshwater conditions. Table 3 shows the high concentration of corrosive ions () in seawater, and the chloride ions () reacted with tricalcium silicate () in the cement in the hydration reaction to generate Friedel’s salts () without cementation [28,29]. On the one hand, this reaction consumed tricalcium silicate in the cement and reduced the production of cement hydration products (C-S-H gel). On the other hand, the Friedel’s salt covered the surface of cement particles and soil particles, which inhibited the continuation of the cement hydration reaction and reduced the cementation effect and strength of the CS-SS samples. Figure 10a,b show the mineral composition of the control group of the samples and the first and second rounds of freshwater/seawater dry–wet cycle tests, respectively. Figure 10c shows the mineral composition of samples from the control group and the two-cycle freshwater/seawater dry–wet cycle test. The main differences are the No.5 diffraction peak and the No.6 diffraction peak; that is, the composition of C-S-H gel and Friedel’s salt changed greatly. Among them, the C-S-H gel content of the control group was the highest, followed by the freshwater circulation group, and the seawater circulation group was the lowest. Figure 10a showed that the Friedel’s salt diffraction peaks of the freshwater dry–wet cycle samples were not obvious and remained unchanged with the number of dry–wet cycles. It can be seen from Figure 10b that the Friedel’s salt increases as the number of dry–wet cycles of the sample increases, indicating that the Friedel’s salt continued to be generated as the number of dry–wet cycles increases. The hydration product C-S-H gel is a crystalline phase that can be found in the XRD pattern. It is generally present in the diffraction peak of 20°–40°, which is consistent with the results of Millogol et al. and Wahab et al. [30,31]. It can be seen from Figure 10c that Friedel’s salt occurs only in a large number of samples in the seawater circulation group. Because the corrosive ions (, , and ) in seawater will cause sample degradation, high concentrations of will react with to form Friedel’s salt. Therefore, in the case of seawater conditions, due to the influence of corrosive ions, the microcracks of the samples were distributed more widely and extended further. The integrity of the cement skeleton structure was reduced, and the strength of the samples had a greater decrease compared with that under freshwater conditions, which was consistent with the macroscopic test results reflected in Figure 6.
3.2.3. Effect of Sand Particle Content on Chloride Ion () Erosion Resistance of the CS-SS Samples
The CS-SS samples with 5% and 15% sand particle content were subjected two dry–wet cycles, and the samples with different dry–wet cycles were taken out for an ion chromatography test.
In the case of the results of the ion chromatography test, the larger the peak area of the element was, the greater the concentration of the ions [32]. Figure 11a,b showed that the peak area of in the CS-SS samples with 5% sand particle content was 0.47 μS·min after one dry–wet cycle in seawater and the peak area increased to 0.95 μS·min after two dry–wet cycles. It can be seen from Figure 12 and Table 5 that after separation by the ion chromatography column, the content also increased from 137.80 mg/L to 299.50 mg/L by increasing the number of dry–wet cycles from 1 to 2, an increase of 117.34%. As the number of dry–wet cycle increased the erosion of in the sample increased and the corresponding Friedel’s salt generated increased, which was consistent with the XRD test results in Figure 10b, and the corresponding UCS of the samples decreased. In addition, compared with Figure 11b,c and Table 5, the peak area of in the CS-SS samples with 5% and 15% sand particle content after two dry–wet cycles decreased with the increase of sand particle content, the content also decreased from 299.50 mg/L to 255.71 mg/L, a decrease of 14.62%. This indicates that the increase of sand particle content was capable of increasing the ability of the samples to resist erosion, which was consistent with the macroscopic test results reflected in Figure 6.
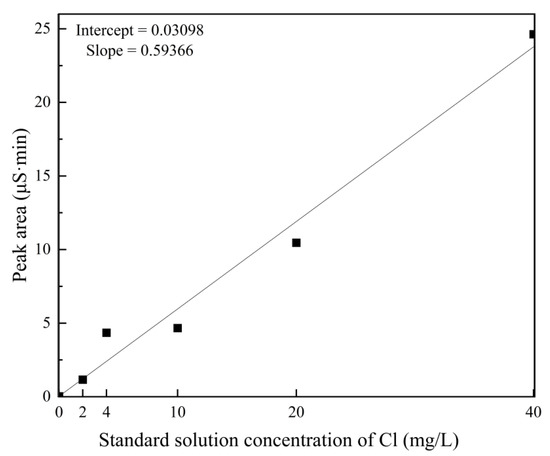
Figure 12.
Standard curve of in the laboratory.
Table 5.
Mass concentration of in the CS-SS samples under seawater conditions.
4. Conclusions
- (1)
- Sand particles can effectively increase the UCS and improve the anti-dry–wet cycle ability of the CS-SS. The 7, 14, and 28 d UCS of the CS-SS samples increases with an increase in sand particle content, and their anti-dry–wet cycle ability increases with an increase in the sand particle content and a decrease in the sand particle size.
- (2)
- The UCS of the CS-SS samples decreases sharply after two dry–wet cycles. The strength deterioration effect caused by the dry–wet cycle of the samples under seawater conditions is more remarkable than that under freshwater conditions.
- (3)
- The C-S-H gel produced by the hydration of cement in the CS-SS and the cemented soil-sand particle skeleton structure formed by the sand particles are the microphysical mechanism for the improvement of its UCS and resistance to the dry–wet cycle. The multiscale deterioration mechanism of the strength of the CS-SS during dry–wet cycles can be interpreted as follows: As the number of dry–wet cycles increases, short and dense microcracks appear at the microscale, destruction of the cementation interface is generated at the mesoscale, and the reduction of the UCS of the CS-SS is induced at the macroscale.
- (4)
- Through the SEM scanning electron microscope test, it was found that with the increase in the number of dry–wet cycles, the cementation interface between the particles in the sample was destroyed, and the cracks increased with the increase in the number of cycles, destroying the sample structure. Seawater is more corrosive to the sample, and the phenomenon of stratification and spalling between particles is more pronounced. The structure of the fine sand-solidified soil is relatively more complete and the strength loss is smaller, followed by medium sand and coarse sand. Through XRD mineral composition analysis, it was found that the freshwater/seawater dry–wet cycles reduce the hydration products in the sample, resulting in a decrease in the strength of the sample. Since the corrosive ions in seawater will destroy the hydration products and form Friedel’s salt with poor cementation, which is unfavorable to the strength of the sample, the hydration products are greatly reduced after seawater circulation, so the strength reduction is greater.
Author Contributions
Conceptualization, S.L.; Methodology, D.F.; Formal analysis, D.F.; Writing–original draft, Y.W. and D.F.; Writing–review and editing, S.L.; Visualization, Y.W. All authors have read and agreed to the published version of the manuscript.
Funding
The authors are grateful to the National Natural Science Foundation of China (grant number 52078142), the Natural Science Foundation of Guangdong Province (grant number 2022A1515011047), and the Science and Technology Program of Guangzhou, China (grant number 202002030194) for their financial support.
Institutional Review Board Statement
Not applicable.
Informed Consent Statement
Informed consent was obtained from all subjects involved in the study.
Data Availability Statement
The data used to support the findings of this study are included in the article.
Conflicts of Interest
The authors declare no conflict of interest.
References
- Ren, Y.; Yang, Q.; Wang, Y.; Zhao, W. Experimental study on the undrained shear strength of deep-sea soft soil using improved T-bar penetrometer. Mar. Georesources Geotechnol. 2020, 38, 1199–1208. [Google Scholar] [CrossRef]
- Benghai, L.; Shuzhuang, Y.; Boshan, Z.; Wu, H. Geological structure and basic geotechnical charecteristics in Guangdong province. Chin. J. Rock Mech. Eng. 2006, 25, 3337–3346. (In Chinese) [Google Scholar]
- Mi, D.; Luo, J.; Liu, X.; Xu, L.; Chen, D. Origin Distribution and Geotechnical Characters of Marine Soft Clay in Guangxi Coastal Highway. J. Coast. Res. 2019, 94, 269–274. [Google Scholar] [CrossRef]
- Zhou, H.; Zheng, G.; Yu, X.; Zhang, T.; Liu, J. Bearing capacity and failure mechanism of ground improved by deep mixed columns. J. Zhejiang Univ.-Sci. A (Appl. Phys. Eng.) 2018, 19, 266–276. [Google Scholar] [CrossRef]
- Shao, Y.; Macari, E.J.; Cai, W. Compound deep soil mixing columns for retaining structures in excavations. J. Geotech. Geoenvironmental Eng. 2005, 131, 1370–1377. [Google Scholar] [CrossRef]
- Wan, Y.; Song, L.; Zhu, Z.; Peng, Y. Research on Construction Quality Monitoring and Evaluating Technology of Soil-Cement Mixing Piles. Soil Mech. Found. Eng. 2021, 58, 85–91. [Google Scholar] [CrossRef]
- Mitchell, J.K.; El Jack, S.A. The Fabric of Soil—Cement and Its Formation. Clays Clay Miner. 1966, 14, 297–305. [Google Scholar] [CrossRef]
- Du, Y.-J.; Jiang, N.-J.; Liu, S.-Y.; Jin, F.; Singh, D.N.; Puppala, A.J. Engineering properties and microstructural characteristics of cement-stabilized zinc-contaminated kaolin. Can. Geotech. J. 2014, 51, 289–302. [Google Scholar] [CrossRef]
- Miraki, H.; Shariatmadari, N.; Ghadir, P.; Jahandari, S.; Tao, Z.; Siddique, R. Clayey soil stabilization using alkali-activated volcanic ash and slag. J. Rock Mech. Geotech. Eng. 2022, 14, 576–591. [Google Scholar] [CrossRef]
- Du, C.; Zhang, J.; Yang, G.; Yang, Q. The influence of organic matter on the strength development of cement-stabilized marine soft clay. Mar. Georesources Geotechnol. 2021, 39, 983–993. [Google Scholar] [CrossRef]
- Ge, S.; Zang, J.; Wang, Y.; Zheng, L.; Xie, X. Combined stabilization/solidification and electroosmosis treatments for dredged marine silt. Mar. Georesources Geotechnol. 2021, 39, 1157–1166. [Google Scholar] [CrossRef]
- Osman, A.I.; Fawzy, S.; Farghali, M.; El-Azazy, M.; Elgarahy, A.M.; Fahim, R.A.; Maksoud, M.I.A.A.; Ajlan, A.A.; Yousry, M.; Saleem, Y. Biochar for agronomy, animal farming, anaerobic digestion, composting, water treatment, soil remediation, construction, energy storage, and carbon sequestration: A review. Environ. Chem. Lett. 2022, 20, 2385–2485. [Google Scholar] [CrossRef] [PubMed]
- Xu, X.; Zhong, J.; Huang, X.; Li, H.; Ding, Z.; Lai, Z. Age comparison by luminescence using quartz and feldspar on core HPQK01 from the Pearl River delta in China. Quat. Geochronol. 2022, 71, 101320. [Google Scholar] [CrossRef]
- Subramanian, S.; Khan, Q.; Ku, T. Effect of sand on the stiffness characteristics of cement-stabilized clay. Constr. Build. Mater. 2020, 264, 120192. [Google Scholar] [CrossRef]
- Xu, M.; Liu, L.; Deng, Y.; Zhou, A.; Gu, S.; Ding, J. Influence of sand incorporation on unconfined compression strength of cement-based stabilized soft clay. Soils Found. 2021, 61, 1132–1141. [Google Scholar] [CrossRef]
- Chian, S.C.; Chim, Y.Q.; Wong, J.W. Influence of sand impurities in cement-treated clays. Géotechnique 2016, 67, 31–41. [Google Scholar] [CrossRef]
- Zhang, J.; Hu, X.; Hong, W.; Li, T.; Shi, D.; Li, T. Experimental research of mechanical properties and microstructure for cement mortar composite soil. Chin. J. Rock Mech. Eng. 2012, 31, 3264–3269. (In Chinese) [Google Scholar]
- Liu, X.; Fan, X.; Hong, B. Experimental study of triaxial test of soils stabilized by cement mortar. Rock Soil Mech. 2011, 32, 1676–1682. (In Chinese) [Google Scholar]
- Abousnina, R.M.; Manalo, A.; Lokuge, W. Physico-mechanical properties of soils stabilized by cement mortar. Chin. J. Geotech. Eng. 2008, 30, 605–610. (In Chinese) [Google Scholar]
- Du, J.; Liu, B.; Wang, Z.; Zheng, G.; Jiang, N.-J.; Zhou, M.; Zhou, H. Dynamic Behavior of Cement-Stabilized Organic-Matter-Disseminated Sand under Cyclic Triaxial Condition. Soil Dyn. Earthq. Eng. 2021, 147, 106777. [Google Scholar] [CrossRef]
- Chandu, A.S.; Rao, G. Strength and Durability Characteristics of Red Soil Stabilised with Foundry Sand and Cement. Arab. J. Sci. Eng. 2021, 46, 5171–5178. [Google Scholar] [CrossRef]
- Pan, L. Laboratory testing study on the strength regularity of Wenzhou soft cement-soil. Chin. J. Rock Mech. Eng. 2003, 22, 863. (In Chinese) [Google Scholar]
- Liang, S.; Zeng, W. Experimental study of nansha silt soil reinforced with cement and fly-ash during wetting-drying cycles. Ind. Constr. 2018, 48, 83–86+43. (In Chinese) [Google Scholar]
- GB/T50123-2019; The Professional Standards Compilation Group of People’s Republic of China. Specification of soil test; China Architecture and Building Press: Beijing, China, 2019. (In Chinese)
- Zhao, X.; Dong, Q.; Chen, X.; Ni, F. Meso-cracking characteristics of rubberized cement-stabilized aggregate by discrete element method. J. Clean. Prod. 2021, 316, 128374. [Google Scholar] [CrossRef]
- Ministry of Environment Protection. Water Quality-Determination of Inorganic Anions (F−, Cl−, NO2−, B−, NO3−, PO43−, SO32−, SO42−): HJ84-2016; Standards Press of China: Beijing, China, 2016. (In Chinese)
- Cristelo, N.; Cunha, V.M.C.F.; Gomes, A.T.; Araújo, N.; Miranda, T.; de Lurdes Lopes, M. Influence of fibre reinforcement on the post-cracking behaviour of a cement-stabilised sandy-clay subjected to indirect tensile stress. Constr. Build. Mater. 2017, 138, 163–173. [Google Scholar] [CrossRef]
- Xing, H.; Yang, X.; Xu, C.; Ye, G. Strength characteristics and mechanisms of salt-rich soil–cement. Eng. Geol. 2009, 103, 33–38. [Google Scholar] [CrossRef]
- Balonis, M.; Lothenbach, B.; Le Saout, G.; Glasser, F.P. Impact of chloride on the mineralogy of hydrated Portland cement systems. Cem. Concr. Res. 2010, 40, 1009–1022. [Google Scholar] [CrossRef]
- Millogo, Y.; Morel, J.C. Microstructural characterization and mechanical properties of cement stabilised adobes. Mater. Struct. 2012, 45, 1311–1318. [Google Scholar] [CrossRef]
- Wahab, N.; Talib, M.K.A.; Malik, A.K.A.; Madun, A. Effect of cement stabilized peat on strength, microstructure, and chemical analysis. Phys. Chem. Earth Parts A/B/C 2023, 129, 103348. [Google Scholar] [CrossRef]
- Waller, S.E.; Belousov, A.; Kidd, R.D.; Nikolić, D.; Madzunkov, S.M.; Wiley, J.S.; Darrach, M.R. Chemical ionization mass spectrometry: Applications for the in situ measurement of nonvolatile organics at ocean worlds. Astrobiology 2019, 19, 1196–1210. [Google Scholar]
Disclaimer/Publisher’s Note: The statements, opinions and data contained in all publications are solely those of the individual author(s) and contributor(s) and not of MDPI and/or the editor(s). MDPI and/or the editor(s) disclaim responsibility for any injury to people or property resulting from any ideas, methods, instructions or products referred to in the content. |
© 2023 by the authors. Licensee MDPI, Basel, Switzerland. This article is an open access article distributed under the terms and conditions of the Creative Commons Attribution (CC BY) license (https://creativecommons.org/licenses/by/4.0/).