Abstract
Traffic sign detection significantly reduces traffic accidents, but in real-world scenarios, the considerable distance between traffic signs and in-vehicle cameras means only a small proportion of traffic signs are captured in the images. This makes far-off traffic sign detection a small object detection problem, and with fewer details in small sign objects, detection becomes increasingly challenging. In this paper, we specifically address poor localization, low accuracy, and missed detections when using You Only Look Once Version 5 (YOLOv5) for detecting small traffic sign objects. Firstly, we incorporate a decoupled head into YOLOv5’s detection algorithm, which serves to improve detection accuracy and accelerate network convergence. Then, to handle low-resolution targets better, we substitute the network’s original convolution layers with Space-to-Depth Convolution (SPD-Conv) modules. This modification enhances the model’s capacity to extract features from low-resolution traffic sign objects. Lastly, we integrate the Context Augmentation Module (CAM) into YOLOv5 by employing variable rate extended convolution. This module extracts context information from multiple receptive fields, thus providing essential supplementary information and significantly enhancing detection accuracy. Empirical results demonstrate the efficacy of our algorithm, shown by a substantial increase in object detection precision rate to 95.0%, a recall rate of 91.6%, and an average precision of 95.4%. These results represent improvements of 2.1%, 4.8% and 3.7%, respectively, when compared to the original YOLOv5 algorithm. Furthermore, when tested against other state-of-the-art methods, our proposed methodology shows superior performance.
1. Introduction
Research on traffic sign object detection can be classified into two categories: traditional methods [1] and deep learning-based methods. Traditional techniques for traffic sign detection encompass color-based detection and shape-based detection. However, color-based detection can be compromised by the fading or absence of color in traffic signs, resulting in decreased detection performance [2]. On the other hand, shape-based traffic sign detection leverages the extraction of edge information to analyze the shape and category of traffic signs. While shape-based detection is less susceptible to color decay, its performance also deteriorates when there are variations in the shape or detection angle of the sign.
Deep learning-based algorithms demonstrate superior real-time performance and accuracy compared to traditional traffic detection algorithms. Since the introduction of Region-Based Convolutional Neural Networks (R-CNN) in 2014 [3], deep learning has gained significant traction in traffic sign detection. Deep learning-based object detection algorithms can be categorized into two main directions: one-stage and two-stage detection algorithms. One-stage detection algorithms, such as the You Only Look Once (YOLO) series [4], EfficientDet [5], and Single Shot MultiBox Detector (SSD) [6], provide efficient and accurate detections in a single pass. On the other hand, two-stage detection algorithms, such as Fast Region-Based Convolutional Neural Networks (Fast R-CNN) [7], Faster Region-Based Convolutional Neural Networks (Faster R-CNN) [8], Spatial Pyramid Pooling in deep convolutional networks (SPP-Net) [9], and HyperNet [10] do exhibit exceptional robustness, but they mandate a more intricate process that unfolds across multiple stages for a comprehensive detection. These advancements in deep learning-based algorithms have significantly contributed to the field of traffic sign detection.
Researchers have made significant progress in applying deep learning-based object detection algorithms to traffic sign detection [11,12,13]. Zhu and colleagues established a new benchmark for traffic sign detection, the TsinghuaTencent100K (TT100K) [14], which comprises a larger image dataset, higher resolution, and more complex backgrounds compared to the widely-used German Traffic Sign Detection Benchmark (GTSDB) [15]. Many studies are currently being conducted using this benchmark. Huaqing Lai and colleagues introduced a novel approach focusing on enhancing multi-scale detection performance [16]. Their method integrates Dilated Spatial Pyramid Pooling (DSPP) and the Multi-scale Feature Residual Aggregation Module (FRAM) to aggregate features across various scales [17]. However, despite achieving an impressive mean accuracy with their approach, they still encountered challenges in precisely detecting small traffic signs. Chang-Il Kim [18] proposed a deep learning-based real-time traffic sign recognition system for autonomous driving in urban environments. Their method employed the YOLOv5 detector and the strongSORT tracking model [19], both of which surpassed other models in terms of accuracy and processing time. Furthermore, they extensively discussed potential challenges in the traffic sign recognition task. However, despite their method’s significant advancements under various road conditions, it exhibited a distinct decrease in performance when detecting small traffic signs, especially those with lower resolution in images. Jinqi Chu and his team [20] developed a model with global feature extraction capabilities and incorporated a multi-branch lightweight detection head to enhance the detection accuracy of small traffic signs. However, even though their algorithm achieved an accuracy of 86.3% on the TT100K dataset, its performance still lags behind other state-of-the-art methods. Jie Hu and associates put forth a paradigm for traffic sign detection and recognition based on deep learning algorithms [21]. Their approach leverages parallel deformable convolution modules, sub-pixel convolution attention modules, and GSConv [22] to boost the model’s performance. While their method marked significant advancements in handling traffic sign object detection, small object detection accuracy still fell short. Although researchers have made significant progress in applying deep learning-based object detection algorithms to traffic sign detection [23,24], practical detection still faces challenges, particularly due to the prevalence of low-resolution small targets in traffic signs (as shown in Figure 1) [25], resulting in low detection accuracy and missed detections. Therefore, further research is necessary to improve traffic sign detection algorithms. Enhancing the accuracy of detecting small targets can improve overall detection performance since small targets constitute a significant proportion of traffic signs. This study aims to enhance the accuracy and recall rate of small targets in traffic signs, thereby improving overall detection performance and facilitating practical applications.
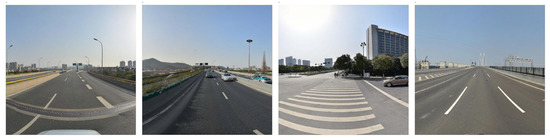
Figure 1.
Examples of low-resolution traffic sign small object images in real-world scenarios.
The advantages of our proposed technique lie in its ability to improve the detection accuracy and localization of small traffic sign objects in real-world scenarios. The main contributions of this work can be summarized as follows:
- In order to enhance the detection accuracy and accelerate network convergence within the YOLOv5 architecture, we introduce a decoupled head from YOLOX [26] into the detection head of the model. The underlying concept behind this proposal is to segregate the classification and localization tasks, thereby ensuring a more focused and specialized tackle on each sub-task in the detection process. This incorporates a decoupled architecture approach that caters to the model’s need to separately optimize these distinct detection aspects. This innovative inclusion promises to increase the precision of detection while accelerating the model’s learning efficiency.
- We propose to replace the original convolution in the network framework with the SPD-Convolution module. This change aims to eliminate the impact of pooling operations on feature information and enhance the model’s ability to extract features from low-resolution small objects.
- Adding the Contextual Augmentation Module (CAM) to supplement contextual information by utilizing extended convolutions with varying rates. This module captures contextual information from different receptive fields, playing a crucial complementary role in small object detection of traffic signs. It effectively addresses the challenges posed by small targets and improves detection accuracy.
- Our proposed technique significantly reduces the occurrence of missed detections and false positives, ensuring a high recall rate of 91.6% and a precision rate of 95.0%. These results represent substantial improvements over the original YOLOv5 algorithm, demonstrating the efficacy of our approach in achieving more precise and comprehensive traffic sign detection.
The remainder of this paper is organized as follows. Section 2 provides a detailed description of our proposed method. In Section 3 and Section 4, we present the experimental setup and evaluation results, demonstrating the effectiveness of our algorithm. Finally, Section 5 concludes the paper and discusses future research directions.
2. YOLOv5 Algorithm
The YOLOv5 detection algorithm was first introduced by Bochkovskiy et al., (2020) at Ultralytics. YOLOv5 mainly utilizes a more efficient network structure and loss function than the YOLOv4 algorithm [27], achieving better performance in object detection tasks. Furthermore, YOLOv5 introduces adaptive training strategies and data augmentation techniques, ensuring excellent detection results in different scenarios. YOLOv5 has four different structures: YOLOv5s, YOLOv5m, YOLOv5l, and YOLOv5x. YOLOv5s is optimized for speed and is suitable for real-time detection tasks. The YOLOv5s detection process can be divided into four main parts: input, backbone, neck, and output. In this paper, we have elected to focus our improvements on the YOLOv5s network due to its superior speed optimization for real-time detection tasks. The architecture for the same is illustrated in Figure 2.
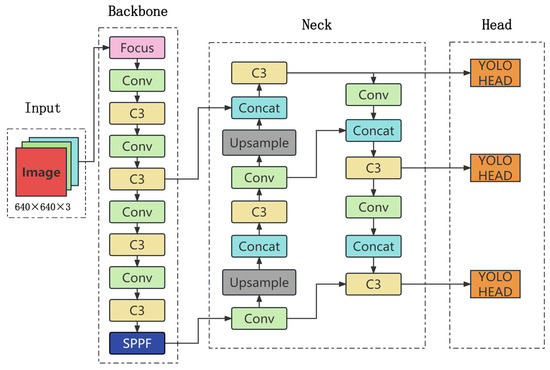
Figure 2.
YOLOv5s network architecture.
2.1. Input
The input stage of YOLOv5 is responsible for receiving and preprocessing the input image. This includes operations such as resizing, normalization, and color space conversion, allowing the image to be fed into the network for feature extraction and detection. The input stage of YOLOv5s utilizes mosaic data augmentation [27]. This technique involves combining four distinct images into a single larger one, which serves as the input for the detector. This method significantly enhances the algorithm’s overall accuracy and robustness, thereby improving the model’s ability to detect objects in complex and diverse environments.
2.2. Backbone
The backbone of YOLOv5 incorporates several important modules, including Focus, Conv, the Bottleneck Cross Stage Partial network (Bottleneck CSP), and Spatial Pyramid Pooling (SPP) [28]. Each module contributes to the efficient and accurate feature extraction necessary for object detection. The Focus module employs a novel approach to down-sample input images, allowing it to efficiently capture useful information while reducing computational complexity. Conv layers are also extensively used in the backbone, providing powerful feature extraction capabilities. The Bottleneck CSP module is another key component, which uses a bottleneck structure to increase the network’s capacity while reducing memory usage [29]. This module plays a vital role in multi-scale feature extraction, capturing both fine and coarse-grained features. Lastly, the SPP module is designed to efficiently extract multi-scale features by pooling features at different resolutions in a pyramid-like fashion. It is worth noting that different YOLOv5 versions have some module replacements. For instance, after V6.0, the Focus module is replaced by Conv, and the SPP module is replaced by Special Pyramid Pooling Fusion (SPPF). These changes improve the model’s overall accuracy and efficiency. In this paper, we specifically use YOLOv5-V6.1, which delivers optimal performance for our detection task.
2.3. Neck
The neck network is usually located in the middle of the backbone network and head network, which can further improve the diversity and robustness of features. YOLOv5 v6.1 replaces SPP with SPPF, which is twice as fast as SPP when the calculation results are the same. A Cross Stage Partial (CSP) structure is also introduced into the Path Aggregation Network (PAN) structure [30]. The CSP structure connects two parallel pathways within each stage of the PAN architecture, enabling the model to simultaneously capture both local and global features. By breaking down the large convolutional layers into smaller ones and introducing a cross-stage connection, the CSP structure increases the network’s capacity while reducing computational complexity. This enhances the model’s ability to handle complex detection tasks involving objects of different scales and orientations.
2.4. Head
The object detection head is a crucial part of the detection process that operates on the feature pyramid to detect objects of different scales and resolutions. It comprises convolutional layers, pooling layers, fully connected layers, and more. In YOLOv5, the detection head module is responsible for multi-scale object detection on the feature maps extracted by the backbone network. The module consists of three parts, including anchor box prediction, bounding box regression, and classification.
2.5. The Loss Function in YOLOv5
The YOLOv5 model’s loss function constellates from three significant portions, which are the Bounding Box Loss, Objectness Loss, and Class Loss.
The Bounding Box Loss measures the difference between the predicted bounding box and its actual counterparts for the center coordinates and dimensions. This part of the loss function is crucial for predicting the location and size in object detection tasks:
Box_Loss = ∑ (bx − tx)2 + ∑ (by − ty)2 + ∑ (bw − tw)2 + ∑ (bh − th)2
Here, bx, by, bw, and bh represent the bounding box’s actual parameters, while tx, ty, tw, and th represent the predicted parameters.
The Objectness Loss is instrumental in discerning whether a detected object exists within the bounding box. Incorporating this loss allows the model to encode the presence or absence of an object, thereby enhancing detection effectiveness:
where, object_label represents the actual label denoting the presence of an object, while Pr(object) represents the predicted probability of the object’s existence.
Obj_Loss = − ∑ object_label · log(Pr(object)) + (1 − object_label) · log(1 − Pr(object))
The Class Loss measures the precision of the model’s prediction regarding an object’s class. This is defined as:
Class_Loss = − ∑ class_label · log(Pr(class_i))
In this context, class_label is the actual class label, while Pr(class_i) is the model’s predicted probability for that class. Collectively, these three components assemble to create the total loss function L for the YOLOv5 model:
L = λ_box · Box_Loss + λ_obj · Obj_Loss + λ_class · Class_Loss
Here, λ_box, λ_obj, and λ_class are adjustable weight coefficients, determining each loss part’s significance during the optimization process. Adjusting these coefficients will allow us to optimize the model’s performance for various tasks.
3. Improvement of the YOLOv5s Algorithm
3.1. SPD-Conv
Convolutional Neural Networks (CNN) have exceedingly excelled in diverse computer vision applications, including image categorization and object identification. Regrettably, their efficacy has a tendency to precipitously decline when dealing with intricate tasks involving degraded image resolution or minuscule objects. This downfall is largely due to a prevailing fault in the design of conventional CNN structures, which implement strided convolutions and/or pooling layers, leading to the forfeit of delicate information and the ineffective acquisition of feature representation.
In 2022, to address this issue, Raja Sunkara and Tie Luo of the University of Missouri came up with a novel CNN Module SPD-Conv that replaces each strided convolution and pooling layer, effectively eliminating them [31]. SPD-Conv consists of space-to-depth (SPD) layers and non-strided Conv layers and can be applied to most CNN architectures. This innovative module enables more efficient feature representation learning, yields superior detection performance, and overcomes the limitations of traditional CNN architectures in handling challenging images with lower resolution or smaller objects. The SPD-Conv module comprises an SPD layer and a non-strided convolution layer. The SPD component extends the image transformation technique to down-sample feature maps within CNN and across the entire CNN, as shown below. Taking any intermediate feature map X of size S × S × C1, a series of sub-feature maps are cropped as follows:
f0,0 = X [0:S:scale, 0:S:scale], f1,0 = X[1:S:scale, 0:S:scale], ...,
fscale−1,0 = X[scale − 1:S:scale, 0:S:scale];
f0,1 = X[0:S:scale, 1:S:scale], f1,1, ...,
fscale−1,1 = X[scale − 1:S:scale, 1:S:scale];
fscale−1,0 = X[scale − 1:S:scale, 0:S:scale];
f0,1 = X[0:S:scale, 1:S:scale], f1,1, ...,
fscale−1,1 = X[scale − 1:S:scale, 1:S:scale];
f0,scale−1 = X[0:S:scale, scale − 1:S:scale], f1,scale−1, ...,
fscale−1,scale−1 = X[scale − 1:S:scale, scale − 1:S:scale];
fscale−1,scale−1 = X[scale − 1:S:scale, scale − 1:S:scale];
This approach is particularly useful for handling low-resolution images or detecting small objects in an image. It has been shown to significantly improve the overall detection performance of CNNs on various benchmark datasets, such as MS COCO and PASCAL VOC. Taking any intermediate feature map of size S × S × C1, a series of sub-feature maps are cropped as follows: each submap, denoted by X(i+y), consists of all entries that can be proportionally divided by i + x and i + y, downsampling the feature map with a proportional factor. An example of this is shown in Figure 3, when scale = 2, where four submaps (f0,0, f0,1, f1,0, f1,1) are obtained, each with shape (S/2,S/2,C1) and downsampling the feature map X by a factor of two.
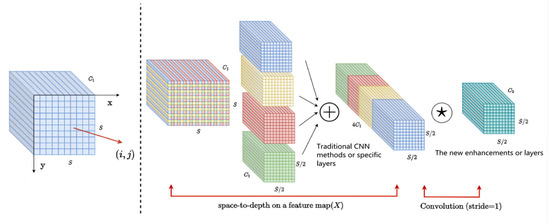
Figure 3.
Illustration of SPD-Conv when scale = 2.
3.2. Decoupled Head
In the field of object detection, the shared branch between the classification and regression tasks in the YOLOv5 head is well-recognized as a problem that can negatively impact the training process, given the relatively low correlation between classification scores and localization accuracy. To address this issue, the decoupled head for classification and localization has become widely adopted in most one-stage and two-stage detectors. However, as the backbones and feature pyramids of YOLO series detectors, such as Feature Pyramid Networks (FPN) [32] and Path Aggregation Networks (PAN), continue to evolve, their detection heads remain coupled. The coupled detection head in YOLOv5 can limit performance improvements, as it can introduce noise in the error signal during backpropagation. By decoupling the detection head, the model can independently learn features, leading to improved accuracy, robustness, and generalization capabilities.
Several experiments in the literature [26] have demonstrated that using coupled detection heads can lead to a decrease in performance, with a reduction in the end-to-end property of 4.2% AP. In contrast, when using decoupled detection heads, the decrease in AP is only 0.8%. To address this issue and improve the performance of YOLOv5, researchers have replaced the detection head with a simplified decoupled head, as illustrated in Figure 4. Specifically, this decoupled head consists of a 1 × 1 convolutional layer that reduces the channel dimension, followed by two parallel branches, each with two 3 × 3 convolutional layers. These changes improve the accuracy and robustness of YOLOv5 models, even as the backbones and feature pyramids continue to evolve.
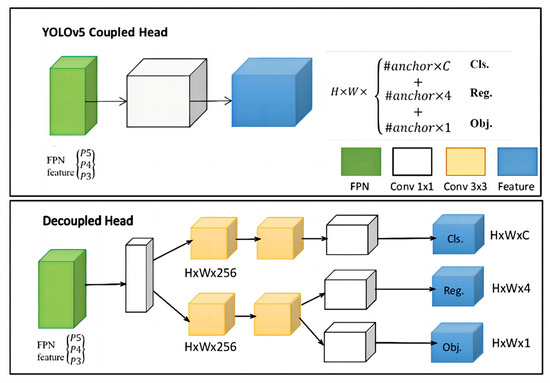
Figure 4.
Illustration of the differences between YOLOv head and decoupled head.
In the new decoupled head, each branch has a smaller receptive field and fewer parameters, which help reduce overfitting. Additionally, the parallel design allows the head to learn features that are independent of each other, making the model more versatile and adaptable to different applications. The decoupled head also facilitates feature reuse, leading to more efficient computation.
Overall, this modification provides a promising approach for improving object detection models, particularly in critical applications such as autonomous driving and surveillance. The decoupled head has been shown to enhance the accuracy and robustness of YOLOv5 models, making it an effective tool for real-world scenarios.
3.3. Context Augmentation Module
For object detection, it is unlikely for the target object to exist in isolation, as it is usually related to the surrounding objects to varying degrees. This contextual information is commonly referred to as the relationships between the target object and the surrounding objects. In the case of traffic sign detection, the surrounding traffic sign poles and other objects can serve as effective contextual information for traffic sign detection. Therefore, learning these relationships is crucial for the task.
To detect tiny objects, contextual information is necessary. Reference [33] proposes using expanded convolution with varying rates to obtain contextual information from multiple receiving domains. This method is called the Context Augmentation Module (CAM). The inspiration for the Context Augmentation Module (CAM) comes from the way humans recognize objects. For example, it is difficult for humans to distinguish a bird in the high sky, but it becomes easier once the sky is recognized as the background information. Therefore, contextual information is helpful for detecting tiny objects. CAM uses expanded convolution with varying rates to obtain contextual information with different receptive fields, which is then integrated into the feature pyramid network (FPN) [32] from top to bottom to enrich contextual information. The Context Augmentation Module utilizes expanded convolution to extract contextual information from multiple receiving domains and integrates it into FPN, improving contextual information for tiny objects. In this method, features are expanded through dilated convolution at rates of 1, 3, and 5, respectively. By fusing features from multiple receiving domains, contextual information can be obtained. As shown in the following Figure 5, this is the structure of CAM.
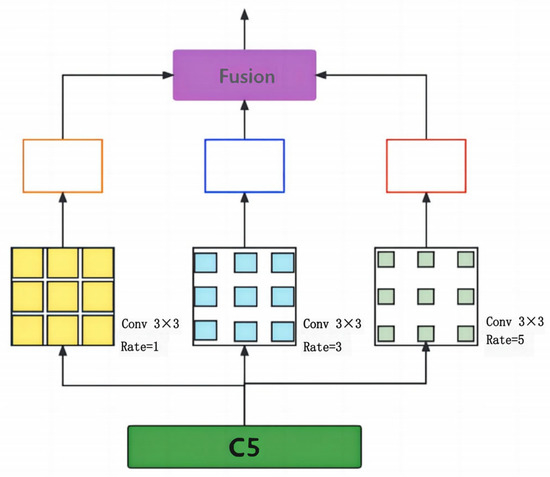
Figure 5.
The structure of CAM.
Different dilated convolution rates are applied to C5 to obtain contextual information with various receptive fields. The kernel size is 3 × 3, and the rates are 1, 3, and 5. Methods (a) and (c) involve weighted fusion and concatenation, respectively, which directly add feature maps in the spatial and channel dimensions. Method (b) is an adaptive fusion method. Assuming the input has a size of (bs, C, H, W), convolution operations can produce spatial adaptive weights with a shape of (bs, 3, H, W). Possible fusion methods are shown in Figure 6 below:
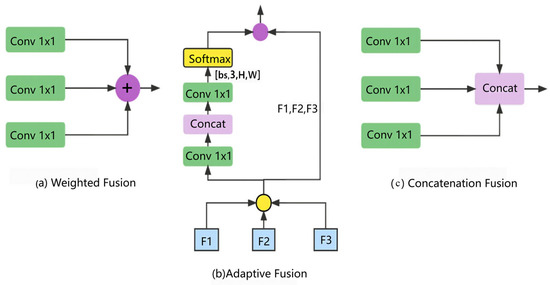
Figure 6.
Ways of fusion.
4. Experiment and Discussion
4.1. Dataset
TT100K is a dataset jointly created by Tsinghua and Tencent that provides a total of 100,000 images, with 10,000 containing traffic signs and 30,000 instances of traffic signs. The TT-100K dataset was captured by six high-pixel wide-angle SLR cameras in various Chinese cities, covering 221 different types of traffic signs, of which 128 were annotated. Compared with other traffic sign datasets, TT100K has more categories, smaller targets, and greater detection difficulty. However, the category distribution is imbalanced, which can slow down the model’s convergence and lead to bias towards certain categories with insufficient feature learning, resulting in a deviation of generalization ability. To address this issue, this paper selected 45 categories from the TT100K dataset, and augmented under-represented categories. The resulting 11,575 images were divided into a testing set of 2315 images, a training set of 6945 images, and a validation set of 2315 images, according to a ratio of 2:6:2. Figure 7 shows a sample of the dataset.
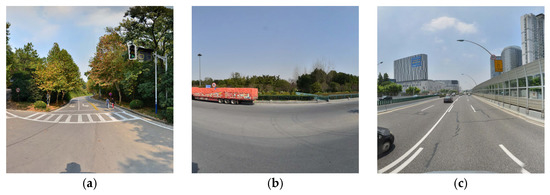
Figure 7.
Examples of low-resolution traffic sign small object images in real-world scenarios. (a) Sample 1; (b) Sample 2; (c) Sample 3.
4.2. Network Architecture of the Improved YOLOv5s
The network architecture of the improved YOLOv5s after the three aforementioned improvements is presented in Figure 8.
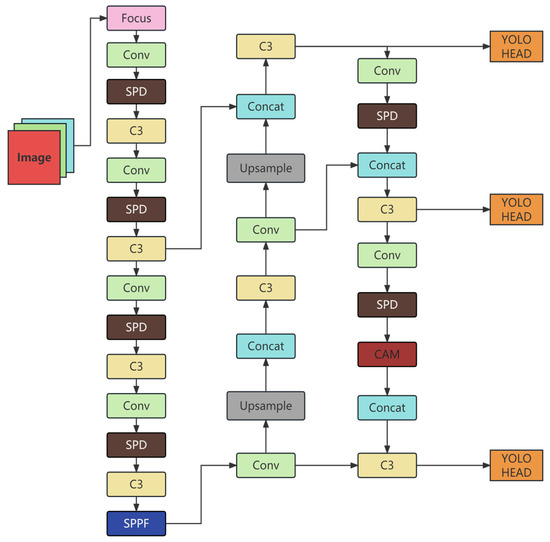
Figure 8.
Network architecture of the improved YOLOv5s.
4.3. Experiment and Parameter Settings
Experimental Setup
To ensure reproducibility and clarity in our research, we detail our experimental environment. The system and software configurations used for our experiments are illustrated in Table 1. Our setup includes a powerful GPU model and relevant software dependencies critical for deep learning tasks. As shown in the Table 1.

Table 1.
Experimental Environment.
Training a deep learning model requires careful selection of various parameters that can significantly influence the model’s performance. Table 2 provides a comprehensive overview of the primary training parameters we utilized. We adopted an image size of 640 × 640 pixels, which is a standard size for many vision tasks. A batch size of 36 was chosen based on the memory constraints of our GPU, and we trained the model for 800 epochs to ensure convergence. Furthermore, the data enhancement technique ‘Mosaic’ was employed to augment our dataset and potentially improve the model’s generalization capabilities. As shown in the Table 2.
Table 2.
Training Parameter Configuration.
Hyperparameters play a pivotal role in determining the model’s convergence speed and its final performance. The hyperparameter settings used in our experiments are presented in Table 3. The initial learning rate (Lr0) was set to 0.01, while the final learning rate (Lrf) was 0.2. We also incorporated a momentum of 0.937 and a weight decay factor of 0.0005 to regulate the model’s training dynamics. As shown in the Table 3.
Table 3.
Training hyperparameter settings.
4.4. Detection Performance Evaluation Metrics
The evaluation indicators in the experiment are primarily divided into detection accuracy and detection speed. Detection accuracy is used to evaluate the algorithm’s ability to accurately locate and classify targets, and the mean average precision (mAP) with IoU at 0.5 is used as the accuracy metric, which is defined as follows:
Here, n represents the total number of categories, and in this study, the dataset contains 45 categories of traffic signs, so n = 45. AP is the average precision of a certain class, which is defined as the mean precision at different recall rates. The calculation formula is as follows:
Here, P is the precision, which refers to the probability of correctly predicting among all predicted positive samples; R is the recall, which refers to the probability of detecting all positive samples; TP represents true positive, TN represents true negative, FP represents false positive, and FN represents false negative. The detection speed is measured with FPS (frames per second), defined as the frame rate, representing the number of images that can be detected per second.
4.5. Analysis of Experimental Results
This article designed two sets of experiments, namely ablation experiments of different improvement parts and comparative experiments with other mainstream algorithms.
4.5.1. Comparative Experiment on the Improvement of the SPD-Conv Module
To evaluate the effectiveness of replacing the original convolution in the YOLOv5 network framework with SPD-Convolution modules, this paper improved the CNN convolution based on YOLOv5S and named the improved algorithm YOLOv5-SPD. A comparative experiment was conducted on the dataset to compare the performance of the two algorithms. The experimental results are summarized in Table 4.
Table 4.
Experimental Verification of SPD-Conv Module Improvement.
From the experimental results, the network incorporating SPD-Convolution modules exhibited a noticeable increase in mAP, rising from 91.8% to 94.0%, indicating a gain of 2.2%. Furthermore, precision showed a 0.3% improvement, and the recall rate increased by 3.5%. These findings provide strong evidence supporting the effectiveness of SPD-Convolution modules. They also suggest that the enhanced SPD module successfully eliminates the adverse impact of pooling operations on feature information. Consequently, the model becomes more capable of extracting features from low-resolution small objects, ultimately leading to improved accuracy in traffic sign detection.
4.5.2. Comparative Experiment on CAM Improvement of Contextual Information
To validate the effectiveness of incorporating a context augmentation module for surrounding feature extraction, this study implemented the Context Augmentation Module (CAM) on top of the YOLOv5 architecture, resulting in an improved algorithm named YOLOv5-CAM. The experimental results are illustrated in Table 5.
Table 5.
Improvement Verification Experiment on CAM of Contextual Information.
The experimental results demonstrated that the addition of the context augmentation module resulted in an increase in the network’s mAP from 91.8% to 92.0%, representing a 0.2 percentage point improvement.
4.5.3. Comparative Experiment on Decoupled Head Improvement
Replacing YOLO’s head with a decoupled head can significantly improve convergence speed. In order to verify the effectiveness of the decoupled head in traffic sign detection, this paper decoupled the detection head of YOLOv5s, and named the improved algorithm YOLOv5-Head. A comparative experiment was conducted on YOLOv5s and the improved algorithm, YOLOv5-Head; the experimental results can be found in Table 6.
Table 6.
Improvement Verification Experiment on Decoupled Head.
According to the experimental results, the network using decoupled heads saw an increase in mAP from 91.8% to 93.8%, which is a 2% improvement, with an improvement of 0.4% in precision and 3.1% in recall rate. This comparison experiment confirms the effectiveness of using decoupled heads.
4.5.4. Comparative Experimental Analysis of All Improved Algorithms
We applied the mentioned improvements to the YOLOv5 network and compared it with the original YOLOv5 network. The experimental results are shown in Table 7.
Table 7.
Validation Experiment of All Improved Algorithms.
Experimental results show that the improved algorithm achieved a 95.0% full-object detection precision rate, a 91.6% recall rate, and 95.4% mean average precision, with an improvement of 2.1%, 4.8%, and 3.6% compared to the original YOLOv5 algorithm. The comparative mAP, precision, and recall curves of the original and the improved algorithms are consecutively illustrated in Figure 9, Figure 10 and Figure 11.
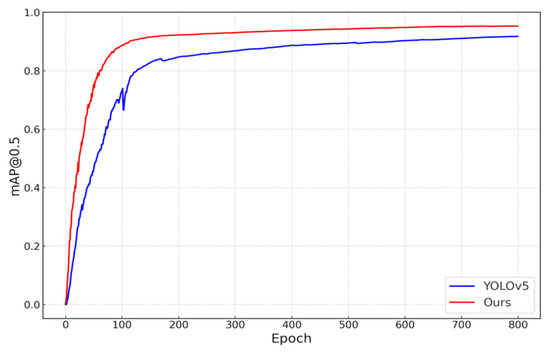
Figure 9.
Comparative analysis of mAP curves.
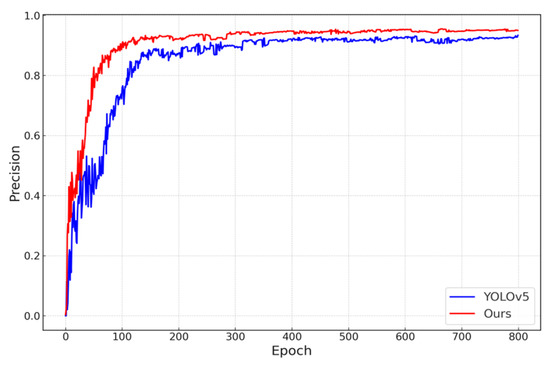
Figure 10.
Comparative analysis of precision curves.
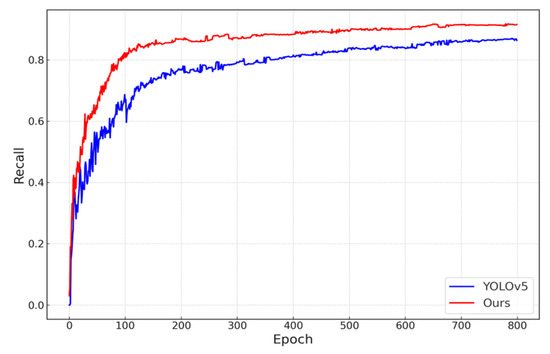
Figure 11.
Comparative analysis of recall curves.
4.6. Overfitting Analysis
In the process of model design and training, overcoming overfitting is a significant challenge. Overfitting occurs when a model performs well on the training set but poorly on the test set; i.e., unseen data. This phenomenon occurs when the model memorizes the specifics (including noise and outliers) of the training data, instead of learning general rules that can be applied to unknown data, a situation referred to as overfitting. In developing our model, our primary goal was to ensure its robust performance on the training data. To achieve this, we implemented several strategies to prevent overfitting during the training of our model using YOLOv5-v6.1.
- Data Augmentation: During the training phase, we employed the Mosaic data augmentation technique, which involved random cropping, rotations, scaling, and color distortions. By applying Mosaic, we were able to combine four images into a single training sample, allowing us to enhance the diversity of the training set and improve the model’s generalization capabilities.
- Dropout: Dropout was used as a regularization technique during the training process. It randomly deactivates a subset of neurons in the network during training, preventing co-adaptation and thereby reducing the risk of overfitting.
- Early Stopping: Early stopping is an effective strategy against overfitting. By monitoring the performance on the validation set, we stopped the training process if the validation performance did not improve over several consecutive epochs. This strategy prevented the model from overfitting the training data by terminating the training process before the model could start learning noise from the training data.
We validated our model’s resistance to overfitting by monitoring its performance on both the training and validation sets throughout the training process. The model demonstrated consistent performance on both these sets, indicating its strong generalization ability. The loss curves from the training process, as shown in Figure 12, exhibit a clear convergence without any signs of overfitting.
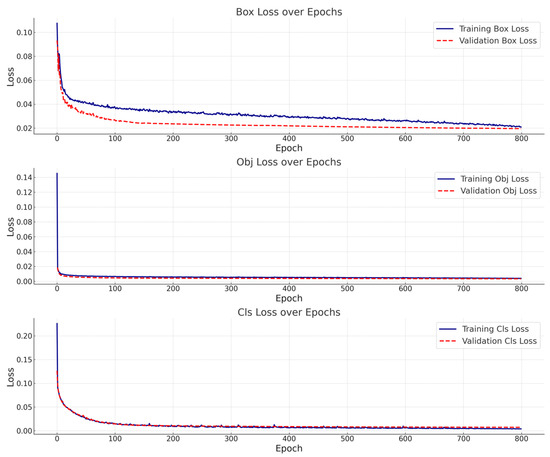
Figure 12.
Comparative analysis of training and validation losses.
From the provided visualizations, several observations can be made regarding the model’s performance: Both the training and validation box losses demonstrate a trend of convergence. There is no noticeable divergence between the two, which is a positive sign, indicating the absence of overfitting. The object loss (Obj Loss) showcases a similar pattern. Both training and validation losses decrease over time, with no signs of overfitting observed. The class loss (Cls Loss) also mirrors the convergence pattern seen in both the training and validation sets.
In summary, the presented graphs collectively suggest that the model exhibits robust performance on both training and validation datasets, with no evident signs of overfitting.
This consistent behavior underpins the model’s generalization capabilities, which is crucial for real-world applications.
4.7. Ablation Experiment
In order to validate the efficacy of the improvements proposed in this study on traffic sign detection performance, we designed and executed a series of ablation experiments for comparative analysis as follows: (1) the original YOLOv5 model; (2) the YOLOv5 model augmented with a Context Augmentation Module (CAM); (3) the YOLOv5 model enhanced with SPD-Convolution modules; (4) the YOLOv5 model with the incorporation of a decoupled head; (5) the simultaneous integration of the SPD-Convolution modules and decoupled head to the YOLOv5 model; (6) the YOLOv5 model with the combined addition of CAM, SPD-Convolution modules, and a decoupled head. We conducted the experiment under the same conditions on the TT100K dataset, with an input size of 640 × 640. Please note that any mention of YOLOv5 in this context, and throughout the paper, specifically refers to the YOLOv5s model. The specific performance results of these experiments are detailed in Table 8.
Table 8.
Ablation experiments.
Table 8 provides a comprehensive analysis of our experimentation results. With the integration of the enhanced Context Augmentation Module (CAM), the model’s capacity for assimilating contextual information from varied receptive fields has been significantly bolstered. As a direct result, the mean Average Precision (mAP) experienced an uptick of 0.2%. Incorporating the SPD-Convolution modules into the network architecture necessitated a minor augmentation of the model parameters, yet these alterations proved beneficial. They were instrumental in attaining an amplified precision, recall, and mAP of 0.3%, 3.5%, and 2.2%, respectively. The introduction of the advanced coupled head provided a notable boost to the detection accuracy and kindled a more rapid network convergence. These enhancements were quantified through a 0.4% boost in precision, a 3.1% rise in recall, and a 2% increase in mAP.
On implementing all proposed improvements in the YOLOv5 model, our proposed algorithm outperformed the original YOLOv5 on all metrics with significant margins. Specifically, we observed lifts of 2.1%, 4.8%, and 3.6% in precision, recall, and mAP, respectively. From these experimental results, it is evident that the proposed modifications have succeeded in significantly enhancing the effectiveness of the YOLOv5 model.
4.8. Comparative Experiments with Mainstream Algorithms
In order to validate the detection performance of the improved algorithm described in this paper, an experimental analysis was conducted. This involved a comparison of the improved algorithm with mainstream algorithms such as SSD, Faster R-CNN, RetinaNet, YOLOv3, YOLOv4, and YOLOv5. The backbone of the utilized Faster R-CNN is ResNet-101, while the SSD is based on ResNet-50. The input size was identical in both width and height. The experimental results are showcased in Table 9 and illustrated further in Figure 13.
Table 9.
Contrast with advanced algorithms.
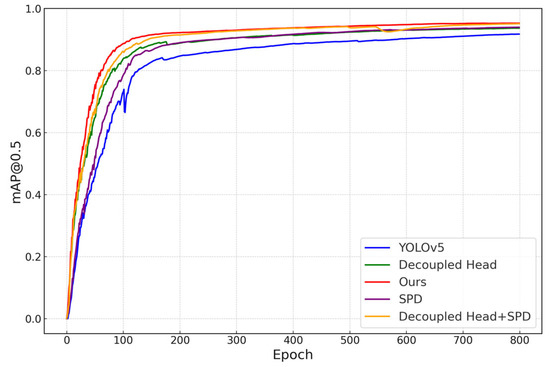
Figure 13.
mAP for different modules.
From the experimental data, it can be inferred that there is an inverse proportion between the number of parameters and detection speed. Among all of these compared algorithms, YOLOv5 has the least parameters, at just 7.13 × 10⁶, and offers the fastest speed. After the improvements were made to our algorithm, it added approximately 17.17 × 10⁶ parameters, subsequently dropping the speed to 80.7 frames per second. Despite this decline in speed, it is still remarkably competitive among these algorithms, assuring its capability for real-time detection. Regarding accuracy analysis, experiments showed that when the input size was standardized at 640, YOLOv5 offered superior precision over YOLOv3, YOLOv4, SSD, Faster R-CNN, and RetinaNet. However, our paper’s improved algorithm excelled, improving by approximately 2.1 and 4.6 percentage points in average precision and average recall for smaller detection targets, respectively. Furthermore, it outperformed YOLOv5 in terms of overall target accuracy, showing an improvement of approximately 3.6 percentage points.
In summary, the experimental analysis indicates that the improved algorithm proposed in this paper demonstrates certain superiority, both in terms of accuracy and speed, on the TT100K traffic sign detection dataset.
4.9. Example Visualization of Experimental Results
We compared the performance of the original YOLOv5 algorithm with our proposed traffic sign detection algorithm, the results of which are illustrated in the following figure.
We found that our improved algorithm can detect targets more effectively, offering increased accuracy on small targets along with strong performance on medium and large targets as well. To visually demonstrate the performance enhancement of our improved algorithm, we applied the original YOLOv5 algorithm and our improved YOLOv5 algorithm to the same set of input images. As depicted in Figure 14 below, the left image shows the traffic signs as detected by the original YOLOv5 model, while the right image demonstrates the result of our improved YOLOv5 algorithm. As can be clearly seen, the improved YOLOv5 algorithm not only addresses the issue of missed detection across all target traffic signs, but also significantly enhances detection performance. It manages to accurately identify and track even the smallest and most obscure traffic signs within the image dataset. The enhanced resolution and context-aware capabilities of this improved model enable it to excel in distinguishing traffic signs from a highly complex and dynamic background, thereby achieving a considerably higher detection accuracy compared to the original YOLOv5 model.
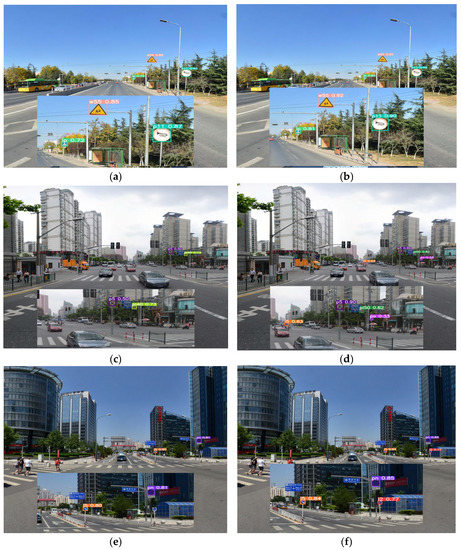
Figure 14.
Comparison of detection results. (a) The original algorithm; (b) The improved algorithm; (c) The original algorithm; (d) The improved algorithm; (e) The original algorithm; (f) The improved algorithm.
5. Conclusions
The detection of small-sized traffic signs is crucial for autonomous driving. In this study, a high-precision real-time detection algorithm for small-sized traffic signs based on the advanced single-stage algorithm YOLOv5 is proposed. We introduce a decoupled head into the YOLOv5 detection architecture to enhance detection accuracy and speed up network convergence. The original convolution in the network framework is replaced with an SPD-Convolution module to eliminate the impact of pooling operations on feature information and enhance the ability of the model to extract features from low-resolution small targets. By using extended convolutions with different convolution rates to obtain context information from different receptive fields, contextual information can be supplemented, and it plays an important complementary role in small object detection of traffic signs, effectively solving the problem of small targets and improving detection accuracy. The effectiveness of the above improvement modules was validated by conducting ablation experiments.
Compared with the original YOLOv5s algorithm, the proposed algorithm has shown improvements in metrics such as mAP, recall, and precision, yielding better detection performance. Nevertheless, amplifying the detection performance inevitably increases the model’s complexity and parameter count. Future research directions include using compression and pruning to make the model more lightweight while maintaining detection accuracy, making it easier to deploy on low-computing devices.
Author Contributions
Conceptualization, T.H. and L.S.; writing—original draft preparation, T.H. and L.S.; data curation, Q.D.; writing—review and editing, T.H., L.S. and Q.D.; project administration, T.H. All authors have read and agreed to the published version of the manuscript.
Funding
This research received no external funding.
Institutional Review Board Statement
Not applicable.
Informed Consent Statement
Not applicable.
Data Availability Statement
Not applicable.
Conflicts of Interest
The authors declare no conflict of interest.
References
- Deng, X. Research on Detection and Recognition of Road Traffic Signs in Natural Environments. Ph.D. Thesis, Nanjing University of Science and Technology, Nanjing, China, 2014. [Google Scholar]
- Mogelmose, A.; Trivedi, M.M.; Moeslund, T.B. Vision-Based Traffic Sign Detection and Analysis for Intelligent Driver Assistance Systems: Perspectives and Survey. IEEE Trans. Intell. Transp. Syst. 2012, 13, 1484–1497. [Google Scholar] [CrossRef]
- Girshick, R.; Donahue, J.; Darrell, T.; Malik, J. Rich Feature Hierarchies for Accurate Object Detection and Semantic Segmentation. In Proceedings of the IEEE Conference on Computer Vision and Pattern Recognition (CVPR), Columbus, OH, USA, 23–28 June 2014. [Google Scholar]
- Redmon, J.; Divvala, S.; Girshick, R.; Farhadi, A. You Only Look Once: Unified, Real-Time Object Detection. In Proceedings of the IEEE Conference on Computer Vision and Pattern Recognition (CVPR), Las Vegas, NV, USA, 27–30 June 2016. [Google Scholar]
- Tan, M.; Pang, R.; Le, Q.V. EfficientDet: Scalable and Efficient Object Detection. In Proceedings of the IEEE/CVF Conference on Computer Vision and Pattern Recognition (CVPR), Seattle, WA, USA, 13–19 June 2020. [Google Scholar]
- Liu, W.; Anguelov, D.; Erhan, D.; Szegedy, C.; Reed, S.; Fu, C.Y.; Berg, A.C. SSD: Single Shot MultiBox Detector. In Proceedings of the Computer Vision—ECCV 2016, Amsterdam, The Netherlands, 11–14 October 2016; Leibe, B., Matas, J., Sebe, N., Welling, M., Eds.; Springer International: Cham, Switzerland, 2016; pp. 21–37. [Google Scholar]
- Girshick, R. Fast R-CNN. In Proceedings of the IEEE International Conference on Computer Vision (ICCV), Santiago, Chile, 7–13 December 2015. [Google Scholar]
- Ren, S.; He, K.; Girshick, R.; Sun, J. Faster R-CNN: Towards Real-Time Object Detection with Region Proposal Networks. In Proceedings of the Advances in Neural Information Processing Systems, Montreal, QC, Canada, 7–12 December 2015; Cortes, C., Lawrence, N., Lee, D., Sugiyama, M., Garnett, R., Eds.; Curran Associates, Inc.: Red Hook, NY, USA, 2015; Volume 508. [Google Scholar]
- He, K.; Zhang, X.; Ren, S.; Sun, J. Spatial Pyramid Pooling in Deep Convolutional Networks for Visual Recognition. IEEE Trans. Pattern Anal. Mach. Intell. 2015, 37, 1904–1916. [Google Scholar] [CrossRef] [PubMed]
- Kong, T.; Yao, A.; Chen, Y.; Sun, F. HyperNet: Towards Accurate Region Proposal Generation and Joint Object Detection. In Proceedings of the IEEE Conference on Computer Vision and Pattern Recognition (CVPR), Las Vegas, NV, USA, 27–30 June 2016. [Google Scholar]
- Cheng, P.; Liu, W.; Zhang, Y.; Ma, H. LOCO: Local Context Based Faster R-CNN for Small Traffic Sign Detection. In Proceedings of the MultiMedia Modeling, Bangkok, Thailand, 5–7 February 2018; Schoeffmann, K., Chalidabhongse, T.H., Ngo, C.W., Aramvith, S., O’Connor, N.E., Ho, Y.S., Gabbouj, M., Elgammal, A., Eds.; Springer International: Cham, Switzerland, 2018; pp. 329–341. [Google Scholar]
- Tong, K.; Wu, Y.; Zhou, F. Recent advances in small object detection based on deep learning: A review. Image Vis. Comput. 2020, 97, 103910. [Google Scholar] [CrossRef]
- Yao, Y.; Han, L.; Du, C.; Xu, X.; Jiang, X. Traffic sign detection algorithm based on improved YOLOv4-Tiny. Signal Process. Image Commun. 2022, 107, 116783. [Google Scholar] [CrossRef]
- Zhu, Z.; Liang, D.; Zhang, S.; Huang, X.; Li, B.; Hu, S. Traffic-Sign Detection and Classification in the Wild. In Proceedings of the IEEE Conference on Computer Vision and Pattern Recognition (CVPR), Las Vegas, NV, USA, 27–30 June 2016. [Google Scholar]
- Houben, S.; Stallkamp, J.; Salmen, J.; Schlipsing, M.; Igel, C. Detection of traffic signs in real-world images: The German Traffic Sign Detection Benchmark. In Proceedings of the 2013 International Joint Conference on Neural Networks (IJCNN), Dallas, TX, USA, 4–9 August 2013; pp. 1–8. [Google Scholar] [CrossRef]
- Lai, H.; Chen, L.; Liu, W.; Yan, Z.; Ye, S. STC-YOLO: Small Object Detection Network for Traffic Signs in Complex Environments. Sensors 2023, 23, 5307. [Google Scholar] [CrossRef] [PubMed]
- Liu, J.; Zhang, W.; Tang, Y.; Tang, J.; Wu, G. Residual Feature Aggregation Network for Image Super-Resolution. In Proceedings of the 2020 IEEE/CVF Conference on Computer Vision and Pattern Recognition (CVPR), Seattle, WA, USA, 13–19 June 2020; pp. 2356–2365. [Google Scholar] [CrossRef]
- Kim, C.-I.; Park, J.; Park, Y.; Jung, W.; Lim, Y.-S. Deep Learning-Based Real-Time Traffic Sign Recognition System for Urban. Environ. Infrastruct. 2023, 8, 20. [Google Scholar] [CrossRef]
- Du, Y.; Zhao, Z.; Song, Y.; Zhao, Y.; Su, F.; Gong, T.; Meng, H. StrongSORT: Make DeepSORT Great Again. arXiv 2023, arXiv:2202.13514. [Google Scholar] [CrossRef]
- Chu, J.; Zhang, C.; Yan, M.; Zhang, H.; Ge, T. TRD-YOLO: A Real-Time, High-Performance Small Traffic Sign Detection Algorithm. Sensors 2023, 23, 3871. [Google Scholar] [CrossRef] [PubMed]
- Hu, J.; Wang, Z.; Chang, M.; Xie, L.; Xu, W.; Chen, N. PSG-YOLOv5: A Paradigm for Traffic Sign Detection and Recognition Algorithm Based on Deep Learning. Symmetry 2022, 14, 2262. [Google Scholar] [CrossRef]
- Li, H.; Li, J.; Wei, H.; Liu, Z.; Zhan, Z.; Ren, Q. Slim-neck by GSConv: A better design paradigm of detector architectures for autonomous vehicles. arXiv 2022, arXiv:2206.02424. [Google Scholar]
- Luo, H.; Yang, Y.; Tong, B.; Wu, F.; Fan, B. Traffic Sign Recognition Using a Multi-Task Convolutional Neural Network. IEEE Trans. Intell. Transp. Syst. 2018, 19, 1100–1111. [Google Scholar] [CrossRef]
- Cao, J.; Zhang, J.; Jin, X. A Traffic-Sign Detection Algorithm Based on Improved Sparse R-cnn. IEEE Access 2021, 9, 122774–122788. [Google Scholar] [CrossRef]
- Xiong, Q.; Zhang, X.; Wang, X.; Qiao, N.; Shen, J. Robust Iris-Localization Algorithm in Non-Cooperative Environments Based on the Improved YOLO v4 Model. Sensors 2022, 22, 9913. [Google Scholar] [CrossRef] [PubMed]
- Ge, Z.; Liu, S.; Wang, F.; Li, Z.; Sun, J. YOLOX: Exceeding YOLO Series in 2021. arXiv 2021, arXiv:2107.08430. [Google Scholar]
- Bochkovskiy, A.; Wang, C.Y.; Liao, H.Y.M. YOLOv4: Optimal Speed and Accuracy of Object Detection. arXiv 2020, arXiv:2004.10934. [Google Scholar]
- He, K.; Zhang, X.; Ren, S.; Sun, J. Spatial pyramid pooling in deep convolutional networks for visual recognition. In Proceedings of the European Conference on Computer Vision—ECCV 2014, Zurich, Switzerland, 6–12 September 2014; Springer: Cham, Switzerland, 2014; pp. 346–361. [Google Scholar] [CrossRef]
- Wang, C.-Y.; Liao, H.-Y.M.; Wu, Y.-H.; Chen, P.-Y.; Hsieh, J.-W.; Yeh, I.-H. CSPNet: A New Backbone that can Enhance Learning Capability of CNN. arXiv 2019, arXiv:1911.11929. [Google Scholar]
- Liu, S.; Qi, L.; Qin, H.; Shi, J.; Jia, J. Path Aggregation Network for Instance Segmentation. arXiv 2018, arXiv:1803.01534. [Google Scholar]
- Sunkara, R.; Luo, T. No More Strided Convolutions or Pooling: A New CNN Building Block for Low-Resolution Images and Small Objects. arXiv 2022, arXiv:2208.03641. [Google Scholar]
- Lin, T.Y.; Dollár, P.; Girshick, R.; He, K.; Hariharan, B.; Belongie, S. Feature pyramid networks for object detection. arXiv 2017, arXiv:1612.03144. [Google Scholar]
- Xiao, J.; Zhao, T.; Yao, Y.; Yu, Q.; Chen, Y. Context Augmentation and Feature Refinement Network for Tiny Object Detection. In Proceedings of the 10th International Conference on Learning Representations, Online, 25–29 April 2022. [Google Scholar]
Disclaimer/Publisher’s Note: The statements, opinions and data contained in all publications are solely those of the individual author(s) and contributor(s) and not of MDPI and/or the editor(s). MDPI and/or the editor(s) disclaim responsibility for any injury to people or property resulting from any ideas, methods, instructions or products referred to in the content. |
© 2023 by the authors. Licensee MDPI, Basel, Switzerland. This article is an open access article distributed under the terms and conditions of the Creative Commons Attribution (CC BY) license (https://creativecommons.org/licenses/by/4.0/).