Abstract
Inertial measurement units (IMU) are widely used in sports applications to digitise human motion by measuring acceleration and rotational velocity in three-dimensional space. A common machine learning problem is the classification of human motion primitives from IMU data. In order to investigate the classification methods used in the existing literature and to analyse whether and how the time-dependent data structure is considered in the classification process of motion data analysis in sports, a scoping review was conducted. Based on a keyword search, articles from 2010 to 2021 were extracted, and 93 articles were relevant for data extraction. Over- and undersampling of data and data augmentation techniques were rarely used. The classification methods applied can be divided into three main branches: classic machine learning and deep learning models, threshold-based approaches, and dynamic time warping. The most often applied algorithms were support vector machines (SVM), followed by neural networks and k-nearest neighbours. In comparative works, when more than one classifier was applied, random forests, neural networks, boosting models and SVM were found to be the methods that achieved the highest accuracy. If the time-dependent data structure was taken into account, it was incorporated either within the models, for example, by using long-short-term memory models or within the feature calculation step by using rolling windows with an overlap, which was the most common method of considering the time dependency of the IMU data.
1. Introduction
Human motion analysis is applied in various application areas such as athletic performance, medical diagnostics, surveillance, human–machine user interface, or video-conferencing, etc. [1]. Depending on the activity of interest, different sensor set-ups are used to capture and digitise human motion. Ref. [2] differentiate the systems into direct and indirect ones. Indirect systems are vision-based and are represented, for example, by video or optoelectronic techniques. A popular example of a direct system widely used in sports are inertial measurement units (IMU). They typically measure acceleration and angular velocity in three dimensions. The result of a measurement are multivariate time series.
In general, the analysis of human motion data can be split into five steps, which are described as activity recognition chain (ARC) [3]. Figure 1 visualises a typical ARC. As shown, the first step is the collection of the raw IMU sensor data. The second step consists of the pre-processing, such as filtering or removal of outliers. Step three is the segmentation phase, in which the raw time series is divided into segments, so-called motion or action primitives. These simple, atomic movements can be combined sequentially to form a complex behavior [4]. In the action hierarchy of [5], action primitives are the lowest unit in the hierarchy from which actions are formed. Step four of the ARC is the calculation of features for each segment, which could be time or frequency domain features, and step five is the classification phase. As for the classification step of the ARC, there are different methods that can be roughly divided into traditional and deep learning models according to [6]. There are already various reviews about the application of machine and deep learning techniques for human motion analysis. Ref. [7] have already analysed the application of machine learning algorithms in the field of sport-specific movement recognition in a systematic review for the period of January 2000 to May 2018. The authors analysed in-field automatic sport-specific movement detection and recognition with IMU and vision-based data. Ref. [8] published a survey on activity detection and classification based on wearable sensors, where they focused on the sensor specifications, such as sensor type, number of sensors used, sensor location, type of activities detected, processing type etc. Ref. [6] concentrated in their survey on the analysis of accelerometer data for human activity recognition. In addition, there exist various surveys for the analysis of deep learning and machine learning methods for general activity detection based on sensor data (see e.g., ref. [9] or [10]).
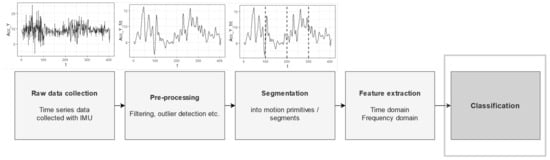
Figure 1.
Activity recognition chain (adapted from [3]).
In general, time series classification is a challenging task [11], and several classification algorithms have been developed for both univariate and multivariate data [11,12,13]. The methods used for time series classification consider the temporal structure differently. E.g., long short-term memory models (LSTM), which are a type of recurrent neural network, learn the order dependencies in sequential data [14]. In contrast, another common deep neural network architecture for time series classification, the multilayer perceptron (MLP), processes time series elements independently from each other [11].
The aim of this work is to identify the classification methods used for human motion analysis in sports in the form of a scoping review and to analyse whether and how the time series structure of the data is considered. Compared to [7], we focus exclusively on classification tasks and IMU data, do not only include machine or deep learning algorithms, and also include in-lab studies. We mainly discuss the fifth step of the ARC and investigate the methodological and statistical specifications of human motion data classification in sports across all disciplines. The accuracy of classification models depends on many different aspects, such as the classification task, the number of sensors, or the validation procedure, and it is difficult to compare the different disciplines. Although model performance is somewhat related to model quality, we would like to emphasize that it is not the goal of this work to analyse the performance of the models in detail. The focus of this work is to give an overview of which methods have already been used for the classification of human motion primitives in sports and whether and how the time dependencies of the IMU data have been taken into account in the classification processes.
To explore the existing methods used for classification of human motion in sports, a scoping review was conducted, as this review type aims to map key concepts and identify gaps in research [15]. In comparison to systematic reviews that focus on clearly defined research questions and also analyse the quality of the articles, scoping reviews generally answer broader research questions and are thus used to identify further in-depth analyses or reviews [16].
The analysis is mainly based on the description for scoping reviews of [17] which is based on the PRISMA extension for scoping reviews [18] and followed a review protocol for scoping reviews (PRISMA-ScR).
1.1. Data Bases, Key Words and Inclusion Criteria
Three databases that include journals as well as conference proceedings were searched: Scopus and Web of Science to cover interdisciplinary research, as well as IEEE Xplore that covers articles and conference proceedings from, among others, bioengineering, computing and processing or signal processing and analysis. The first database search was performed in July 2020, where journals and conference proceedings were extracted. To update the analysis, another search was performed in March 2022 to further include journal articles from August 2020 to December 2021.
We adapted the keyword string of [7] by focusing on general (individual) motion classification in sports, but did not concentrate on outcome predictions of matches and games.
The following keyword string was used for Web of Science and IEEE Xplore:
((sensor OR accelerometer OR gyroscope OR inertial measurement OR imu) AND (sport* OR prevention) AND (prediction OR classification OR recognition) AND (movement OR motion OR kinematic*) NOT review)
and the following keyword string was used for Scopus:
((sensor OR accelerometer OR gyroscope OR inertial measurement OR imu) AND (sport* OR prevention) AND (prediction OR classification OR recognition) AND (movement OR motion OR kinematic*) AND NOT review).
Articles in which the classification process was not clearly described and in which no active human movements were classified were not considered. In addition, articles that used image or video data were excluded. Further, articles that focused on the general classification of activities into major activities such as lying, sitting, or walking were excluded, as were articles that were not written in English. An overview of the inclusion and exclusion criteria is provided in Table 1. Because some of the papers met more than one exclusion criterion, the sum is greater than the total number of excluded papers.

Table 1.
Inclusion and exclusion criteria.
The scoping review mainly analysed the classification methods applied in the existing literature and examined the following research questions:
- Data: Which data sources were used? How large was the sample size? Were resampling techniques/data augmentation techniques applied?
- Preparation: Was dimension reduction applied? How was the data set split into training and validation data?
- Methods: Which methods were used? Do these methods take into account dependencies between the segments/single movements?
- Validation: Which metrics were used for performance evaluation?
1.2. Study Selection
Keyword searches of the three databases retrieved 779 articles covering the period from 2010 to July 2020 and an additional 266 articles with the search in 2022 to include journal articles from August 2020 to December 2021. After screening the titles and abstracts, 190 articles remained for detailed full-text analysis. Of these 190 articles, 93 were relevant for inclusion. For quality assurance, each full text was screened twice and data extraction were performed by two authors (once by C.K. and once by W.K., S.K., V.V., H.R., S.M., or S.B.) with an online survey tool (LimeSurvey; LimeSurvey GmbH, Hamburg, Germany) to extract the information systematically. Forty-three articles were excluded because the classification task was not included at all or was not one of the focuses of the article, 28 articles were not related to sports or addressed a different application area, 20 articles did not use IMU data, ten did not clearly describe the analysis, were posters, or were not found, and five were conference papers that were preliminary work for an included journal article that included the same methods or an extension of an existing work without any new classification method. Finally, two papers were excluded because the full text was not in English. Figure 2 provides an overview of the inclusion process.
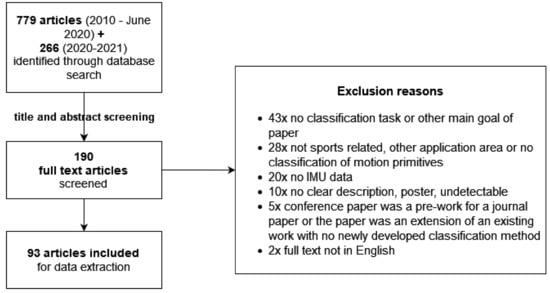
Figure 2.
Flow diagram of the review.
Table 2 lists all articles, including year, discipline, the dependent variable, the classes that are classified, and methods.
Table 2.
Overview of the articles included (incl. sports discipline, dependent variable, classes and method).
1.3. Data Items and Synthesis
For each included article we extracted and analysed information on the article type, publication year, discipline, data source, IMU type, position of the sensor, the classification method, the method how temporal dependency was considered, sample size, resampling techniques, data set split, dimension reduction, number of classified labels, the performance metrics, and the classification results. The extracted data were then aggregated to be displayed via tables and summarised based on a narrative synthesis. The included disciplines are further displayed with a Word Cloud, generated with the software R [112].
2. Results
Analysing the 93 articles that were included in the review showed that classification of IMU data was applied in a lot of different sports disciplines: individual sports, such as running, ski mountaineering or surfing, as well as teams sports, such as football, basketball or volleyball. Classification of motion can be found in both summer sports (e.g., surfing) and winter sports (e.g., cross-country skiing) disciplines. The disciplines that were analysed most frequently were tennis and workout training/exercises (seven contributions each), followed by basketball and soccer (six contribution each). Figure 3 shows the different sports disciplines ordered by their frequencies where similar terms were grouped (e.g., all fitness exercises and workouts were grouped together).
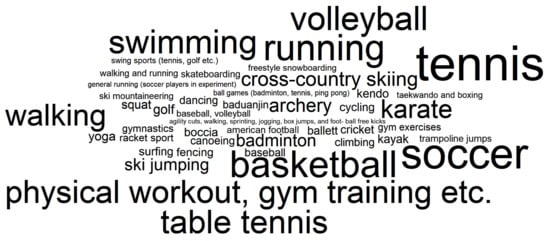
Figure 3.
Disciplines that were analysed in the included articles.
The dependent variable classified was either an activity related to sports, a motion primitive, such as the tennis stroke type or swimming style, or a quality related to the outcomes, such as good or bad movement quality. See Table 2 for the disciplines and the dependent variable for each of the included articles, split first into those articles that analysed a motion type, and second, those that analysed a quality-related outcome.
2.1. Data Sources and Sample
All articles analysed captured acceleration, and 71 also used gyroscopes (angular velocity) in data collection. Thirty-five papers used IMU that included magnetometers, although not all of them used this data. In addition to IMU sensors, some papers used other data sources, such as GPS [28,70,80] or barometric pressure sensors (e.g., [30,60,79,80]). Ref. [57] also included 3D pose data, ref. [28] combined acceleration data with GPS and heart rate data, and Ref. [109] combined and compared smartphone IMU data with data from the Microsoft Kinect.
In most papers (79), the IMU type was a wearable or specialised hardware, five analysed IMU data collected via smartwatches or activity trackers, and seven with smartphones or iPods. Further, Ref. [73] used insole sensors, and some papers did not specify the sensor type [36,42]. IMU sensors were either attached directly to the body or to clothing, e.g., belts, shoes, or gloves, or they were mounted on sports equipment (14). For some summer sports, particularly those involving rackets (tennis) or clubs (golf), and for some winter sports (skiing), IMU were often attached directly to the sports equipment (see Table A1 in the Appendix A for an overview of the type and position of IMU).
The number of subjects ranged from 1 [54,65,109,111] to 836 [75] subjects (mean = , median = 10, sd = ) from whom data were collected. However, not all authors described the number of subjects. Oversampling techniques to increase sample size were used by [40,46,53,65,71]. Ref. [63] prepared random additional negative samples to ensure a balanced training set, ref. [102] also ensured a balanced data set, and [70,75] down-sampled the majority class. In addition, the general challenge of unbalanced data sets was mentioned by some authors in the text (e.g., [25,67,78]). In the work of [96], the training data set (five stroke cycles) was much smaller than the test data set (more than 60 cycles). In the study by [80], the authors used data collected during another study. In addition, Ref. [25] used different data sets, one of which was based on simulated data. The effect of sample size on classification performance was investigated by [47], who tried different sample and window sizes, as well as different time intervals and sizes of training sets. Additionally, [107] analysed different combinations and numbers of sensors.
2.2. Preparation
Dimension reduction methods were applied in 34 works [19,21,23,25,29,34,35,37,39,47,51,54,58,65,67,68,69,70,72,73,76,77,78,82,87,94,95,98,99,100,102,103,105,106] and ranged from visual analysis to wrapper functions. In 12 works [21,34,39,51,67,68,77,82,87,94,102,105], principal component analysis (PCA) was used, seven applied correlation calculations to identify redundant features [21,23,29,58,65,72,103] and 25 [19,21,23,25,29,35,37,47,54,65,69,70,72,73,76,77,78,83,95,98,99,100,103,105,106] works applied another dimension reduction method. Some authors tried more than one dimension reduction method, such as [102] who used 18 different feature selection techniques. Ref. [56] evaluated each feature separately and then performed a validation using the feature fusion of all feature sets. Ref. [34] tried two different versions of data sets, one with PCA (five features), one without. Furthermore, refs. [42,94] tried different versions and numbers of input features and compared the performance of the classifiers.
Table 3 gives a detailed overview of the papers where feature reduction was described and the details of both the full and the reduced feature set were given. The table states the number of features of the full data set and the number of features of the reduced data set.
Table 3.
Details of the full and reduced feature set.
2.3. Classification
2.3.1. Data Set Split
To validate the trained classification models, the sample was split into several sets. In 33 papers, the sample was split on a subject-wise basis, so that the algorithm was trained with different subjects than those included in the validation data set. Further, in six works, the classifiers were trained with some samples of a person and tested with the remaining samples of that person, and in 65 works, the data set split into training, testing, and validation was either random or not clear. In ten papers, different versions of data set splits were tried. Table 4 shows the type of data set split in each article. Further, to analyse the details of the data set split, Table A4 in the Appendix A gives the details on the split into training, validation, and test data set for each paper. As seen in Table A4, the split varies from simple splits into training and test data sets, to cross-validation approaches and leave-one-subject-out cross-validation procedures.
Table 4.
Type of data set split into training, validation and test data set.
2.3.2. Classification Methods
The classification methods can be generally divided into three main branches: first, classic machine learning methods, such as decision trees, k-nearest neighbours (KNN), or naive Bayes (NB) classifiers, which were applied in 78 papers. Second, seven works developed threshold or correlation-based algorithms to classify the motion data into predefined groups. Third, dynamic time warping (DTW) clustering approaches were used in seven works. Table A2 in the Appendix A shows a detailed overview of the methods used in each article. In addition to these three main approaches, the authors’ own developed methods were applied in seven works. Refs. [73,86,87] applied cluster-based approaches. Some authors used hybrid or two-stage approaches. Ref. [32] classified, in their skateboard classification, first grid or air and then the final trick in the second stage. Ref. [86] applied a back-propagation artificial neural network in the first stage, and in the second, fuzzy C-means. Ref. [69] combined a rule to first spot a motion gesture of interest (first stage) with a decision tree for activity classification (second stage). Ref. [82] classified one of four styles in the first stage and continued with a more detailed classification in the second stage. The number of classes varied from binary classification [29,39,41,43,51,53,58,59,63,70,74,81,88,98,100,103,107,109] to 28 labels in [35]. Ref. [53] applied binary classification to identify dives or no-dives of goalkeepers as well as multi-class classification to identify motion classes. Ref. [21] also tested an ensemble approach where they combined random forests, a support vector machine (SVM) and KNN with a voting approach. The authors also included personal characteristics in their classification models. Ref. [110] calculated two separated models for forehand and backhand strokes and Ref. [67] proposed a two-layer recognition framework.
A detailed analysis of the classification methods (see Table 5 and Figure 4) revealed that SVM was the method most frequently used in 42 articles, followed by any type of neural networks (39) and KNN (23). Out of the 39 papers that used any type of neural network (NN), 10 applied an LSTM. Sixteen works used a random forest, 19 a decision tree, and eight models were based on boosting algorithms. Seventeen applied NB classifiers, 11 logistic regression, seven DTW, and six linear discriminant analysis. Nearly half (42; 45%) of the works only used one classification method; the others compared more than one where the total range goes from one to eight different classifiers.
Table 5.
Classification methods applied in the included articles.
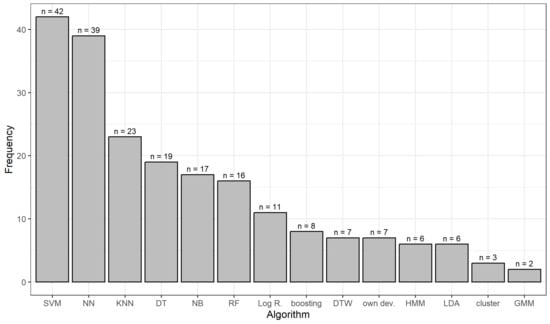
Figure 4.
The number of applied methods in the literature. (SVM: support vector machine; NN: neural network; KNN: k-nearest neighbours; DT: decision tree; NB: naive Bayes; RF: random forest; log. reg.: logistic regression; boosting: models based on boosting algorithms; DTW: dynamic time warping; own dev: own developed method; HMM: hidden Markov model; LDA: linear discriminant analysis; GMM: Gaussian mixture models).
Moreover, Figure 5 shows the number of applied algorithms per sports discipline. Interestingly, in some disciplines such as ski jumping, cross-country skiing, ballet/dancing, or archery, very few different algorithms are used. For the categories fitness, yoga, bodyweight, exercises, and badminton, baseball, cricket, golf, tennis, table tennis, on the other hand, almost the entire arsenal of machine learning algorithms is used in the literature.
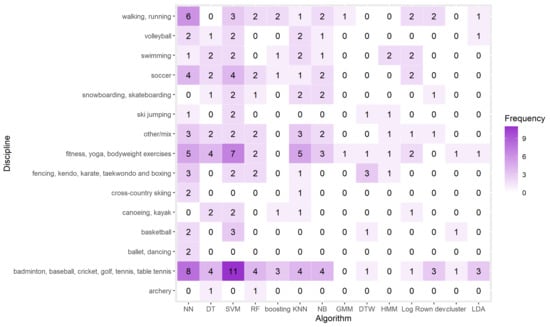
Figure 5.
The number of applied methods per discipline. (SVM: support vector machine; NN: neural network; KNN: k-nearest neighbours; DT: decision tree; NB: naive Bayes; RF: random forest; log. reg.: logistic regression; boosting: models based on boosting algorithms; DTW: dynamic time warping; own dev: own developed method; HMM: hidden Markov model; LDA: linear discriminant analysis; GMM: Gaussian mixture models).
2.3.3. Dependency Structure
The temporal information of the IMU data was included in different ways in the articles analysed. Table A3 in the Appendix A shows a detailed overview of the methods applied in each article. On the one hand, six papers applied hidden Markov models (HMM) and ten papers used LSTM or convolutional neural networks (CNN)-LSTM, which can handle temporal data. Further, ten works used DTW or a longest common subsequence algorithm, 12 used CNN, and one applied sequence mapping [27]. On the other hand, 23 articles used rolling windows with an overlap in the feature calculation process, and thus incorporated the time-dependent data structure in a more indirect way by these overlapping windows. Ref. [66] tried different windows and window overlapping sizes and in addition, the effect of subsets of the five IMUs. In 42 works, other classification methods were applied, no details were provided, or time dependence was not incorporated.
Table 6 and Figure 6 give an overview of the different ways dependency was handled in the papers. Since some papers computed the features using rolling windows with an overlap and applied classification methods that take into account temporal information, the sum is greater than 93.
Table 6.
Methods of how temporal information was considered.
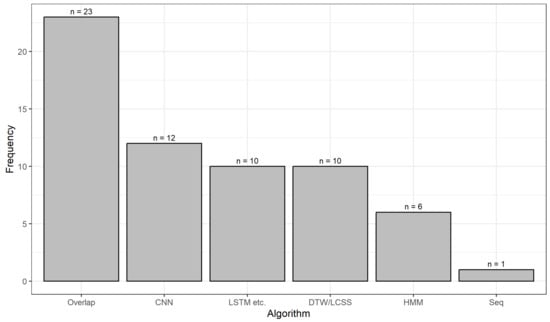
Figure 6.
The number of applied methods to consider temporal information. (overlap: overlap in the feature calculation; CNN: convolutional neural network; LSTM: long-short term memory network; DTW: dynamic time warping; LCSS: longest common subsequence; HMM: hidden Markov model; seq: sequence mapping).
2.4. Validation
The classifiers were validated using different methods. Table A4 in the Appendix A and Figure 7 give a detailed overview of the validation methods applied in each article. Accuracy was the most often used performance metric (78), followed by the confusion matrix (60). In total, 37 papers reported recall, 32 precision, 22 F1 score, 10 specificity, and 7 receiver operating characteristic (ROC) curves or area under the curve (AUC). In addition, six papers also considered computation time and cost. One reported Cohen’s Kappa and one paper reported Matthews correlation coefficient.
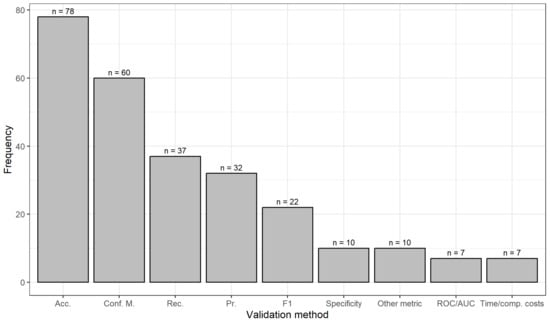
Figure 7.
The number of validation methods in the literature. (Acc: Accuracy; Conf. M.: Confusion Matrix; Rec.: Recall; Pr.: Precision; F1: F1 Score; ROC: Receiver Operating Characteristic; AUC: Area Under the Curve; Comp: Computational).
2.5. Classification Performance
The classification accuracies ranged up to 100% [35,88,105] in the analysed work. Due to the different classification tasks for the distinct disciplines, the different experimental set-ups (including different numbers of subjects and trials, different numbers and positions of sensors etc.), and the different validation procedures (e.g., cross-validation, leave-one-subject-out validation etc.), a direct comparison between the different works was not carried out.
However, to emphasize a better understanding of the performance of machine learning algorithms, we compared the results of the studies where multiple machine learning approaches were compared with each other. This analysis showed that the best model differs between the works and also within the works, depending on, e.g., different validation procedures or different training data sets. In [100], the best model varied between the different types of features. While NB performed best when all features were used, KNN performed best in a leave-one-subject-out feature selection. In [102], the best performing model depended on the number of classes to classify. Ref. [56] found differences between person dependent and person independent classification tasks. While DTW performed better in the person-dependent case, SVM performed better in the person-independent case [56]. Ref. [58] compared random forests, linear SVM, polynomial SVM, NN and a gradient boosting algorithm and found that no model was better than the others. Ref. [66] compared different classifiers with different window sizes and found that the SVM with a cubic kernel with 600 ms windows and a 10% overlap performed best. In 15 out of the 36 times (41.7%) where SVMs were used in comparative works, SVMs achieved the highest accuracy. Random forest achieved the highest accuracy values in 8 out of 14 (57.1%) works, neural networks in 10 out of 20 (50.0%), and boosting approaches in 4 out of 8 (50.0%) works where more than one classifier was compared. Table A2 in the Appendix A marks the best performing method with the highest classification accuracy for each work that applied more than one classifier.
3. Discussion
The aim of this scoping review was to to present an overview of the methods used in the literature to classify human motion data based on IMU data, to analyse whether and how the time-dependent data structure of IMU sensors is taken into account in the classification step of the ARC, and further to identify research areas that need further detailed investigation, e.g., in the form of a systematic review. Due to the variety of disciplines and classification tasks, an aggregation of the results was not possible. However, in conducting the scoping review, data extraction also proved to be difficult because of the different disciplines involved and sometimes because of inconsistencies in reporting the data analysis process. For example, sample size is reported in a variety of ways, sometimes as total sample (e.g., steps), per subject, or number of trials (e.g., runs). Furthermore, the included features are not always clearly described and the number of features used is not always comprehensible. The different division of the data into training, test, and validation sets is also not always clearly stated which might be due to page limits. However, for direct comparisons and the identification of the best performing classifiers for certain research questions, this information would be needed.
The analysis revealed that classification methods have been applied to a variety of disciplines, where tennis, soccer, and basketball were the three most often analysed sports. Human motion data was mainly classified via deep learning, classic machine learning, DTW, or threshold-based approaches. For each of these methods, different pros and cons can be identified and the approaches differ in their algorithmic complexity, model accuracies, and degree of interpretability. While deep learning approaches show a high level of accuracy, they are less easy to interpret than rule-based learners, linear or logistic regression, and decision trees that show high interpretability but less model accuracy [113]. The SVM, the most often applied approach in the analysed works, was the classification method in of the papers, and shows a high generalisation capability but has weaknesses with regard to algorithmic complexity and the training time in large data sets, the challenge of correct classification in imbalanced data sets, and the development of classifiers for multi-class problems [114]. DTW, which has been successfully applied in various works in the area of biosignal processing, takes nonlinearities into account [115]. On the other hand, DTW is time consuming due to the calculation of the similarity distance for each pair of sequences [116]. LSTM and HMM are also popular tools for sequential and time series data [14,117].
In general, time-dependence of the IMU data was, if it was considered, incorporated in different ways: either directly within the methods applied, such as LSTM, or in the feature calculation step by incorporating time-dependency explicitly using rolling windows with an overlap.
Due to the difference in data collection, experimental set-up, and classification tasks, it is difficult to compare the classification performances across the works. In general, the analysis revealed that there is no single best-performing method, as analysing the classification methods compared within works revealed the best classifiers varied between the works and also depended on the training data sets/different number of features or validation procedures. Overall, deep learning models, random forests, boosting approaches and, SVMs mostly showed higher classification accuracy than decision trees, KNN, and NB in direct comparison. However, more complex models, such as LSTM, do not always achieve higher classification accuracy, as [48] found that the one-dimensional CNN performed best, compared to the SVM, multilayer perceptron, LSTM, and other deep convolutional neural networks. In this context, it also has to been mentioned that nearly half of the works, , only described one classification method and thus lacked a comparison of different classification methods and approaches. Identifying the best working method is therefore not possible in these cases. Future work should concentrate on comparative works and, e.g., compare machine learning approaches with the researchers’ own developed threshold-classification approaches, or methods where the time series structure of the IMU data is considered with methods where it is not considered.
In most of the works, the data was either split random/record-wise into training, validation, or test data, or the split was not clear. However, the use of a record-wise split has been criticised, especially for clinical outcome predictions [118]. Thirty-three papers validated the models via a subject-wise split and some even tried different split, and thus validation, versions to analyse whether the models perform well and are generalisable to new subjects. Further, in around of the papers, feature reduction techniques were applied, although the number of reduced features was not always stated.
When analysing the four most frequently analysed sports disciplines that were analysed in more than five papers (tennis, soccer, and basketball), it can be shown that in soccer, 4/6 () of the papers applied a neural network approach [21,44,53,75] or an SVM [21,53,75,92]. While in basketball, of the works applied an SVM [19,60,94], no clear pattern can be identified for the classification methods when classifying tennis activities. Furthermore, when it comes to analysing the methods for incorporating time-dependence in the three sports disciplines, no sport-specific trend can be found. Future work could thus systematically compare and analyse classification methods in one specific sports discipline to investigate which of the different classification approaches performs best in certain circumstances in the form of a systematic review. These systematic reviews could also include quality assessments of the included works to analyse whether the lack of clarity is correlated with the journal citation index.
A further question could be to investigate the trade-off between model complexity, real-time processing requirements, and model accuracy. The generalisability of the developed models to different populations (in the sports domain, e.g., amateur, recreational, or professional athletes) could be investigated in future research and transfer learning approaches could be tested. Future research could also systematically analyse the effect of feature selection/dimension reduction for specific sports disciplines.
In addition, few articles mentioned the challenge of balance/imbalanced data sets and over- and undersampling of data, and data augmentation techniques were rarely used. Therefore, analysing the impact of unbalanced data sets and applying different resampling or data augmentation methods, such as the synthetic minority oversampling technique [119] or adaptive synthetic [120] etc., could be an interesting research question for future work. Hybrid, stacking, and ensemble methods were also rarely used and could be explored in future work. One of the papers included in this review used additional simulated data. The use and application of different data augmentation techniques for time series classification (see, e.g., [121]) to simulate human motion data could also be a future research question.
Future work should investigate the relationship between the choice of discipline and how it affects data requirements and algorithm performance. It is plausible to assume that the dynamics of a sport’s movement patterns raise the required signal quality in terms of sample rate and resolution. Likewise, it is unknown how the volume (i.e., the number of recorded motion primitives) of the collected sensor data affects classification performance. In summary, we suggest that future work investigates the interdependence between (expected) movement dynamics, sensor configuration, and algorithm design. This would help to build a systematic body of knowledge for sensor selection in sports science research (see [122]). Future work could also analyse how correct or incorrect segmentation of data into human motion primitives affects the ARC, in particular the classification step.
4. Conclusions
The main goal of this review was to investigate the methods used for classifying human motion primitives based on IMU data and to analyse whether and how the time series structure of the IMU data is taken into account in the classification process. The full text analysis showed that different approaches are used for classification, from machine learning and deep learning methods to self-developed threshold-based approaches and DTW. Direct comparisons of models to identify best-performing approaches proved to be difficult due to the different experimental set-ups and often vague descriptions of the classification processes, such as feature generation or data set split. The most often applied algorithms were SVM, followed by neural networks and KNN. When more than one classifier was compared in the works, random forests, neural networks, boosting models, and SVM achieved the highest accuracy values. Thus, we find that SVM and neural networks are both among the most commonly used methods and among the best-performing methods when multiple methods were compared.
The time-dependent data structure, when taken into account, was incorporated in different ways: either within the methods themselves, such as using LSTM models or DTW approaches, or within the feature calculation step by using rolling windows with an overlap, which was the method most often used to consider time dependencies.
The choice of classifier for future applications depends mainly on the task and discipline. The requirements and application goals (e.g., real-time requirements, computation time) may also play a role in selecting the appropriate classifier for future human motion classification projects.
Author Contributions
Conceptualisation, C.K.; Data curation, C.K., S.B., W.K., V.V., H.R., S.M. and S.K.; Formal analysis, C.K., S.B., W.K., V.V., H.R., S.M. and S.K.; Funding acquisition, C.K. and V.V.; Methodology, C.K.; Project administration, C.K. and V.V.; Visualisation, C.K.; Writing—original draft, C.K.; Writing—review and editing, C.K., S.B., W.K., V.V., H.R., S.M. and S.K. All authors have read and agreed to the published version of the manuscript.
Funding
This research received financial support by the Austrian Federal Ministry for Climate Action, Environment, Energy, Mobility, Innovation and Technology and Land Salzburg under Contract No. 2021-0.641.557.
Institutional Review Board Statement
Not applicable.
Informed Consent Statement
Not applicable.
Data Availability Statement
No new data were created or analyzed in this study. Data sharing is not applicable to this article.
Conflicts of Interest
The authors declare no conflict of interest. The funders had no role in the design of the study; in the collection, analyses, or interpretation of data; in the writing of the manuscript, or in the decision to publish the results.
Appendix A. Detailed Results
Table A1 shows the details on the IMU used in each article. Table A2 gives an overview of the classification methods applied in each article, Table A3 shows the methods of handling the dependency structure of the IMU data in the articles, and Table A4 gives an overview of the performance metrics used.
Table A1.
Data sources, types of IMU, and position of IMU in the included articles.
Table A1.
Data sources, types of IMU, and position of IMU in the included articles.
| Data Sources/Type/Position of IMU | Articles | Total Articles |
|---|---|---|
| Accelerometer | all 93 articles | 93 |
| Gyroscopes | [19,22,23,24,27,30,32,33,34,35,36,37,38,39,40,41,42,44,45,46,47,49,50,52,53,54,55,56,57,58,60,64,66,68,69,70,71,72,73,74,75,76,78,79,80,82,83,85,86,87,88,90,91,92,93,94,95,96,97,98,99,100,101,102,104,105,106,107,108,109,110] | 71 |
| Magnetometer | [27,32,33,34,35,36,38,39,41,45,52,53,55,56,58,60,64,66,68,69,70,72,74,77,78,79,83,90,94,96,97,98,104,105] | 34 |
| Specialised hardware/wearable | [19,20,22,24,25,27,29,30,31,32,33,34,35,37,38,39,40,41,43,44,45,46,47,49,50,51,52,53,54,55,56,57,58,59,60,61,63,64,65,66,67,68,69,70,71,72,74,75,76,78,79,80,81,82,83,84,85,86,87,88,89,91,92,93,94,95,96,97,98,99,100,101,102,104,105,106,107,108,111] | 79 |
| Smartwatch/activity trackers | [23,48,62,80,90] | 5 |
| Smartphones/iPods | [21,28,62,77,103,109,110] | 7 |
| Body/clothes (incl. shoes) | [19,20,21,22,23,25,27,28,29,31,34,35,36,37,38,39,40,41,42,43,44,45,46,47,48,49,50,51,52,53,54,56,57,58,59,60,61,62,64,65,66,67,68,69,70,71,72,73,74,75,76,79,80,81,82,83,84,86,87,88,89,90,91,92,94,95,96,97,98,99,101,102,103,104,105,106,107,108,109,110,111] | 81 |
| Sports equipment | [24,26,27,30,32,33,55,63,78,79,80,85,93,100] | 14 |
Table A2.
Classification methods used. The method with the highest accuracy is indicated by a box; the method in the dashed box is almost as good as the best classifier.
Table A2.
Classification methods used. The method with the highest accuracy is indicated by a box; the method in the dashed box is almost as good as the best classifier.
| Ref. | NN | DT | SVM | RF | Boosting | KNN | NB | GMM | DTW | HMM | Log R. | Own Dev. | Cluster | LDA | Other/Details (incl. NN) |
|---|---|---|---|---|---|---|---|---|---|---|---|---|---|---|---|
| Classification of a motion primitive | |||||||||||||||
| [19] | x | ||||||||||||||
| [20] | x | x | x | radial basis function network | |||||||||||
| [21] | x | x | x | x | x | x | x | multilayer perceptron, | |||||||
| [22] | x | ||||||||||||||
| [23] | x | , | |||||||||||||
| [24] | x | ||||||||||||||
| [25] | x | ||||||||||||||
| [26] | x | ||||||||||||||
| [27] | x | longest common subsequence | |||||||||||||
| [28] | x | two-layer neural network | |||||||||||||
| [29] | x | x | learning vector quantisation | ||||||||||||
| [30] | x | ||||||||||||||
| [31] | x | ||||||||||||||
| [32] | x | x | x | ||||||||||||
| [33] | x | x | |||||||||||||
| [34] | x | ||||||||||||||
| [35] | x | ||||||||||||||
| [36] | x | x | x | x | |||||||||||
| [37] | motion template, DTW distance measure | ||||||||||||||
| [38] | x | CNN | |||||||||||||
| [39] | x | ||||||||||||||
| [40] | x | LSTM | |||||||||||||
| [41] | x | CNN | |||||||||||||
| [42] | x | ||||||||||||||
| [43] | x | Bayesian network classifier | |||||||||||||
| [44] | x | neural network binary classifiers, sequence mapping | |||||||||||||
| [45] | x | ||||||||||||||
| [46] | linear regression | ||||||||||||||
| [47] | x | x | x | ||||||||||||
| [48] | x | , LSTM, multilayer perceptron, and 2D CNNs | |||||||||||||
| [49] | x | ||||||||||||||
| [50] | x | ||||||||||||||
| [51] | x | x | |||||||||||||
| [52] | x | x | x | x | x | , Radial basis function neural network | |||||||||
| [53] | x | x | quadratic discriminant analysis | ||||||||||||
| [54] | x | NN | |||||||||||||
| [55] | x | CNN | |||||||||||||
| [56] | x | ||||||||||||||
| [57] | x | LSTM | |||||||||||||
| [58] | x | x | x | SVMs performed best when models were trained with all three phases | |||||||||||
| [59] | x | ||||||||||||||
| [60] | x | ||||||||||||||
| [61] | x | LSTM | |||||||||||||
| [62] | x | KNN with DTW | |||||||||||||
| [63] | x | ||||||||||||||
| [64] | x | feedforward neural network | |||||||||||||
| [65] | x | NN | |||||||||||||
| [66] | x | ||||||||||||||
| [67] | x | x | x | x | x | combining SVM, NN, HMM, LVQ | |||||||||
| [68] | x | x | bagging | ||||||||||||
| [69] | two-stage approach: first, rule, second bootstrap aggregated decision tree | ||||||||||||||
| [70] | x | ||||||||||||||
| [71] | x | NN | |||||||||||||
| [72] | x | x | x | x | x | the method with highest accuracy depended on the number of features used | |||||||||
| [73] | x | ||||||||||||||
| [74] | x | x | x | x | ; SVM with DTW kernel | ||||||||||
| [75] | x | LSTM, | |||||||||||||
| [76] | x | x | x | ||||||||||||
| [77] | x | ||||||||||||||
| [78] | x | , 2D-CNN | |||||||||||||
| [79] | x | x | x | NN | |||||||||||
| [80] | decision-function-based | ||||||||||||||
| [81] | x | ||||||||||||||
| [82] | x | x | x | x | x |  | hybrid NN/HMM model | ||||||||
| [83] | x | ||||||||||||||
| [84] | x | ||||||||||||||
| [85] | x | ||||||||||||||
| [86] | x | x | first: back-propagation artificial neural network; second: fuzzy C-means | ||||||||||||
| [87] | x | x | x | x | |||||||||||
| [88] |  | ||||||||||||||
| [89] | x | ||||||||||||||
| [90] | x | x | x | x | x | x | CNN | ||||||||
| [91] | x | LSTM | |||||||||||||
| [92] | x | x | |||||||||||||
| [93] | x | x | x | x | |||||||||||
| [94] | x | back-propagation neural network | |||||||||||||
| [95] | x | x | x | ||||||||||||
| [96] | x | ||||||||||||||
| Classification of a quality related outcome | |||||||||||||||
| [97] | x | x | |||||||||||||
| [98] | x | ||||||||||||||
| [99] | x | x | x | x | |||||||||||
| [100] | x | x | x | ||||||||||||
| [101] | x | DCNN | |||||||||||||
| [102] | x | ||||||||||||||
| [103] | x | ||||||||||||||
| [104] | x | , multilayer perceptron | |||||||||||||
| [105] | x | x | x | ||||||||||||
| [106] | adaptive fuzzy logic based classification module | ||||||||||||||
| [107] | x | x | radial basis function network | ||||||||||||
| [108] | x | x | SVM for throw quality, threshold based for throw identification | ||||||||||||
| [109] | x | LSTM | |||||||||||||
| [110] | x | ||||||||||||||
| [111] | x | ||||||||||||||
NN: any type of neural network; DT: decision tree, SVM: support vector machine; RF: random forest; boosting: models that are based on boosting algorithms; KNN: k-nearest neighbours;
NB: naive Bayes; GMM: Gaussian mixture models; DTW: dynamic time warping; HMM: hidden Markov model; Log R.: logistic regression; own dev.: own developed method; LDA:
linear discriminant analysis; CNN: convolutional neural network.
Table A3.
Detailed methods of how temporal information was considered.
Table A3.
Detailed methods of how temporal information was considered.
| Ref. | HMM | LSTM etc. | CNN | Seq | DTW/LCSS | Overlap | Other |
|---|---|---|---|---|---|---|---|
| Classification of a motion primitive | |||||||
| [19] | x | ||||||
| [20] | x | ||||||
| [21] | x | ||||||
| [22] | x | ||||||
| [23] | x | x | |||||
| [24] | x | ||||||
| [25] | x | ||||||
| [26] | x | ||||||
| [27] | x | ||||||
| [28] | x | ||||||
| [29] | x | ||||||
| [30] | x | ||||||
| [31] | x | ||||||
| [32] | x | ||||||
| [33] | x | ||||||
| [34] | x | ||||||
| [35] | x | ||||||
| [36] | x | ||||||
| [37] | x | ||||||
| [38] | x | ||||||
| [39] | x | x | |||||
| [40] | x | ||||||
| [41] | x | ||||||
| [42] | x | ||||||
| [43] | x | ||||||
| [44] | x | ||||||
| [45] | x | ||||||
| [46] | x | ||||||
| [47] | x | ||||||
| [48] | x | x | x | ||||
| [49] | x | ||||||
| [50] | x | ||||||
| [51] | x | ||||||
| [52] | x | ||||||
| [53] | x | ||||||
| [54] | x | ||||||
| [55] | x | x | |||||
| [56] | x | x | |||||
| [57] | x | ||||||
| [58] | x | ||||||
| [59] | x | ||||||
| [60] | x | ||||||
| [61] | x | ||||||
| [62] | x | ||||||
| [63] | x | ||||||
| [64] | x | ||||||
| [65] | x | ||||||
| [66] | x | ||||||
| [67] | x | x | |||||
| [68] | x | ||||||
| [69] | x | ||||||
| [70] | x | ||||||
| [71] | x | ||||||
| [72] | x | ||||||
| [73] | x | ||||||
| [74] | x | ||||||
| [75] | x | x | x | ||||
| [76] | x | ||||||
| [77] | x | ||||||
| [78] | x | x | |||||
| [79] | x | ||||||
| [80] | x | ||||||
| [81] | x | ||||||
| [82] | x | ||||||
| [83] | x | ||||||
| [84] | x | ||||||
| [85] | x | ||||||
| [86] | x | ||||||
| [87] | x | ||||||
| [88] | x | ||||||
| [89] | x | ||||||
| [90] | x | ||||||
| [91] | x | ||||||
| [92] | x | ||||||
| [93] | x | ||||||
| [94] | x | ||||||
| [95] | x | ||||||
| [96] | x | ||||||
| Classification of a quality-related outcome | |||||||
| [97] | x | x | |||||
| [98] | x | ||||||
| [99] | x | ||||||
| [100] | x | ||||||
| [101] | x | ||||||
| [102] | x | ||||||
| [103] | x | ||||||
| [104] | x | ||||||
| [105] | x | ||||||
| [106] | x | ||||||
| [107] | x | ||||||
| [108] | x | ||||||
| [109] | x | ||||||
| [110] | x | ||||||
| [111] | x | ||||||
HMM: hidden Markov model; LSTM etc.: long short-term memory model/recurrent neural network/CNN-LSTM;
CNN: convolutional neural network; Seq: sequence mapping; DTW: dynamic time warping; LCSS: longest
common subsequence; overlap: overlap in the feature calculation; other: other classification method/no details.
Table A4.
Performance metrics used in the included articles and details on data set split.
Table A4.
Performance metrics used in the included articles and details on data set split.
| Ref | Conf. M. | Acc. | F1 | Pr. | Rec. | Specificity | ROC/AUC | Time/Comp. Costs | Other | Data Set Split |
|---|---|---|---|---|---|---|---|---|---|---|
| Classification of a motion primitive | ||||||||||
| [66] | x | x | x | x | 5-fold CV on training data set + leave-one-subject-out | |||||
| [64] | x | x | x | 70% training, 30% test | ||||||
| [57] | x | x | x | x | trial-based 5-fold CV | |||||
| [19] | x | x | x | x | x | |||||
| [20] | x | x | x | x | x | 10-fold CV leave-one-out | ||||
| [21] | x | x | ||||||||
| [22] | x | x | 80% training, 20% test (repeated 100 times) | |||||||
| [23] | x | x | x | x | Tennis: training set of approx. 4500 shots by 15 players; testing set of approx. 5000 shots by 16 players. Badminton: training set of approx. 3500 shots by 20 players; testing set of approx. 2000 shots by 14 players. Squash: training set of approx. 500 shots by 3 players; testing set of approx. 100 shots by 2 players | |||||
| [24] | x | x | 80% training, 20% test | |||||||
| [25] | x | x | x | mean absolute temporal difference, percentage of gait cycles missed | leave-one-out (LOO) CV | |||||
| [26] | x | 1 player left out (10 in total) | ||||||||
| [27] | x | x | x | x | leave-one-out (LOO) CV | |||||
| [28] | x | x | x | negative predictive value | split in training and tests | |||||
| [29] | x | x | x | x | 80% training, 20% testing + 10-fold CV on each training set; leave-one-subject-out CV | |||||
| [30] | x | x | x | |||||||
| [31] | x | |||||||||
| [32] | x | x | x | x | leave-one-subject-out CV | |||||
| [33] | x | x | x | x | leave-one-subject-out CV | |||||
| [34] | x | x | leave one-out | |||||||
| [35] | x | leave one-out | ||||||||
| [36] | x | x | x | x | unweighted average recall | leave-one-subject-out CV | ||||
| [37] | x | x | 50% training, 50% test | |||||||
| [38] | x | x | leave-one-out CV | |||||||
| [39] | x | x | x | x | x | 70% training, 30% recognition stage: CV | ||||
| [40] | x | 70% training, 15% validation, 15% test data | ||||||||
| [41] | x | x | 5-fold CV (50 training interactions) | |||||||
| [42] | x | x | x | x | x | x | 3-fold CV | |||
| [43] | x | |||||||||
| [44] | x | x | CV | |||||||
| [45] | x | x | leave-one-out | |||||||
| [46] | x | x | training 10 subjects (leave-subject CV), test 2 subjects | |||||||
| [47] | x | x | 10 subjects for training (leave-subject CV), one for testing | |||||||
| [48] | x | x | 60% training, 20% validation, and 20% test | |||||||
| [49] | x | x | ||||||||
| [50] | x | x | x | x | x | train/validation random splitting was made with 10:1 proportion for each class | ||||
| [51] | x | x | x | x | 10-fold CV | |||||
| [52] | x | x | x | 10-fold CV | ||||||
| [53] | x | x | x | x | x | error rate | 10-fold stratified CV + leave-one-out CV | |||
| [54] | x | x | 70% training, 15% validation, 15% test | |||||||
| [55] | x | x | 60% training (repeated several times), 40% test | |||||||
| [56] | x | x | person-dependent: 80% training, 20% test; person-independent: 10-fold leave-one-out cross-validation | |||||||
| [58] | x | x | x | x | x | x | 10-fold CV | |||
| [59] | ||||||||||
| [60] | x | x | cross-person: leave-one-subject-out; same-person: split in training and test | |||||||
| [61] | x | x | 400 training, 100 test | |||||||
| [62] | x | x | x | x | training: 5-fold CV; test with other samples from different respondents | |||||
| [63] | x | x | x | x | leave-one-subject-out CV | |||||
| [65] | x | x | ||||||||
| [67] | x | x | x | x | 10-fold CV | |||||
| [68] | x | x | x | Macro-PPV, false discovery rate | 5 CV | |||||
| [69] | x | x | 40% training; CV with 60% of the data points in test set | |||||||
| [70] | x | x | x | x | 5-fold CV (10 times repeated) | |||||
| [71] | x | x | split into training, validation and test | |||||||
| [72] | x | |||||||||
| [73] | x | x | player 1: training data; player 2: test data | |||||||
| [74] | x | x | x | x | Matthews correlation coefficient | 10-fold CV (70% training) + hold-out validation method (training set of 70% and test set of 30%), | ||||
| [75] | x | x | weighted F1 score; normalised adapative confusion matrix | training: 697 players, test: 139 players | ||||||
| [76] | x | x | ||||||||
| [77] | x | x | 50% training, 50% test | |||||||
| [78] | x | x | x | x | x | Cohen’s kappa, micro average, error rate | 20% test, 5% validation, 75% training | |||
| [79] | x | x | x | subject-wise: leave-one-person-out CV from; person dependent: 90% training, 10% test | ||||||
| [80] | x | x | cross-validated against a record of training sessions | |||||||
| [81] | x | |||||||||
| [82] | x | x | x | x | 10-fold CV, leave-one-subject-out CV | |||||
| [83] | x | x | x | x | x | 5-fold CV | ||||
| [84] | x | x | x | 10-fold CV | ||||||
| [85] | x | |||||||||
| [86] | x | recognition: 30% train, 70% test; posture evaluation: 30% training | ||||||||
| [87] | x | x | x | 3 subjects for training, 2 test; 5-fold CV | ||||||
| [88] | x | x | x | x | 70% training, 15% validation, 15% test | |||||
| [89] | x | x | x | x | ||||||
| [90] | x | x | x | x | x | 30% test, 70% training | ||||
| [91] | x | x | unseen user: leave-one-subject-out CV; overall performance: 60% training | |||||||
| [92] | x | false positive | 66.6% train, 33.3% test | |||||||
| [93] | x | x | x | 5-fold CV | ||||||
| [94] | x | 100 samples for training, 200 for testing (for each gesture); 4-fold CV | ||||||||
| [95] | x | 80% training, 20% test; leave-one-out CV | ||||||||
| [96] | x | x | 6-fold CV | |||||||
| Classification of a quality-related outcome | ||||||||||
| [97] | x | 8-fold CV | ||||||||
| [98] | x | x | x | x | 8-fold CV | |||||
| [99] | x | x | 10-fold CV | |||||||
| [100] | x | leave-one-subject-out CV | ||||||||
| [101] | x | x | normalised confusion matrix | 80% training (4-fold CV), 20% test | ||||||
| [102] | x | 10-fold CV and Leave-one-subject-out | ||||||||
| [103] | x | 10-fold CV | ||||||||
| [104] | x | x | record wise: 80% training, 20% test; subject wise: LOSO-CV | |||||||
| [105] | x | 75% training (10-fold CV), 25% test | ||||||||
| [106] | x | x | leave-one-out CV | |||||||
| [107] | x | x | x | x | 10-fold CV | |||||
| [108] | x | x | x | x | ||||||
| [109] | x | x | x | 85% training (incl. 15% validation), 15% test | ||||||
| [110] | x | x | x | x | 9 test users, 4 subjects for training | |||||
| [111] | x | x | x | 10-fold-CV | ||||||
Conf. M.: Confusion Matrix; Acc: Accuracy; F1: F1-Score; Pr.: Precision; Rec.: Recall; ROC: receiver operating characteristic; AUC: Area under the curve; comp: computational; CV:
cross-validation.
References
- Aggarwal, J.; Cai, Q. Human Motion Analysis: A Review. Comput. Vis. Image Underst. 1999, 73, 428–440. [Google Scholar] [CrossRef]
- Colyer, S.L.; Evans, M.; Cosker, D.P.; Salo, A.I.T. A Review of the Evolution of Vision-Based Motion Analysis and the Integration of Advanced Computer Vision Methods Towards Developing a Markerless System. Sport. Med. Open 2018, 4, 24. [Google Scholar] [CrossRef] [PubMed]
- Bulling, A.; Blanke, U.; Schiele, B. A tutorial on human activity recognition using body-worn inertial sensors. ACM Comput. Surv. 2014, 46, 1–33. [Google Scholar] [CrossRef]
- Kulić, D.; Kragic, D.; Krüger, V. Learning Action Primitives. In Visual Analysis of Humans: Looking at People; Moeslund, T.B., Hilton, A., Krüger, V., Sigal, L., Eds.; Springer: London, UK, 2011; pp. 333–353. [Google Scholar] [CrossRef]
- Moeslund, T.B.; Hilton, A.; Krüger, V. A survey of advances in vision-based human motion capture and analysis. Comput. Vis. Image Underst. 2006, 104, 90–126. [Google Scholar] [CrossRef]
- Slim, S.O.; Atia, A.; Elfattah, M.M.A.; Mostafa, M.S. Survey on Human Activity Recognition based on Acceleration Data. Int. J. Adv. Comput. Sci. Appl. 2019, 10, 0100311. [Google Scholar] [CrossRef]
- Cust, E.E.; Sweeting, A.J.; Ball, K.; Robertson, S. Machine and deep learning for sport-specific movement recognition: A systematic review of model development and performance. J. Sport. Sci. 2019, 37, 568–600. [Google Scholar] [CrossRef]
- Cornacchia, M.; Ozcan, K.; Zheng, Y.; Velipasalar, S. A Survey on Activity Detection and Classification Using Wearable Sensors. IEEE Sens. J. 2017, 17, 386–403. [Google Scholar] [CrossRef]
- Wang, J.; Chen, Y.; Hao, S.; Peng, X.; Hu, L. Deep learning for sensor-based activity recognition: A survey. Pattern Recognit. Lett. 2019, 119, 3–11. [Google Scholar] [CrossRef]
- Lara, O.D.; Labrador, M.A. A Survey on Human Activity Recognition using Wearable Sensors. IEEE Commun. Surv. Tutor. 2013, 15, 1192–1209. [Google Scholar] [CrossRef]
- Ismail Fawaz, H.; Forestier, G.; Weber, J.; Idoumghar, L.; Muller, P.A. Deep learning for time series classification: A review. Data Min. Knowl. Discov. 2019, 33, 917–963. [Google Scholar] [CrossRef]
- Bagnall, A.; Lines, J.; Bostrom, A.; Large, J.; Keogh, E. The great time series classification bake off: A review and experimental evaluation of recent algorithmic advances. Data Min. Knowl. Discov. 2017, 31, 606–660. [Google Scholar] [CrossRef] [PubMed]
- Ruiz, A.P.; Flynn, M.; Large, J.; Middlehurst, M.; Bagnall, A. The great multivariate time series classification bake off: A review and experimental evaluation of recent algorithmic advances. Data Min. Knowl. Discov. 2021, 35, 401–449. [Google Scholar] [CrossRef] [PubMed]
- Pham, T.D. Time-frequency time-space LSTM for robust classification of physiological signals. Sci. Rep. 2021, 11, 6936. [Google Scholar] [CrossRef] [PubMed]
- Colquhoun, H.L.; Levac, D.; O’Brien, K.K.; Straus, S.; Tricco, A.C.; Perrier, L.; Kastner, M.; Moher, D. Scoping reviews: Time for clarity in definition, methods, and reporting. J. Clin. Epidemiol. 2014, 67, 1291–1294. [Google Scholar] [CrossRef]
- Brien, S.E.; Lorenzetti, D.L.; Lewis, S.; Kennedy, J.; Ghali, W.A. Overview of a formal scoping review on health system report cards. Implement. Sci. 2010, 5, 2. [Google Scholar] [CrossRef]
- von Elm, E.; Schreiber, G.; Haupt, C.C. Methodische Anleitung für Scoping Reviews (JBI-Methodologie). Z. Evid. Fortbild. Qual. Gesundhwes 2019, 143, 1–7. [Google Scholar] [CrossRef]
- Tricco, A.C.; Lillie, E.; Zarin, W.; O’Brien, K.K.; Colquhoun, H.; Levac, D.; Moher, D.; Peters, M.D.; Horsley, T.; Weeks, L.; et al. PRISMA Extension for Scoping Reviews (PRISMA-ScR): Checklist and Explanation. Ann. Intern. Med. 2018, 169, 467–473. [Google Scholar] [CrossRef]
- Acikmese, Y.; Ustundag, B.C.; Golubovic, E. Towards an artificial training expert system for basketball. In Proceedings of the 2017 10th International Conference on Electrical and Electronics Engineering (ELECO), Bursa, Turkey, 30 November–2 December 2017; pp. 1300–1304. [Google Scholar]
- Ahmadi, A.; Mitchell, E.; Richter, C.; Destelle, F.; Gowing, M.; O’Connor, N.E.; Moran, K. Toward Automatic Activity Classification and Movement Assessment During a Sports Training Session. IEEE Internet Things J. 2015, 2, 23–32. [Google Scholar] [CrossRef]
- Alobaid, O.; Ramaswamy, L.; Rasheed, K. A Machine Learning Approach for Identifying Soccer Moves Using an Accelerometer Sensor. In Proceedings of the 2018 International Conference on Computational Science and Computational Intelligence (CSCI), Las Vegas, NV, USA, 12–14 December 2018; pp. 1168–1174. [Google Scholar] [CrossRef]
- Amerineni, R.; Gupta, L.; Steadman, N.; Annauth, K.; Burr, C.; Wilson, S.; Barnaghi, P.; Vaidyanathan, R. Fusion Models for Generalized Classification of Multi-Axial Human Movement: Validation in Sport Performance. Sensors 2021, 21, 8409. [Google Scholar] [CrossRef]
- Anand, A.; Sharma, M.; Srivastava, R.; Kaligounder, L.; Prakash, D. Wearable Motion Sensor Based Analysis of Swing Sports. In Proceedings of the 2017 16th IEEE International Conference on Machine Learning and Applications (ICMLA), Cancun, Mexico, 18–21 December 2017; pp. 261–267. [Google Scholar] [CrossRef]
- Anik, M.A.I.; Hassan, M.; Mahmud, H.; Hasan, M.K. Activity Recognition of a Badminton Game Through Accelerometer and Gyroscope. In Proceedings of the 2016 19th International Conference on Computer and Information Technology, Dhaka, Bangladesh, 18–20 December 2016; pp. 213–217. [Google Scholar]
- Aung, M.S.H.; Thies, S.B.; Kenney, L.P.J.; Howard, D.; Selles, R.W.; Findlow, A.H.; Goulermas, J.Y. Automated Detection of Instantaneous Gait Events Using Time Frequency Analysis and Manifold Embedding. IEEE Trans. Neural Syst. Rehabil. Eng. 2013, 21, 908–916. [Google Scholar] [CrossRef]
- Bauza, C.G.; D’Amato, J.; Gariglio, A.; Abasolo, M.J.; Venere, M.; Manresa-Yee, C.; Mas-Sanso, R. A Tennis Training Application Using 3D Gesture Recognition. In Articulated Motion and Deformable Objects; Lecture Notes in Computer Science; Perales, F.J., Fisher, R.B., Moeslund, T.B., Eds.; Springer: Berlin/Heidelberg, Germany, 2012; Volume 7378, pp. 239–249. [Google Scholar]
- Büthe, L.; Blanke, U.; Capkevics, H.; Tröster, G. A wearable sensing system for timing analysis in tennis. In Proceedings of the 2016 IEEE 13th International Conference on Wearable and Implantable Body Sensor Networks (BSN), San Francisco, CA, USA, 14–17 June 2016; pp. 43–48. [Google Scholar] [CrossRef]
- Charvátová, H.; Procházka, A.; Vyšata, O.; Suárez-Araujo, C.P.; Smith, J.H. Evaluation of Accelerometric and Cycling Cadence Data for Motion Monitoring. IEEE Access 2021, 9, 129256–129263. [Google Scholar] [CrossRef]
- Dasgupta, P.; VanSwearingen, J.; Sejdic, E. “You can tell by the way I use my walk.” Predicting the presence of cognitive load with gait measurements. Biomed. Eng. Online 2018, 17, 122. [Google Scholar] [CrossRef]
- Gellaerts, J.; Bogdanov, E.; Dadashi, F.; Mariani, B. In-Field Validation of an Inertial Sensor-Based System for Movement Analysis and Classification in Ski Mountaineering. Sensors 2018, 18, 885. [Google Scholar] [CrossRef] [PubMed]
- Giandolini, M.; Poupard, T.; Gimenez, P.; Horvais, N.; Millet, G.Y.; Morin, J.B.; Samozino, P. A simple field method to identify foot strike pattern during running. J. Biomech. 2014, 47, 1588–1593. [Google Scholar] [CrossRef] [PubMed]
- Groh, B.H.; Flaschka, J.; Wirth, M.; Kautz, T.; Fleckenstein, M.; Eskofier, B.M. Wearable Real-Time Skateboard Trick Visualization and Its Community Perception. IEEE Comput. Graph. Appl. 2016, 36, 12–18. [Google Scholar] [CrossRef] [PubMed]
- Groh, B.H.; Fleckenstein, M.; Kautz, T.; Eskofier, B.M. Classification and visualization of skateboard tricks using wearable sensors. Pervasive Mob. Comput. 2017, 40, 42–55. [Google Scholar] [CrossRef]
- Hachaj, T.; Ogiela, M.R. Classification of Karate Kicks with Hidden Markov Models Classifier and Angle-Based Features. In Proceedings of the 2018 11th International Congress on Image and Signal Processing, BioMedical Engineering and Informatics (CISP-BMEI), Beijing, China, 13–15 October 2018; pp. 1–5. [Google Scholar] [CrossRef]
- Hachaj, T.; Piekarczyk, M.; Ogiela, M.R. Human Actions Analysis: Templates Generation, Matching and Visualization Applied to Motion Capture of Highly-Skilled Karate Athletes. Sensors 2017, 17, 2590. [Google Scholar] [CrossRef] [PubMed]
- Haider, F.; Salim, F.A.; Yengec Tasdemir, S.B.; Naghashi, V.; Tengiz, I.; Cengiz, K.; Postma, D.B.W.; Van Delden, R.; Reidsma, D.; Van Beijnum, B.J.; et al. Evaluation of dominant and non-dominant hand movements for volleyball action modelling. In Proceedings of the Adjunct of the 2019 International Conference on Multimodal Interaction, ICMI 2019, Suzhou, China, 14–18 October 2019; pp. 1–6. [Google Scholar] [CrossRef]
- Helten, T.; Brock, H.; Muller, M.; Seidel, H.P. Classification of trampoline jumps using inertial sensors. Sport. Eng. 2011, 14, 155–164. [Google Scholar] [CrossRef]
- Hendry, D.; Chai, K.; Campbell, A.; Hopper, L.; O’Sullivan, P.; Straker, L. Development of a Human Activity Recognition System for Ballet Tasks. Sport. Med. Open 2020, 6, 10. [Google Scholar] [CrossRef] [PubMed]
- Hoettinger, H.; Mally, F.; Sabo, A. Activity Recognition in Surfing-A Comparative Study between Hidden Markov Model and Support Vector Machine. Procedia Eng. 2016, 147, 912–917. [Google Scholar] [CrossRef]
- Holatka, A.; Suwa, H.; Yasumoto, K. Volleyball Setting Technique Assessment Using a Single Point Sensor. In Proceedings of the 2019 IEEE International Conference on Pervasive Computing and Communications Workshops (PerCom Workshops), Kyoto, Japan, 11–15 March 2019; pp. 567–572. [Google Scholar] [CrossRef]
- Hollaus, B.; Stabinger, S.; Mehrle, A.; Raschner, C. Using Wearable Sensors and a Convolutional Neural Network for Catch Detection in American Football. Sensors 2020, 20, 6722. [Google Scholar] [CrossRef] [PubMed]
- Hu, X.Y.; Mo, S.R.; Qu, X.D. Basketball Activity Classification Based on Upper Body Kinematics and Dynamic Time Warping. Int. J. Sport. Med. 2020, 41, 255–263. [Google Scholar] [CrossRef] [PubMed]
- Huang, M.; Zhao, G.; Wang, L.; Yang, F. A Pervasive Simplified Method for Human Movement Pattern Assessing. In Proceedings of the 2010 IEEE 16th International Conference on Parallel and Distributed Systems, Shanghai, China, 8–10 December 2010; pp. 625–628. [Google Scholar] [CrossRef]
- Huang, L.J.; Ma, H.; Yan, W.C.; Liu, W.D.; Liu, H.Y.; Yang, Z.Y. Sports Motion Recognition based on Foot Trajectory State Sequence Mapping. In Proceedings of the 2019 International Joint Conference on Neural Networks, Budapest, Hungary, 14–19 July 2019. [Google Scholar]
- Jang, J.; Ankit, A.; Kim, J.; Jang, Y.J.; Kim, H.Y.; Kim, J.H.; Xiong, S.; Jang, J.; Ankit, A.; Kim, J.; et al. A Unified Deep-Learning Model for Classifying the Cross-Country Skiing Techniques Using Wearable Gyroscope Sensors. Sensors 2018, 18, 3819. [Google Scholar] [CrossRef] [PubMed]
- Jensen, U.; Prade, F.; Eskofier, B.M. Classification of kinematic swimming data with emphasis on resource consumption. In Proceedings of the 2013 IEEE International Conference on Body Sensor Networks, Cambridge, MA, USA, 6–9 May 2013; pp. 1–5. [Google Scholar] [CrossRef]
- Jensen, U.; Blank, P.; Kugler, P.; Eskofier, B.M. Unobtrusive and Energy-Efficient Swimming Exercise Tracking Using On-Node Processing. IEEE Sens. J. 2016, 16, 3972–3980. [Google Scholar] [CrossRef]
- Jeong, P.; Choe, M.; Kim, N.; Park, J.; Chung, J. Physical Workout Classification Using Wrist Accelerometer Data by Deep Convolutional Neural Networks. IEEE Access 2019, 7, 182406–182414. [Google Scholar] [CrossRef]
- Kos, M.; Ženko, J.; Vlaj, D.; Kramberger, I. Tennis stroke detection and classification using miniature wearable IMU device. In Proceedings of the International Conference on Systems, Signals, and Image Processing, Bratislava, Slovakia, 23–25 May 2016; Volume 2016. [Google Scholar] [CrossRef]
- Labintsev, A.; Khasanshin, I.; Balashov, D.; Bocharov, M.; Bublikov, K. Recognition Punches in Karate Using Acceleration Sensors and Convolution Neural Networks. IEEE Access 2021, 9, 138106–138119. [Google Scholar] [CrossRef]
- Ladha, C.; Hammerla, N.Y.; Olivier, P.; Plötz, T. ClimbAX: Skill assessment for climbing enthusiasts. In Proceedings of the Ubicomp’13: Proceedings of the 2013 ACM International Joint Conference on Pervasive and Ubiquitous Computing, Zurich, Switzerland, 8–12 September 2013; pp. 235–244. [Google Scholar] [CrossRef]
- Li, H.; Yap, H.J.; Khoo, S. Motion Classification and Features Recognition of a Traditional Chinese Sport (Baduanjin) Using Sampled-Based Methods. Appl. Sci. 2021, 11, 7630. [Google Scholar] [CrossRef]
- Lisca, G.; Prodaniuc, C.; Grauschopf, T.; Axenie, C. Less Is More: Learning Insights From a Single Motion Sensor for Accurate and Explainable Soccer Goalkeeper Kinematics. IEEE Sensors J. 2021, 21, 20375–20387. [Google Scholar] [CrossRef]
- Ma, R.; Yan, D.; Peng, H.; Yang, T.; Sha, X.; Zhao, Y.; Liu, L. Basketball Movements Recognition Using a Wrist Wearable Inertial Measurement Unit. In Proceedings of the 2018 IEEE 1st International Conference on Micro/Nano Sensors for AI, Healthcare, and Robotics (NSENS), Shenzhen, China, 5–7 December 2018; pp. 73–76. [Google Scholar] [CrossRef]
- Ma, J.; Hogervorst, E.; Magistro, D.; Chouliaras, V.; Zecca, M. Development of Sensorised Resistance Band for Objective Exercise Measurement: Activities Classification Trial. In Proceedings of the 2018 40th Annual International Conference of the IEEE Engineering in Medicine and Biology Society (EMBC), Honolulu, HI, USA, 18–21 July 2018; pp. 3942–3945. [Google Scholar] [CrossRef]
- Malawski, F.; Kwolek, B. Recognition of action dynamics in fencing using multimodal cues. Image Vis. Comput. 2018, 75, 1–10. [Google Scholar] [CrossRef]
- Matsuyama, H.; Aoki, S.; Yonezawa, T.; Hiroi, K.; Kaji, K.; Kawaguchi, N. Deep Learning for Ballroom Dance Recognition: A Temporal and Trajectory-Aware Classification Model With Three-Dimensional Pose Estimation and Wearable Sensing. IEEE Sens. J. 2021, 21, 25437–25448. [Google Scholar] [CrossRef]
- McGrath, J.W.; Neville, J.; Stewart, T.; Cronin, J. Cricket fast bowling detection in a training setting using an inertial measurement unit and machine learning. J. Sport. Sci. 2019, 37, 1220–1226. [Google Scholar] [CrossRef]
- Mo, L.F.; Zeng, L.J. Running gait pattern recognition based on cross-correlation analysis of single acceleration sensor. Math. Biosci. Eng. 2019, 16, 6242–6256. [Google Scholar] [CrossRef] [PubMed]
- Nguyen, L.N.N.; Rodríguez-Martín, D.; Català, A.; Pérez-López, C.; Samà, A.; Cavallaro, A. Basketball activity recognition using wearable inertial measurement units. In Proceedings of the ACM International Conference Proceeding Series, Vilanova i la Geltru, Spain, 7–9 September 2015. [Google Scholar] [CrossRef]
- Nishizaki, H.; Makino, K. Signal Classification Using Deep Learning. In Proceedings of the 2019 IEEE International Conference on Sensors and Nanotechnology, Penang, Malaysia, 24–25 July 2019; pp. 1–4. [Google Scholar] [CrossRef]
- Nurwanto, F.; Ardiyanto, I.; Wibirama, S. Light sport exercise detection based on smartwatch and smartphone using k-Nearest Neighbor and Dynamic Time Warping algorithm. In Proceedings of the 2016 8th International Conference on Information Technology and Electrical Engineering (ICITEE), Yogyakarta, Indonesia, 5–6 October 2016; pp. 1–5. [Google Scholar] [CrossRef]
- Ogasawara, T.; Fukamachi, H.; Aoyagi, K.; Kumano, S.; Togo, H.; Oka, K. Archery Skill Assessment Using an Acceleration Sensor. IEEE Trans. Hum. Mach. Syst. 2021, 51, 221–228. [Google Scholar] [CrossRef]
- Ooi, J.H.; Gouwanda, D. Badminton stroke identification using wireless inertial sensor and neural network. Proc. Inst. Mech. Eng. Part J. Sport. Eng. Technol. 2021, in press. [Google Scholar] [CrossRef]
- Peng, K.; Zhao, Y.; Sha, X.; Ma, W.; Wang, Y.; Li, W.J. Accurate Recognition of Volleyball Motion Based on Fusion of MEMS Inertial Measurement Unit and Video Analytic. In Proceedings of the 2018 IEEE 8th Annual International Conference on CYBER Technology in Automation, Control, and Intelligent Systems (CYBER), Tianjin, China, 19–23 July 2018; pp. 440–444. [Google Scholar] [CrossRef]
- Preatoni, E.; Nodari, S.; Lopomo, N.F. Supervised Machine Learning Applied to Wearable Sensor Data Can Accurately Classify Functional Fitness Exercises within a Continuous Workout. Front. Bioeng. Biotechnol. 2020, 8, 664. [Google Scholar] [CrossRef] [PubMed]
- Qi, J.; Yang, P.; Hanneghan, M.; Tang, S.; Zhou, B. A Hybrid Hierarchical Framework for Gym Physical Activity Recognition and Measurement Using Wearable Sensors. IEEE Internet Things J. 2019, 6, 1384–1393. [Google Scholar] [CrossRef]
- Qiu, S.; Hao, Z.; Wang, Z.; Liu, L.; Liu, J.; Zhao, H.; Fortino, G. Sensor Combination Selection Strategy for Kayak Cycle Phase Segmentation Based on Body Sensor Networks. IEEE Internet Things J. 2022, 9, 4190–4201. [Google Scholar] [CrossRef]
- Rawashdeh, S.A.; Rafeldt, D.A.; Uhl, T.L. Wearable IMU for Shoulder Injury Prevention in Overhead Sports. Sensors 2016, 16, 1847. [Google Scholar] [CrossRef] [PubMed]
- Reilly, B.; Morgan, O.; Czanner, G.; Robinson, M.A. Automated Classification of Changes of Direction in Soccer Using Inertial Measurement Units. Sensors 2021, 21, 4625. [Google Scholar] [CrossRef]
- Rindal, O.M.H.; Seeberg, T.M.; Tjonnas, J.; Haugnes, P.; Sandbakk, O. Automatic Classification of Sub-Techniques in Classical Cross-Country Skiing Using a Machine Learning Algorithm on Micro-Sensor Data. Sensors 2018, 18, 75. [Google Scholar] [CrossRef]
- Sha, X.; Wei, G.; Zhang, X.; Ren, X.; Wang, S.; He, Z.; Zhao, Y. Accurate Recognition of Player Identity and Stroke Performance in Table Tennis Using a Smart Wristband. IEEE Sens. J. 2021, 21, 10923. [Google Scholar] [CrossRef]
- Shi, S.; Zhou, Q.F.; Peng, M.; Cheng, X. Utilize Smart Insole to Recognize Basketball Motions. In Proceedings of the 2018 IEEE 4th International Conference on Computer and Communications (ICCC), Chengdu, China, 7–10 December 2018; pp. 1430–1434. [Google Scholar] [CrossRef]
- Silva, V.; Ramos, J.; Leite, P.; Soares, F.; Novais, P.; Arezes, P.; Sousa, F.; Figueira, C.; Santos, A. Developing a framework for promoting physical activity in a Boccia game scenario. Comput. Methods Biomech. Biomed. Eng. Imaging Vis. 2019, 7, 632–642. [Google Scholar] [CrossRef]
- Stoeve, M.; Schuldhaus, D.; Gamp, A.; Zwick, C.; Eskofier, B.M. From the Laboratory to the Field: IMU-Based Shot and Pass Detection in Football Training and Game Scenarios Using Deep Learning. Sensors 2021, 21, 3071. [Google Scholar] [CrossRef] [PubMed]
- Strohrmann, C.; Seiter, J.; Llorca, Y.; Troester, G. Can smartphones help with running technique? Procedia Comput. Sci. 2013, 19, 902–907. [Google Scholar] [CrossRef][Green Version]
- Sun, X.; Zhao, K.; Jiang, W.; Jin, X. Method of Analyzing and Managing Volleyball Action by Using Action Sensor of Mobile Device. J. Sens. 2021, 2021, 6232968. [Google Scholar] [CrossRef]
- Tabrizi, S.S.; Pashazadeh, S.; Javani, V. Comparative Study of Table Tennis Forehand Strokes Classification Using Deep Learning and SVM. IEEE Sens. J. 2020, 20, 13552–13561. [Google Scholar] [CrossRef]
- Takata, M.; Nakamura, Y.; Torigoe, Y.; Fujimoto, M.; Arakawa, Y.; Yasumoto, K. Strikes-Thrusts Activity Recognition Using Wrist Sensor Towards Pervasive Kendo Support System. In Proceedings of the 2019 IEEE International Conference on Pervasive Computing and Communications Workshops (PerCom Workshops), Kyoto, Japan, 11–15 March 2019; pp. 243–248. [Google Scholar] [CrossRef]
- Tjønnås, J.; Seeberg, T.M.; Rindal, O.M.H.; Haugnes, P.; Sandbakk, Ø. Assessment of basic motions and technique identification in classical cross-country skiing. Front. Psychol. 2019, 10, 01260. [Google Scholar] [CrossRef]
- Vales-Alonso, J.; Chaves-Diéguez, D.; López-Matencio, P.; Alcaraz, J.J.; Parrado-García, F.J.; González-Castaño, F.J. SAETA: A Smart Coaching Assistant for Professional Volleyball Training. IEEE Trans. Syst. Man Cybern. Syst. 2015, 45, 1138–1150. [Google Scholar] [CrossRef]
- Wang, J.; Wang, Z.; Gao, F.; Zhao, H.; Qiu, S.; Li, J. Swimming Stroke Phase Segmentation Based on Wearable Motion Capture Technique. IEEE Trans. Instrum. Meas. 2020, 69, 8526–8538. [Google Scholar] [CrossRef]
- Wang, Z.; Shi, X.; Wang, J.; Gao, F.; Li, J.; Guo, M.; Zhao, H.; Qiu, S. Swimming Motion Analysis and Posture Recognition Based on Wearable Inertial Sensors. In Proceedings of the 2019 IEEE International Conference on Systems, Man and Cybernetics (SMC), Bari, Italy, 6–9 October 2019; pp. 3371–3376. [Google Scholar] [CrossRef]
- Wang, W.F.; Yang, C.Y.; Guo, J.T. A Sport Recognition Method with Utilizing Less Motion Sensors. In Advances in Intelligent Systems and Computing; Genetic and Evolutionary Computing Series; Sun, H., Yang, C.Y., Lin, C.W., Pan, J.S., Snasel, V., Abraham, A., Eds.; Springer International Publishing: Cham, Switzerland, 2015; Volume 329, pp. 155–167. [Google Scholar] [CrossRef]
- Weiping, P.; Jun, W.; Xubin, X.; Zhengwei, W.; Xiaorong, D. An embedded 6-axis sensor based recognition for tennis stroke. In Proceedings of the 2017 IEEE International Conference on Consumer Electronics (ICCE), Las Vegas, NV, USA, 8–10 January 2017; pp. 55–58. [Google Scholar] [CrossRef]
- Wu, Z.; Zhang, J.; Chen, K.; Fu, C. Yoga posture recognition and quantitative evaluation with wearable sensors based on two-stage classifier and prior Bayesian network. Sensors 2019, 19, 5129. [Google Scholar] [CrossRef] [PubMed]
- Xia, K.; Wang, H.Y.; Xu, M.H.; Li, Z.; He, S.; Tang, Y.S. Racquet Sports Recognition Using a Hybrid Clustering Model Learned from Integrated Wearable Sensor. Sensors 2020, 20, 1638. [Google Scholar] [CrossRef] [PubMed]
- Zago, M.; Sforza, C.; Dolci, C.; Tarabini, M.; Galli, M. Use of Machine Learning and Wearable Sensors to Predict Energetics and Kinematics of Cutting Maneuvers. Sensors 2019, 19, 3094. [Google Scholar] [CrossRef] [PubMed]
- Zhang, Z.; Wang, N.; Cui, L. Fine-Fit: A Fine-grained Gym Exercises Recognition System. In Proceedings of the 2018 24th Asia-Pacific Conference on Communications (APCC), Ningbo, China, 12–14 November 2018; pp. 492–497. [Google Scholar] [CrossRef]
- Zhang, H.; Fu, Z.; Shu, K. Recognizing Ping-Pong Motions Using Inertial Data Based on Machine Learning Classification Algorithms. IEEE Access 2019, 7, 167055–167064. [Google Scholar] [CrossRef]
- Zhang, C.; Yang, F.; Li, G.; Zhai, Q.; Jiang, Y.; Xuan, D. MV-Sports: A Motion and Vision Sensor Integration-Based Sports Analysis System. In Proceedings of the IEEE INFOCOM 2018—IEEE Conference on Computer Communications, Honolulu, HI, USA, 16–19 April 2018; pp. 1079–1087. [Google Scholar]
- Zhang, B.; Lyu, M.; Zhang, L.; Wu, Y. Artificial Intelligence-Based Joint Movement Estimation Method for Football Players in Sports Training. Mob. Inf. Syst. 2021, 2021, 9956482. [Google Scholar] [CrossRef]
- Zhao, H.; Wang, S.; Zhou, G.; Jung, W. TennisEye: Tennis Ball Speed Estimation using a Racket-mounted Motion Sensor. In Proceedings of the 2019 18th ACM/IEEE International Conference on Information Processing in Sensor Networks (IPSN), Montreal, QC, Canada, 16–18 April 2019; pp. 241–252. [Google Scholar] [CrossRef]
- Zhao, L.; Chen, W. Detection and recognition of human body posture in motion based on sensor technology. IEEJ Trans. Electr. Electron. Eng. 2020, 15, 766–770. [Google Scholar] [CrossRef]
- Zhao, Y.; Meng, X.; Ren, X.; Lian, C.; Sun, J.; Sha, X.; Wang, S.; Li, L.; Li, W.J. Quantitative Evaluation of Gymnastics Based on Multiple MEMS Sensors. IEEE Sens. J. 2021, 21, 24531–24539. [Google Scholar] [CrossRef]
- Zheng, E.; Zhang, Z.; Mai, J.; Wang, Q.; Qiao, H. A Pilot Study on Continuous Breaststroke Phase Recognition with Fast Training Based on Lower-Limb Inertial Signals. In Proceedings of the 2019 41st Annual International Conference of the IEEE Engineering in Medicine and Biology Society (EMBC), Berlin, Germany, 23–27 July 2019; pp. 1228–1232. [Google Scholar] [CrossRef]
- Brock, H.; Ohgi, Y.; Lee, J. Learning to judge like a human: Convolutional networks for classification of ski jumping errors. In Proceedings of the 2017 ACM International Symposium on Wearable Computers—ISWC ’17, Maui, HI, USA, 11–15 September 2017; pp. 106–113. [Google Scholar] [CrossRef]
- Brock, H.; Ohgi, Y. Assessing Motion Style Errors in Ski Jumping Using Inertial Sensor Devices. IEEE Sens. J. 2017, 17, 3794–3804. [Google Scholar] [CrossRef]
- Ebert, A.; Beck, M.T.; Mattausch, A.; Belzner, L.; Linnhoff-Popien, C. Qualitative assessment of recurrent human motion. In Proceedings of the 2017 25th European Signal Processing Conference (EUSIPCO), Kos, Greece, 28 August 2017–2 September 2017; pp. 306–310. [Google Scholar] [CrossRef]
- Jensen, U.; Eskofier, B.; Dassler, F. Classification of kinematic golf putt data with emphasis on feature selection. In Proceedings of the 21st International Conference on Pattern Recognition (ICPR2012), Tsukuba, Japan, 11–15 November 2012; pp. 1735–1738. [Google Scholar]
- Jung, D.; Nguyen, M.D.; Park, M.; Kim, J.; Mun, K. Multiple Classification of Gait Using Time-Frequency Representations and Deep Convolutional Neural Networks. IEEE Trans. Neural Syst. Rehabil. Eng. 2020, 28, 997–1005. [Google Scholar] [CrossRef] [PubMed]
- Kianifar, R.; Lee, A.; Raina, S.; Kulić, D. Classification of squat quality with inertial measurement units in the single leg squat mobility test. In Proceedings of the 2016 38th Annual International Conference of the IEEE Engineering in Medicine and Biology Society (EMBC), Orlando, FL, USA, 16–20 August 2016; pp. 6273–6276. [Google Scholar] [CrossRef]
- Liang, Z.; Nishimura, T.; Iino, N.; Yoshida, Y.; Nishimura, S. Utilizing mobile devices for evaluating body trunk coordination: Feasibility and preliminary results. In Proceedings of the 2017 Tenth International Conference on Mobile Computing and Ubiquitous Network (ICMU), Toyama, Japan, 3–5 October 2017; pp. 1–6. [Google Scholar] [CrossRef]
- Liu, Q.; Mo, S.; Cheung, V.C.; Cheung, B.M.; Wang, S.; Chan, P.P.; Malhotra, A.; Cheung, R.T.; Chan, R.H. Classification of runners’ performance levels with concurrent prediction of biomechanical parameters using data from inertial measurement units. J. Biomech. 2020, 112, 110072. [Google Scholar] [CrossRef] [PubMed]
- Liu, L.; Qiu, S.; Wang, Z.L.; Li, J.; Wang, J.X. Canoeing Motion Tracking and Analysis via Multi-Sensors Fusion. Sensors 2020, 20, 2110. [Google Scholar] [CrossRef]
- Malik, O.A.; Senanayake, S.M.N.A.; Zaheer, D. An adaptive interval type-2 fuzzy logic framework for classification of gait patterns of anterior cruciate ligament reconstructed subjects. In Proceedings of the 2014 IEEE International Conference on Fuzzy Systems (FUZZ-IEEE), Beijing, China, 6–11 July 2014; pp. 1068–1075. [Google Scholar] [CrossRef]
- Mitchell, E.; Ahmadi, A.; Connor, N.E.O.; Richter, C.; Farrell, E.; Kavanagh, J.; Moran, K. Automatically detecting asymmetric running using time and frequency domain features. In Proceedings of the 2015 IEEE 12th International Conference on Wearable and Implantable Body Sensor Networks (BSN), Cambridge, MA, USA, 9–12 June 2015; pp. 1–6. [Google Scholar] [CrossRef][Green Version]
- Rose, M.J.; McCollum, K.A.; Freehill, M.T.; Cain, S.M. Quantifying Throw Counts and Intensities Throughout a Season in Youth Baseball Players: A Pilot Study. J. Biomech. Eng. 2020, 143. [Google Scholar]
- Mat Sanusi, K.A.; Mitri, D.D.; Limbu, B.; Klemke, R. Table Tennis Tutor: Forehand Strokes Classification Based on Multimodal Data and Neural Networks. Sensors 2021, 21, 3121. [Google Scholar] [CrossRef] [PubMed]
- Viyanon, W.; Kosasaeng, V.; Chatchawal, S.; Komonpetch, A. SwingPong: Analysis and suggestion based on motion data from mobile sensors for table tennis strokes using decision tree. In Proceedings of the 2016 International Conference on Intelligent Information Processing, Wuhan, China, 23–25 December 2016; pp. 1–6. [Google Scholar] [CrossRef]
- Zhao, Y.R.; Salunke, S.; Leavitt, A.; Curtin, K.; Huynh, N.; Zeagler, C.; Assoc Comp, M. E-Archery: Prototype Wearable for Analyzing Archery Release. In Proceedings of the Ubicomp’16 Adjunct: Proceedings of the 2016 Acm International Joint Conference on Pervasive and Ubiquitous Computing, Heidelberg, Germany, 12–16 September 2016; pp. 908–913. [Google Scholar] [CrossRef]
- R Core Team. R: A Language and Environment for Statistical Computing; R Foundation for Statistical Computing: Vienna, Austria, 2021. [Google Scholar]
- Barredo Arrieta, A.; Díaz-Rodríguez, N.; Del Ser, J.; Bennetot, A.; Tabik, S.; Barbado, A.; Garcia, S.; Gil-Lopez, S.; Molina, D.; Benjamins, R.; et al. Explainable Artificial Intelligence (XAI): Concepts, taxonomies, opportunities and challenges toward responsible AI. Inf. Fusion 2020, 58, 82–115. [Google Scholar] [CrossRef]
- Cervantes, J.; Garcia-Lamont, F.; Rodríguez-Mazahua, L.; Lopez, A. A comprehensive survey on support vector machine classification: Applications, challenges and trends. Neurocomputing 2020, 408, 189–215. [Google Scholar] [CrossRef]
- Muscillo, R.; Conforto, S.; Schmid, M.; Caselli, P.; D’Alessio, T. Classification of Motor Activities through Derivative Dynamic Time Warping applied on Accelerometer Data. In Proceedings of the 2007 29th Annual International Conference of the IEEE Engineering in Medicine and Biology Society, Lyon, France, 22–26 August 2007; pp. 4930–4933. [Google Scholar] [CrossRef]
- Huang, S.F.; Lu, H.P. Classification of temporal data using dynamic time warping and compressed learning. Biomed. Signal Process. Control. 2020, 57, 101781. [Google Scholar] [CrossRef]
- Zhang, M.; Jiang, X.; Fang, Z.; Zeng, Y.; Xu, K. High-order Hidden Markov Model for trend prediction in financial time series. Phys. Stat. Mech. Appl. 2019, 517, 1–12. [Google Scholar] [CrossRef]
- Saeb, S.; Lonini, L.; Jayaraman, A.; Mohr, D.; Kording, K. Voodoo machine learning for clinical predictions. bioRxiv 2016. [Google Scholar] [CrossRef]
- Chawla, N.V.; Bowyer, K.W.; Hall, L.O.; Kegelmeyer, W.P. SMOTE: Synthetic Minority Over-sampling Technique. J. Artif. Intell. Res. 2002, 16, 321–357. [Google Scholar] [CrossRef]
- He, H.; Bai, Y.; Garcia, E.A.; Li, S. ADASYN: Adaptive synthetic sampling approach for imbalanced learning. In Proceedings of the 2008 IEEE International Joint Conference on Neural Networks (IEEE World Congress on Computational Intelligence), Hong Kong, 1–8 June 2008; pp. 1322–1328. [Google Scholar] [CrossRef]
- Iwana, B.K.; Uchida, S. An empirical survey of data augmentation for time series classification with neural networks. PLoS ONE 2021, 16, e254841. [Google Scholar] [CrossRef]
- Kremser, W.; Mayr, S. How Sports Scientists Explain Their Choice of Wearable. In Proceedings of the 9th International Performance Analysis Workshop and Conference & 5th IACSS Conference, Online, 30–31 August 2021; Springer International Publishing: Cham, Switzerland, 2021; pp. 156–159. [Google Scholar] [CrossRef]
Disclaimer/Publisher’s Note: The statements, opinions and data contained in all publications are solely those of the individual author(s) and contributor(s) and not of MDPI and/or the editor(s). MDPI and/or the editor(s) disclaim responsibility for any injury to people or property resulting from any ideas, methods, instructions or products referred to in the content. |
© 2023 by the authors. Licensee MDPI, Basel, Switzerland. This article is an open access article distributed under the terms and conditions of the Creative Commons Attribution (CC BY) license (https://creativecommons.org/licenses/by/4.0/).