Article

Influence of the Sphericity Coefficient on the Deposition Characteristics of Aerosol Particles on the Surface of Photovoltaic (PV) Modules: Numerical Simulation

1
College of Energy and Power Engineering, Inner Mongolia University of Technology, Hohhot 010051, China
2
College of Energy and Power Engineering, Lanzhou University of Technology, Lanzhou 730050, China
*
Authors to whom correspondence should be addressed.
Appl. Sci. 2023, 13(15), 8658; https://doi.org/10.3390/app13158658
Submission received: 13 July 2023 / Revised: 22 July 2023 / Accepted: 24 July 2023 / Published: 27 July 2023

Abstract

:
The deposition of aerosol particles has a significant impact on the output capacity of photovoltaic modules. Therefore, studying the deposition characteristics of aerosol particles on photovoltaic modules is of great importance for improving their output capacity. Particle morphology is one of the important parameters affecting the deposition characteristics of aerosol particles. This study introduces the spherical coefficient as a quantification method for characterizing the morphology of aerosol particles. Numerical simulations using FLUENT 2022 software were conducted to investigate the influence of the spherical coefficient on the deposition characteristics of aerosol particles on photovoltaic modules. The reliability of the numerical simulations was further validated through experimental studies. Based on the research, the following conclusions can be drawn: the airflow velocity near the surface of the photovoltaic panel increases from bottom to top, with the lowest wind speed recorded near the ground at a minimum value of 2.2 m/s and a maximum value of 3.89 m/s. The air pressure near the surface of the photovoltaic panel shows a decreasing trend from bottom to top, with the highest pressure recorded near the ground at a maximum value of 10 pa and a minimum value ranging from 3.33~5.56 pa. During the deposition process, the accumulation of particles increases with an increase in the sphericity factor. Furthermore, as the sphericity factor gradually increases, the distribution of particles on the surface of the photovoltaic panel becomes more dispersed, covering the entire surface.

1. Introduction

As a widely distributed, clean, and pollution-free renewable energy with huge reserves, solar energy has been used on a large scale in many parts of the world, which has greatly promoted the simultaneous development of global energy conservation and carbon reduction undertakings and the world economy [1,2,3,4]. PV power generation is the most mature technology, the most reliable operation, and the largest installed capacity of solar energy utilization, which plays a decisive function in the new energy utilization field [5,6,7,8,9]. Therefore, the strengthening mechanism and strategy of the output capacity of the PV system are still the hotspots of current research. Since the deposition and accumulation of aerosol particles is one of the main external factors affecting the output capacity of PV systems, it is of great theoretical guiding significance to study the deposition and accumulation law and mechanism of aerosol particles in the photovoltaic (PV) module to improve its output capacity [10,11,12,13,14,15,16].
Based on the above research background, Xu et al. systematically studied the settlement and diffusion behavior of dust particles in roadways with different dip angles by numerical simulation combined with an experimental method pointing to the dip angle, elevation, and concave angle of roadways, which were the main factors affecting dust movement [17]. Roy et al. carried out the carbon dust deposition test for the photovoltaic (PV) array to point out that the influence level of carbon dust deposition on photovoltaic (PV) power generation efficiency is greater than that of partial shadow occlusion [18]. Appels et al. studied the effect of aerosol particle deposition on the output power of photovoltaic (PV) modules in Belgium, which showed that the aerosol particle deposition would lead to the loss of output power of photovoltaic (PV) modules by 3.00~4.00% when the photovoltaic (PV) modules installed with the local optimal inclination angle (35°) and considered the influence of regular rainfall [19]. Shi et al. used FLUENT software (https://www.ansys.com/products/fluids/ansys-fluent) to simulate the concentration and particle size distribution of environmental dust particles during tunnel drilling and compared it with the measured data [20]. Yilbas et al. analyzed the deposition laws, morphological characteristics, and size distribution of aerosol particles on the TiN coating surface of solar collectors [21]. Alquthami et al. studied the different influences of aerosol particle deposition on the output performance of photovoltaic (PV) modules in Cairo and Beni-Suef, Egypt [22]. Klugmann-Radziemska et al. pointed out that the attenuation level of photovoltaic (PV) module output power had a linear relationship with the deposition density of aerosol particles [23].
Although the above-mentioned studies have analyzed the sedimentation characteristics of aerosol particles under different conditions, they have not considered the influence of particle morphology on particle settling behavior. However, particle morphology is related to the magnitude of the drag force experienced by aerosol particles, which is one of the main factors in studying particle sedimentation processes. Therefore, in the study of aerosol particles, especially in the numerical simulation of the deposition characteristics of micrometer-sized particles on the surface of photovoltaic modules, neglecting the morphological features of aerosol particles often leads to different degrees of error. For such studies, considering the influence of particle morphology on aerosol particle deposition is particularly important.
Based on previous studies, this paper introduces Ψ to quantify the morphology of aerosol particles and investigates the influence and mechanism of Ψ on the deposition process of aerosol particles near photovoltaic modules through numerical simulation. This study fills the gap in previous research on the neglect of the influence of particle morphology on drag forces in studying the deposition characteristics of aerosol particles on the surface of photovoltaic modules. Therefore, it has important guiding significance for developing dust removal strategies for photovoltaic modules.

2. Model and Process

2.1. Motion Equation

The deposition of aerosol particles near the photovoltaic (PV) module was the interaction result of the particle collision, airflow, and gravity. The deposition process of aerosol particles belongs to the typical gas–solid two-phase flow category, constrained by the continuity equation, momentum equation, and Reynold’s stress equation [24]. The continuity equation of the gas phase and solid phase can be expressed as Equations (1) and (2), respectively.
φ f ρ f u x x + φ f ρ f u y y = 0
where φf is the volume fraction of air, and ρf is the density (kg/m3) of air.
φ p ρ p u x x + φ p ρ p u y y = 0
where φp is the volume fraction of aerosol particles, and ρp is the density (kg/m3) of aerosol particles.
The momentum equations of the gas phase and solid phase were obtained by Equations (3) and (4), respectively.
t φ f ρ f v p + φ f ρ f v f v f = φ f p + τ p + φ f ρ f g + f
where vf is the velocity (m/s) of air, vp is the velocity (m/s) of aerosol particles, p is the pressure (Pa) of air-solid two-phases flow, τf is the stress tensor (N/m2) of air, τp is the stress tensor (N/m2) of aerosol particles, g is the acceleration of gravity (m/s2), and f is the force (N/m2) between air and aerosol particles calculated by Equation (3).
t φ p ρ p v p + φ p ρ p v p v p = φ p p p p + τ p + φ p ρ p g + f
where pp is the pressure of aerosol particles (Pa).
f = C D Re 24
where CD is the resistance coefficient calculated by Equation (5), and Re is the Reynolds number.
C D = 24 Re 10 α
where α is a dimensionless parameter related to the particle morphology [25].
The ψ is the ratio of the surface area of spherical particles to the actual surface area of particles with the same volume, which is used to quantify the morphology of aerosol particles. The relationship between α and ψ can be calculated by Equation (7), and ψ can be expressed by Equation (8).
α = 1 4 ψ d v d n d v d n 1 log 10 d v d n ψ
where dv is the equivalent diameter (m) of the equal volume sphere of aerosol particles, and dn is the equivalent diameter (m) of the equal area projection circle along the settlement direction of aerosol particles.
ψ = 4 π 3 V p 4 π 2 3 S p
where Vp is the actual volume (m3) of aerosol particles, and SP is the actual area (m2) of aerosol particles.
The typical turbulence model of gas–solid two-phase flow can use the standard k-ε equation, where the governing equations of k and ε are Equations (9) and (10), respectively.
t ρ k + x i ρ u i k = t μ + μ t σ k k x j + G k ρ ε
t ρ ε + x i ρ u i ε = t μ + μ t σ ε ε x j + C 1 ε ε k G k C 2 ε ρ ε 2 k
The k and ε in the standard k-ε model are basic unknowns, and the corresponding transport equations are Equations (11) and (12), respectively.
t ρ k + ρ u j ¯ k x j = x j μ + μ t Pr k k x j + P k + G b ρ ε Y M + S k
t ρ k + ρ u i ¯ k x j = x j μ + μ t Pr k ε x j + C 1 ε ε k P k + C 3 ε G b C 2 ε ρ ε 2 k + S ε
where Pk is the generation term of turbulent kinetic energy k caused by the average velocity gradient, Gb is the generation term of turbulent kinetic energy k caused by buoyancy, −ρε is the dissipation term, YM is the compressibility correction term, CεPk/k is the generating term of ε, CCεGb/k is buoyancy correction term, −Cρε2/k is the dissipation term, Sk and Sε are the source terms of k and ε equations, respectively.
Figure 1 shows the flowchart of the mathematical model.

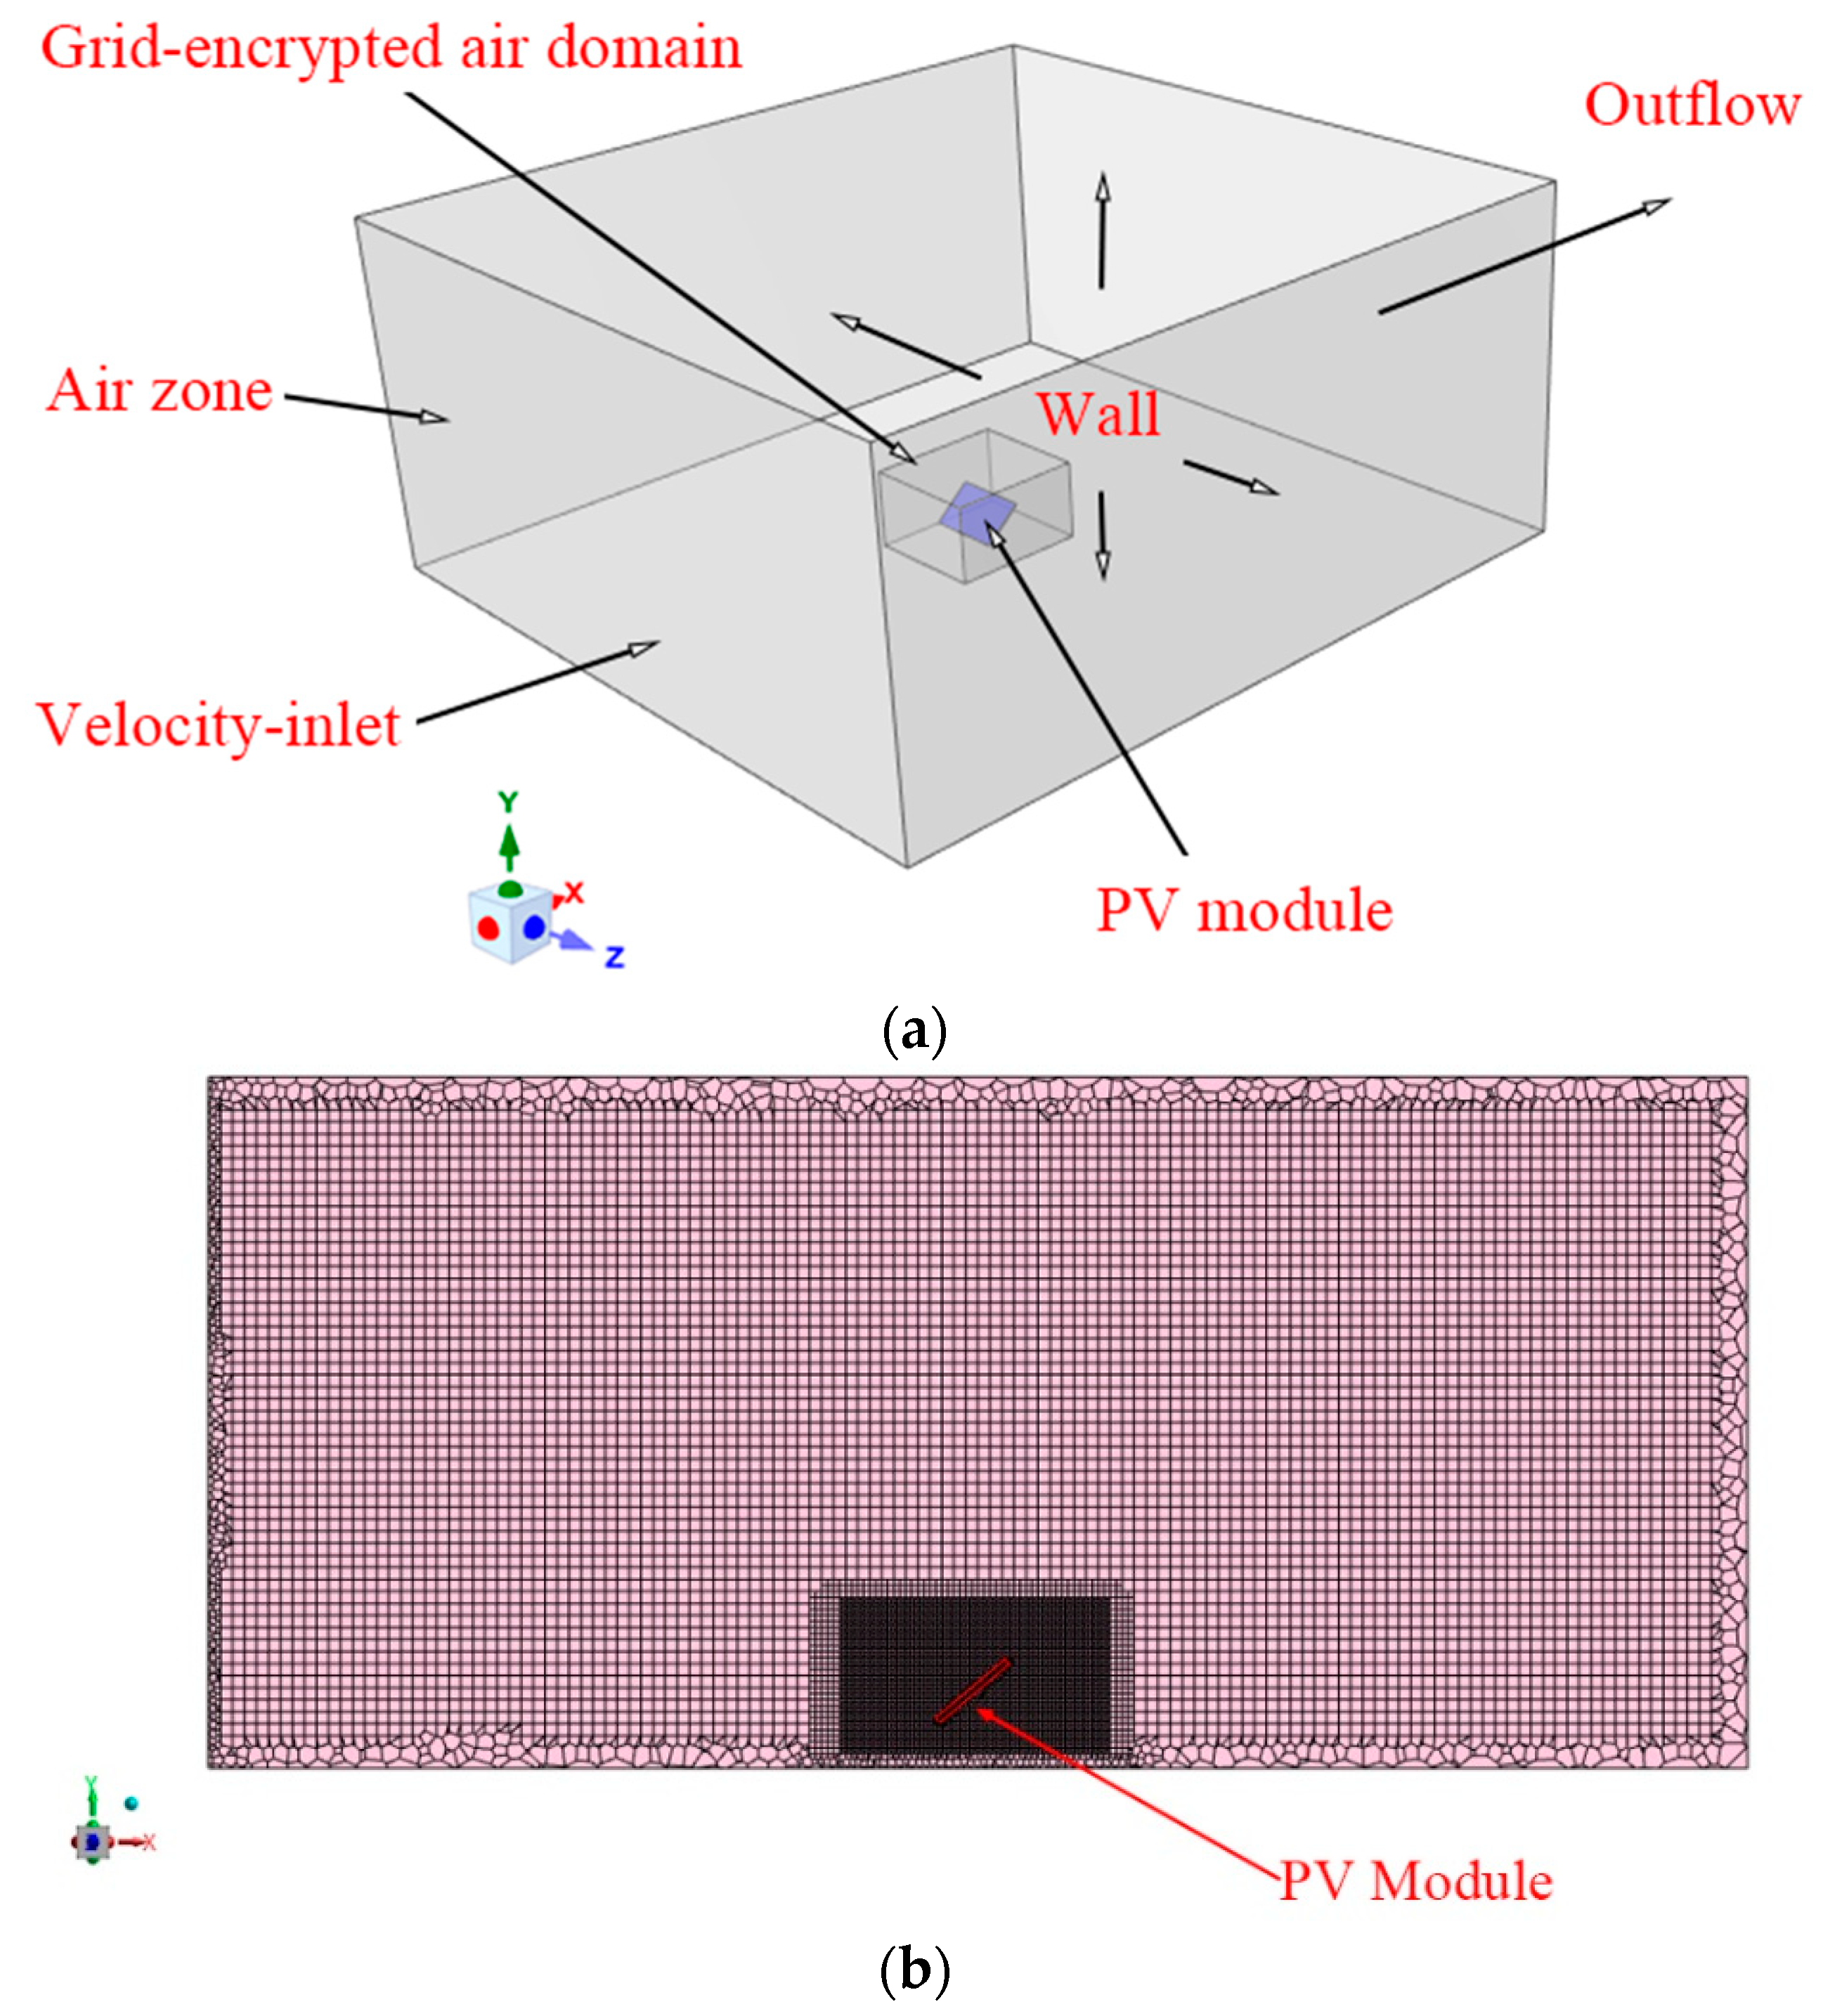
2.2. Physical Model and Mesh Division

The common specification photovoltaic (PV) module (1.580 m × 1.000 m × 0.020 m) on the market as the research object and the physical model in Figure 2a was established (the calculation domain size was 16.673 m × 15.980 m × 7.484 m). As shown in Figure 2b, since the complex distribution of the flow field around the photovoltaic (PV) module, the air domain (2.530 m × 2.870 m × 1.640 m) around the photovoltaic (PV) module was mesh encryption to ensure high model accuracy. The outer layer of the computational domain uses unstructured grids and elsewhere adopts the hexahedral grid.

2.3. Grid Independence Verification

To validate the mesh independence of the numerical model, three different mesh resolutions were employed for numerical simulation. The influence of mesh resolution was evaluated by comparing the results obtained from different grids. The flow velocity near the photovoltaic component was selected as the variable of attention. Figure 3 presents the simulation results of the three meshes. It can be observed that the impact of the mesh on the flow velocity is not significant when the grid density exceeds 1.3 million. This indicates that the mesh has met the convergence criteria. A grid resolution of 1.3 million was chosen for the numerical simulation, which meets the requirements for computational accuracy.

2.4. Process

2.4.1. Boundary Conditions

According to the actual structure and operating environment of the photovoltaic (PV) module, the windward side and surrounding calculation domain of the photovoltaic (PV) module were set as glass and air, respectively. From Table 1 [26], firstly, the dynamic viscosity of air, installation angle of the photovoltaic (PV) module, and inflow wind speed were taken as 1.84 × 10⁻⁵ Pa·s (annual average value of Hohhot), 40.48° (geographical latitude of Hohhot), and 3.50 m/s, respectively. Secondly, the d was taken as 10.00, 20.00, and 30.00 μm, and the Ψ was taken as 0.73, 0.76, 0.79, 0.82, 0.85, 0.88, and 0.91, respectively [27]. Thirdly, the air was regarded as an incompressible fluid due to the low inflow wind speed. Finally, the drag force of the airflow on the aerosol particles on the surface of the photovoltaic (PV) module is much lower than the maximum static friction force under the condition of low inflow wind speed, so the surface of the photovoltaic (PV) module was taken as a non-slip wall.

2.4.2. Simulation Process

(1)
Development of the simulation calculation of the velocity field and pressure field distribution around the photovoltaic (PV) module;
(2)
According to Table 2, perform 21 simulation calculations (combination of different d and different ψ) of aerosol particle sedimentation dynamics to analyze the variation of aerosol particle n (aerosol particles mass deposited on the per unit area surface of the photovoltaic (PV) module, kg/m2) with Ψ under different particle size conditions;
(3)
Analyze the influence mechanism of the Ψ on the deposition process of aerosol particles in the photovoltaic (PV) field combined with the distribution characteristics of the flow field around the photovoltaic (PV) module;
(4)
Disclose the influence law and mechanism of the Ψ for the distribution characteristics of aerosol particles on the surface of the photovoltaic (PV) module d = 20 μm.
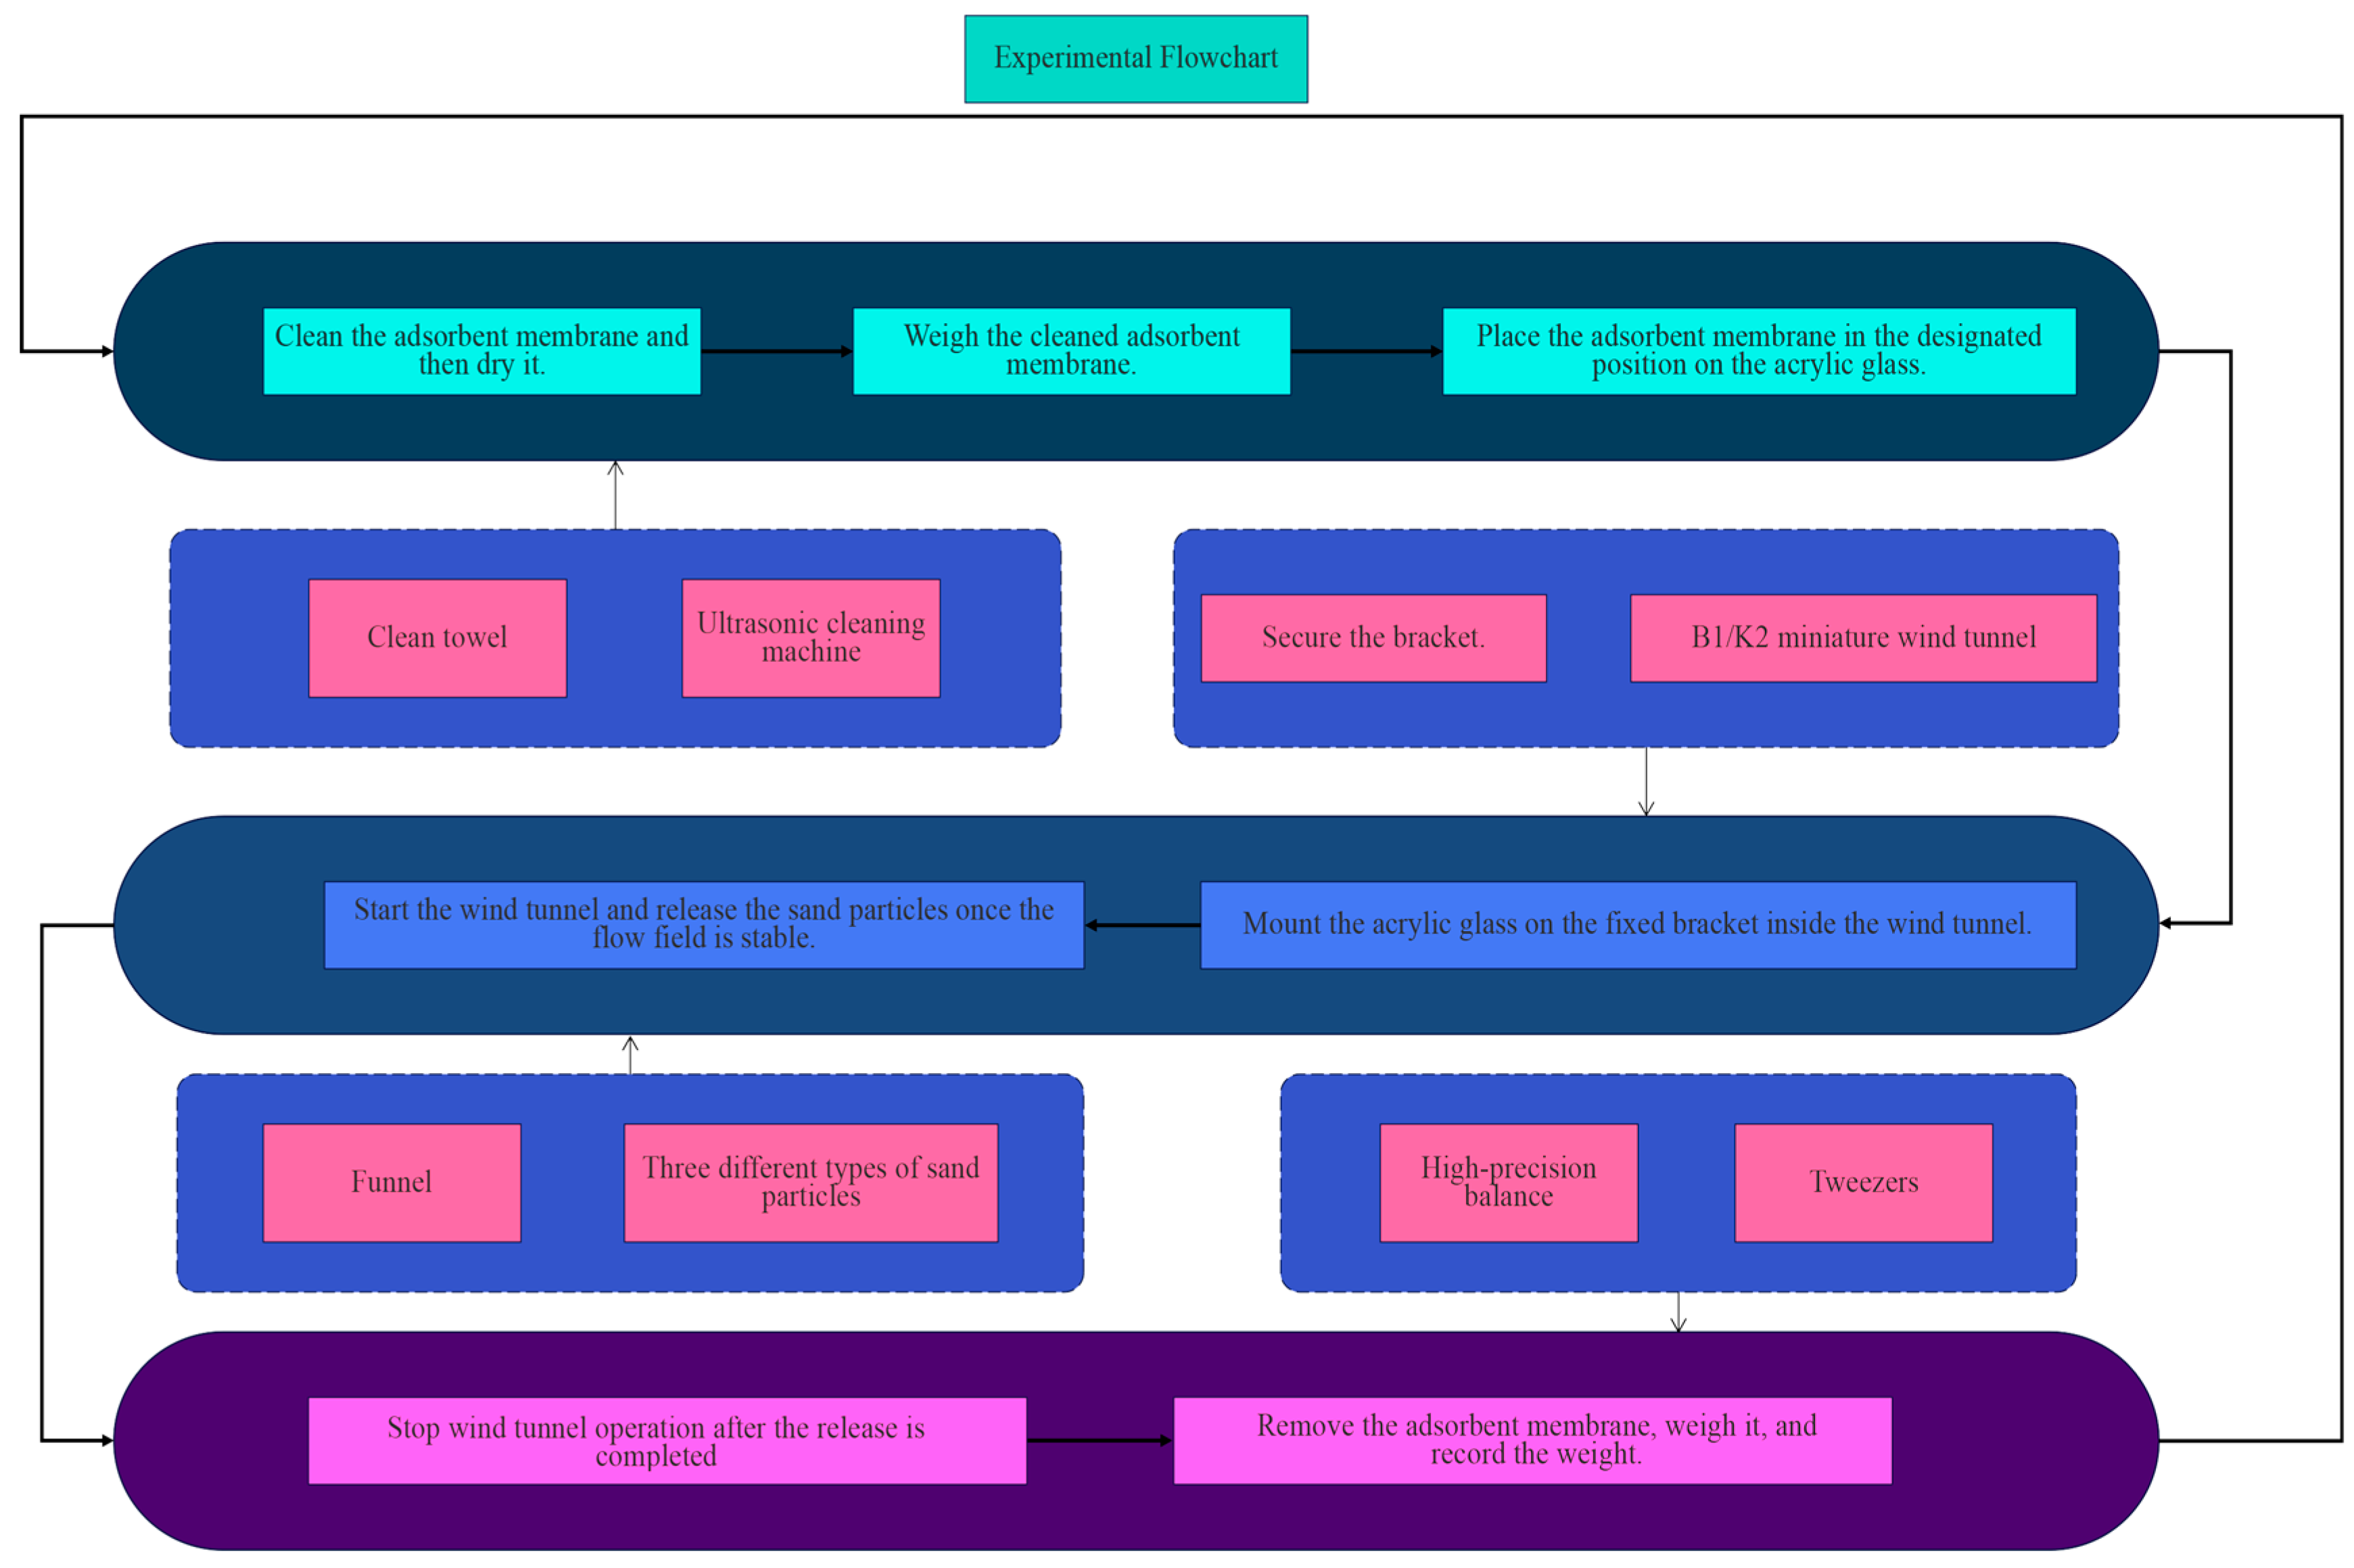
2.5. Trial Control

2.5.1. Test Bench and Wind Tunnel

To validate the accuracy of numerical simulation results, experimental research was conducted to investigate the relationship between the spherical coefficient and the deposition of aerosol particles on the surface of photovoltaic panels. The test setup comprises a fixed bracket holding a 40 cm × 40 cm acrylic organic glass plate. The glass plate, depicted in Figure 4, functions as the substrate for particle deposition and is inclined at a 40° angle with respect to the ground. The deposition surface is divided into 25 equal parts, organized into 5 sampling layers, with each layer further divided into 5 equal parts. Each region is equipped with a 5 cm × 5 cm adsorption film serving as the particle deposition surface. The adsorption film is securely fixed with transparent tape to minimize disturbances to the flow field near the deposition surface. To ensure stability during removal, a thin film is attached to the adhesive surface of the transparent tape to prevent shaking of the adsorption film. The surface of the acrylic organic glass is coated with black spray to enhance visualization of particle distribution on the plate surface. The experiment is conducted in a B1/K2 low-speed wind tunnel, as illustrated in Figure 5. The B1/K2 low-speed wind tunnel comprises a power section, rectifier section, contraction section, closed section, expansion section, and open section. The power section and rectifier section house the fan and rectifier grid, respectively, while the contraction section and expansion section exhibit non-uniform flow fields. The open section, connected to the external environment and susceptible to environmental wind fields, cannot be used as a test section. The closed section provides a consistent and uniform wind field, making it suitable for testing. The test setup is placed within this section, which has a cross-sectional area of 92 cm × 92 cm.

2.5.2. Particle Sample Acquisition

To investigate the impact of the sphericity coefficient of aerosol particles on their deposition and distribution patterns on a flat surface in numerical simulations, it is essential to carefully select suitable aerosol particles for the experiments. The chosen aerosol particles should possess uniform particle size, particle density, and a single variable—the sphericity coefficient. As the environments where these sand particles are typically found exhibit varying levels of humidity, it is crucial to thoroughly dry the sand particles prior to the experiment. Considering these factors, beach sand, desert sand, and riverbed sand were selected as the experimental samples. To account for the substantial humidity variations in their respective environments, the three types of sand particles were subjected to thorough drying before the experiment. Post-measurement, the density of the dried beach sand, desert sand, and riverbed sand were 2.64 g/cm3, 2.58 g/cm3, and 2.70 g/cm3, respectively. The particle densities of the three sand types were comparable and closely aligned with the simulated particle density. To ensure uniform particle size among the three experimental sand particle types, the dried sand particles were passed through a 500-mesh sieve, which had an aperture size of 30.8 μm. Approximately 1 kg of each sand particle type was collected after passing through the 500-mesh sieve. The sand particle samples collected after sieving were analyzed using a particle sphericity analyzer. Desert sand had an average sphericity coefficient of 0.78, riverbed sand had an average coefficient of 0.83, and beach sand had an average coefficient of 0.88.

2.5.3. Instrumentation

See Table 3 for the main specifications and technical parameters of the instruments involved in the test.

2.5.4. Aerosol Particle Deposition Test

Initially, immerse the 25 adsorption films in an ultrasonic cleaner for a duration of 30 min. Subsequently, remove and wipe them meticulously using a clean towel. Employ a high-precision balance to weigh each adsorption film and document the weight. Next, thoroughly clean the acrylic organic glass using a clean brush. Proceed with the placement of each adsorption film in its designated region. Subsequently, affix the acrylic organic glass plate, along with the installed adsorption films, onto the bracket within the closed section. Initiate the operation of the wind tunnel and allow the wind speed to stabilize at 3.5 m/s before commencing the particle release. Following the completion of particle release, halt the wind tunnel, detach the acrylic organic glass plate, and meticulously remove the adsorption films. Use a high-precision electronic balance to measure and document the weight of each adsorption film. Lastly, replicate the aforementioned steps for the subsequent set of experiments. The experimental procedure is shown in Figure 6.

3. Results and Discussions

3.1. Analysis of Numerical Simulation

3.1.1. Flow Field Characteristics

The calculation of pressure, momentum, turbulent kinetic energy, and turbulent dissipation rate utilizes a second-order upwind scheme to ensure high accuracy of the computational results. The under-relaxation factor adopts the default value in CFD. Steady-state calculation has been performed, and the following analysis was conducted after achieving convergence of the results:
From Figure 7, the air velocity near the surface of the photovoltaic (PV) module increased with the increase in vertical height, with a maximum value ranging from 3.33~3.89 m/s. and the pressure near the surface of the photovoltaic (PV) module changed by an opposite trend, ranging from 3.33~5.56 pa. The main reasons for the above phenomena were as follows:
(1)
The gas micro-mass flowing into the calculation domain would first reach the surface of the near-ground photovoltaic (PV) module and collide with it, then lose part of the kinetic energy to rapidly reduce the flow rate and cause retention;
(2)
With the extension of time, more and more gas micro-clusters would be retained on the surface of the near-ground side photovoltaic (PV) module, increasing the pressure of this region;
(3)
When the retention amount of gas micro-clusters reaches the threshold, the mainstream would be squeezed out and then be far away from the surface of the near-ground side photovoltaic (PV) module, and finally approximately tangentially across the surface of the far-ground side photovoltaic (PV) module;
(4)
When air micro-clusters pass through the far-ground side surface of the photovoltaic (PV) module, the collision probability is greatly reduced, which makes the airflow velocity larger and the air pressure lower.

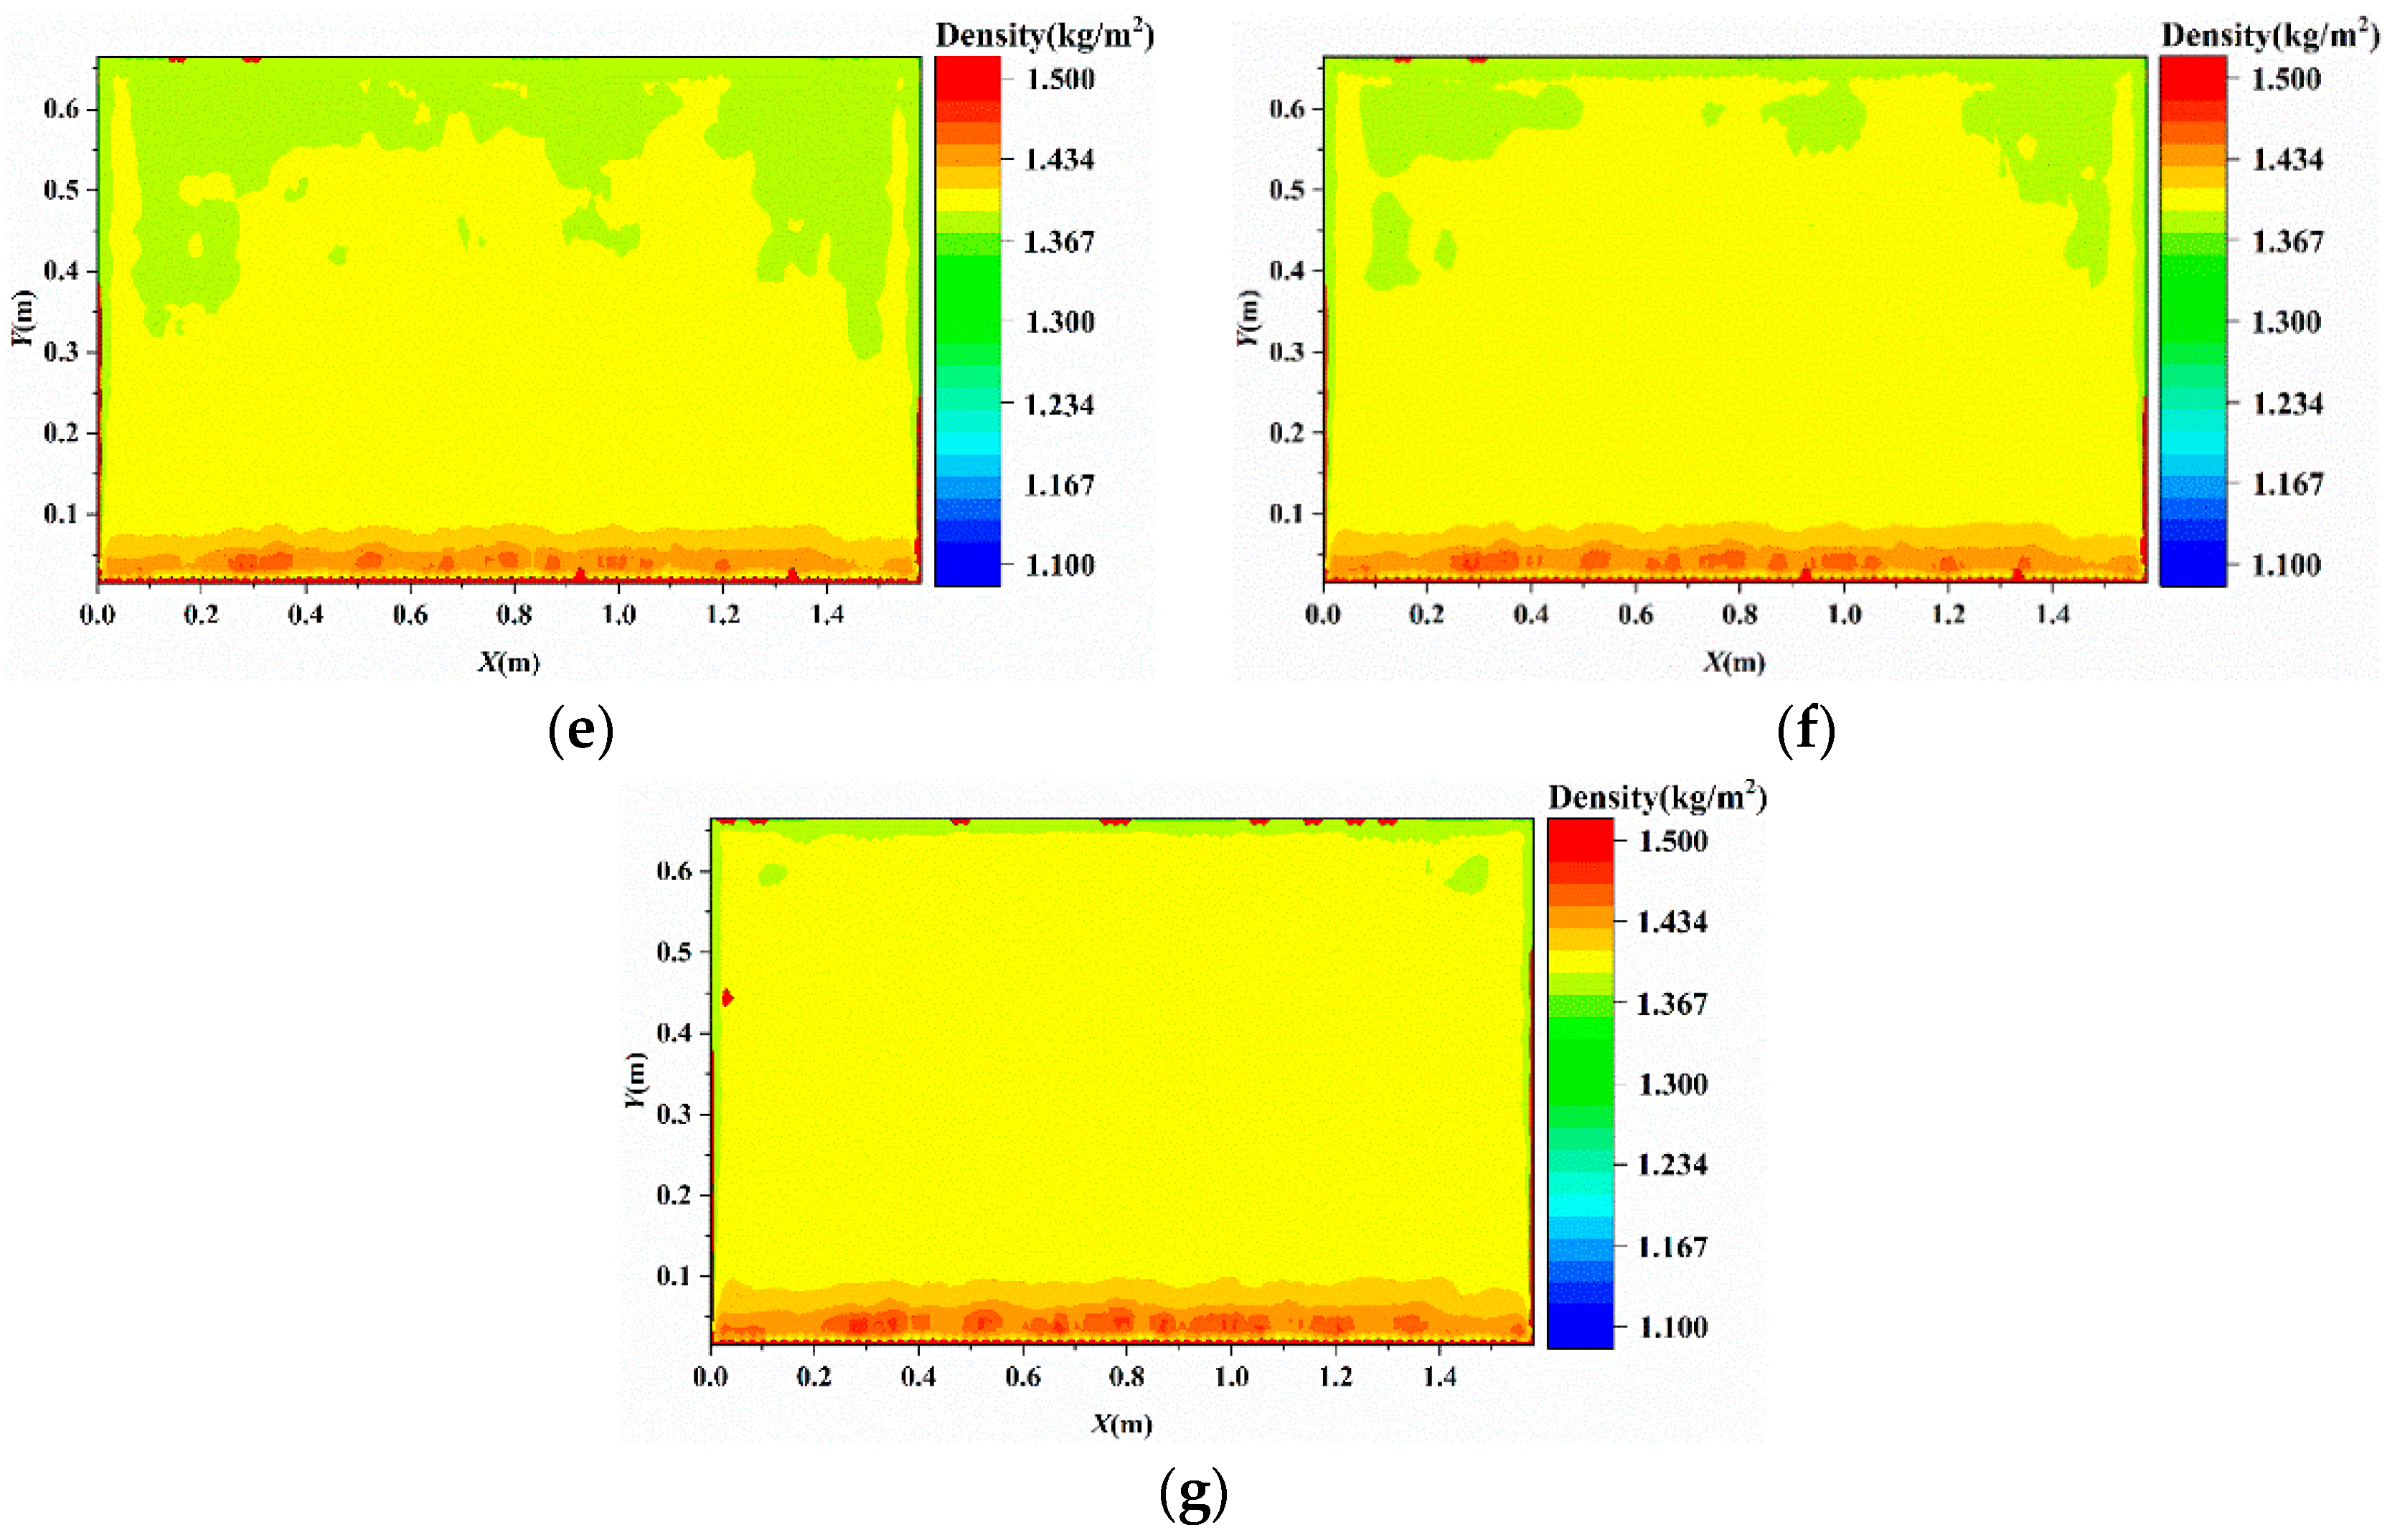
3.1.2. Influence of the Spherical Coefficient on the Distribution Characteristics of Aerosol Particles

The study focused on the relationship between surface particle settlement, accumulation, and the sphericity coefficient under three particle size conditions. We examined the distribution characteristics of aerosol particles on photovoltaic component surfaces, specifically using a particle diameter of d = 20 μm. Figure 8 demonstrates the possibility of establishing concentration distribution cloud maps of particles on the surface of photovoltaic components, utilizing simulation results. Figure 9 illustrates the particle distribution under experimental conditions, primarily indicating particle accumulation below the deposition surface, aligning with the conclusions derived from numerical simulation.

3.1.3. Influence of the Spherical Coefficient on the Deposition Amount of Aerosol Particles

From Figure 10, when ψ increases in the range of 0.73~0.91, n linearly increases in 3.8 × 10⁻⁴~7.2 × 10⁻⁴ kg/m2 (d = 10 μm), 3.8 × 10⁻⁴~7.2 × 10⁻⁴ kg/m2 (d = 20 μm), and 3.8 × 10⁻⁴~7.2 × 10⁻⁴ kg/m2 (d = 30 μm), respectively. Therefore, n changes with ψ by linear positive correlation law under the same d, and n changes with the increase of d by the law of increases first and then decreases under the same ψ. The main reasons for the above phenomena were as follows:
(1)
Combining Equations (5)–(8), it could be seen that the larger ψ was, the smaller the force between aerosol particles and the air was;
(2)
When the aerosol particles follow the gas flow, the larger the ψ was, the smaller the drag force of the airflow on the aerosol particles was, the longer the velocity response time was, and the greater the inertial force of the aerosol particles was;
(3)
When the airflow by-passes the surface of the photovoltaic (PV) module, the airflow direction and velocity would all be changed greatly. At this time, the larger the ψ was, the easier it was for the aerosol particles to break away from the constraints of the airflow and then deposit on the surface of the photovoltaic (PV) module;
(4)
The specific surface area of aerosol particles decreases with the increase of d, which leads to the decrease in the ratio of drag force to inertia force;
(5)
When d = 10 μm, the drag force would play a leading role for a single aerosol particle. At this time, the aerosol particles had a good follow-up to the airflow, resulting in relatively more aerosol particles by-passing the surface of the photovoltaic (PV) module, so n was relatively small;
(6)
When d gradually increased to 20 μm, the inertial force would play a dominant role for a single aerosol particle. At this time, the ability of aerosol particles to break away from the airflow was also enhanced, which led to a relative increase in n;
(7)
When d continues to increase to 30 μm, gravity would play a dominant role for a single aerosol particle. At the same time, relatively more aerosol particles settled to the ground before reaching the surface of the photovoltaic (PV) module, and only relatively few aerosol particles had deposited on the surface of the photovoltaic (PV) module.
Figure 11 presents a cloud map illustrating the distribution of accumulated particle deposition on the surface of the photovoltaic field for various particle sizes. It can be observed that with an increase in particle size, the area with a particle deposition of 1.4 kg/m2 on the ground is also increasing. Figure 11 illustrates that particles primarily settle on the near-ground side after reaching the component’s surface. This is due to the lower airflow velocity distribution on the near-ground side surface, causing air micro clusters to stagnate in this area. The drag force of the air causes the loss of kinetic energy for particles entering this area. Additionally, the near-ground side surface represents a high-pressure area where particles experience irregular motion due to Brownian forces. This motion increases the likelihood of collision with the component surface, leading to settlement and accumulation. The drag force of the air on the particles decreases gradually as the sphericity coefficient increases. Particles entering the high-pressure area will move upward under the influence of inertia. Additionally, larger sphericity coefficients result in greater particle displacement.
To enhance the validation of the numerical simulation results, it is crucial to provide a quantitative description of the total accumulation of particles on the adsorption membrane, as well as the accumulation in each individual region. Due to significant variations in the particle input amount, inlet cross-sectional area, and deposition area between the experiment and simulation, the settling particle accumulation is separately normalized for each case. The normalized accumulation of particles settling is termed the unit deposition rate, which can be computed using Equation (13) [28].
δ = q s q in × 100 %
where qs is the particle deposition density on the plate surface (kg/m2), which the calculated by Equation (14), and qin is the particle release density (kg/m2), which is calculated by Equation (15).
q s = n A 1
where n is the particle deposition amount on the plate surface (kg), and A1 is the deposition area (m2). In the numerical simulation, A1 is the windward area of the photovoltaic module, which is 1.64 m2. In the experiment, A1 is the sum of the areas of the 25 adsorption films, which is 0.25 m2.
q in = m A 2
where m is the particle release amount (kg), and A2 is the release area (m2). In the numerical simulation, A2 is the inlet area of the photovoltaic field, which is 119.53 m2. In the experiment, A2 is the inlet area of the wind tunnel power section, which is 12.56 m2.
The unit deposition rate of aerosol particles with a particle size of 30 µm was fitted by a regression correlation equation, as shown in Equation (16). The coefficient of determination of Equation (16) was close to 1, indicating that the regression correlation equation was reliable. According to Equation (16), the normalized deposition coefficient of aerosol particles with a particle size of 30 µm was 0.055%, and the intercept deposition rate was 4.2016%.
δ = 0.00055 ψ + 0.042   ( R 2 = 0.9948 )
Substituting the sphericity factors of three types of sand particles into Equation (16) allows us to obtain predicted values of the unit deposition rate for each corresponding sphericity factor. Substituting the predicted and experimental values of the three types of sand particles into Equation (17) enables us to determine the distribution of prediction errors for the regression equation. This process aids in verifying the reliability of the numerical simulation. Figure 12 demonstrates that under identical sphericity factor conditions, there is a consistent trend between the experimental and simulation results: the unit deposition rate increases as the sphericity factor increases. This indicates the reliability of the numerical simulation results. However, there are still some discrepancies between the simulation and experimental results, with a maximum error of 11.86%. The differences may be attributed to the following:
(1)
A deviation exists between the flow field inside the wind tunnel and the simulated flow field. The flow field from the dynamic section to the contraction section exhibits non-uniformity, with the latter section having a larger diameter, leading to a lower wind speed compared to the set value of 3.5 m/s in the closed section. Consequently, a discrepancy occurs between the particle deposition characteristics and the simulation, specifically within the dynamic and contraction sections;
(2)
To simplify the model and reduce computational complexity, the particle phase was directly defined as dilute in the simulation. The assumption was made that there is no collision or agglomeration of particles during their motion with the airflow. Additionally, in the simulation, the photovoltaic components were assigned a no-slip boundary condition, indicating that particles deposited on their surface do not experience secondary motion. However, in wind tunnel experiments, there is a possibility that a small number of particles may undergo secondary motion;
(3)
In the simulation, all particles were standardized to a size of 30 μm, assuming uniform particle size and sphericity factor. However, during the experiments, particles were selected using sieves, which may result in the inclusion of particles smaller than 30 μm.
ε = δ 2 δ 1 δ 1 × 100 %
where ε is the prediction error, subscript i denotes simulation or test, δ1 is the predicted value, and δ2 is the test value.

4. Conclusions

This study employs FLUENT numerical simulation to investigate the impact of the sphericity factor on the deposition of aerosol particles on the surfaces of photovoltaic components. It elucidates the mechanisms of particle deposition and accumulation while exploring the influence of the sphericity factor on particle distribution across the surfaces of the components through flow field analysis. The key findings are as follows:
(1)
Under the set boundary conditions, the airflow velocity near the surface of the photovoltaic component shows an increasing trend from bottom to top, with the lowest velocity on the near-ground side. The minimum value is 2.2 m/s, and the maximum value is 3.89 m/s. The air pressure near the surface of the photovoltaic component shows a decreasing trend from bottom to top, with the highest pressure on the near-ground side. The maximum value is 10 pa, and the minimum value ranges between 3.33–5.56 pa;
(2)
Irrespective of particle size, the accumulation of particles during settling is shown to increase as the sphericity factor increases;
(3)
After reaching the surface of the photovoltaic component, particles predominantly accumulate on the near-ground side. The maximum deposition amount of various spherical coefficients on the surface of the photovoltaic panel near the ground side is 1.5 kg/m2, with the minimum value ranging from 1.4~1.434 kg/m2. Nevertheless, with a gradual increase in the sphericity factor, the particle distribution becomes more dispersed and covers the entire surface.
The study was conducted in Hohhot City, which served as the research location. However, the small wind tunnel used in the experiments was not fully enclosed, which prevented us from controlling the influence of other factors unrelated to the study, such as local temperature and air humidity; this led to an error. Furthermore, the limited number of sampling sites may restrict the generalizability of the experimental results.

Author Contributions

Conceptualization, Y.Q. and C.W.; methodology, Y.Q.; software, C.W.; validation, Y.Q. and C.W.; formal analysis, Y.Q.; investigation, C.W.; resources, Y.W.; data curation, Y.Q.; writing—original draft preparation, Y.Q.; writing—review and editing, X.G.; visualization, C.W.; supervision, X.G.; project administration, X.G.; funding acquisition, Y.W. All authors have read and agreed to the published version of the manuscript.

Funding

This research was funded by the Natural Science Foundation of Inner Mongolia Autonomous Region (2021MS05030), Inner Mongolia University of Technology Student Innovation Experiment Project (2022033010), Special Fund for Central Guiding Local Science and Technology Development (2022ZY0048), Optical-electro-thermal coupling mechanism and performance optimization of concentrated photovoltaic modules: 2023LHMS05047.

Institutional Review Board Statement

Not applicable.

Informed Consent Statement

Not applicable.

Data Availability Statement

Laboratory data will not be uploaded to the database for the time being. If necessary, please email the corresponding author for consultation.

Conflicts of Interest

The authors declare no conflict of interest.

References

  1. Worrell, E.; Bernstein, L.; Roy, J.; Price, L.; Harnisch, J. Industrial Energy Efficiency and Climate Change Mitigation. In Renewable Energy; Routledge: London, UK, 2018; pp. Vol1_548–Vol1_568. [Google Scholar]
  2. Bloch, H.; Rafiq, S.; Salim, R. Economic Growth with Coal, Oil and Renewable Energy Consumption in China: Prospects for Fuel Substitution. Econ. Model. 2015, 44, 104–115. [Google Scholar] [CrossRef] [Green Version]
  3. Vithayasrichareon, P.; Riesz, J.; MacGill, I.F. Using Renewables to Hedge against Future Electricity Industry Uncertainties—An Australian Case Study. Energy Policy 2015, 76, 43–56. [Google Scholar] [CrossRef]
  4. Klitkou, A.; Coenen, L. The emergence of the Norwegian solar photovoltaic industry in a regional perspective. Eur. Plan. Stud. 2013, 21, 1796–1819. [Google Scholar] [CrossRef]
  5. Chen, Y.; Liu, Y.; Tian, Z.; Dong, Y.; Zhou, Y.; Wang, X.; Wang, D. Experimental Study on the Effect of Dust Deposition on Photovoltaic Panels. Energy Procedia 2019, 158, 483–489. [Google Scholar] [CrossRef]
  6. Chen, J.; Pan, G.; Ouyang, J.; Ma, J.; Fu, L.; Zhang, L. Study on Impacts of Dust Accumulation and Rainfall on PV Power Reduction in East China. Energy 2020, 194, 116915. [Google Scholar] [CrossRef]
  7. Comerio, A.; Tassinari Scarpat, T.; Knaip Krause, R.C.; Fernandes, M.R.; Muniz, P.R. Performance of Photovoltaic Generators under Superficial Dust Deposition on their Modules Derived from Anthropogenic Activities. Acta Sci. Technol. 2020, 43, e50101. [Google Scholar] [CrossRef]
  8. Wu, Y.; Wang, H.; Li, S.; Li, R.; Wang, J. Dust Deposition Impact on Power Generation Performance of Photovoltaic Modules. Distrib. Energy 2017, 2, 55–59. [Google Scholar] [CrossRef]
  9. Kaldellis, J.K.; Fragos, P. Ash Deposition Impact on the Energy Performance of Photovoltaic Generators. J. Clean. Prod. 2011, 19, 311–317. [Google Scholar] [CrossRef]
  10. Salamah, T.; Ramahi, A.; Alamara, K.; Juaidi, A.; Abdallah, R.; Abdelkareem, M.A.; Amer, E.-C.; Olabi, A.G. Effect of Dust and Methods of Cleaning on the Performance of Solar PV Module for Different Climate Regions: Comprehensive Review. Sci. Total Environ. 2022, 827, 154050. [Google Scholar] [CrossRef]
  11. Mondal, A.K.; Bansal, K. A Brief History and Future Aspects in Automatic Cleaning Systems for Solar Photovoltaic Panels. Adv. Robot. 2015, 29, 515–524. [Google Scholar] [CrossRef]
  12. Liu, S.J.; Yue, Q.; Zhou, K.; Sun, K. Effects of Particle Concentration, Deposition and Accumulation on Photovoltaic Device Surface. Energy Procedia 2019, 158, 553–558. [Google Scholar] [CrossRef]
  13. Lu, H.; Lu, L.; Zhang, L.Z.; Pan, A. Numerical Study on Polydispersed Dust Pollution Process on Solar Photovoltaic Panels Mounted on a Building Roof. Energy Procedia 2019, 158, 879–884. [Google Scholar] [CrossRef]
  14. Abderrezek, M.; Fathi, M. Experimental study of the dust effect on photovoltaic panels’ energy yield. Sol. Energy 2017, 142, 308–320. [Google Scholar] [CrossRef]
  15. Bayrakci, M.; Choi, Y.; Brownson, J.R.S. Temperature Dependent Power Modeling of Photovoltaic. Energy Procedia 2014, 57, 745–754. [Google Scholar] [CrossRef] [Green Version]
  16. Skoplaki, E.P.; Palyvos, J.A. On the Temperature Dependence of Photovoltaic Module Electrical Performance: A Review of Efficiency/Power Correlations. Sol. Energy 2009, 83, 614–624. [Google Scholar] [CrossRef]
  17. Xu, X.; Wei, J.; Wang, M.; Jiang, W.; Wen, Z.; Liu, Y. Influence of inclination angle on dust migration and settlement characteristics of excavation roadway. Environ. Sci. Pollut. Res. 2022, 29, 83304–83320. [Google Scholar] [CrossRef]
  18. Roy, S. Impact of Carbon Dust Particle Deposition and Partial Shadow of PV Array. In Proceedings of the 2014 IEEE PES Asia-Pacific Power and Energy Engineering Conference (APPEEC), Hong Kong, China, 7–10 December 2014; pp. 1–5. [Google Scholar] [CrossRef]
  19. Appels, R.; Lefevre, B.; Herteleer, B.; Goverde, H.; Beerten, A.; Paesen, R.; De Medts, K.; Driesen, J.; Poortmans, J. Dusting Efficiency of Photovoltaic Modules: A Review and Improvement Using Controlled Experiments. Sol. Energy 2013, 96, 283–291. [Google Scholar] [CrossRef]
  20. Shi, J.; Zhang, W.; Guo, S.; An, H. Numerical Modelling of Blasting Dust Concentration and Particle Size Distribution during Tunnel Construction by Drilling and Blasting. Metals 2022, 12, 547. [Google Scholar] [CrossRef]
  21. Yilbas, B.S.; Ali, H.; Al-Sharafi, A.; Al-Aqeeli, N.; Abu-Dheir, N.; Al-Sulaiman, F.; Khaled, M. Dust Accumulation on Photovoltaic Panels: Influence of Environmental Dust Concentration and Panel Tilt Angle. Sol. Energy Mater. Sol. Cells 2017, 17, 186–194. [Google Scholar] [CrossRef]
  22. Alquthami, T.; Menoufi, K. Soiling of Photovoltaic Modules: Comparing between Two Distinct Locations within the Framework of Developing the Photovoltaic Soiling Index (PVSI). Sustainability 2019, 11, 4697. [Google Scholar] [CrossRef] [Green Version]
  23. Klugmann-Radziemska, E. Degradation of electrical performance of a crystalline photovoltaic module due to dust deposition in northern Poland. Renew. Energy 2015, 78, 418–426. [Google Scholar] [CrossRef]
  24. Bolio, E.J.; Sinclair, J.L. Gas turbulence modulation in the pneumatic conveying of massive particles in vertical tubes. Int. J. Multiph. Flow 1995, 21, 985–1001. [Google Scholar] [CrossRef]
  25. Heiss, J.F. The Effect of Orientation and Shape on the Settling Velocity of Non-Isometric Particles in a Viscous Medium. Chem. Eng. Prog. 1952, 48, 133–140. [Google Scholar]
  26. Qiu, Y.; Guo, X.; Wang, Y.; Tian, R.; Wei, C.; Liu, S. Deposition Characteristics of Aerosol Particles on the Surface of PV Modules: Numerical Study. Adv. Theory Simul. 2022, 6, 2200750. [Google Scholar] [CrossRef]
  27. Ferrada, P.; Olivares, D.; del Campo, V.; Marzo, A.; Araya, F.; Cabrera, E.; Llanos, J.; Correa-Puerta, J.; Portillo, C.; Román Silva, D.; et al. Physicochemical Characterization of Soiling from Photovoltaic Facilities in Arid Locations in the Atacama Desert. Sol. Energy 2019, 187, 47–56. [Google Scholar] [CrossRef]
  28. Yu, L.; Pan, Y.; Wu, Y. Research on Data Normalization Methods in Multi-Attribute Evaluation. In Proceedings of the 2009 International Conference on Computational Intelligence and Software Engineering, Wuhan, China, 11–13 December 2009; pp. 1–5. [Google Scholar] [CrossRef]
Figure 1. Flowchart of the mathematical model.
Applsci 13 08658 g001
Figure 2. (a) Physical model. (b) Mesh division (Side view).
Applsci 13 08658 g002
Figure 3. Comparison of different grid results.
Applsci 13 08658 g003
Figure 4. (a) Test stand. (b) Sampling layer division diagram.
Applsci 13 08658 g004
Figure 5. (a) Wind tunnel structure. (b) Test stand.
Applsci 13 08658 g005
Figure 6. Experimental procedure flowchart.
Applsci 13 08658 g006
Figure 7. (a) Velocity field. (b) Pressure field.
Applsci 13 08658 g007
Figure 8. Distribution cloud chart of aerosol particles on the surface of photovoltaic (PV) modules. (a) Ψ = 0.73. (b) Ψ = 0.76. (c) Ψ = 0.79. (d) Ψ = 0.82. (e) Ψ = 0.85. (f) Ψ = 0.88. (g) Ψ = 0.91.
Applsci 13 08658 g008aApplsci 13 08658 g008b
Figure 9. Improved distribution map based on experiments.
Applsci 13 08658 g009
Figure 10. Distribution of particle deposition.
Applsci 13 08658 g010
Figure 11. Cloud map of surface particle deposition in photovoltaic field under different particle sizes. (a) d = 10 μm; (b) d = 20 μm; (c) d = 30 μm.
Applsci 13 08658 g011
Figure 12. Error distribution chart.
Applsci 13 08658 g012
Table 1. Boundary conditions.
TypeValue
Inflow wind speed3.50 m/s
Air density1.239 kg/m3
Dynamic viscosity of air1.84 × 10−5 Pa·s
Aerosol particle density2650.00 kg/m3
d10.00, 20.00, 30.00 μm
Ψ0.73~0.91
Volume fraction of aerosol particle5.00 × 10−3%
Inlet boundaryVelocity-inlet
Outlet boundaryOutflow
Wall boundaryNon-slip wall
Table 2. Comprehensive test design table.
ψ
0.730.760.790.820.850.880.91
d (μm)10.00Test-1Test-2Test-3Test-4Test-5Test-6Test-7
20.00Test-8Test-9Test-10Test-11Test-12Test-13Test-14
30.00Test-15Test-16Test-17Test-18Test-19Test-20Test-21
Table 3. Main specifications and technical parameters of the instrumentation.
NameModelMeasurement RangePrecision
High-precision electronic balanceXPR504SIAC510 g±0.0001 g
Hot-line anemometer405i0~30 m/s±0.1 m/s
Disclaimer/Publisher’s Note: The statements, opinions and data contained in all publications are solely those of the individual author(s) and contributor(s) and not of MDPI and/or the editor(s). MDPI and/or the editor(s) disclaim responsibility for any injury to people or property resulting from any ideas, methods, instructions or products referred to in the content.

