Abstract
Under uniaxial compression, the soil mass may be subjected to transverse tensile splitting or swelling failure. This failure is caused by the tensile stress in the soil; that is, part of the vertical stress is converted into lateral stress. In order to investigate the factors that influence the stress transfer phenomenon, the failure mode of the soil mass can be predicted more accurately, and the internal force of the soil mass can be analyzed. This paper begins with the definition of the stress conversion coefficient and measures it by combining macroscopic mechanical properties with microscopic structure analyses. By carrying out a uniaxial compression test on a large soil sample, an equivalent tensile test was carried out according to the equivalent transverse displacement measured using the S-type tension sensor in order to explore the change law of the stress conversion coefficient. The arrangement and distribution of pores and particles at different positions in the samples before and after compression were further observed and analyzed using the SEM test to explore the formation mechanism of the stress transition phenomenon, and the following research results were obtained: (1) The stress conversion coefficient of the soil under compression is not invariable. An increase in the loading rate and a decrease in water content cause brittleness, and the stress conversion coefficient of the soil decreases. (2) Shear failure is more likely to occur in large samples of brittle soils under uniaxial compression. (3) The tensile stress in the compressed soil is caused by the invasion and extrusion of soil particles.
1. Introduction
Many uniaxial and triaxial tests have shown that the failure mode of soil not only comprises shear failure but also tensile failure. Under the action of unidirectional stress, the soil mass produces transverse deformations, such as splitting or bulging failure. This deformation is caused by the lateral tension stress in the soil body; that is, the axial stress in the soil body appears as a stress conversion phenomenon, in which part of the axial stress converted into lateral stress is applied to the soil body [1,2]. Taylor [3] observed that in conventional triaxial compression tests, loose sand deforms mainly via drum deformation, while dense sand fails due to the shear plane. Since then, an increasing number of tests have demonstrated that the failure modes of undisturbed and remodeled soils under low confining pressures are significantly different from those under high confining pressures. Undisturbed soils fail due to shear planes at low confining pressures and deform via tensile deformation at high confining pressures [4,5]. The soil of different materials also exhibits different deformations under the same conditions [6]. Different stress conditions and different materials may lead to changes in failure forms, which may indicate different stress conversion coefficients under different conditions.
The theory of tensile stress control for material failure was first put forward by Galilei [7]. However, when Morcullen’s theory came out, people tended to regard the failure mode of the soil as a shear failure. Regardless of the type of failure mode that the soil material produces, it is assumed that the tensile strength of the soil is very small or almost zero, and the shear failure mode was adopted for analysis. The fact or possibility that tensile failure occurs earlier than shear failure is generally considered in the process of investigating whether the soil material experiences shear failure. It also makes the existing equation of the Mohr envelope insufficient regarding its fit to the Mohr circle under a stretched state. Both the parabolic envelope and the hyperbolic envelope are simply fitted, and the failure is still attributed to the relationship between normal stress and shear stress. Therefore, it is of great significance to explore tensile failure and stress transfer in soil materials for the development of strength theory.
The study of the stress conversion coefficient can better determine the Mohr envelope equation of rock and soil masses and more accurately predict the strength of rock and soil masses; this can serve practical engineering. However, how does the stress transfer phenomenon occur, and how does the stress transfer coefficient change? Based on the uniaxial compression test and equivalent tensile test of large samples combined with microscopic analysis, the mechanisms, influencing factors, and measuring methods of the stress conversion of soil under compression are explored in this paper. This provides an important foundation for a better judgment of the soil’s failure mode and for improvements in the soil’s strength criterion.
2. Measurement of the Stress Conversion Coefficient
2.1. Test Material
Granite residual soil, which is a typical regional special soil, was selected from a hillside located in the Zhuhai High-Tech Zone. The standard water content of the sample was 18%, the height was 250 mm, the diameter was 200 mm, and the force of 5 kN was divided by three times the compaction. The basic physical and mechanical parameters and the gradation of the samples are shown in Table 1 and Figure 1.

Table 1.
Test results of the physical and mechanical parameters of the soil.
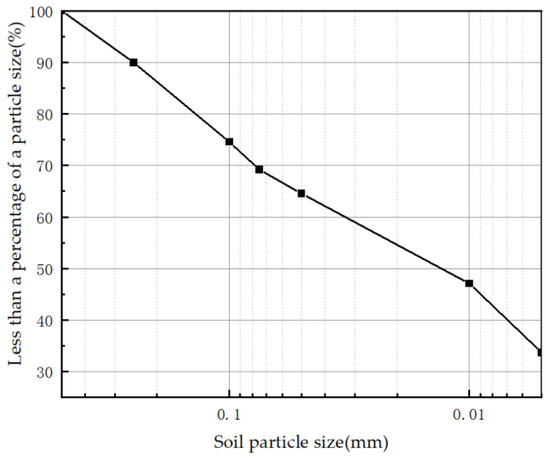
Figure 1.
The soil gradation curve.
In order to obtain a regular large cylindrical sample, this test was prepared following the three-valve cylindrical cylinder used in the triaxial test sample’s preparation, and a PVC pipe was used as the large sample preparation sleeve. The sleeve’s parts are shown in Figure 2. As observed in Figure 2, a PVC pipe with an inner diameter of 20 cm was used for the sample’s preparation. During sample preparation, the soil mass was placed into the pipe and compacted to obtain a large sample of homogeneous cylindrical soil mass with a diameter of 20 cm. Since the soil of the sample was relatively loose, a board or iron plate with the same diameter of 20 cm was placed at the bottom surface of the upper and lower parts of the casing to ensure the flatness of the bottom surface of the soil. When making the tensile sample, it was also necessary to place a PVC pipe adapter of 20 to 25 cm above the casing (as shown in Figure 2b) in order to create a cylinder with different diameters and to use it as a fixture in the tensile test.
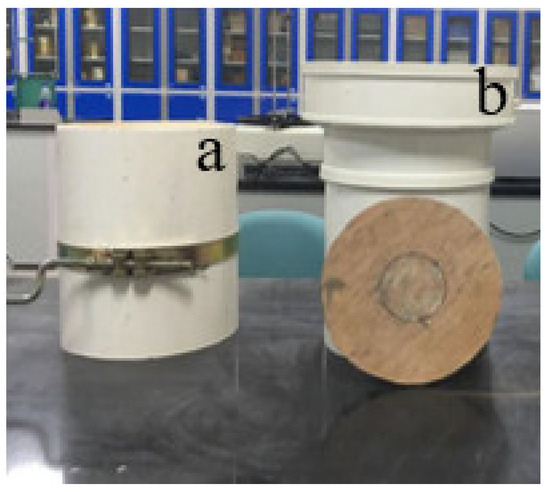
Figure 2.
Large sample preparation tools: (a) uniaxial compression sample preparation mold; (b) tensile test sample preparation mold.
In terms of the conventional triaxial test and uniaxial compression test, the sample used in the uniaxial compression test was placed into a cylinder with a diameter of 20 cm and a height of 25 cm. It was compacted into three layers, and the compaction load of each layer was 5 kN. When producing the sample for the direct tensile test, the same MTS universal material machine was used for the three layers of compaction, and the pressure applied by compaction was consistent. In order to reduce the stress concentration caused by the fixture during the stretching process, the sleeve of the stretching sample comprised the structure of “PVC pipe + adapter”, and the soil sample after production comprised a soil sample with an upper radius of 25 cm and a lower radius of 20 cm.
2.2. Experiment Content
In this paper, the uniaxial compression test and equivalent tensile test were carried out on large samples with different loading rates and water content to measure the variation law of the conversion coefficient of samples under the influence of different factors. At the same time, the SEM experiment was combined with the microanalysis of differently positioned compressed soil to explore the mechanism of stress conversion in the soil. The specific experimental contents are as follows: (1) Uniaxial experiments with different loading rates were carried out on granite residual soil samples that had 18% water content; were 250 mm high and 200 mm in diameter; and exhibited a 5 kN compaction load. The loading rates were 0.3 mm/min, 0.6 mm/min, 1.5 mm/min, 3 mm/min, 10 mm/min, and 15 mm/min. (2) Uniaxial experiments with different loading rates were carried out on granite residual soil samples with a height of 250 mm, a diameter of 200 mm, and a compaction load of 5 kN. The moisture content of the sample is 10%, 14%, 18%, 22%, and 26%. (3) SEM experiments were carried out on soil samples before and after compression and on soil samples at different positions after compression; moreover, microscopic analysis was conducted to explore changes in the internal particles and pores.
2.2.1. Definition of the Stress Conversion Coefficient
Under unidirectional compression, any soil mass tends to expand towards the free surface. At this time, the length of the soil mass shortens in the direction of the maximum principal stress and lengthens in the direction of other principal stress, which manifests as a “flattened” state at a macrolevel. We assume that there is a square cylindrical soil body with length, width b, and height h, and the first principal stress, second principal stress, and third principal stress are σ1, σ2, and σ3, respectively. In this stressed state, the soil’s height gradually decreases, and the change in height is δ1; thus, soil deformation in the direction of σ1 is δ1. Similarly, the deformation of soil in the other two principal stress directions is δ2 and δ3.
Due to the “squishing” state of the soil mass, under the three-way stress state, the pressure on the soil mass in one direction inevitably causes the soil mass to bulge in the other two directions. In this case, it can be considered that there is tensile stress in this direction, which is caused by compressive stress in the other directions. For example, the tensile stress caused by σ1 in the direction of σ2 is called σ12t. The force state of the soil mass of the square column is shown in Figure 3:
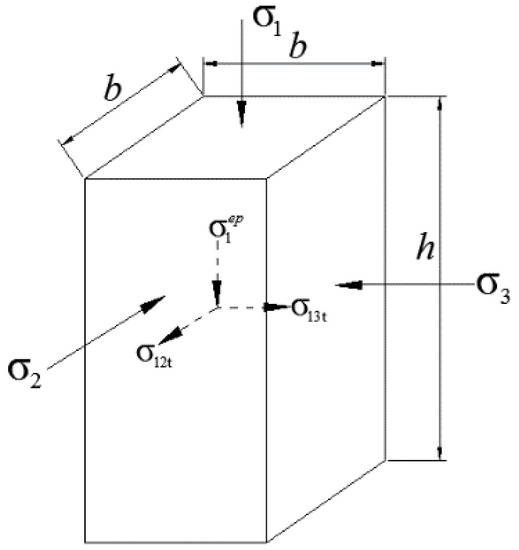
Figure 3.
Square column soil under compression.
Tang believes that viscoelastic plastic geotechnical materials are not ideal elastic materials [2]. In the deformation and failure processes under principal stress, energy is dissipated to the outside via the closure of micro-cracks, internal friction, and the damage evolution of micro-defects and partial plastic compaction deformation, and it is stored in the material by means of elastic strain energy and partial plastic strain energy [5]. The dissipated energy is dissipated rather than converted into lateral deformation so that the remaining stress causes transverse swelling tendencies. Therefore, part of axial stress σ1 is consumed, and only the residual stress causes a transverse swelling trend.
That is,
where ξ is the stress conversion coefficient: 0 < ξ < 1. This coefficient represents the ability of the soil to convert axial pressure into radial tensile stress under compression. The greater the ξ, the greater the radial tension of the soil under the same pressure.
If the triaxial test adopts a rectangular cylindrical rock sample with a high h and wide b, as shown in Figure 3, axial displacement δ1 is generated, resulting in the transverse tensile stress of σ2 and σ3 as -σ12t and -σ13t (“-” indicates the tensile stress) and the transverse displacement of σ2 and σ3 as δ12 and δ13, respectively. According to Betty’s swap theorem in elasticity, the following is the case.
If soil comprises isotropic materials, Equation (2) is substituted into Equation (3), and we can observe the following:
where is the operation carried out by the first principal stress, and is the operation carried out by the tension stress generated by it.
2.2.2. Methods of Measuring the Stress Conversion Coefficient
According to Equation (4), the stress conversion coefficient can be expressed as the ratio of operations carried out by internal tensile stress to the operations carried out by axial stress. In this paper, the uniaxial compression of large samples and its equivalent tensile test are used to calculate the measured stress conversion coefficient.
- (1)
- Uniaxial compression experiment
In this study, the uniaxial compression experiment used an MTS universal material machine; for the corresponding large sample diameter size, the uniaxial compression instrument adopted a diameter of 20 cm and upper and lower pressure discs; moreover, the maximum control accuracy of the forward speed of the instrument beam is 0.1 mm/min, the range of the pressure sensor is −100 kN to 100 kN, and the precision of the displacement sensor is 0.01 mm. During the test, the system automatically collects experimental data and displays it on the computer in real time.
- (2)
- Tensile strain measuring system
The strain measurement system consists of an S-type strain sensor and a data acquisition system. As shown in Figure 4, the S-type tension strain sensor consists of an S-type tension meter and a rubber ring. After production, the tension strain sensor is placed on the sample and connected to the data acquisition system. When the specimen is stretched in the process of compression, the radius increases, and the rubber ring expands; moreover, the S-type tension sensor tightens. Since rubber is an elastic material, after knowing the elastic modulus of the rubber ring, the perimeter of the section where the sensor is located can be converted by reading the tension of the S-type tension meter at this time, and the tensile strain on the section can be obtained using conversion.
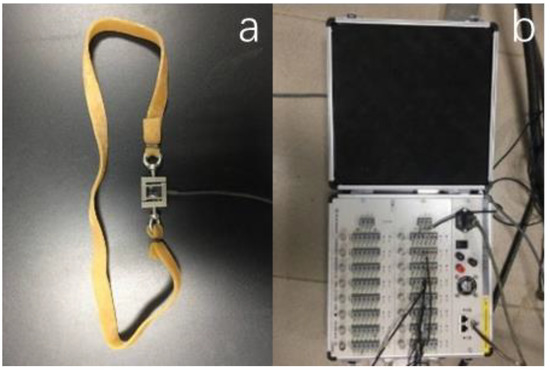
Figure 4.
Tensile strain test system: (a) S-type tension meter; (b) strain measurement and analysis system.
The S-type tension meter used in the test has a measurement range of 10 kN and an accuracy of 0.01 N. The elastic moduli of the three rubber rings are 0.0053 N/mm, 0.0041 N/mm, and 0.0059 N/mm. Because the k value of the rubber ring is not large, the lateral compression force caused by the rubber ring on the soil is not large. In the test, the pressure of the rubber ring is about 1/20 of the internal tensile stress at the peak stress of the soil; thus, the influence of the rubber ring on the soil can be ignored. In order to explore the influence of the measuring device on the sample, two large samples with the same sample production parameters were carried out at the same loading rate, and a control test was conducted on the soil without the tension strain sensor installed and after the sensor was installed. The experimental results are shown in Figure 5.
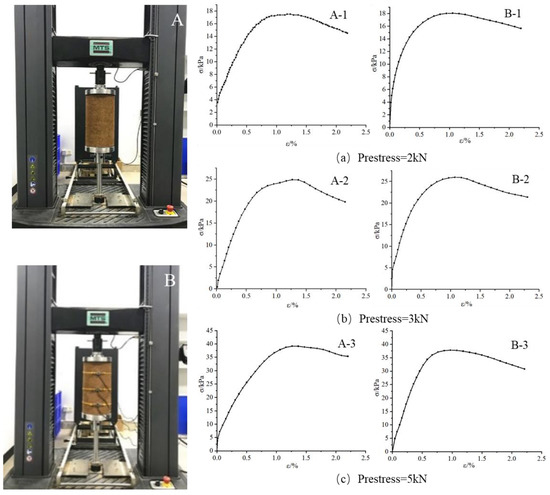
Figure 5.
Influence test of the S-type tension sensor in the uniaxial experiment. (A) The figure shows the experiment and data without the S-type tension sensor; (B) the figure shows the experiment and data with the S-type tension sensor.
In Figure 5, A-1, A-2, and A-3 are samples without tension strain sensors installed under different compaction loads, while B-1, B-2, and B-3 are samples equipped with tension strain sensors under different compaction loads. By observing the stress–strain curves of the two samples under the same compaction load, it can be observed that whether the tensile strain sensor is installed has little influence on the results of the samples.
- (3)
- Equivalent tensile test
The S-type tension sensor measured lateral deformations in all parts of the soil sample, and the relationship between the equivalent radius and time t was obtained. Then, the relationship between the equivalent tension strain () and time t was obtained, and lateral strain rate k2 was obtained (Figure 6).
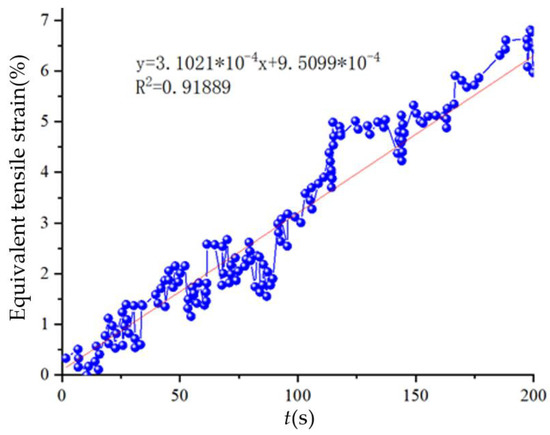
Figure 6.
The variation in equivalent strain with time.
As observed in Figure 6, with the soil sample under compression, its transverse tensile strain presents a monotonically increasing trend. If the curve of the tensile strain and time is fitted with a straight line through the origin, function y = kx with a correlation coefficient, R2, that is greater than 0.95 can be obtained. The radial tensile strain is caused by the tensile stress in this direction. Therefore, it can be considered that the soil sample generates certain tensile stress under the action of compressive stress, and this tensile stress causes the soil to be uniformly stretched at a velocity of k until the transverse strain of the soil reaches the peak εmax (εmax is 0.065 in Figure 6).
By carrying out a uniaxial compression experiment with loading rate k1, the stress–strain curve can be obtained, as shown in Figure 7a. Meanwhile, transverse strain rate k2 can be obtained using the S-type tension sensor, as shown in Figure 6. Therefore, a tensile test with a strain rate of k2 was designed, and the stress–strain curve was obtained, as shown in Figure 7b. In Figure 7a, the integral before the stress–strain curve reaches its peak in the uniaxial compression test and comprises the operation carried out by axial stresses. In the equivalent tensile test, the integral before the strain that reaches ε2 is the operation carried out by transverse tensile stresses (Figure 7b). Here, ε2 is the transverse strain when the axial strain reaches ε1 in the uniaxial compression test. The operation carried out by internal tensile and axial stresses is substituted into Equation (4) to calculate the stress conversion coefficient.
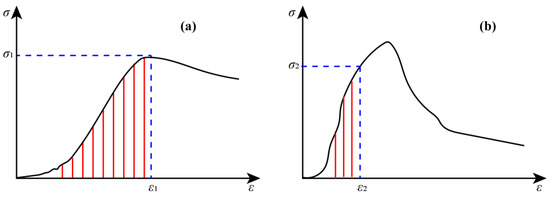
Figure 7.
Operations carried out by principal stress and operations carried out by lateral stress: (a) stress–strain curves and operations carried out for uniaxial compression tests; (b) stress–strain curve and operations carried out for the equivalent tensile test.
3. Experimental Results and Discussion
3.1. Effect of the Loading Rate on the Conversion Coefficient
The axial stress–strain curves of soil under different loading rates are shown in the figure below. As observed in Figure 8, the samples all show obvious strain-softening characteristics in the uniaxial compression test, and axial stress decreases continuously after reaching the peak. The peak strength of the sample varies within the range of 90 kPa to 60 kPa, and the corresponding strain (hereinafter referred to as the peak strain) is between 0.02 and 0.06 when the stress reaches its peak. As observed in Figure 8, with the change in loading speed, the peak strain, elastic modulus, and peak strength of the stress–strain curve have certain changes.
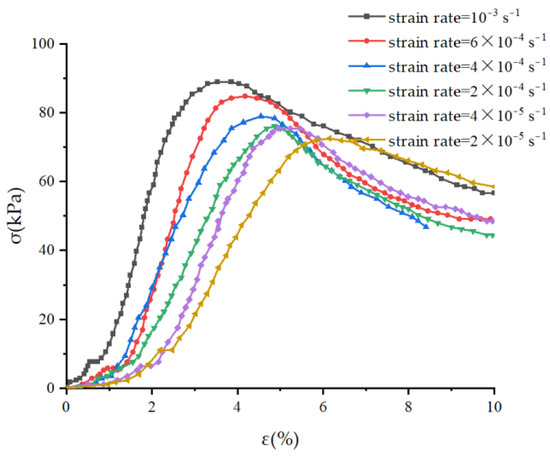
Figure 8.
Stress–strain curves of soil under different strain rates.
With the increase in strain rate, the peak strength also shows an increasing trend. However, the relationship between the peak strength and strain rate is nonlinear. When the strain rate is less than 2 × 10⁻⁴, the peak strength exhibits little change with respect to the strain rate. However, when the strain rate is greater than 2 × 10⁻⁴, the peak strength increases obviously with an increase in strain rate. This phenomenon is similar to the test results obtained by Li et al. [8] in rock samples. It can be considered that the peak strength of soil also increases with an increase in strain rate. When the loading rate is within a low range, the compressive stress of soil samples is equivalent to static stress, and an increase in the loading rate has no obvious influence on the mechanical properties of soil. In this range, static loading tests are carried out on the samples. When the loading rate exceeds the range of the static loading test, the compressive stress on the soil mass can no longer be regarded as static stress. The influence of the loading rate on the mechanical properties of the sample begins to show. At this time, the peak strength of the soil mass gradually increases with an increase in the loading rate.
The average peak strain of the sample when it reaches the peak stress is tested and the change in the average elastic modulus in the pre-peak elastic stage along with the strain rate is calculated, as shown in Table 2 and Table 3. Its variation law is shown in Figure 9. It can be observed in the figure that similarly to the variation law of peak stress, the peak strain, elastic modulus, and other parameters have little change with respect to the static loading interval (the interval with a strain rate of less than 2 × 10⁻⁴). After exceeding this interval, these parameters begin to change significantly with an increase in strain rate. The peak strain decreases with an increase in strain rate, and the elastic modulus increases with an increase in strain rate.
Table 2.
Energy proportion of each sample at different strain rates.
Table 3.
Stress conversion coefficient and final failure mode of each sample at different strain rates.
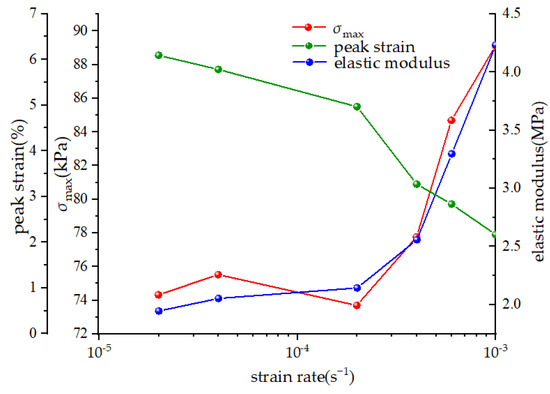
Figure 9.
Stress characteristics of soil under different strain rates.
The variation characteristics of soil samples are different with respect to different loading rate intervals. The mechanical properties of soil samples change little with respect to the loading rate during static loading intervals. In the dynamic loading interval, with an increase in loading rate, the peak stress and elastic modulus also increase, and the peak strain decreases. In the axial stress–strain curve, the peak is forward-facing, the pre-peak stress section becomes steeper, and the peak value increases. As observed in Figure 10, with a constant increase in strain rate, the stress conversion coefficient decreases gradually. When the strain rate is less than 4 × 10⁻⁵, the failure mode comprises tensile failure, and when the strain rate is greater than 6 × 10⁻⁴, the failure mode comprises shear failure.
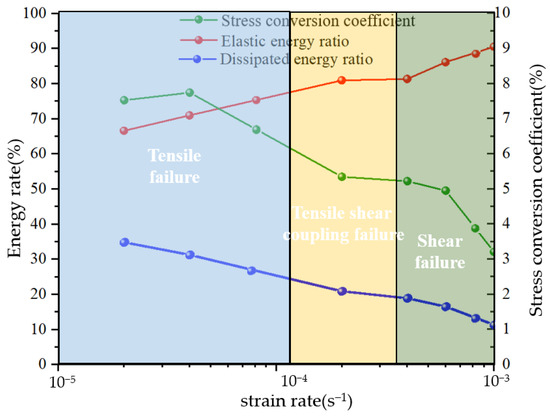
Figure 10.
Stress conversion coefficient and energy ratio at different strain rates.
3.2. Effect of Water Content on the Conversion Coefficient
For the convenience of analysis, the average peak strength, peak strain, and elastic modulus measured using five groups of soil bodies with different water contents are sorted, and the obtained data are shown in Figure 11.
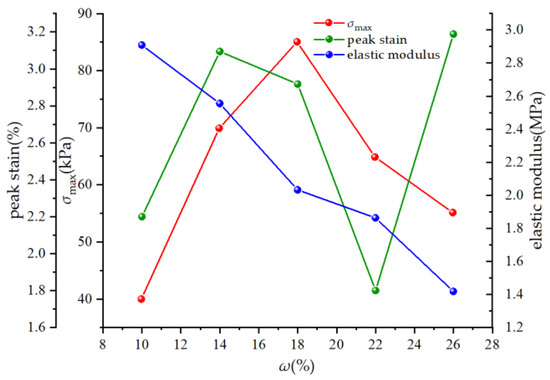
Figure 11.
Change in soil stress characteristics under different water contents.
As observed in Figure 11, the sample presents different mechanical properties under different water contents, and the peak strain of the sample has no obvious change rule under different water contents and fluctuates irregularly between 0.015 and 0.035. However, the peak strength and elastic modulus of the sample first increased and then decreased with an increase in water content, and there is a “convex peak” phenomenon. That is, critical water content is observed. When the water content is less than the content of critical water, the peak strength and elastic modulus increase with an increase in water content; when the water content is greater than the critical water content, the peak strength decreases with an increase in water content. Li et al. [9], Wang et al. [10], and Lu et al. [11] have similar test results as those shown above.
The phenomenon of “convex peak” shows that the mechanical properties of large samples are closely related to water content. Because the sample comprises viscous soil, when the moisture content is lower than the moisture content corresponding to the wave crest, the viscosity between the overly dry soil is not enough, and it disintegrates under low pressure. When the moisture content is higher than that corresponding to the wave crest, as long as the soil remains unsaturated, its saturation increases with an increase in moisture content. During this process, the intergranular suction of the soil also gradually decreases [12,13,14], resulting in a decrease in the shear strength [15,16] and tensile strength [17,18] of the soil and further resulting in a decrease in peak strength.
3.3. Effect of Water Content on Energy Conversion
For the convenience of analysis, the average elastic energy, elastic energy ratio, and stress conversion coefficient measured using five groups of soil bodies with different water contents are sorted, and the data obtained are shown in Figure 12. As observed in Figure 12, with an increase in soil moisture content, the proportion of elastic properties decreases, and the proportion of dissipated energy increases in the soil compression failure process. This indicates that the soil with higher water content experiences more plastic deformations during the failure process, and the mechanical properties of the soil obviously change from being brittle to plastic. Therefore, the water content has a significant effect on the mechanical properties of soil. The higher the water content, the more obvious the plasticity of the soil.
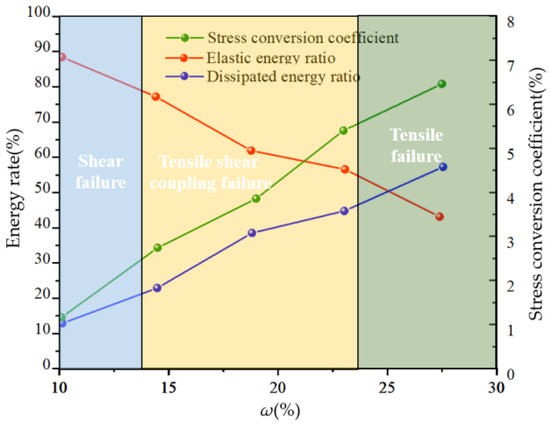
Figure 12.
The change in conversion coefficient and energy proportion of samples under different water content.
At the same time, it can be observed in Figure 12 that water content also has a significant impact on the soil stress conversion coefficient, which is manifested in that the stress conversion coefficient increases with an increase in water content. When the water content is 10%, the stress transfer coefficient of the soil is only 1.06%, but when the water content increases to 24%, the stress transfer coefficient increases by six times to 6.87%. In terms of the failure mode, the brittleness of the soil is more obvious when the water content is 10%, and the soil mainly exhibits shear failure. The water content is 24%, the soil is obviously plastic, and the failure mode comprises tensile failure. The soil with moisture content between 10% and 24% exhibits the tensile–shear coupling failure mode.
Based on the data in Figure 12 and their conclusions, it can be concluded that the stress transfer coefficient of the soil under compression increases with an increase in water content, and the more obvious the plasticity of the sample, the greater the stress transfer coefficient; moreover, the failure mode tends towards tensile failure.
4. Microstructure and Stress Transfer Mechanism of Compressed Soil
The sample of this test is the original soil sample at different positions before and after the failure. The sampling position of the sample is shown in Figure 13:
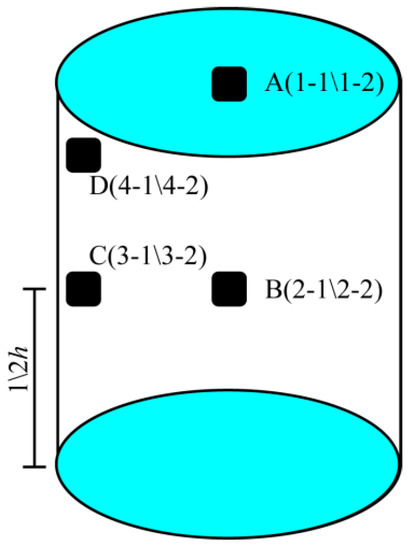
Figure 13.
Microscopic analysis of sample points.
Among them, one cross-section sample (No. x-1) and one longitudinal section sample (No. x-2) are taken from each sampling point. The two samples at point A were obtained before the failure of the large sample under compression, and they were used as the control group without failure. Points B, C, and D are located at the center of the circle at the middle height. Point C is located on the outer surface and at the same height, namely the tensile stress concentration point of this section. Point D is located on the outer surface of the hanging disk, which is the shear stress concentration point of the sample in the vertical direction.
4.1. Microstructure Observation
After selecting an appropriate observation point in the sample, the microscopic structure of the soil at each section was observed by magnifying the image in the field of vision by 2000 times using scanning electron microscopy (Figure 14).
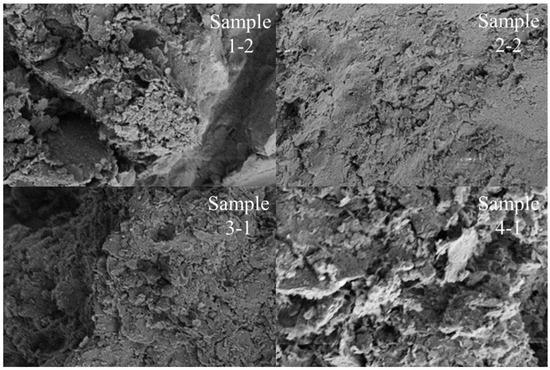
Figure 14.
Microstructure of soil at different positions before and after compression.
The particle structure of each sample can be directly observed using SEM. Sample 1-2 and Sample 2-2, respectively, show changes in the vertical microstructure of the soil mass before and after compaction. As observed in Sample 1-2, the soil particles are relatively loose before compaction, and cracks with large spacing appear. In Sample 1-2, soil particles at different heights are closely combined after the soil has undergone a complete process of compression failure. With the invasion and extrusion of soil particles during the process of compression failure, it can be observed that the long axis of soil particles is horizontally arranged along the central crack.
Samples 3-1 and 4-1, respectively, represent the cross-sections of the tensile tension concentration zone and shear force concentration zone of the soil sample. By comparing Sample 3-1 and Sample 4-1, it can be observed that the soil surface in the tensile tension concentration area is relatively flat and rounded, while soil particles in the shear force concentration area are relatively broken, and many flake particles are overturned at a certain angle due to local shear motions.
4.2. Microscopic Pore Structure Analysis
Porosity can reflect the compactness of soil in a certain section [19]. According to the above derivation, it can be observed that in the process of compression and the failure of soil mass, due to the mutual extrusion and migration of soil particles, the structure of the soil mass itself changes greatly, and the particles’ compactness at different positions and sections in different directions is also different. Therefore, via the calculation and analysis of the porosity of the image after binarization, the density degree of the soil at different positions is obtained, and the results are shown in Figure 15.
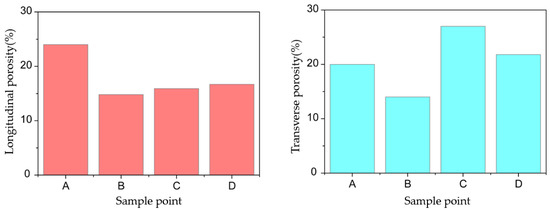
Figure 15.
Cross-section porosity at each sampling point.
As observed in the bar chart, the longitudinal porosity of soil decreases after compression. The longitudinal porosity of soil samples at different locations is also different. As observed in Figure 15, the longitudinal porosity at point A is the highest among different positions of the soil mass. This is because point A, as the control group, was sampled before the soil mass was compressed, and its longitudinal compression degree was low; thus, its porosity is the highest. At three sampling points B, C, and D, the difference in longitudinal porosities is small, and the degree of longitudinal compaction is similar.
Due to the transverse swelling of the soil mass after the failure of the compressed soil mass, the porosity of both points C and D increased to a certain extent compared with point A of the control group. The porosity of point D is lower than that of point C because it is located at the top surface of the soil and is affected by the friction of the end. The porosity of point B is the lowest among the four sampling points, indicating that the tensile deformation inside the soil is smaller than those outside the soil, which further proves that the tensile stress of the soil is concentrated on the outside surface.
4.3. Analysis of Particle Arrangement Characteristics
In the process of soil deformation under compression, soil particles squeeze and migrate with each other under the action of tensile stress or shear stress, which leads to the movement or rotation of solid particles and pores. By studying the arrangement characteristics of pores and solid particles before and after the soil is compressed, the motion law of soil particles in the process of soil compression can be obtained. Next, the orientation parameters of soil particles are analyzed and discussed, and the structural characteristics of soil after compression are analyzed. The statistical results of the granular rose map in the longitudinal profile of each sampling point are shown in Figure 16.
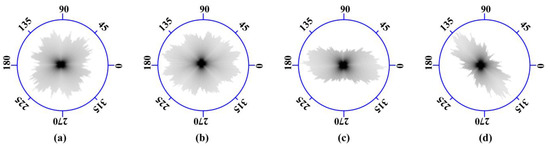
Figure 16.
Rose grain profile of each sampling point: (a) sample1-2; (b) sample2-2; (c) sample3-1; (d) sample4-1.
The granular rose map at points B, C, and D was compared with that at point A of the control group, and the area of point A was observed to be small. This is because the longitudinal soil particles have compacted after soil compression, and their porosity decreases, leading to a decrease in the area of particles in the SEM image with the same magnification ratio. This conclusion is consistent with the relevant conclusions on porosity in Figure 16, indicating that the compressive deformation of soil inevitably leads to mutual contact and extrusion.
Point C and point D are the concentration points of tensile stress and shear stress. Compared with point A and point B, the particles’ distribution shows obvious orientations. Among them, the particles at point C are arranged horizontally, which indicates that the particles were extended and distributed laterally after the soil has undergone severe tensile deformation. This proves that soil particles with different longitudinal heights decompress relative to one another and invade the soil particles in the middle layer during the compression process, thus generating tensile stress on soil particles and extruding them to form local tensile deformations. The soil particles at point D are distributed at an angle of 45° from the horizontal axis, which is similar to the shear angle, indicating that the soil particles here produce obvious shear deformations under the action of pressure, and the soil particles are rearranged along the shear zone under the action of shear forces.
4.4. Analysis of Stress Transfer Mechanism
The soil skeleton is mainly composed of soil particles. Soil particles are products of rock weathering, and they mainly comprise quartz, feldspar, and other mineral particles, hardness, and rigidity. In the process of soil failure, due to the substantial rigidity of soil particles, the deformation and breakage degree of soil particles under stress are generally small. Lu [20] provided statistics on the size of soil particles before and after the failure of the sample, and their study observed that only 2% to 10% of soil particles were broken during the failure process of the sample. For the clay soil with small soil particles, the number of broken soil particles amounted to less than 5%. Therefore, it can be considered that soil particles themselves do not deform in the mechanical failure process of soil, and the deformation and failure of soil are results of the change in soil skeleton caused by the migration of soil particles under effective stress.
In the process of soil compression, the height of the sample actually decreases continuously. Therefore, after soil particles come into contact with one another, the upper and lower soil particles inevitably invade the middle layer vertically. After the soil particles in the middle layer are invaded, they can only be extruded laterally to make room for invading soil particles. The movement of soil particles is shown in the figure below.
It can be observed from Figure 17 that particle 1 at the top is subjected to pressure FN under external loads. Under the action of FN, soil particles 1 and 2 in the top layer invade the soil of the second layer. During the invasion process, cementing force Ft and friction force tanφ between soil particles exhibit resistance to the invasion movement. As compaction continues and FN increases, the following two motions occur between soil particles.
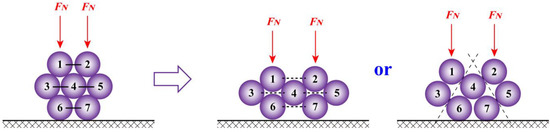
Figure 17.
Schematic diagram of the transport mode of soil particles in compressed soil.
- (1)
- If the mechanical property of the soil is relatively plastic and cementation force Ft still has a certain residual strength after a certain distance between the particles, the upper and lower soil particles will completely invade the middle soil particles via insertion such that the middle soil particles are extruded and retain their structure, resulting in local swelling (tension) failure within this area.
- (2)
- If the mechanical properties of the soil are brittle, when cementation force Ft reaches its tensile strength, the cementation of the soil particles will be completely broken, and the connection between 1–2, 3–4, and 2–5 will be broken. The upper soil particles invade the middle soil particles in the form of shear failure, resulting in local shear failure within this area.
Therefore, when the soil is under compression deformation, the soil particles in the upper layer of the internal soil particles will invade the next soil layer in the form of insertion or shear failure, and the particles in the next soil layer will be squeezed out, resulting in local tensile failure or local shear failure.
5. Conclusions
The stress conversion coefficient of soil samples in the process of failure was measured using the uniaxial compression and equivalent tensile method, and the influencing factors of the stress conversion coefficient were studied by using this method. From a microscopic point of view, by carrying out quantitative analyses after microscopic imaging, the generation mechanism and distribution law of the stress conversion coefficient of compressed soil were proposed and verified. The main conclusions of this paper are listed as follows:
- (1)
- The tensile stress generated in the soil under compression is affected by two factors: axial stress and the stress conversion coefficient. The stress conversion coefficient of soil under pressure is not constant, which is why the strength envelope of soil is a nonlinear envelope, such as Mohr’s envelope, rather than a straight Coulomb envelope. For the same type of soil, the value of the stress conversion coefficient changes with a change in stress states and soil properties. Among them, an increase in loading rate increases the elastic energy ratio of the soil mass and decreases the dissipative energy ratio, and the stress characteristics of soil mass are brittle, which results in a reduction in the stress conversion coefficient of the soil mass during the compression failure process; moreover, the soil mass changes from the tension failure (bulging failure) mode to the shear failure mode under a uniaxial state. However, an increase in soil water content causes a decrease in the elastic energy ratio of the soil and an increase in the dissipative energy ratio; the stress characteristics of soil exhibits more plastic behavior; the stress conversion coefficient increases; the soil changes from the shear failure mode to the tension failure (bulging failure) mode.
- (2)
- With an increase in loading rate, the peak stress increases gradually, the peak strain decreases gradually when the peak stress is reached, and the elastic modulus decreases gradually. However, with an increase in water content, only the elastic modulus of soil decreases monotonically, and the peak stress and strain of soil increase first and then decrease.
- (3)
- The tensile stress in the compressed soil is caused by the invasion and extrusion of soil particles. When the soil is under compression deformation, the soil particles in the upper layer of the internal soil particles invade the lower soil particles via insertion or shear force, and the lower soil particles are extruded, resulting in local tensile failure or local shear failure. In the compressed soil body, the distribution of tensile stress is not uniform, and tensile stress forms stress concentrations on the soil’s surface such that the soil on the surface of the sample is subjected to increased tensile stress than the soil inside the sample.
Author Contributions
Conceptualization, Y.-X.W. and L.-S.T.; methodology, L.-S.T.; software, Y.-X.W.; validation, Y.-X.W. and L.-S.T.; formal analysis, Y.-X.W.; investigation, Y.-X.W.; resources, L.-S.T.; data curation, Y.-X.W.; writing—original draft preparation, Y.-X.W.; writing—review and editing, Y.-X.W.; visualization, L.-S.T.; supervision, L.-S.T.; project administration, L.-S.T.; funding acquisition, L.-S.T. All authors have read and agreed to the published version of the manuscript.
Funding
This research was funded by the National Natural Science Foundation of China (grant numbers 42277142, 42102303, 41877228). Guangdong Basic and Applied Basic Research Foundation (2018B030311066).
Institutional Review Board Statement
Not applicable.
Informed Consent Statement
Not applicable.
Data Availability Statement
The data presented in this study are available upon request from the corresponding author.
Acknowledgments
The authors are grateful to the anonymous reviewers for their helpful comments on the manuscript.
Conflicts of Interest
The authors declare no conflict of interest.
References
- Tang, L.S.; Wang, Y.X.; Sun, Y.L.; Chen, Y.; Zhao, Z.L. Review on the Failure Modes of Rock and Soil Mass under Compression and the Exploration about Constitutive Equations of Rock and Soil Mass. J. Adv. Civ. Eng. 2022, 2022, 7481767. [Google Scholar] [CrossRef]
- Tang, L.S.; Sang, H.T.; Song, J.; Luo, Z.G.; Sun, Y.L. Mechanical model for failure modes of rock and soil under compression. J. Trans. Nonferrous Met. Soc. China 2016, 26, 2711–2723. [Google Scholar] [CrossRef]
- Taylor, D.W. Fundamentals of Soil Mechanics; Wiley: New York, NY, USA, 1948. [Google Scholar]
- Ng, C.W.W.; Chiu, C.F. Laboratory study of loose saturated and unsaturated decomposed granitic soil. J. Geotech. Geoenvironmental Eng. 2003, 129, 550–559. [Google Scholar] [CrossRef]
- Luo, K.T.; Nie, Q.; Zhang, S.Y.; Liu, E.L. Investigation on artificially structured soils with initial stress-induced anisotropy. J. Rock Soil Mech. 2013, 34, 2815–2820. [Google Scholar] [CrossRef]
- Liu, W.L.; Tian, Z.H.; Lu, Y.; Xu, J.; Gong, Z.D.; Wu, Y.J. Study on triaxial compression characteristics of improved aeolian sand mixed with cement silt. J. Adv. Sci. Technol. Water Resour. 2023, 43, 51–57. [Google Scholar] [CrossRef]
- Timoshenko, S.P. History of Strength of Materials; McGrawHill: New York, NY, USA, 1953. [Google Scholar]
- Li, X.L.; Li, J.; Huang, H.; Li, L.B. Effect of loading rate splitting characteristics of weakly cemented sandstone. J. China Min. Mag. 2023, 32, 165–172. [Google Scholar] [CrossRef]
- Li, X.; Jiang, S.X.; Chen, Y.; Weng, S.X.; Wang, C.Q.; Chen, Z.B.; Guo, X.W.; Dai, M.L. Strength Influencing Factors of Sodium Carboxymethyl Cellulose Modified Soil. J. Water Resour. Archit. Eng. 2022, 20, 55–60. [Google Scholar] [CrossRef]
- Wang, Y.Y.; Yu, Z.Q.; Cui, L.Z. Expermintal study on compressive behavior of cemented paste backfill material with different water contents. J. Coal Sci. Technol. 2022, 50, 219–224. [Google Scholar] [CrossRef]
- Lu, W.Y.; Liu, Q.; Qu, L.N.; Zhang, H.J. Study on coal crack propagation and failure mode with different moisture content under Uniaxial compression. J. Mine Autom. 2022, 48, 85–91. [Google Scholar] [CrossRef]
- Shikawa, T.; Fuku, S.; Nakamura, T.; Tokoro, T. Influence of water content on shear behavior of unsaturated fouled ballast. J. Procedia Eng. 2016, 143, 268–275. [Google Scholar] [CrossRef]
- Khalili, N.; Khabbaz, M.H. A unique relation-ship for the determination of the shear strength of unsaturated soils. J. Geotech. 1998, 48, 681–687. [Google Scholar] [CrossRef]
- Reto, S.; Harianto, R.; Hans, R.S. Controlling parameter for unsaturated soil property functions: Validated on the unsaturated shear strength. Can. Geotech. J. 2015, 52, 374–381. [Google Scholar] [CrossRef]
- Wang, H.Q.; Sun, J.L.; Li, D.W.; Yang, H.X.; Song, T. Experimental Study on Shear Strength of High Fill Loess under Different Moisture Content. J. Geotech. Eng. Tech. 2022, 36, 507–510. [Google Scholar] [CrossRef]
- Wu, D.Y.; Qu, B.B.; Li, J.F.; Zhao, J.H. Experimental study on variation law of shear strength of river dredged silt with water content. J. Port Waterw. Eng. 2022, 599 (Suppl. S2), 22–28. [Google Scholar] [CrossRef]
- Li, Z.Y. Expermental Study on Tensile Strength of Unsaturated Cohesive Soil. Master’s Thesis, Hubei University of Technology, Wuhan, China, 2021. [Google Scholar] [CrossRef]
- Tang, L.S.; Wang, H.; Sun, Y.L.; Liu, Q.X. Change of tensile strength of granite residual soil during drying and wetting. J. Rock Soil Mech. 2022, 43, 1749–1760. [Google Scholar] [CrossRef]
- Chen, Y.; Tang, L.S.; Ye, Y.H.; Cheng, Z.H.; Zhou, Z.X. Effects of different chloride salts on granite residual soil: Properties and water–soil chemical interaction mechanisms. J. Soils Sediments 2023, 23, 1844–1856. [Google Scholar] [CrossRef]
- Lu, W. Mechanical Properties of Shear Strength of Unsaturated Granite Residual Soil in South China. Ph.D. Thesis, Sun Yat-sen University, Guangzhou, China, 2017. [Google Scholar]


Disclaimer/Publisher’s Note: The statements, opinions and data contained in all publications are solely those of the individual author(s) and contributor(s) and not of MDPI and/or the editor(s). MDPI and/or the editor(s) disclaim responsibility for any injury to people or property resulting from any ideas, methods, instructions or products referred to in the content. |
© 2023 by the authors. Licensee MDPI, Basel, Switzerland. This article is an open access article distributed under the terms and conditions of the Creative Commons Attribution (CC BY) license (https://creativecommons.org/licenses/by/4.0/).