Article

Inverse Q-Filtering as a Tool for Seismic Resolution Enhancement: A Case Study from the Carpathian Foredeep

Geo-Energy Innovations Sp. z o.o., Czarnowiejska 36/C5/017 Street, 30-054 Kraków, Poland
*
Author to whom correspondence should be addressed.
Appl. Sci. 2023, 13(15), 8564; https://doi.org/10.3390/app13158564
Submission received: 15 May 2023 / Revised: 5 July 2023 / Accepted: 14 July 2023 / Published: 25 July 2023
(This article belongs to the Collection Advances in Theoretical and Applied Geophysics)

Abstract

:
In this study, we analyze the quality factor- Q derived from the Vertical Seismic Profiling (VSP) and sonic log data that was performed in the DS-2 borehole located in the Carpathian Foredeep. We use the obtained quality factor distributions in the inverse Q-filtering (IQF) procedure during active seismic data processing. Another very important and, unfortunately, subjective in nature parameter is the gain function applied to seismic data while performing the IQF. To calculate Q from VSP data we use an iterative approach to the spectral ratio method where we use several shallowest receivers as reference. We observe high variability of the obtained Q values, depending on the reference receiver, however, depth distribution of Q was consistent regardless To increase reliability of the obtained values, an additional method of Q measurements is incorporated, i.e., acoustic travel time dispersion method. We show that incorporating inverse Q-filtering to active seismic data processing flow allows to enhance the vertical resolution of 2D seismic data.

1. Introduction

Reliable determination of seismic wave attenuation (which inverse is the Quality factor Q) in a geological strata is of importance from an industrial point of view. The Q, as one of the seismic attributes, can provide information about the mechanical properties of rocks, as well as indicate subtle structural changes [1]. The ratio of attenuation values for different wave types (P/S), or its anomalous values, allow inferences regarding reservoir parameters and pore space saturation with hydrocarbons [2,3,4]. It should also be noted that the attenuation can be considered as a filter that modifies the frequency spectrum of seismic waves, thus providing important information about the recorded wavefield [5]. The narrowing of the spectral band of the seismic data due to energy absorption decreases its vertical resolution. Authors like [6,7,8,9] propose convolutional models that have potential to increase the vertical resolution of the seismic data, whereas other approaches use complex machine learning techniques for spectral enhancement [10,11]. Considerable difficulties are posed by the imaging of thin layers, usually occurring in a series of increased shale content, where signal interference occurs. An increase in the dominant frequency of the seismic signal in such situation makes it possible to at least partially isolate such overlays.
In this study, to increase the higher frequency content of the seismic signal, we use Inverse Q-Filtering (IQF), which allows us to achieve a higher vertical resolution of the section. The IQF procedure involves subjecting the seismic traces to a minimal-phase deterministic filter, compensating for the effect of the exponential loss of higher frequencies and increasing the distortion of the signal as the seismic wave propagates through the geological strata.

2. Geological Setting

The study area is located in southern Poland, in the eastern part of the Carpathian Foredeep. Similarly to other young foreland basins, the Carpathian Foredeep is filled with Miocene clastic sediments of thickness up to about 3000 m [12]. Formation of the Carpathian Foredeep is related to evolution of the Outer Carpathian orogenic belt in the Miocene [13,14]. The southern, tectonic boundary of the Foredeep is defined by the front of Outer Carpathian nappes, which were thrusted over the Miocene sedimentary fill of the foreland basin [15,16,17], whereas the northern boundary is erosional [18]. The basement of the Foredeep is the epi-Variscan platform and/or its Permian-Mesozoic sedimentary cover [12,18,19,20]. Generally, the Miocene sedimentary fill of the Foredeep was developed along the front of the Carpathian orogen, but some formations were involved in the fold-and-thrust belt structure and now form the outermost Carpathian tectonic units. Moreover, some units were even thrusted over the Carpathian nappes, whereas the others underlie the Carpathian Overthrust as autochthonous formations [21]. The Foredeep was divided into the two zones [22]. The first zone of the Inner (older) Foredeep includes Miocene sediments resting either beneath the Carpathian nappes in an unchanged (autochthonous) position or forming allochthonous structures along the front of the Flysch Carpathians, determined as the Stebnik and the Borislav-Pokuttya units [15,19]. The second zone of the Inner Foredeep comprises Upper Badenian/Sarmatian sediments [13], which were partly included into the Carpathian orogen and went on to build the current Zgłobice Unit [23,24,25,26]. Both zones are filled with Miocene sediments, however, the most important hydrocarbon reservoirs are hosted in the autochthonous series of the outer part of the Foredeep, whose thickness reaches up to 3500 m in the Wielkie Oczy Graben [20].
The Miocene formations of the Carpathian Foredeep comprise: (i) Lower Badenian Sub-evaporate Series, (ii) Middle Badenian Evaporate Series and (iii) Upper Badenian/Sarmatian Supra-evaporate Series [20]. The oldest sediments belong to the Baranów Beds, represented mostly by green or greyish-green clayey shales interbedded with marls and glauconitic sandstones. In the areas of Cetynia, Lubaczów and Dzików, thickness of this sandy-clayey part of the Baranów Beds reaches locally up to 70 m, but the average thickness only extends to several meters and porosity varies from 5 to 25% [20]. The overlying Evaporate Series is represented in the eastern Foredeep by the Krzyżanowice Formation with thicknesses from 0 to 60 m. These are mostly anhydrites, gypsums and both the primary and the epigenetic limestones. Porosity of these carbonates is only about 2–3% and permeability varies from 0.01 to 1.05 mD, although secondary porosity may reach a dozen per cent [20]. The Supra-evaporate Series rests upon the older sediments or directly on the basement rocks. Significant thickness of these clayey-sandy deposits, up to 2500 m, results from Late Badenian and Sarmatian subsidence of the basin floor. Usually, these sediments are named the Machów Formation and include the Spiralis-Pecten Beds and the Krakowiec Beds. However, in the Dzików area, a limestone succession was encountered, in which two members were distinguished: the lower micritic limestones and the upper silty limestones. Porosity of these carbonates varies from 4.32 to 16.07% [20].
Geometry of the Carpathian Foredeep is not uniform due to rejuvenation of faults within the Teisseyre-Tornquist Zone, which took place in the Miocene. The central part of the Foredeep is cut by a broad zone of compressional deformations, well-visible within the Miocene formations. However, in the eastern part, different geometry is observed as a complicated system of faults generated during the Miocene extension combined with the regional compression forced by continental collision. The effects of such interactions are strike-slip movements observed in the area of the Ryszkowa Wola Horst [21,25,26,27].

3. Input Data—Wells and Seismic

For the purpose of this study, we utilized 2D reflection seismic data (part of the line M-4) along with the well log and VSP data from DS-2 borehole laying in the close vicinity of the analyzed part of the seismic line (Figure 1).
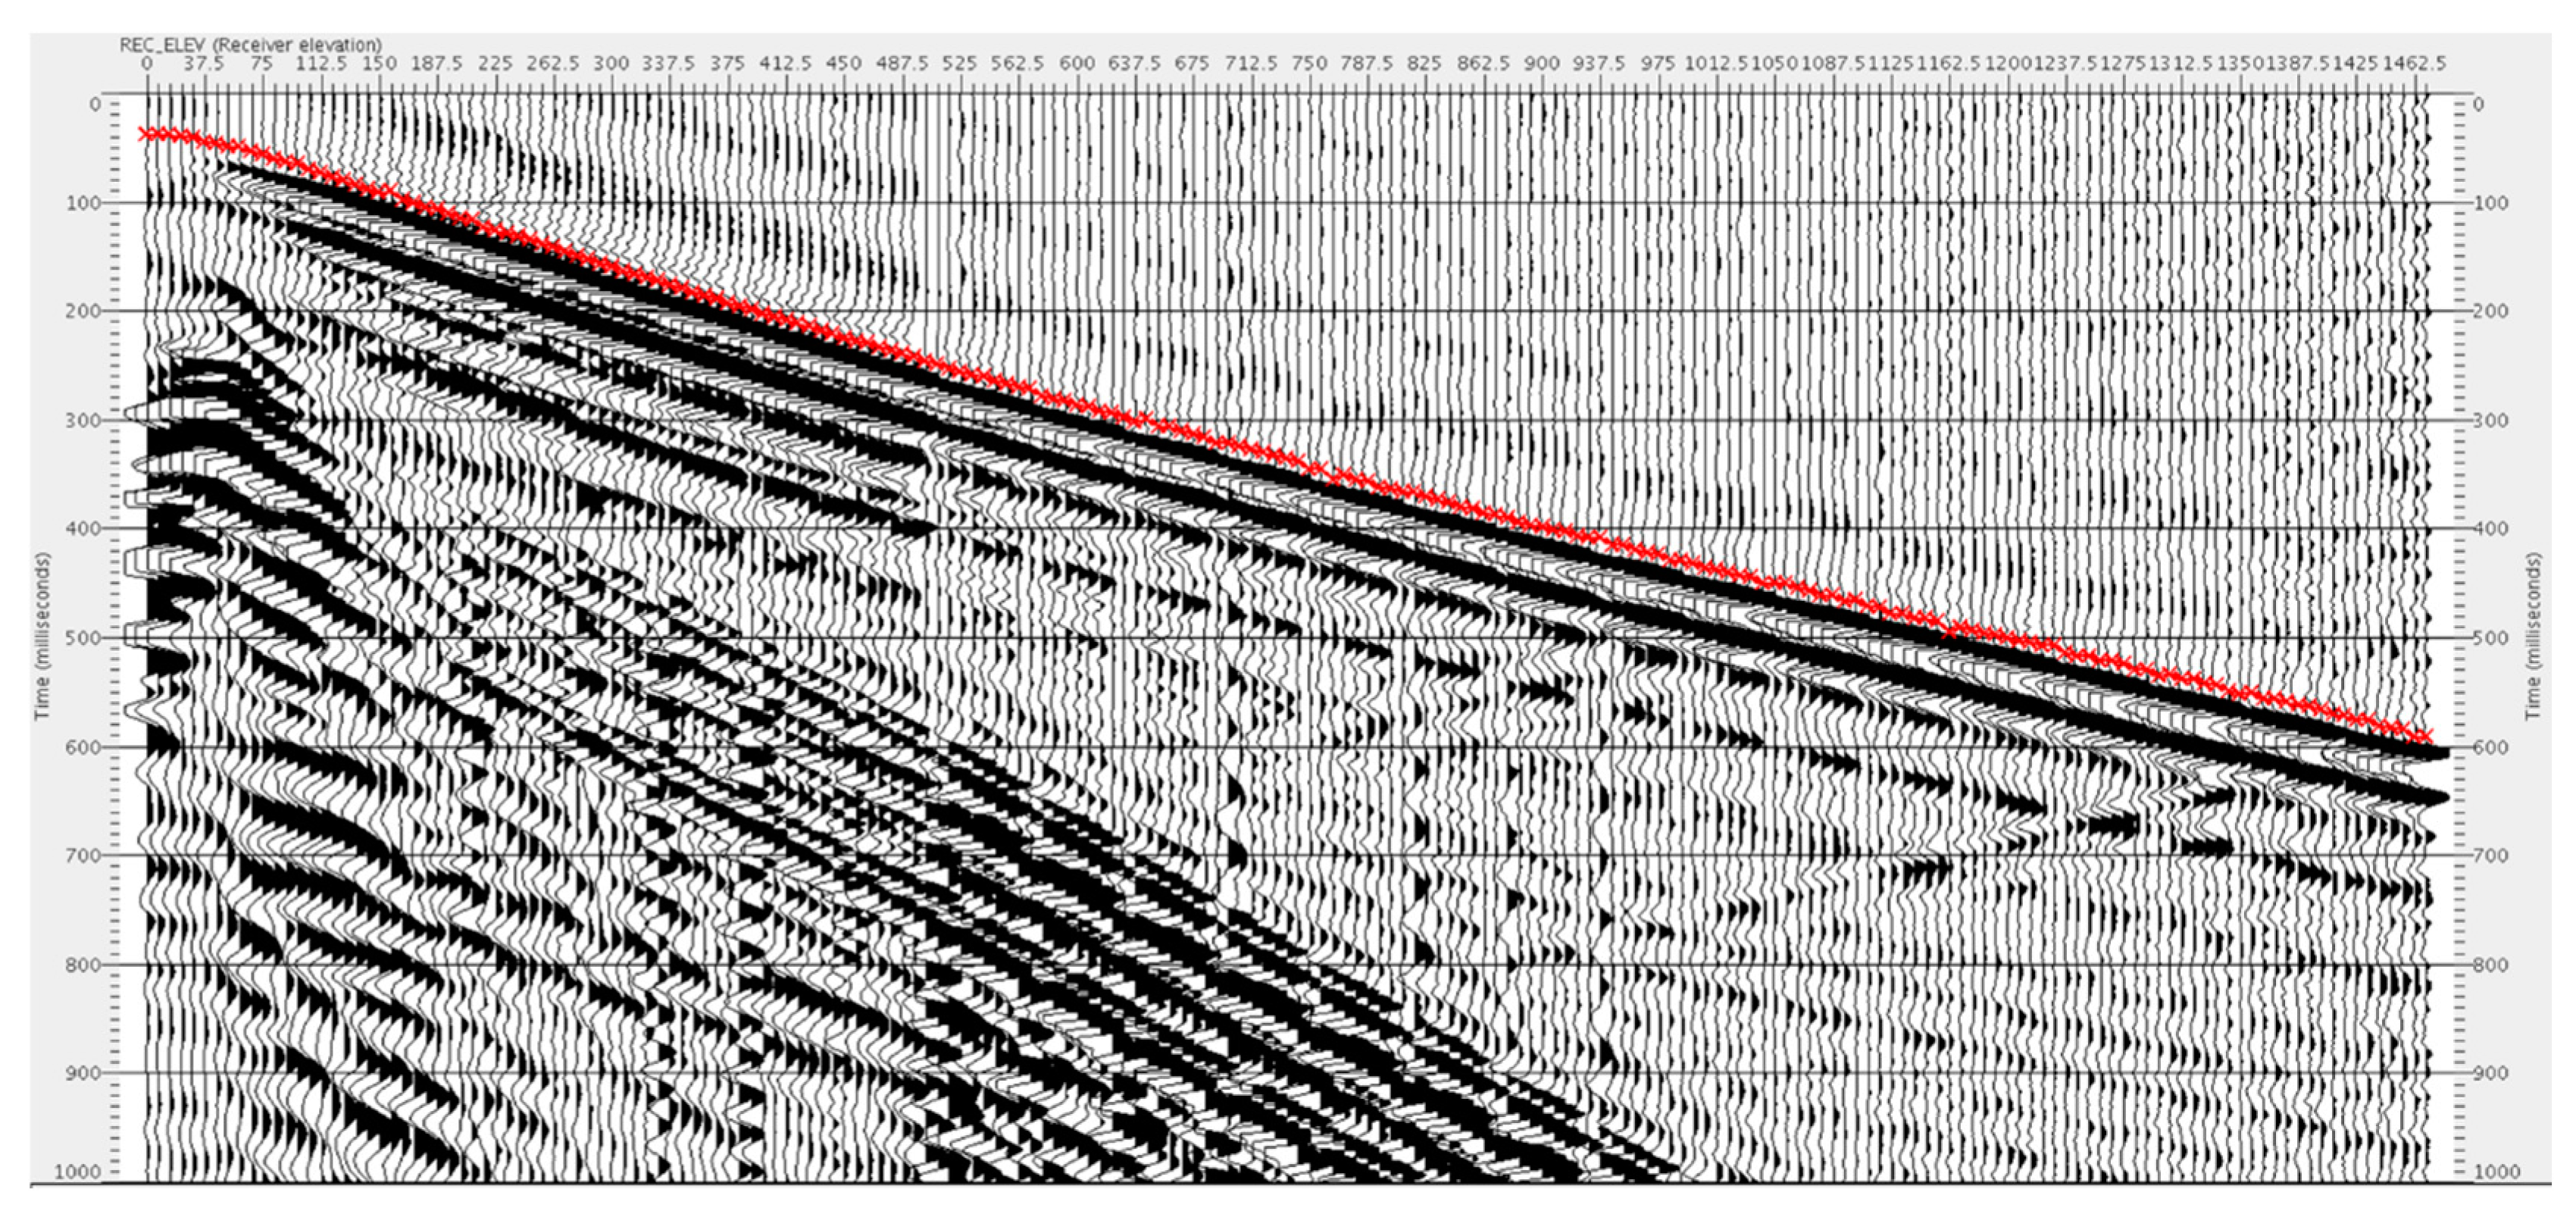
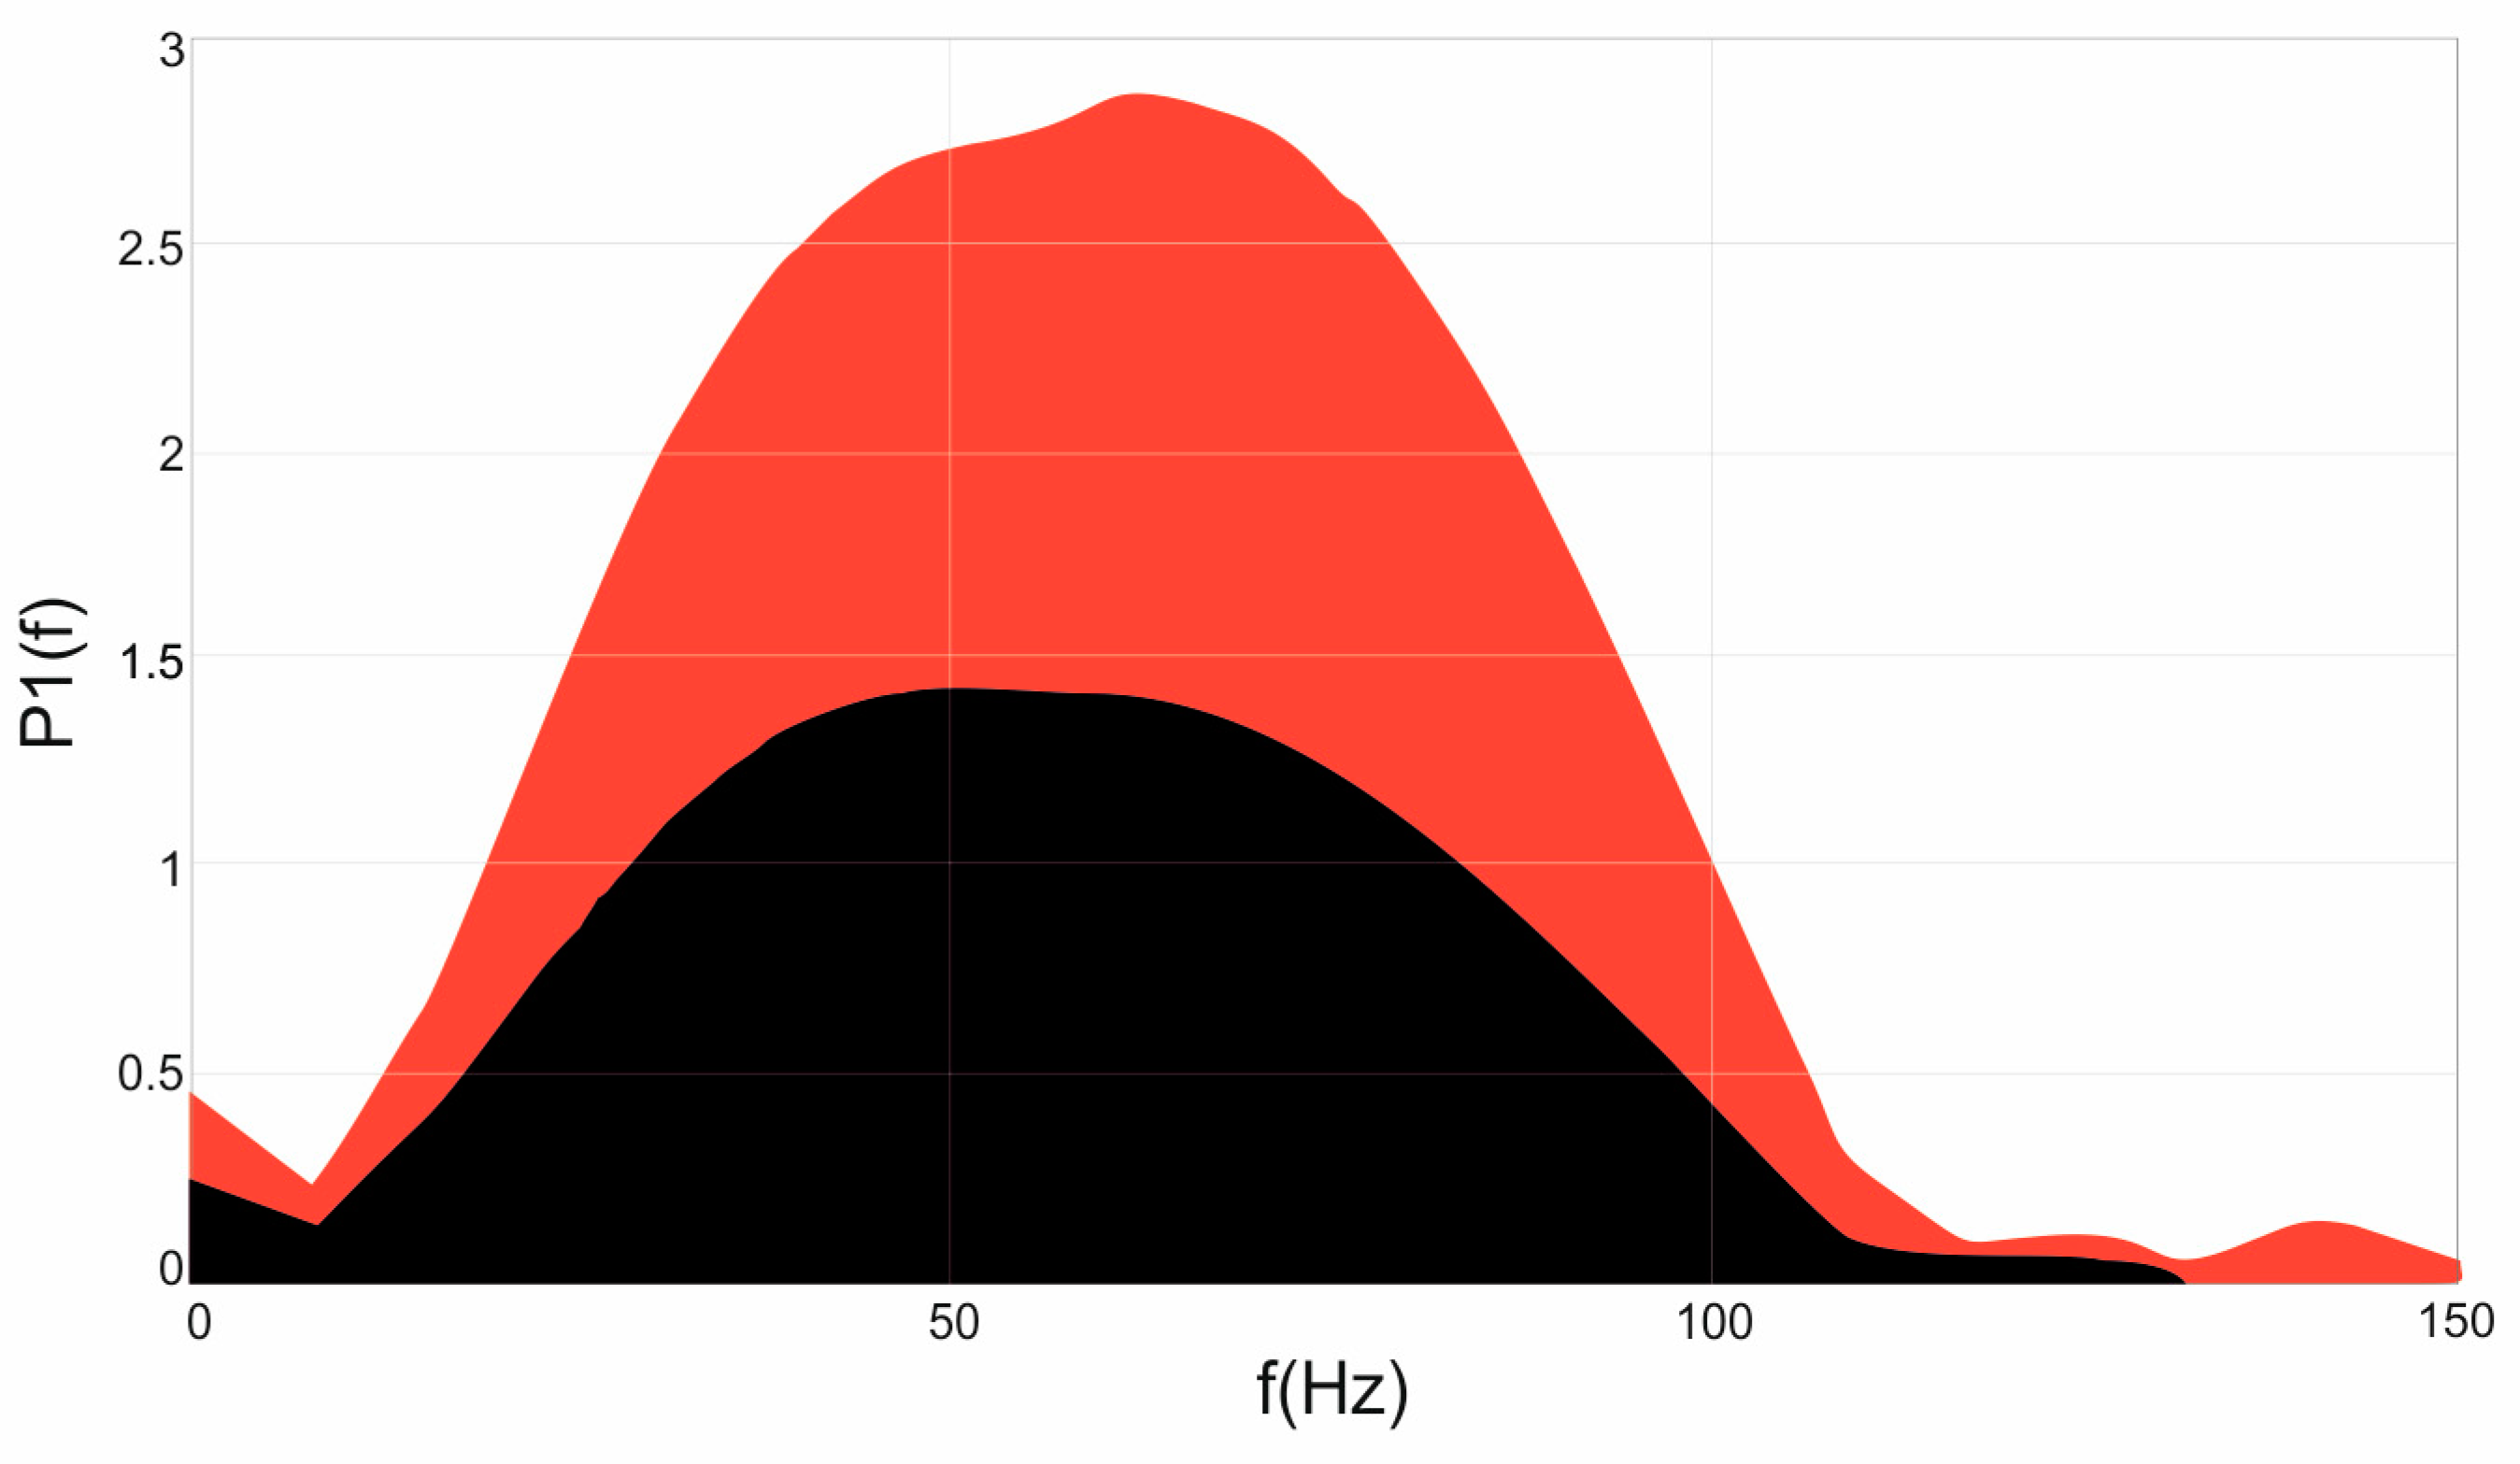
For the purpose of the quality factor calculation, we used both VSP and acoustic log data (DT). In case of the VSP, we used direct arrivals of the downgoing P-wave on the zero offset variant acquired at depths ranging from around 15 to 1200 m below the surface. Overall quality of the recorded wavefield can be considered as satisfactory (Figure 2). The value of the measured amplitude at receivers placed at different depths steadily decreased. The frequency spectrum of the signal was complete within the range of generated sweep frequencies and the present noise did not significantly modify the spectrum of the recorded signal (Figure 3).
Well-log data was measured at the DS-2 borehole at a depth range of 0 to 1170 m below the surface. The acoustic log is considered reliable throughout the entire measured interval, However, it should be noted that the information on the frequency of the log tool was not properly documented and could not be retrieved. We assumed that the highest logging frequency (e.g., 40 kHz) within possible range was between 6 kHz to 40 kHz.

4. Methods

4.1. Q Estimation

4.1.1. Spectral Ratio

In this study, Q was estimated using a spectral ratio method proposed by [28]. Using this method, a frequency independent quality factor is estimated on the signal recorded by at least two receivers placed on different depths. The quality factor between the two receivers can be estimated using the formula proposed by [29]:
l n | A 1 ( f ) A 2 ( f ) | = c o n s t + π Δ t Q f
After the transformation, Q can be calculated as:
Q = π Δ t m
where Δt is the difference of the time first arrivals of the downgoing P-waves between the shallower referenced receiver and the receiver placed below the referenced one; m is the linear regression coefficient calculated in the defined frequency range on the logarithmic plot of the ratio of spectrums of the analyzed signals (A1 (f) and A2 (f)). The spectral ratio technique is one of the most popular methods to calculate the Quality factor, hence, here, we only refer to several studies that used this technique [29,30,31,32]. The most crucial element in the Q calculation is source repeatability [33]. Typically, the VSP measurements are performed in a manner to which the source is fired numerous times as the survey is being moved along the borehole. To overcome the problem of non-repeatability of the seismic source and selecting a proper reference receiver, we used the statistical approach, where we selected several shallowest receivers as the reference and performed a spectral ratio measurement between all receivers that were below the reference one. The final Q distribution was calculated as the median value from all iterations and was filtered using a median filter.

4.1.2. Travel Time Dispersion

An alternative algorithm to the spectral ratio method for Q estimation is the so-called dispersion method, used in [30,34]. Well-geophysical measurements (VSP and DT) were used to analyze wave dispersion, that is, the dependence of wave propagation velocity on frequency. The method was applied to well-log and check-shot data recorded in DS-2 borehole to compare with results obtained by the spectral ratio method.
The velocity of seismic/acoustic waves shows a clear dependence on frequency due to the occurrence of dispersion. This results in the observed effect of the occurrence of seismic reflections at a time longer than that of the same reflection in a synthetic seismogram. The difference between the recording time of the reflection of a wave of the dominant frequency typical of seismic (usually about 30–50 Hz) and the time of the acoustic frequency waveform, in the case of borehole geophysics data (about 20 kHz for acoustic velocity profiling), can be referred to as drift time [35]. The relationship that we used to calculate the value of Qave was
Q ave ( z n ) = t n π   drift ( z n ) ln f w f s
where
Qave(zn)—averaged Q from surface to nth layer.
tn—two-way-time to nth layer.
fs and fw are dominant frequencies for both seismic and well-log data.
drift(zn)—time delay drift.

4.2. Inverse Q Filtering and Active Seismic Data Processing

Futterman [36] defined that seismic waves propagating through an absorbing geological medium are subjected to a frequency-dependent attenuation and an accompanying phase distortion caused by velocity dispersion. Assuming Q is constant with frequency, Futterman derives the following amplitude and phase-velocity dispersion pair shown in the equations:
A ( ω , t ) = A ( ω , 0 ) exp ( ω t 2 Q )
V ( ω ) V ( ω c ) = ( 1 + 1 π Q ln ( ω ω c ) ) , ( ω < ω c )
V ( ω ) = c o n s t a n t   ( ω ω c )
where
Q = the medium Q-factor.
t = the travel path time.
A(ω,0) = the amplitude spectrum of the initial wavelet.
A(ω,t) = the amplitude spectrum of the wavelet at a traveltime t.
V(ω) = the phase velocity at a frequency ω.
Q effects can be modeled through amplitude and phase filters following the Kolsky–Futterman [37] relationship:
A ( ω , t * ) = exp ( ω 2 t * )
P ( ω , t * ) = exp ( ± ω π t * ln ( ω ω r ) )
where
characterizes the forward filters (modeling Q effects),
± characterizes the inverse filters (compensating for Q effects),
ω is the (angular) frequency,
ωr is the reference (angular) frequency,
t* is the attenuated travel time.
The attenuated travel time t* is defined as the integration of the phase velocity V and Q effects along the propagation path of the wave.
t * = l V 1 ( l ) Q 1 ( l d l ) = t Q e f f
where Q is interval-Q and Qeff is effective-Q: characteristics of the ‘cumulative’ attenuation effects undergone by the wave during propagation.
Attenuation increases with both increasing frequency and increasing travel path length; phase velocity increases with frequency up to an upper cutoff frequency and is constant thereafter. In fact, there is a constant fractional loss of energy per cycle travelled (constant dB/cycle).
Application of IQF can correct for:
  • Amplitude Q-related effects
  • Phase Q-related effects
  • Both phase and amplitude Q-related effects
Conventional windowed deconvolution can only provide a very approximate treatment for the continuously time-variant earth filter. Further errors can arise from the presence of noise and from non-whiteness of the reflection series.
The deterministic inverse Q-filtering technique first proposed by Hale [37] uses an approximate filter derived from a series expansion of the inverse Q-filter. The phase compensation is performed by a fast algorithm that is closely related to that used in Stolt migration see [38]. For Q independent of depth, the algorithm accurately removes dispersion-generated phase distortion.
The algorithm applies phase and amplitude compensation by means of inverse filtering within short, overlapping windows of data. Function treats depth-variable Q structures by a cascaded series of constant-Q compensations.
The Q model consists of a number of layers, each defined by the time of the horizon at the bottom of the layer and by the Q value for that layer. The first layer is assumed to start at zero time. The last horizon time that is specified is adjusted so that it is equal to the length of the trace to be processed. Q values may be specified either as an average, effective Q at the time of a horizon or as the interval Q value for the layer above that horizon.
We can use constant-Q models, layered Q models or spatially variant Q models. In all cases, after application of this process, the intention is that the resulting data should be suitable for amplitude and phase sensitive processes, such as inversion and AVO (Amplitude versus offset) analysis, which assume the medium is elastic.
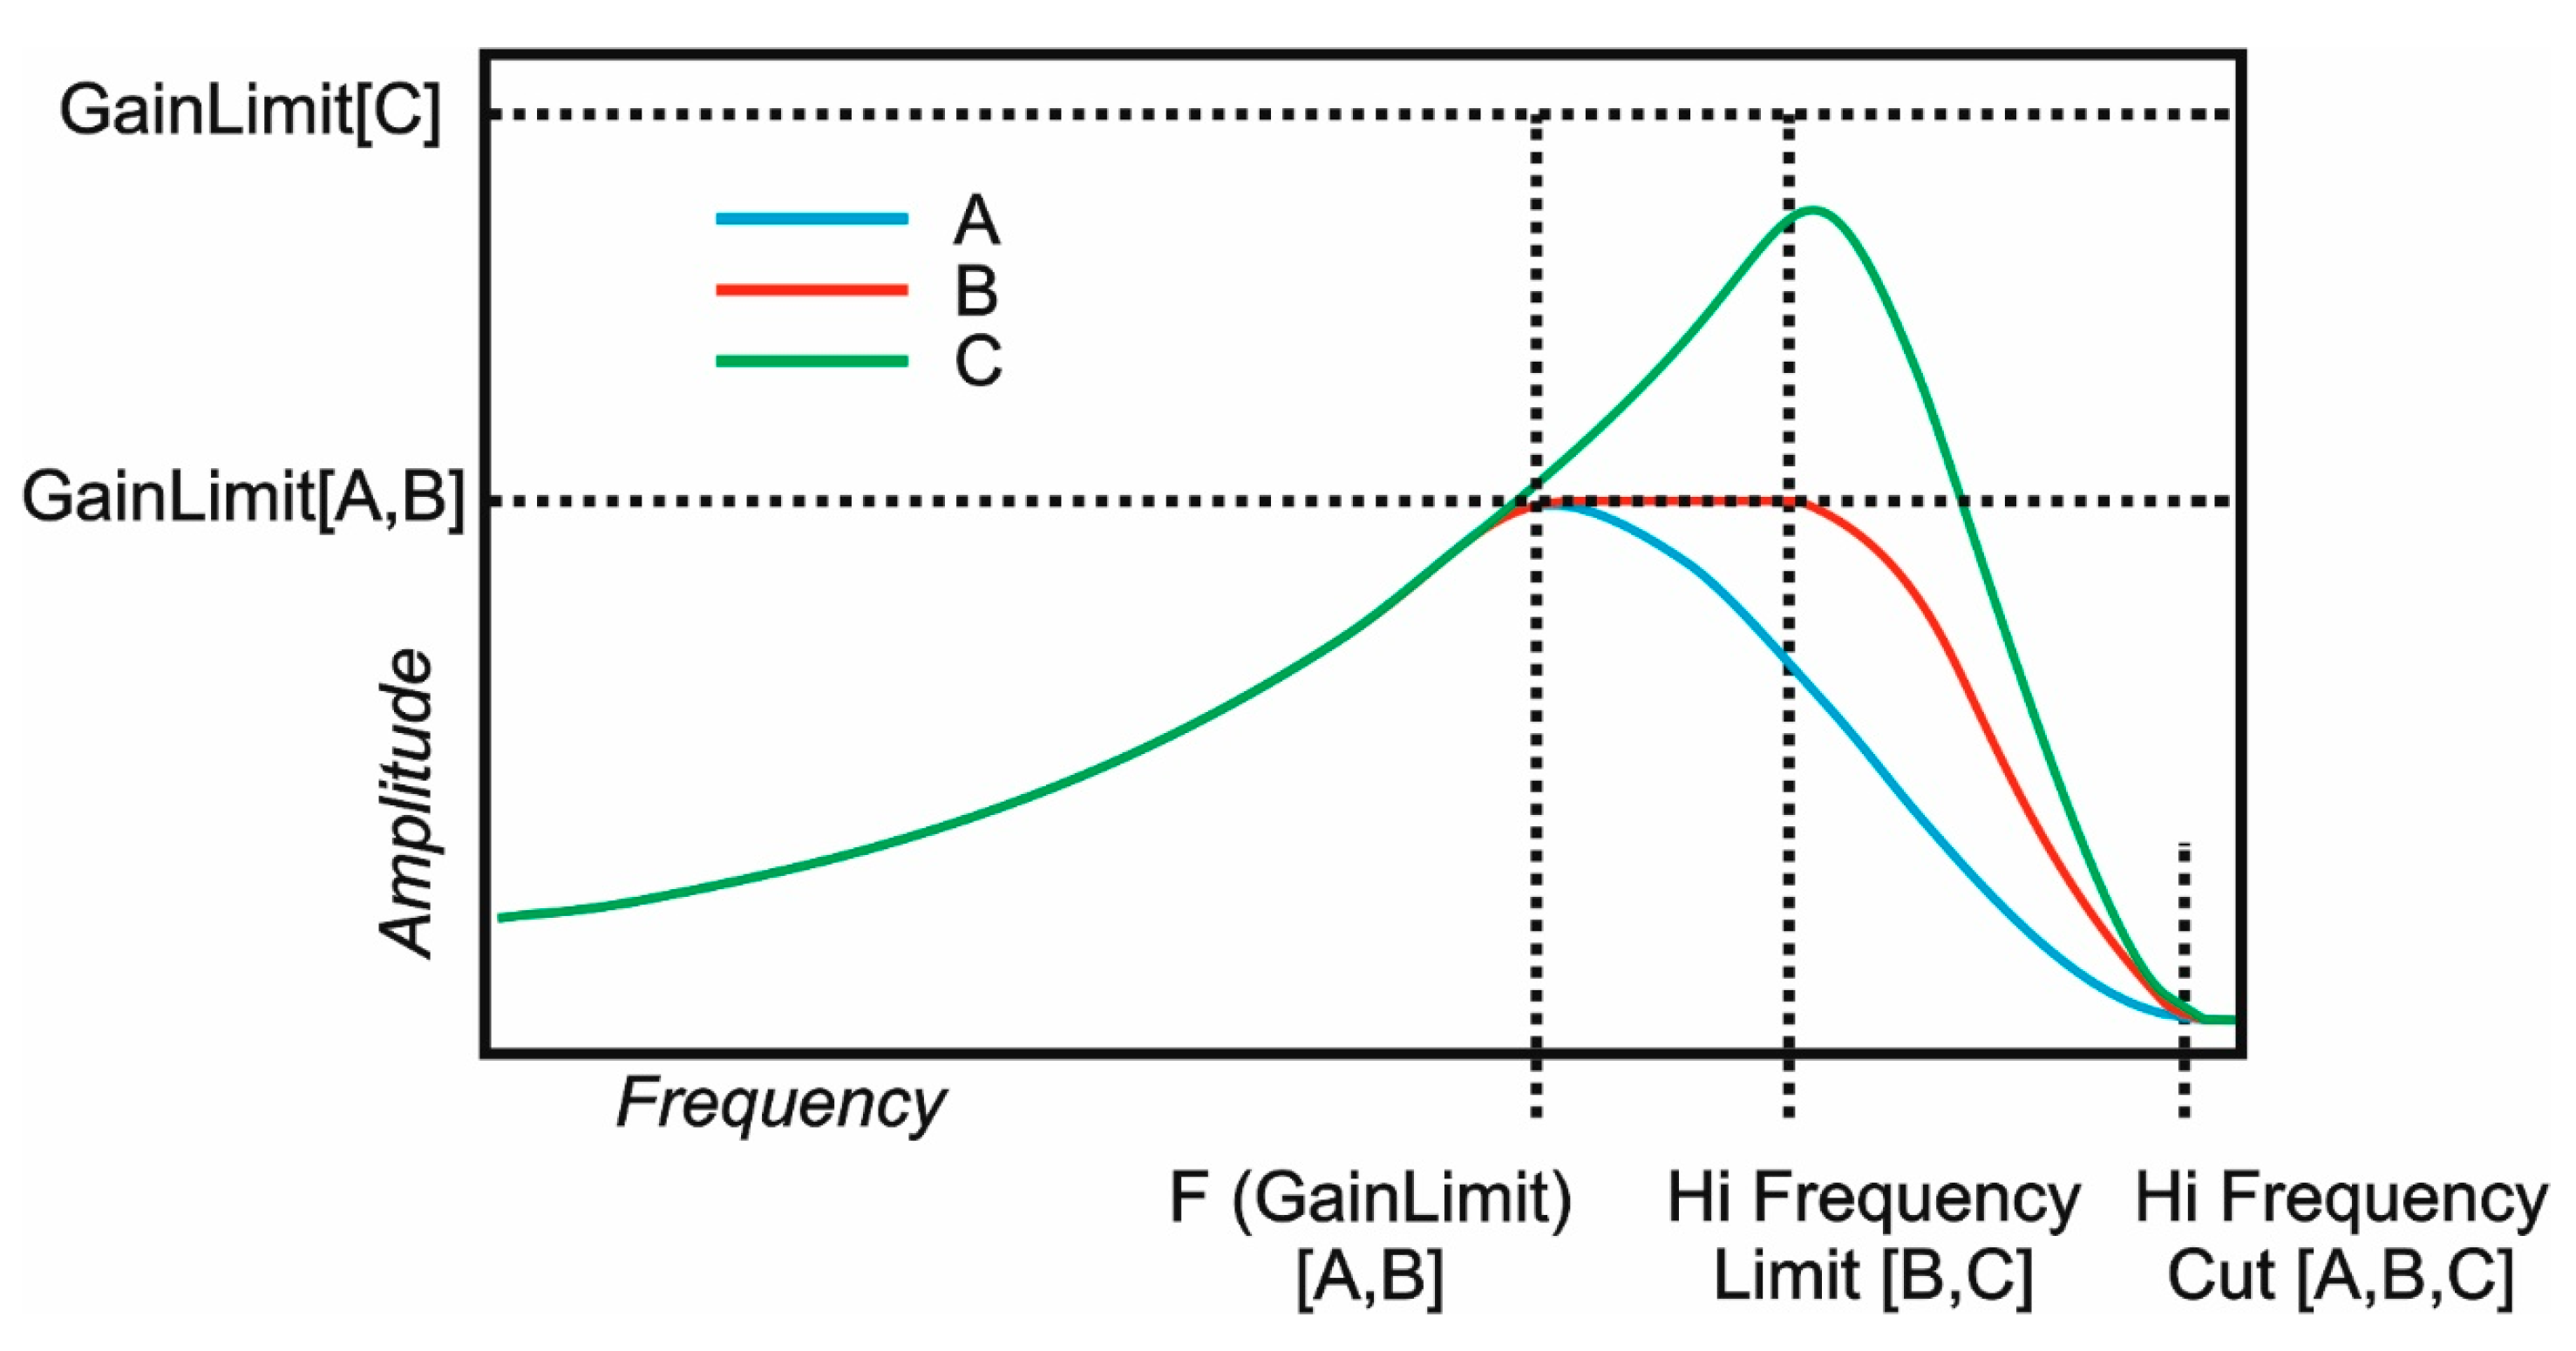
Due to the exponential nature of the amplitude filter, gain control must be included in parametrization of IQF to limit high-frequency noise amplification outside the seismic passband during amplitude compensation. This is achieved through gain capping and high-frequency tapering, as described in the diagram below (Figure 4).
Gain capping occurs when the gain reaches the gain limit value specified in the Gain Limit parameter (curve B). Tapering is usually applied between two fixed user-specified frequencies: the High-Frequency Limit and the High-Frequency Cutoff (curves B & C). Alternatively, tapering can also be designed so that it starts when the gain reaches the gain limit value rather than at a fixed frequency (curve A). In this case, the high-frequency limit is not used.
Gain limit parameter controls the frequency at which the gain is capped. The amplitude spectrum of the filters is clipped at a user-defined maximum gain level and rolls off smoothly after that point. Limiting the spectrum in this manner has the effect of restricting the amplitude treatment at a particular time to the range of frequencies, over which, the signal is believed to dominate data noise.
Gain limiting is required only if amplitude spectra are changed, i.e., the compensation mode is ‘Phase and amplitude’ or ‘Amplitude’.
It should not be used as an alternative to noise attenuation, such that we suppress the boosting of higher frequency noise by aggressive use of the low-gain limit.
One way of choosing a value for the gain limit is to estimate the frequency at the upper edge of the signal passband, edge (Hz), at a particular time T, and to compute the gain limit from the equation below:
G = 27.29 T f e d g e Q av
where Qav = the effective average value of Q.
The part of the standard requirements of a contemporary relative amplitude preserving processing sequence should be as follows:
  • The processing flow should not include processes that modify the amplitude spectrum of the wavelet based on the seismic data spectrum, e.g., spectral whitening, or wavelet shaping, or data driven gains such as AGC (Automatic Gain Control) or similar.
  • Random noise should be attenuated, as should coherent noise as much as possible. Noise present in the data will be boosted, and potentially over boosted, by the Q-compensation correction.
  • Multiples should be attenuated as these have a different travel path and dispersion to the primaries.
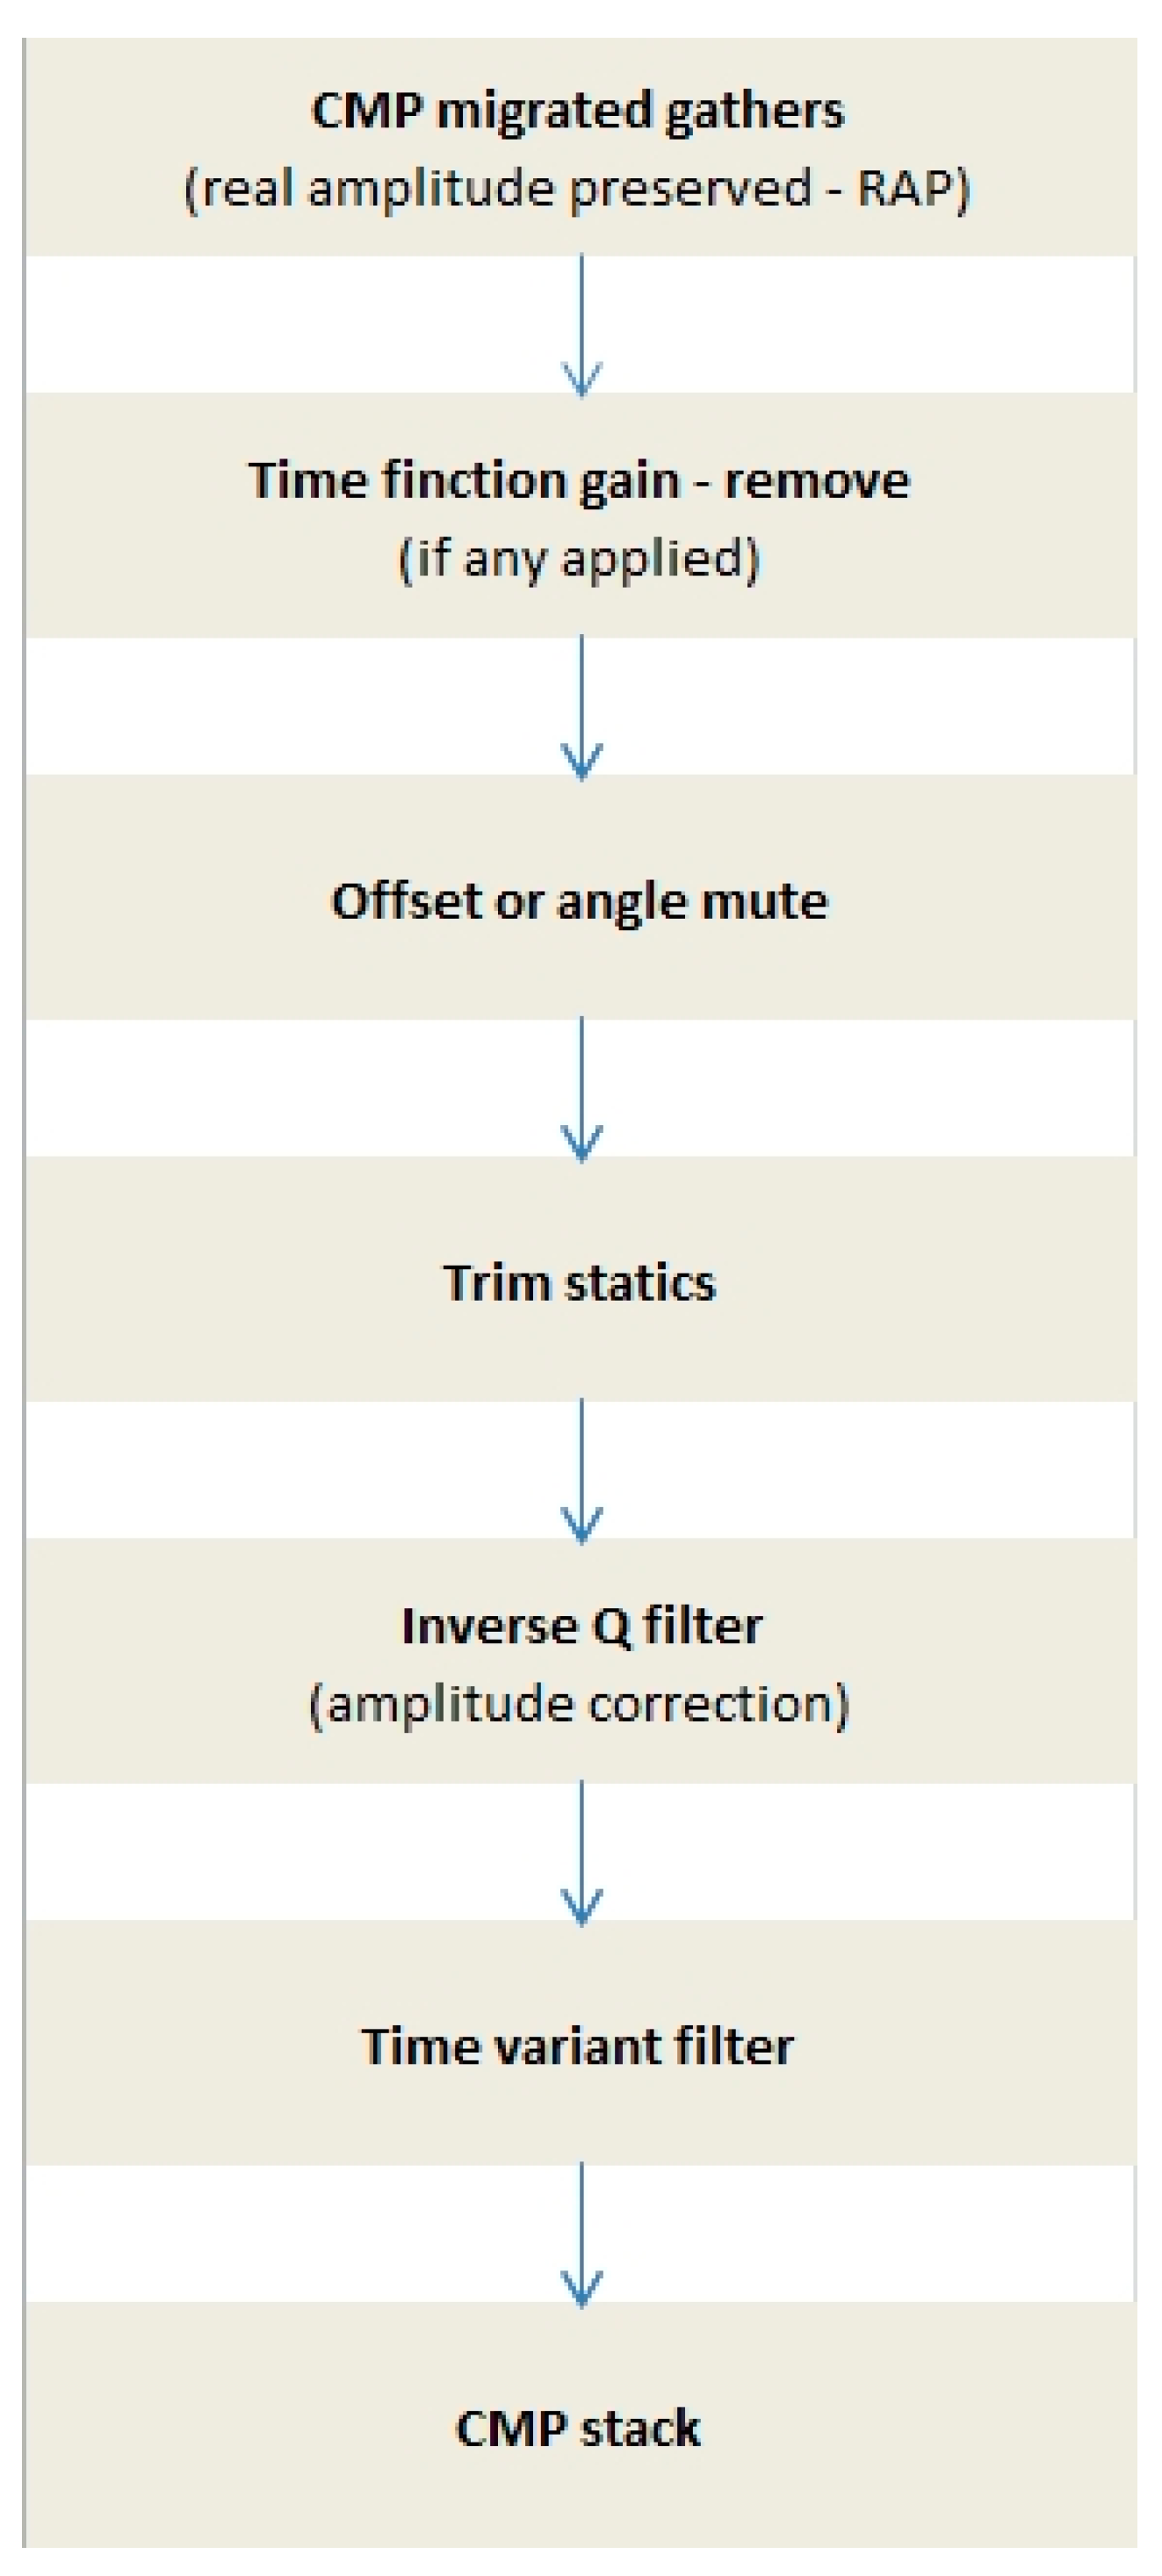
The simple processing flow, which was used in our case for Q amplitude correction, is shown below (Figure 5).
To avoid the impact of certain processing procedures on the spectral characteristics of the seismic signal, it is recommended to apply IQF in the phase correction option already at the initial stage of processing (i.e., without scaling and before deconvolution). For the purpose of performing amplitude correction to increase the vertical resolution of seismic data, IQF application is usually implemented on final collections before or after migration in the version of real amplitudes. Collection gathers should be NMO (Normal Moveout) corrected and full static corrections (primary, residuals, trim) should be applied to the traces. In addition, to avoid generating artifacts by the IQF procedure due to the presence of a low-frequency signal (stretch) after the NMO application, it is necessary to apply the correct muting.

5. Results

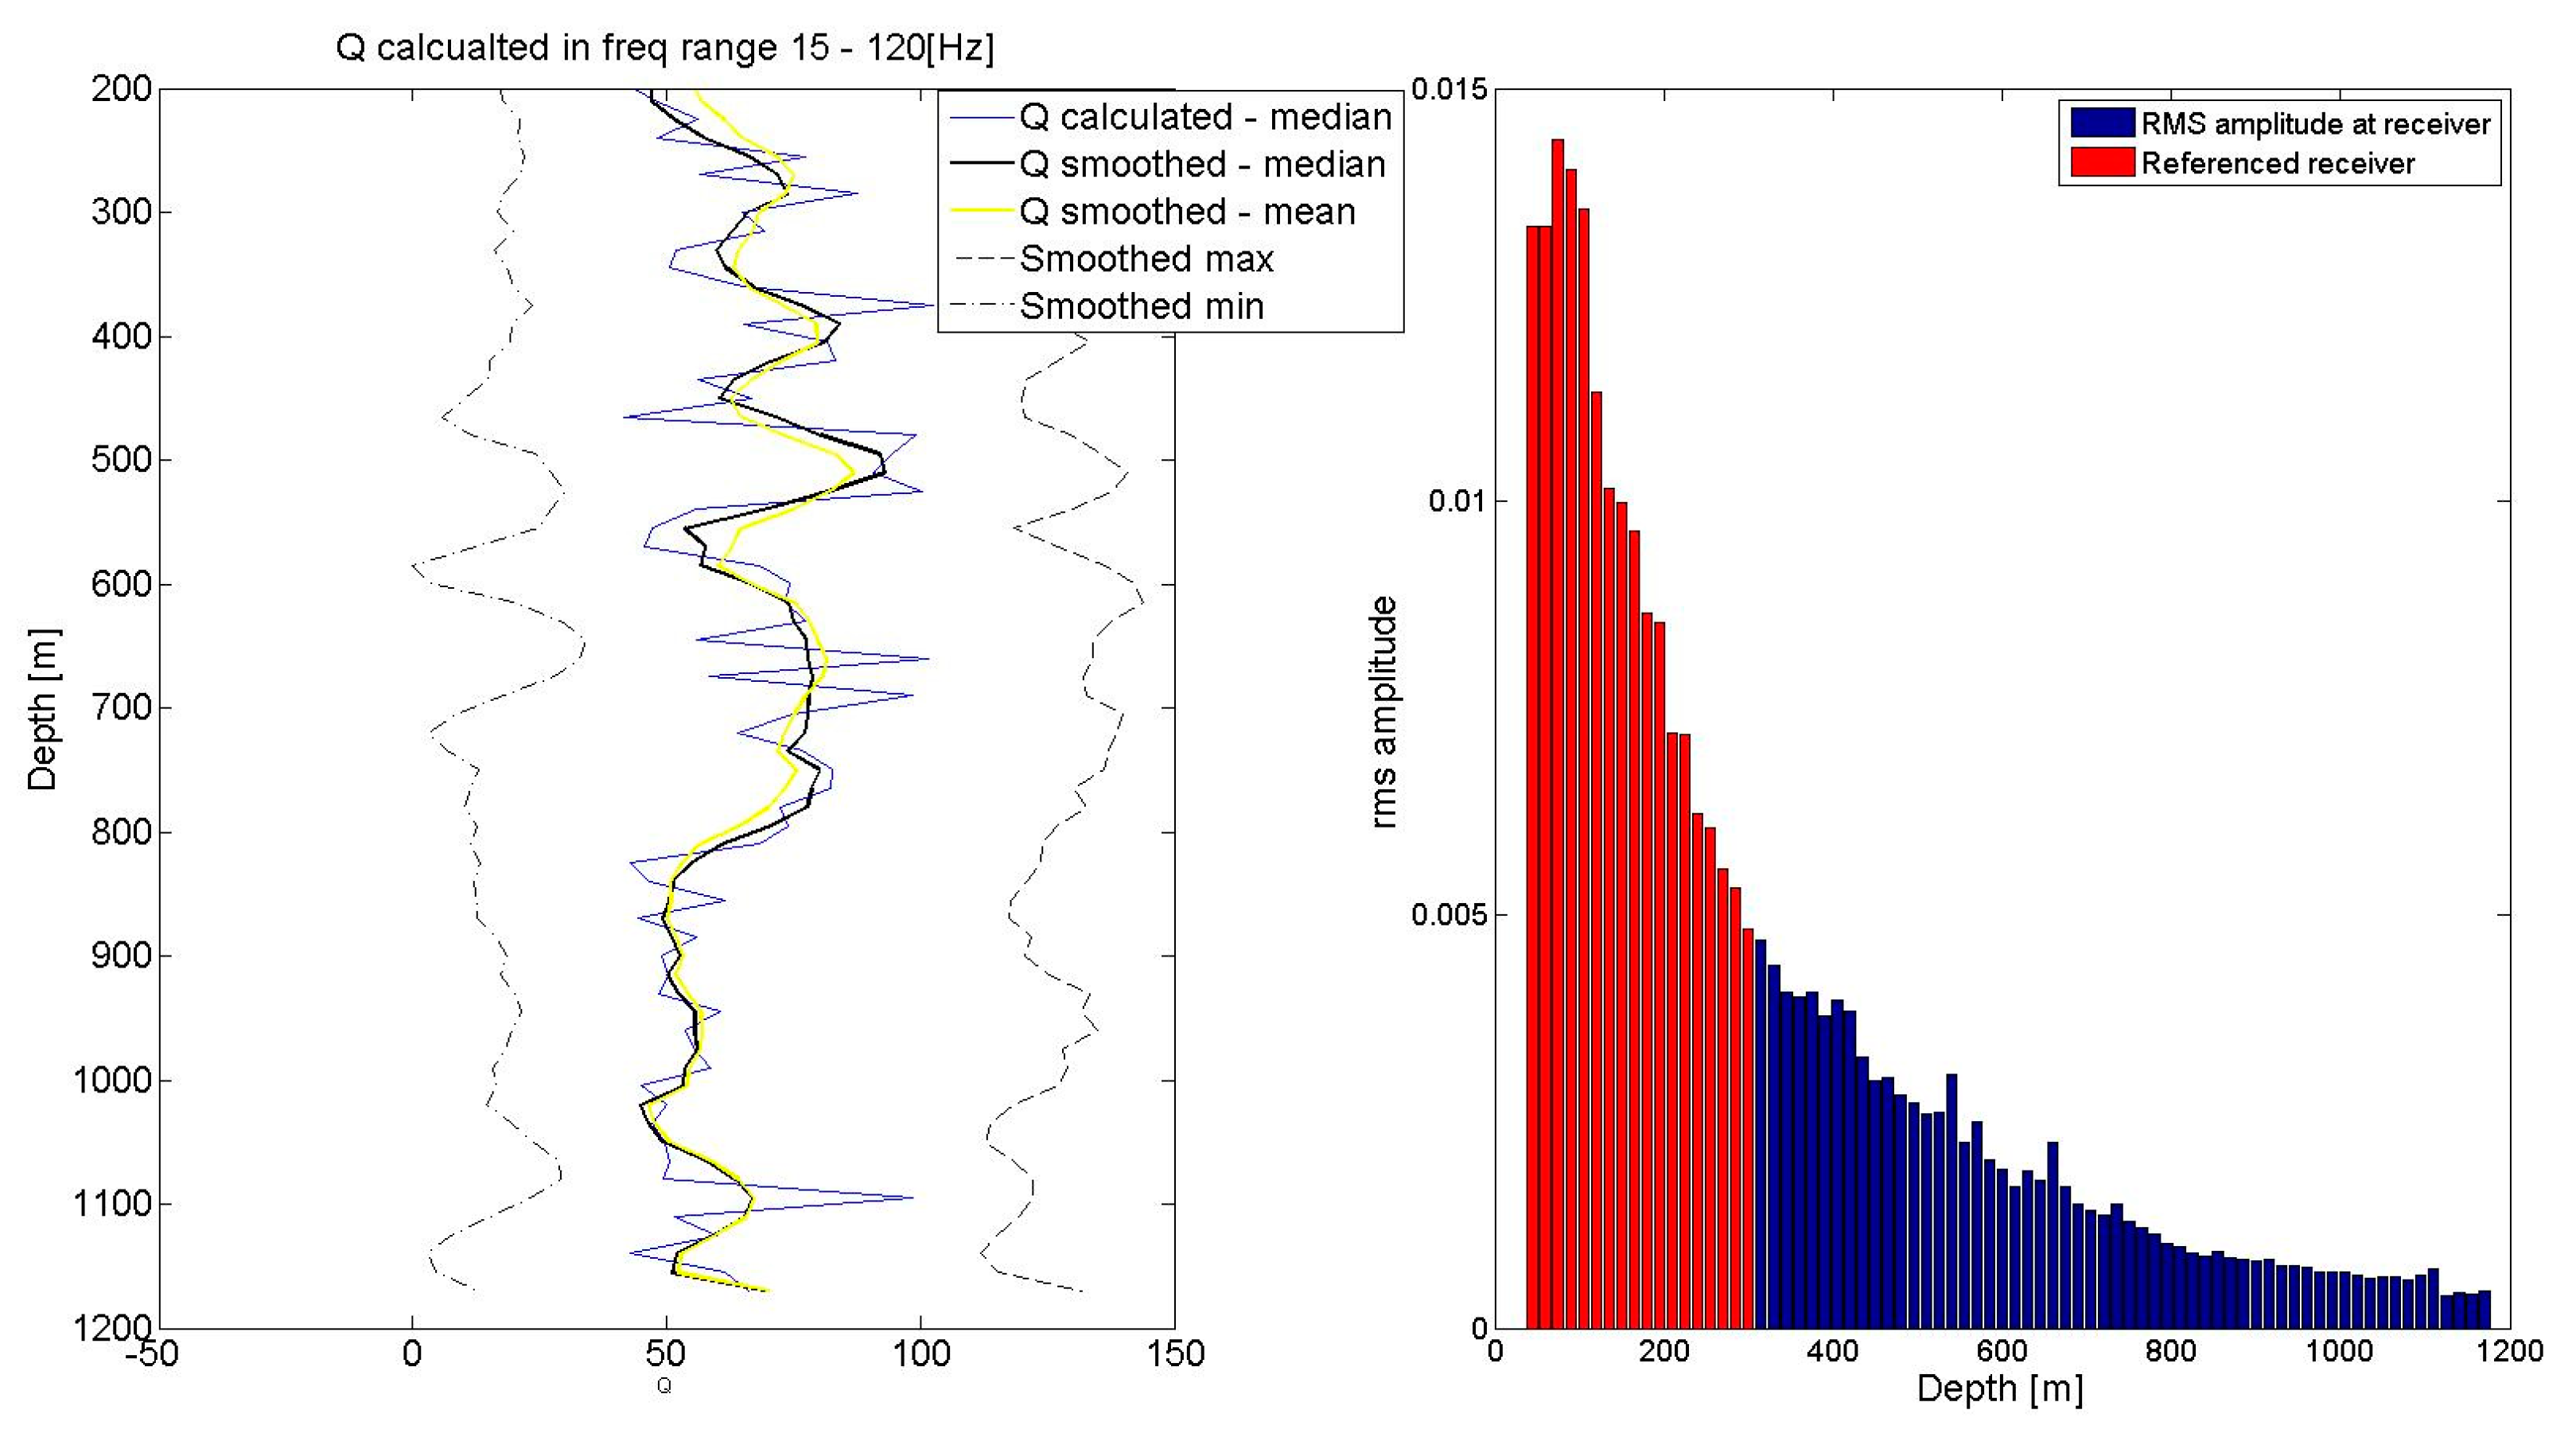
We were able to estimate the quality factor in the DS-2 borehole using both spectral ratio method on the VSP data, as well as the dispersive method used on the acoustic well-log data. In case of the VSP data, we used receivers from a depth range of 45 to 299 m (17 receivers). The results are presented at (Figure 6) in the form of smoothed curves. Smoothing was performed using Savitzky–Golay filtering [39]. The final Q distribution is presented as a median value from all obtained Q curves. We also show the mean value as well as the range of the obtained results (min and max from 17 Q curves). We observe high variability of the obtained Q values, However, all median/mean and min/max curves show a very similar trend.
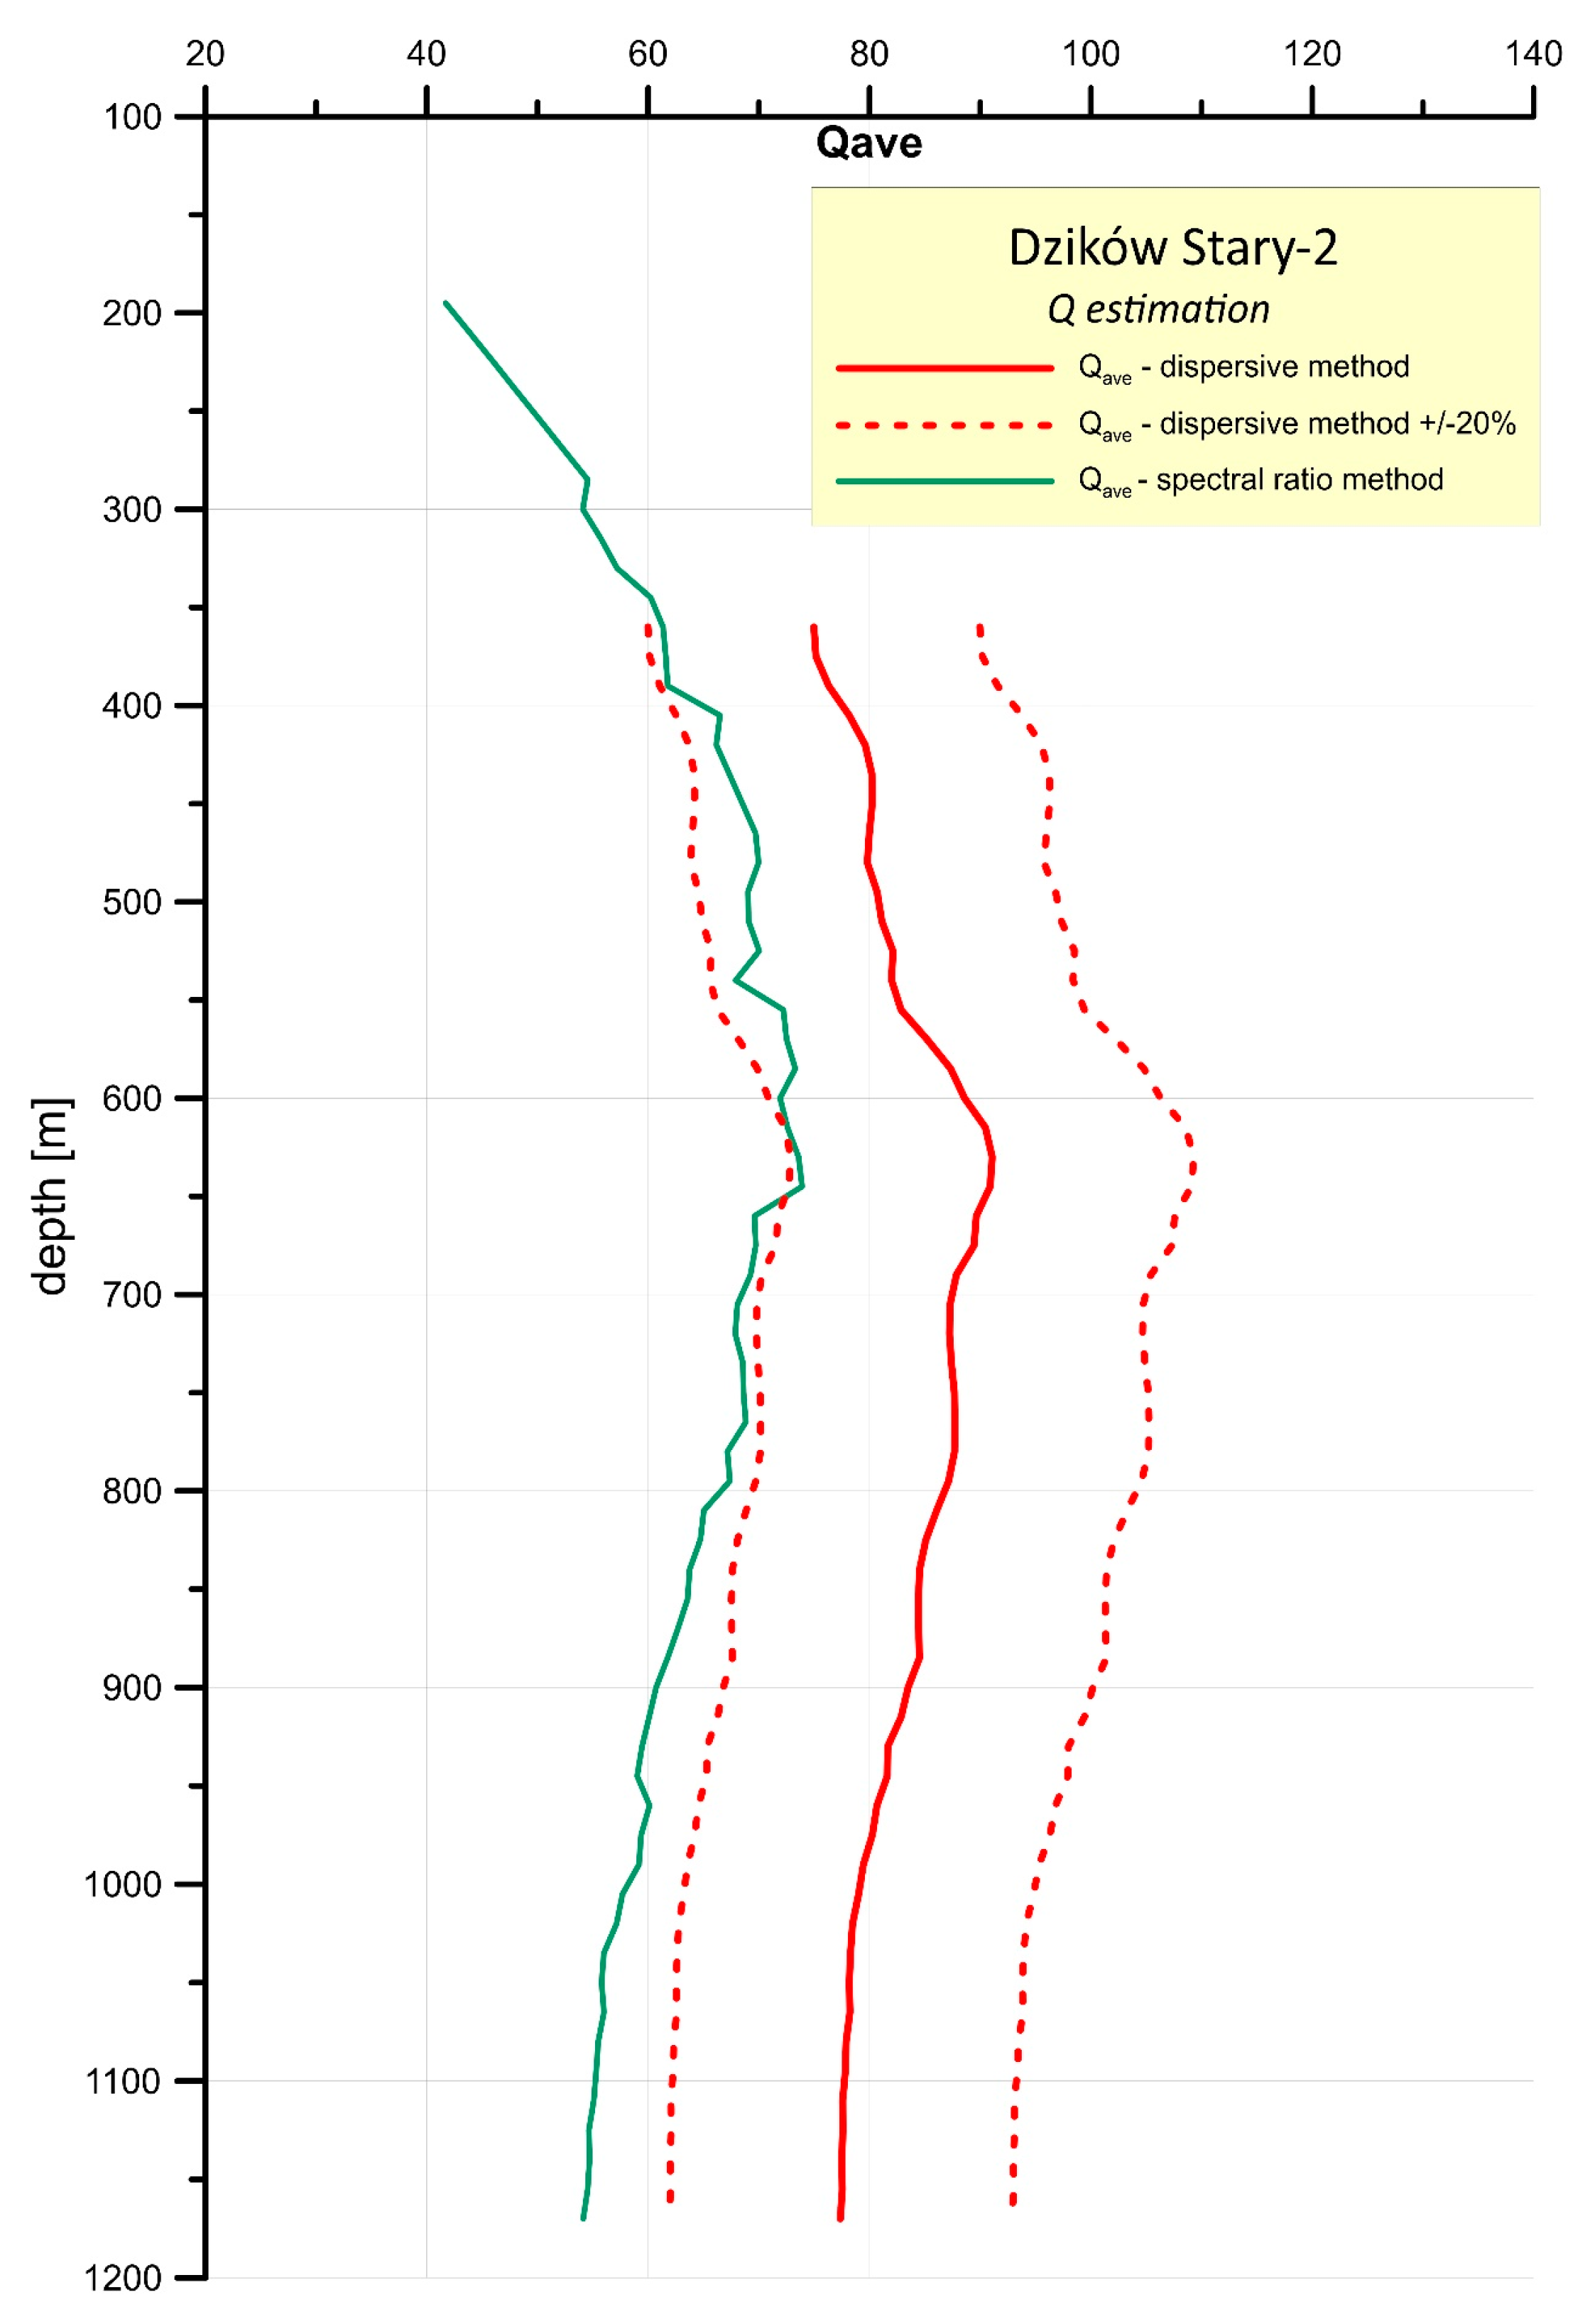
To be able to obtain a meaningful comparison to the Q curve calculated using the dispersive method, we further smoothed the VSP median Q curve using the moving average (Figure 7). The shape of the obtained Q curves is similar, However, due to uncertainty of the frequency of the well-log data, the obtained results differ in value.
The effectiveness of the IQF was tested on M-4 transect stacked sections after migration. For the IQF procedure, we used Q distribution from the spectral ratio method (green line on Figure 7). The obtained results were compared to the seismic section without applying IQF.
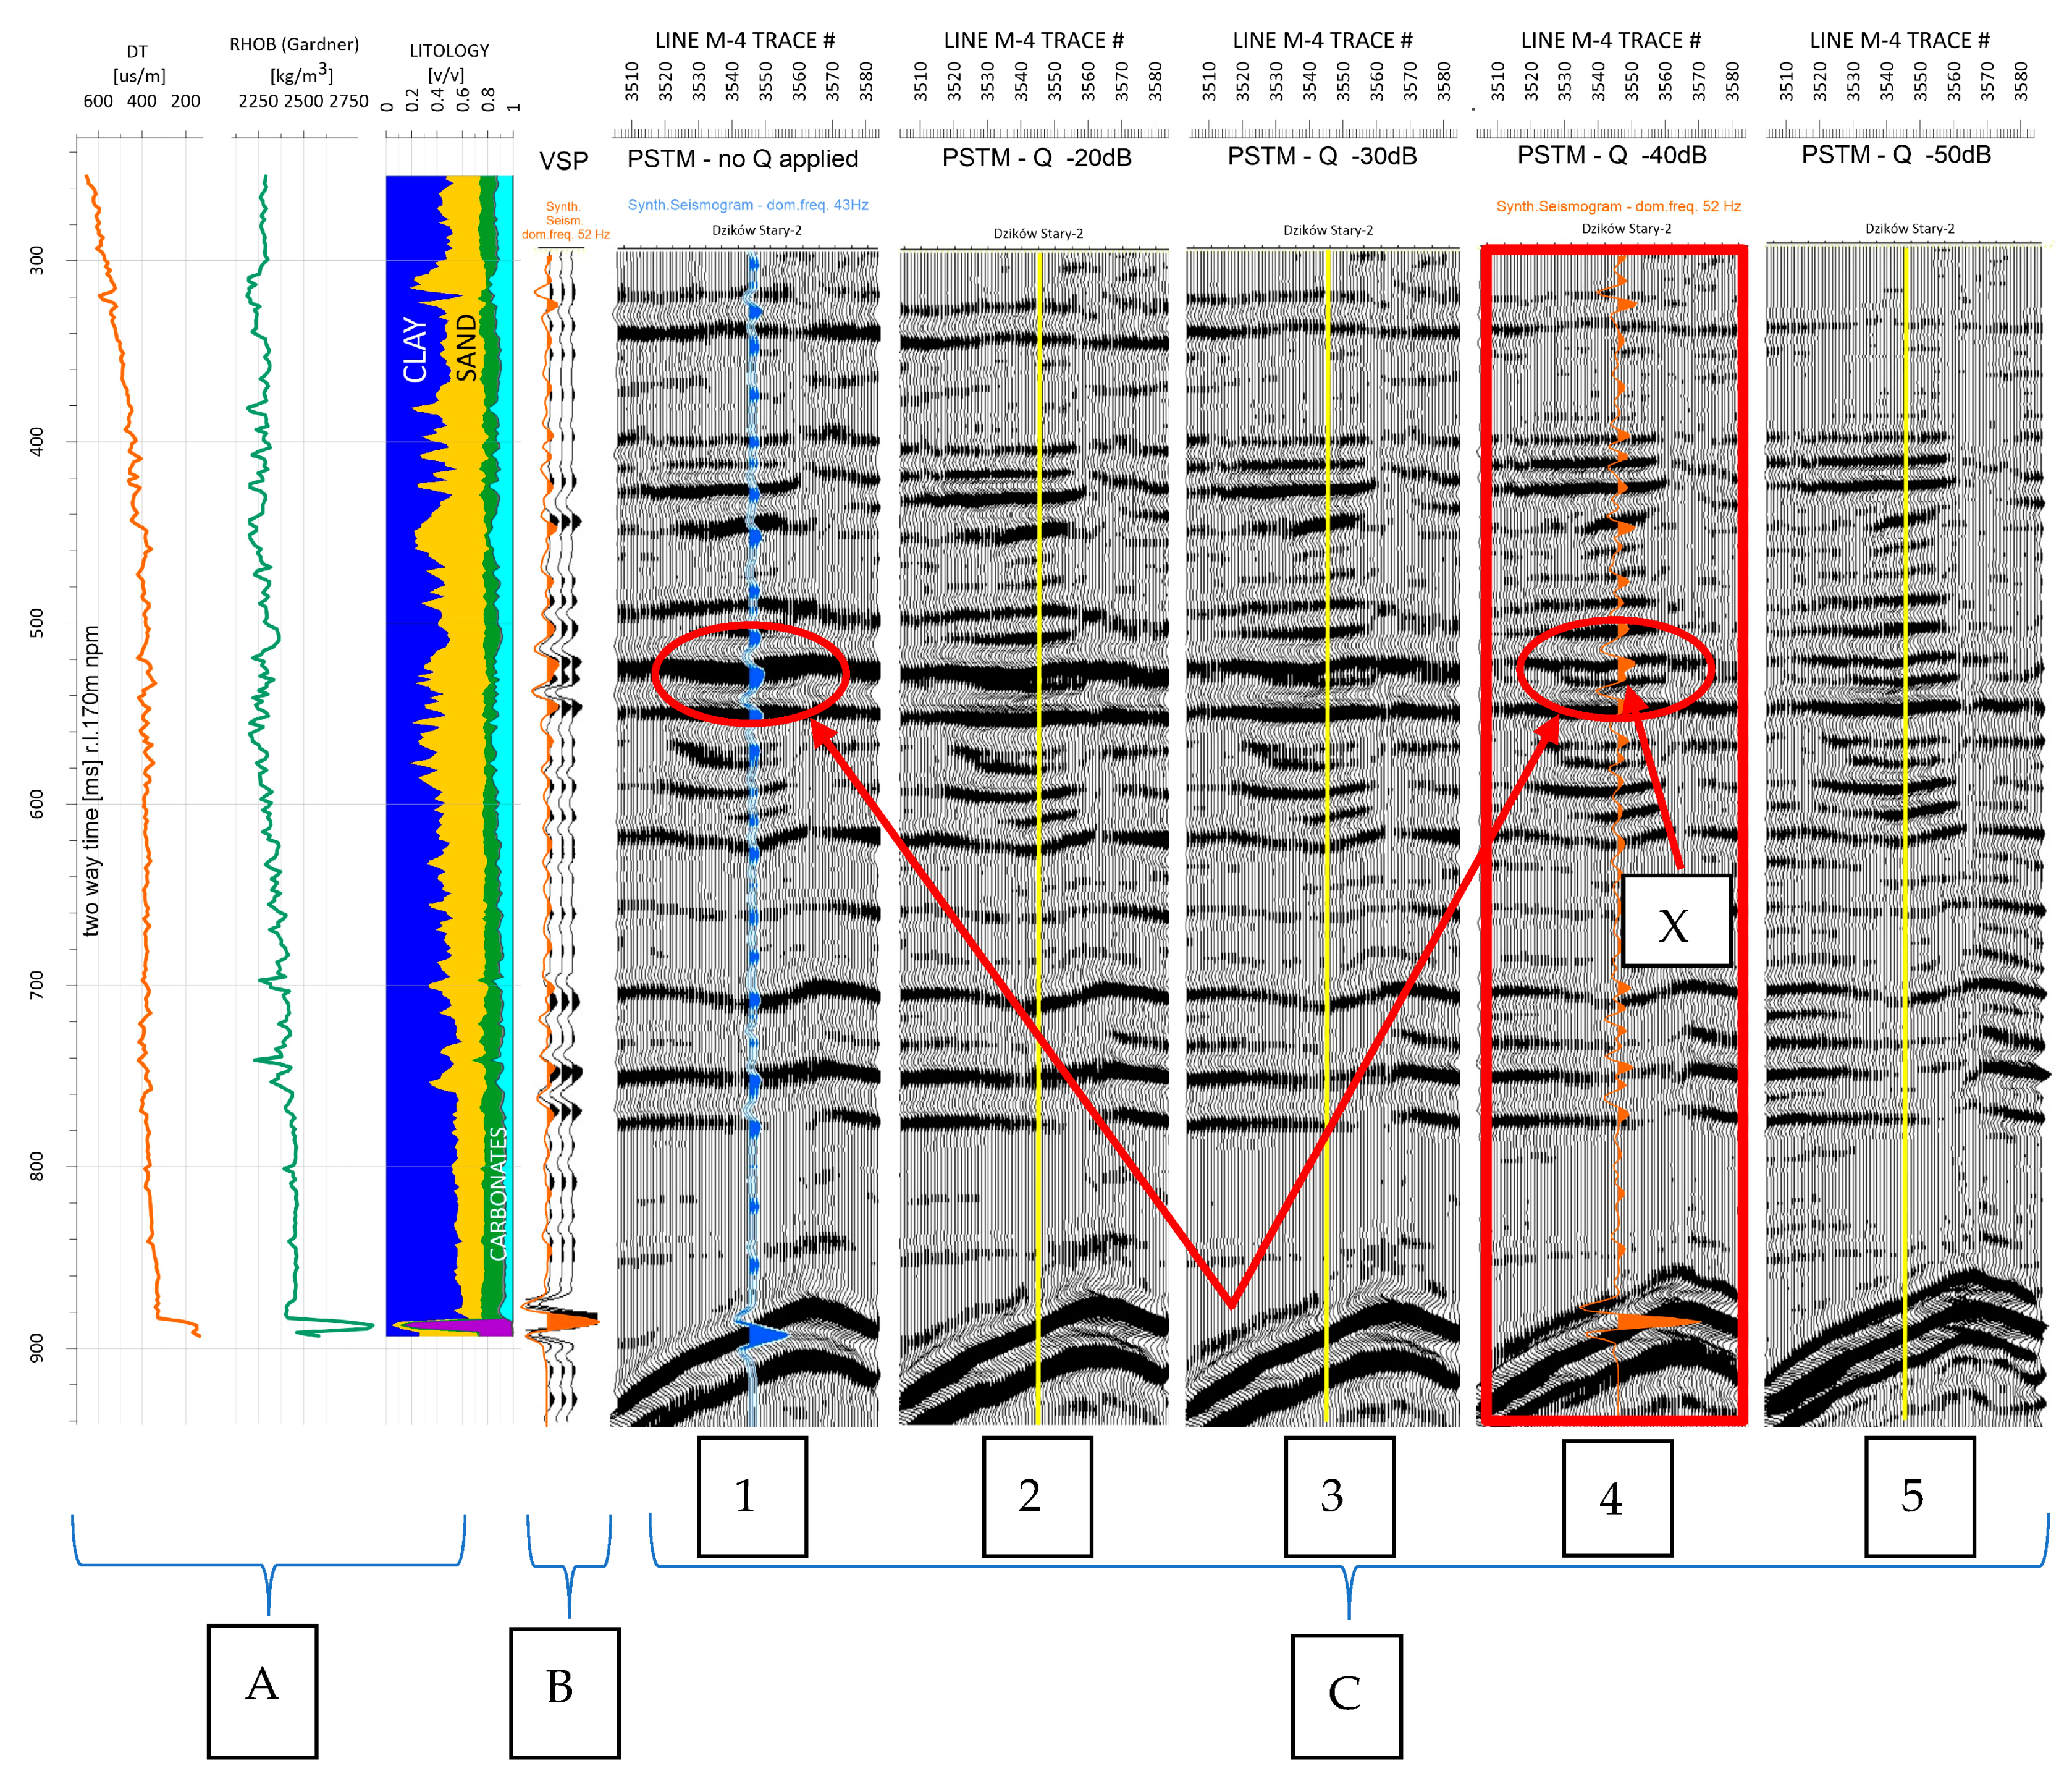
Several amplitude gains and Q distributions were tested. We used gains of 20, 30, 40 and 50 dB (Figure 8). As for the Q distributions, we used Q values presented at (Figure 7—green line) resampled to equal intervals of 50 ms with the Q value of 25 at depths where we did not have any Q measurements (near surface c.a 200 m).
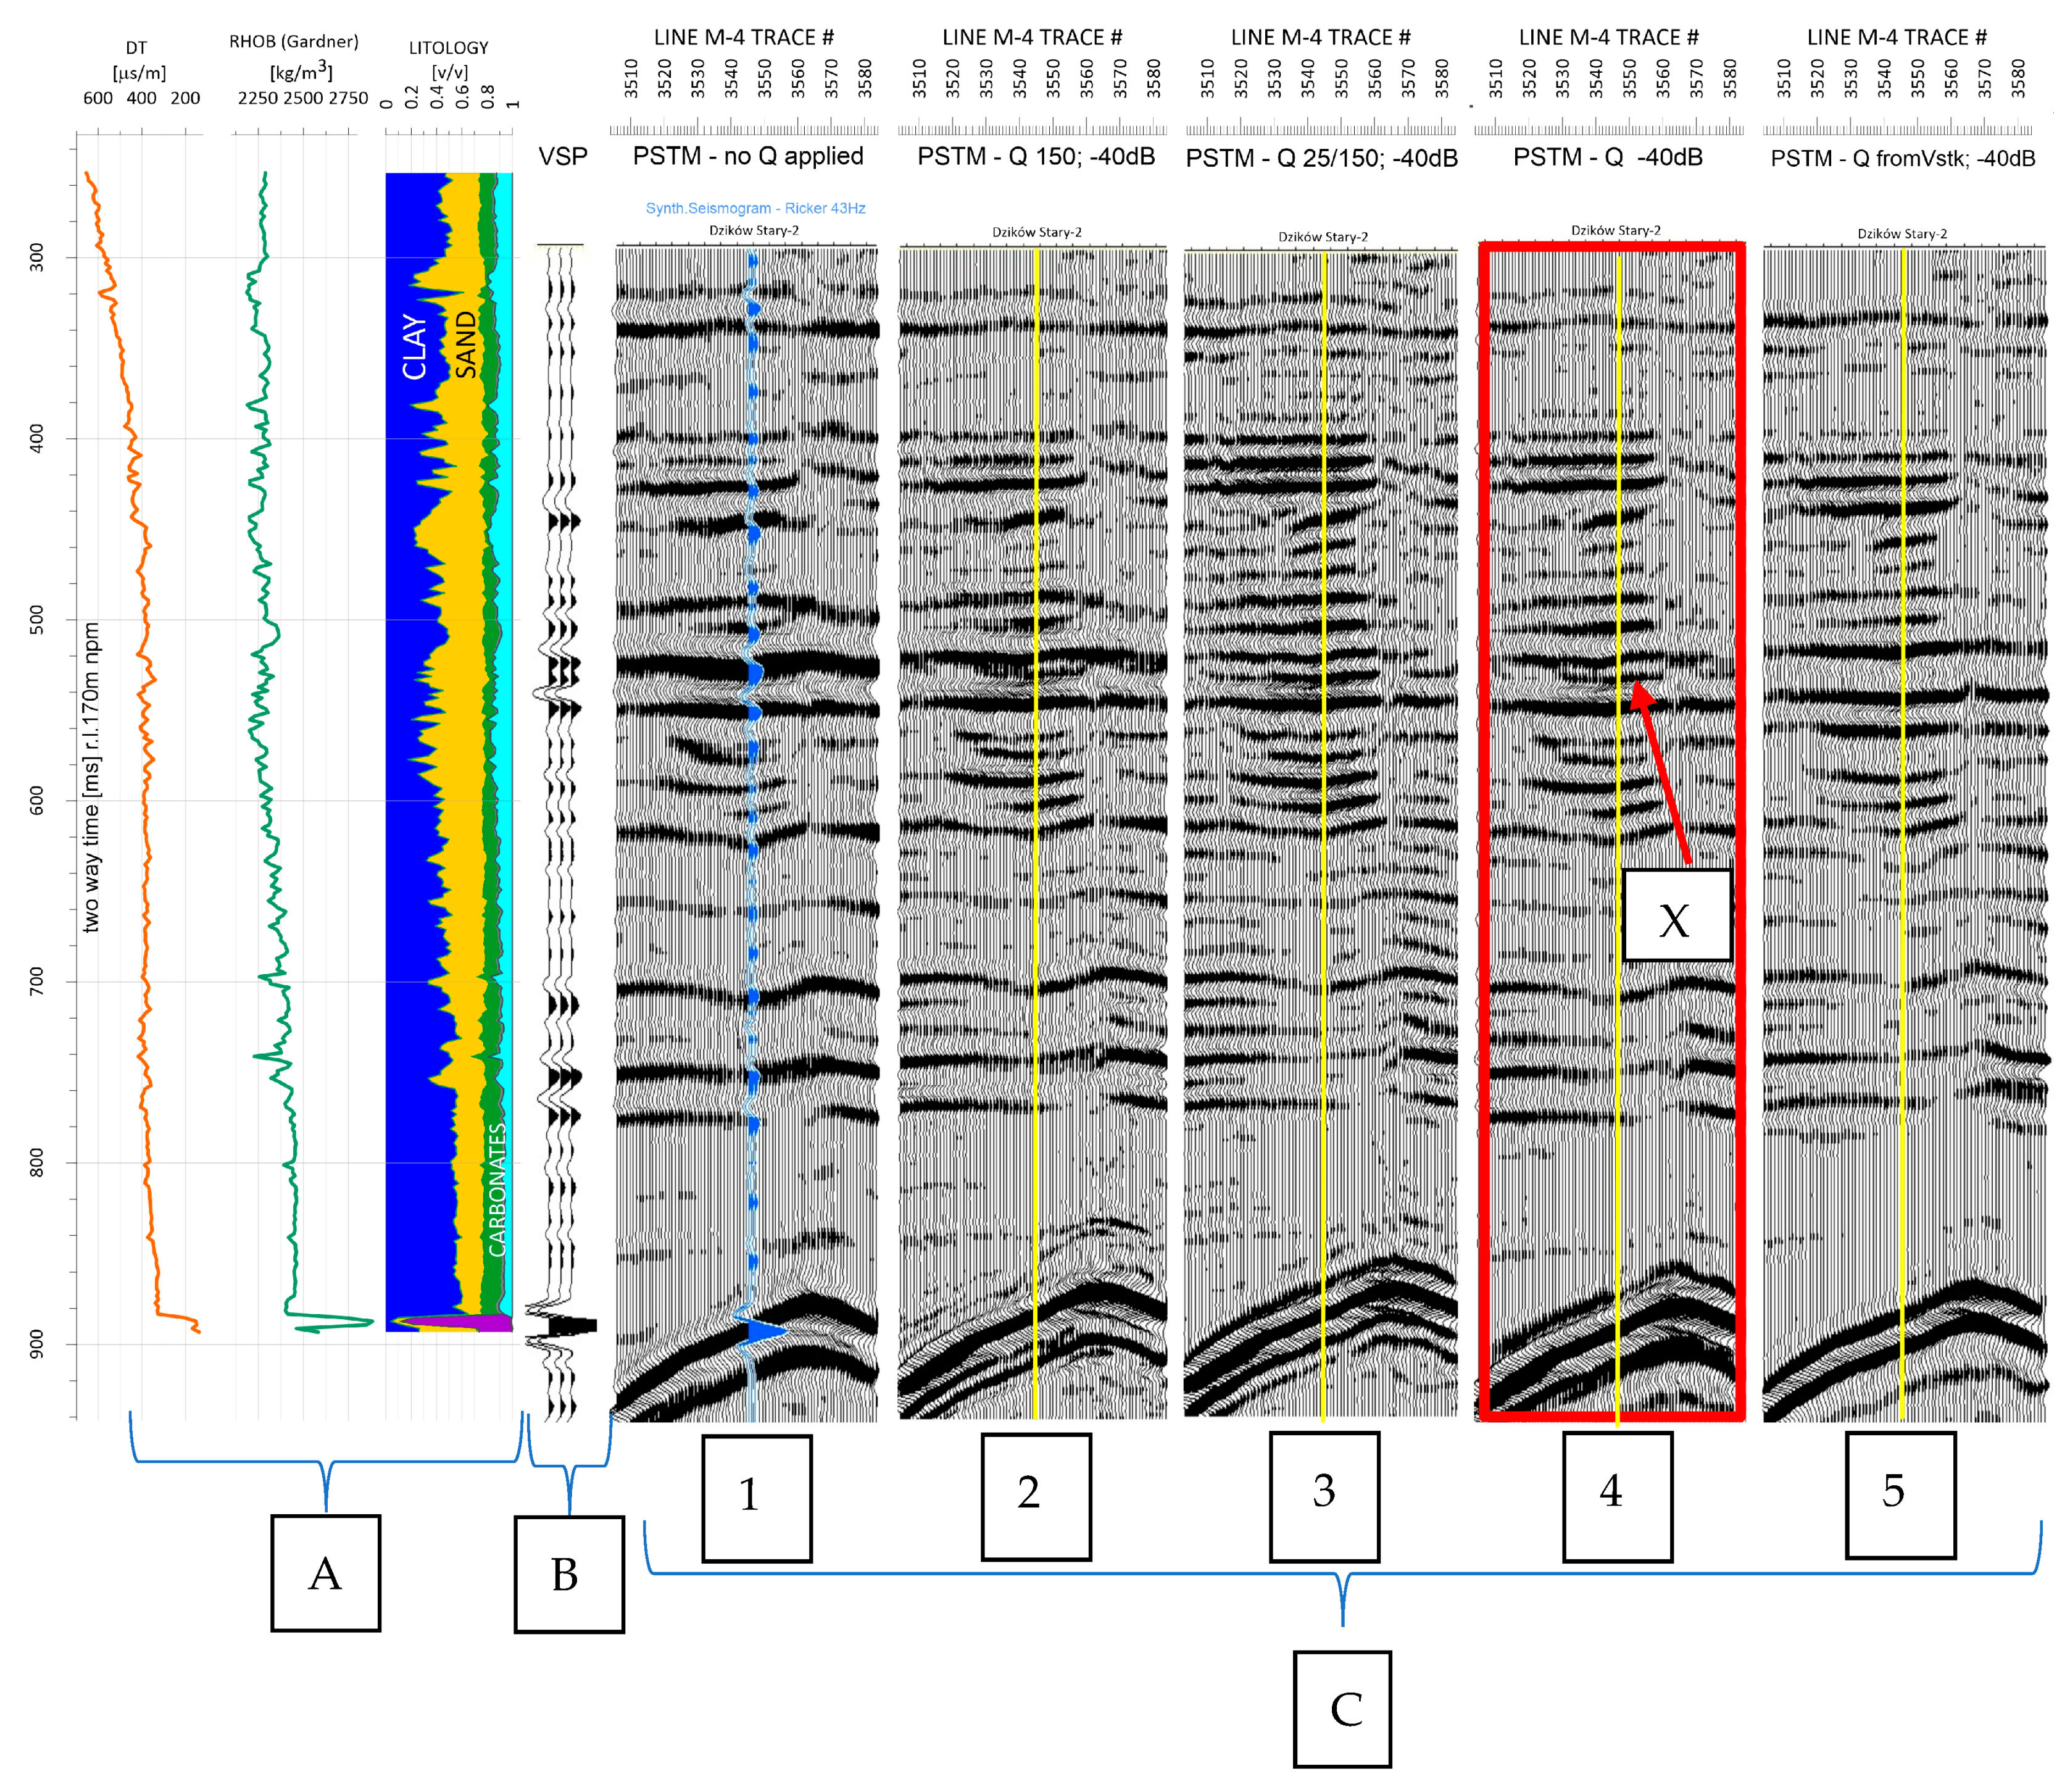
In the second test (Figure 9), we used different values Q factor. The first panel (No. 1) corresponds to PSTM section without IQF applied. On the next panel (No. 2), we used a constant Q of 150 in the whole length of the well. Panel 3 corresponds to the constant Q of 150 but with a value of 25 at the near surface depth. Panel 4, with time variant Q distribution, is our recommended option, see Figure 8. The last panel is the Q value calculated based on the stacking velocities.
Based on the analysis of the results, it was found that amplification up to 20 dB does not generally expand the signal spectrum in the higher frequencies, and that the increase in vertical resolution of the section is small (Figure 8 panel C2). A significant increase in resolution is observed for a gain of 30 dB and 40dB (Figure 8 panel C3 and C4). Using a gain of 50 dB provides an excessive increase in frequency (Figure 8 panel C5).
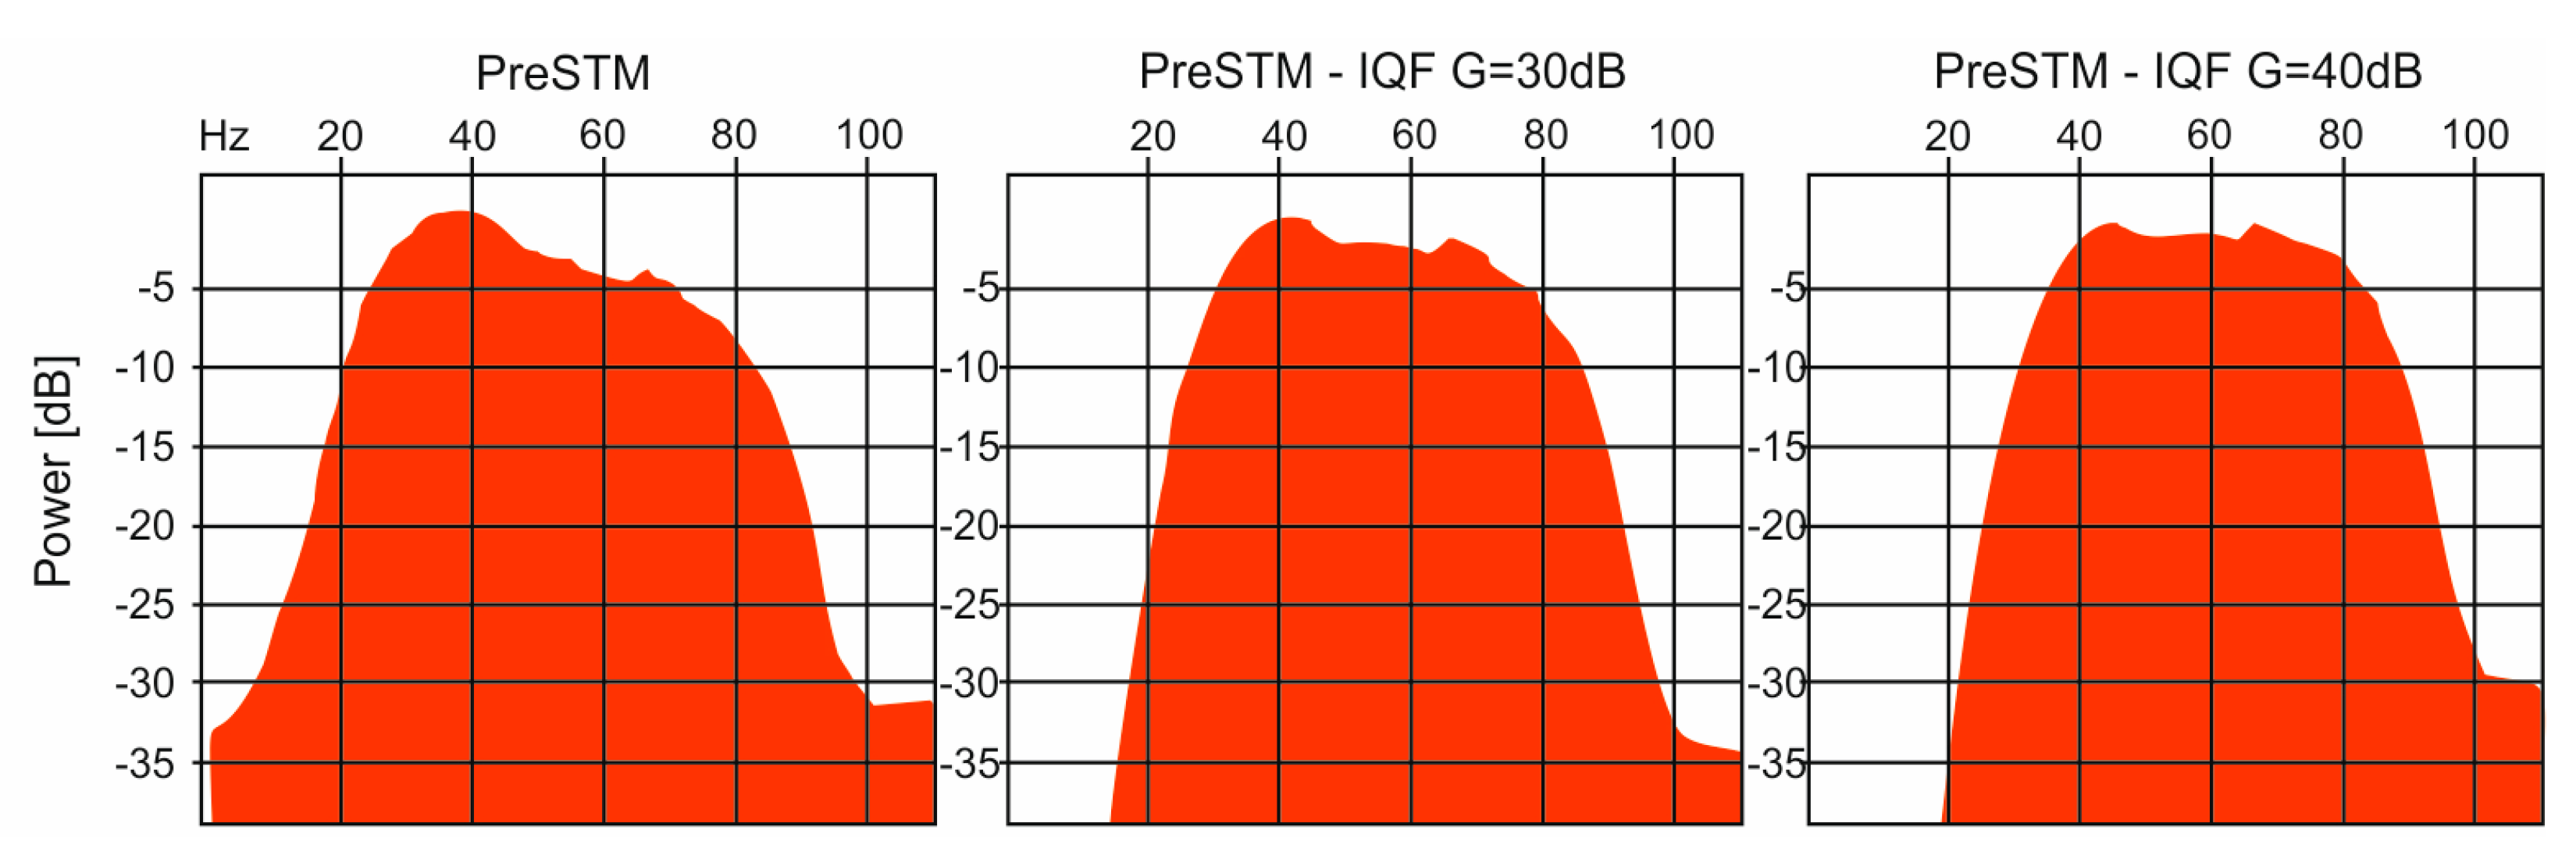
Comparing different distributions of Q values for chosen gain 40 db (Figure 9 panels C2–C5), we can conclude that the variant with an estimated variable Q distribution (panel C4) makes the dominant signal frequency increment by 9 Hz (Figure 10), practically to the level of the section with VSP (Figure 9 panel B).
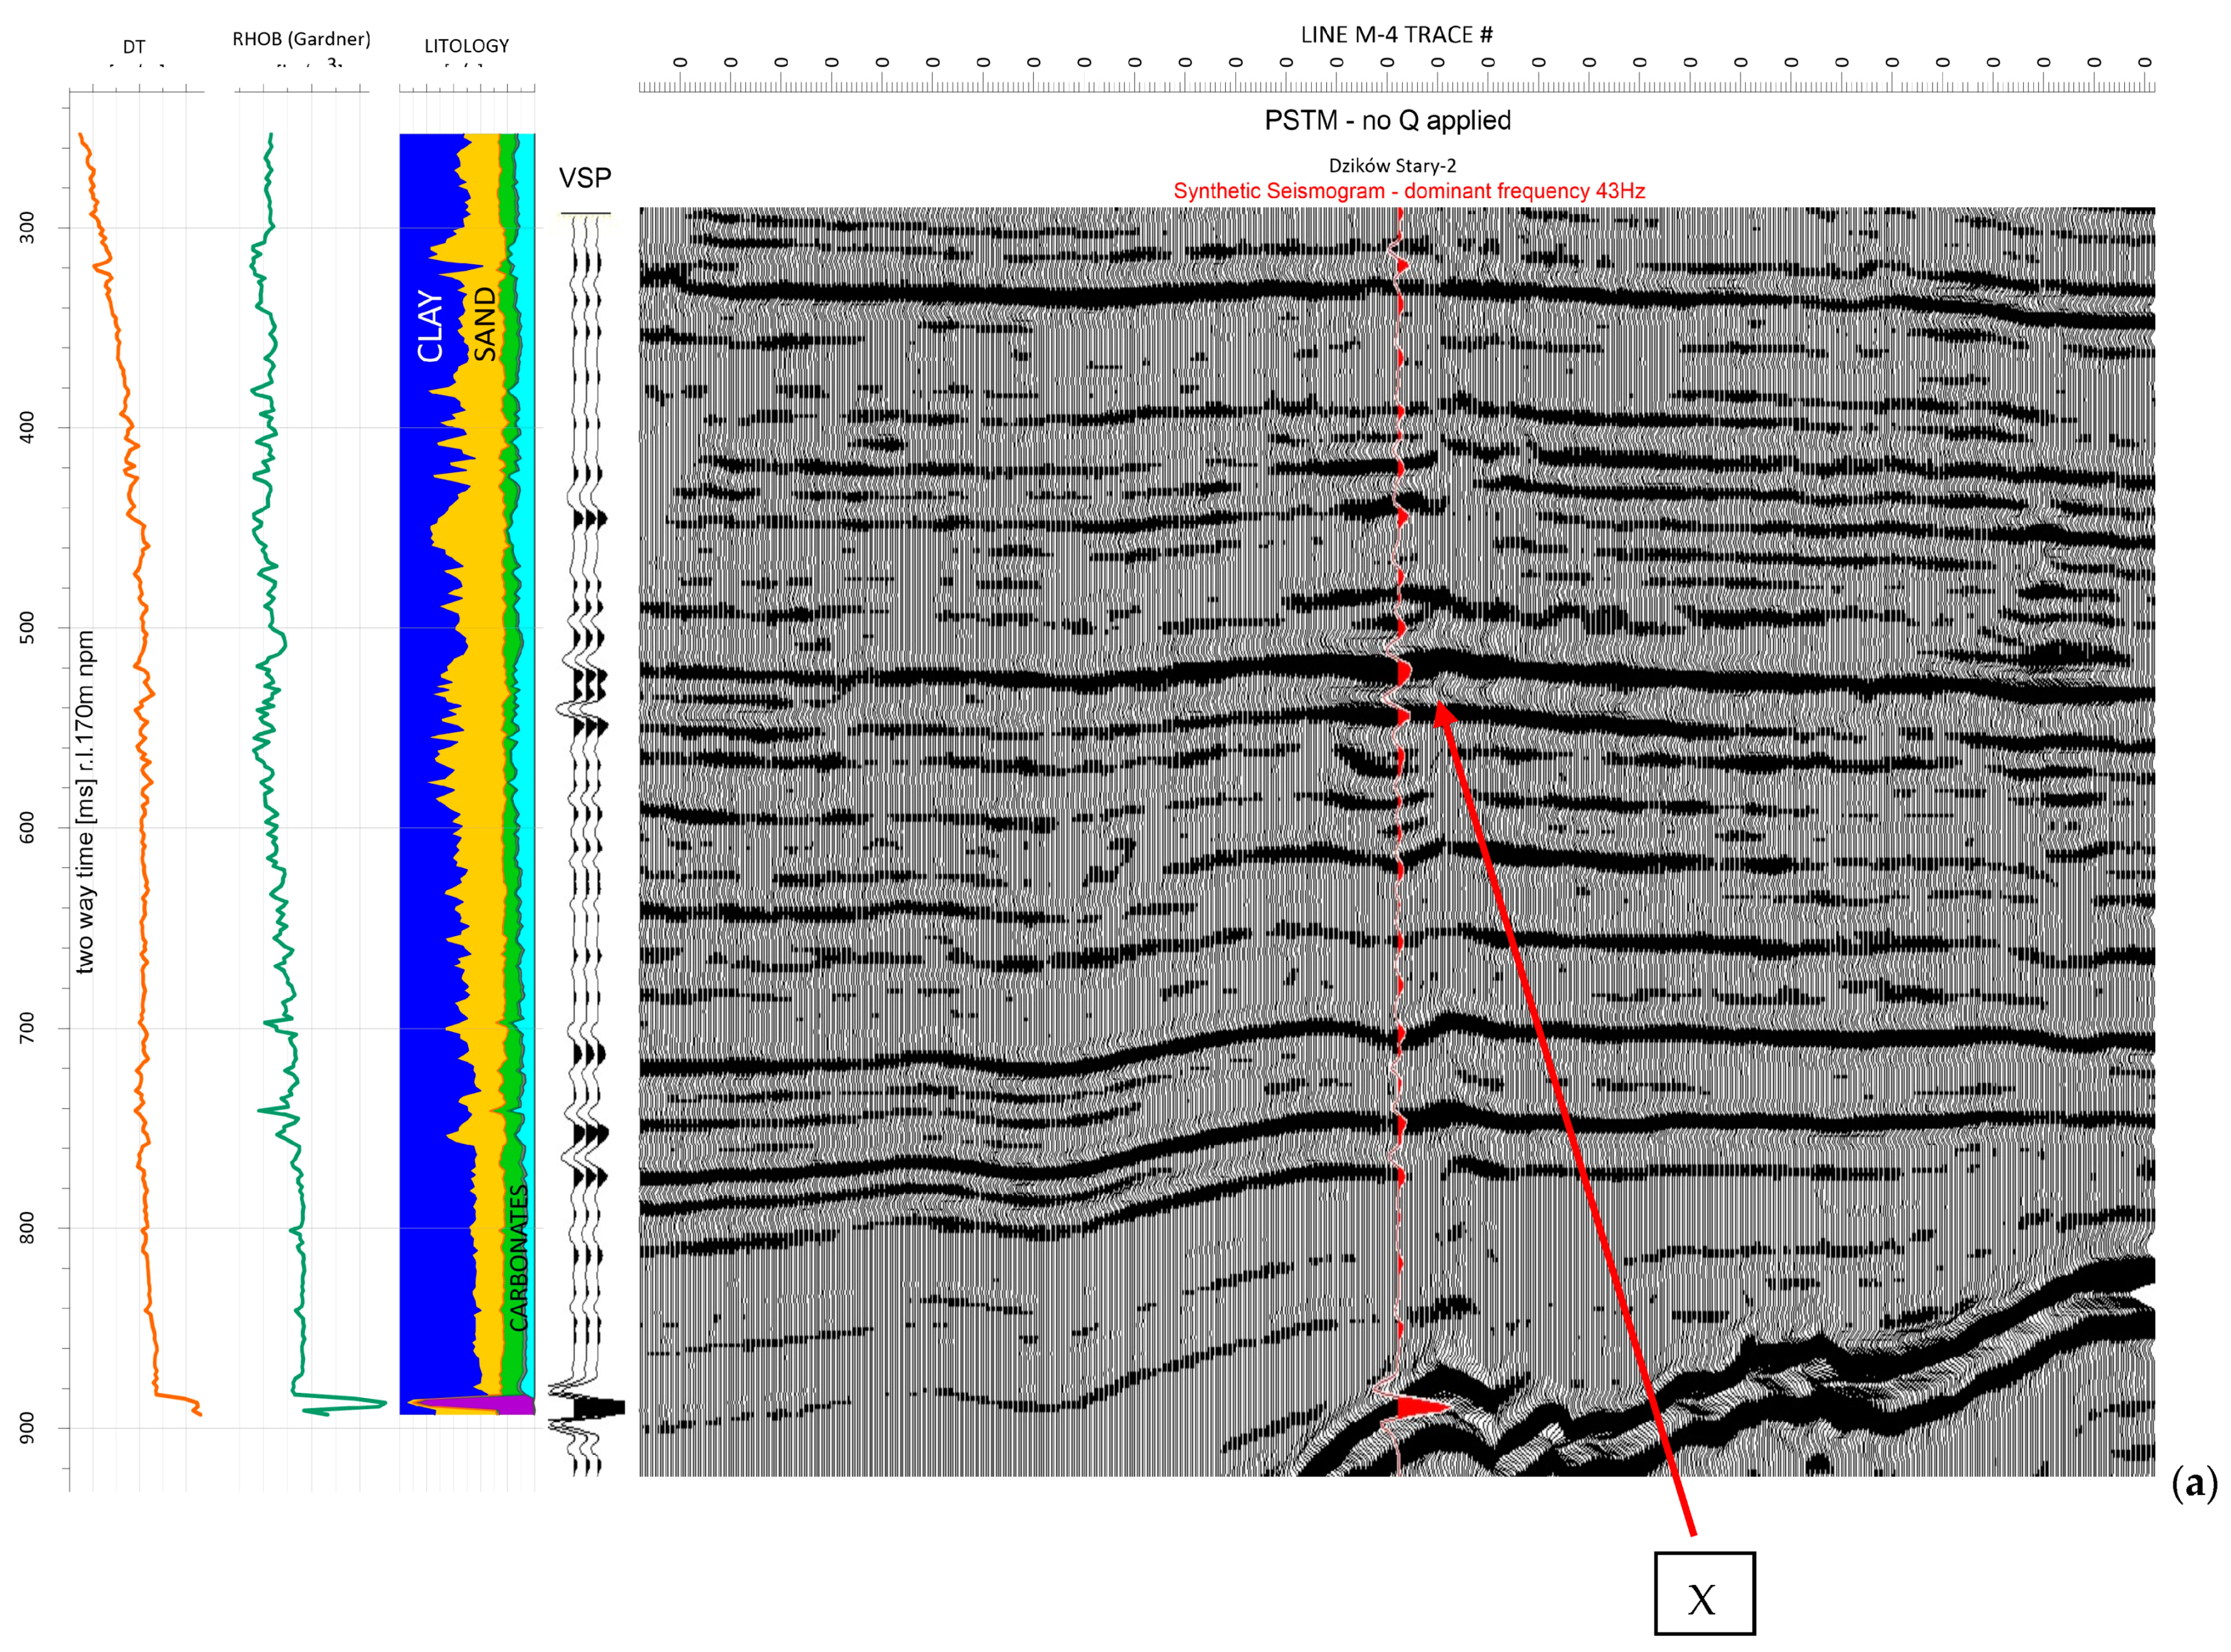
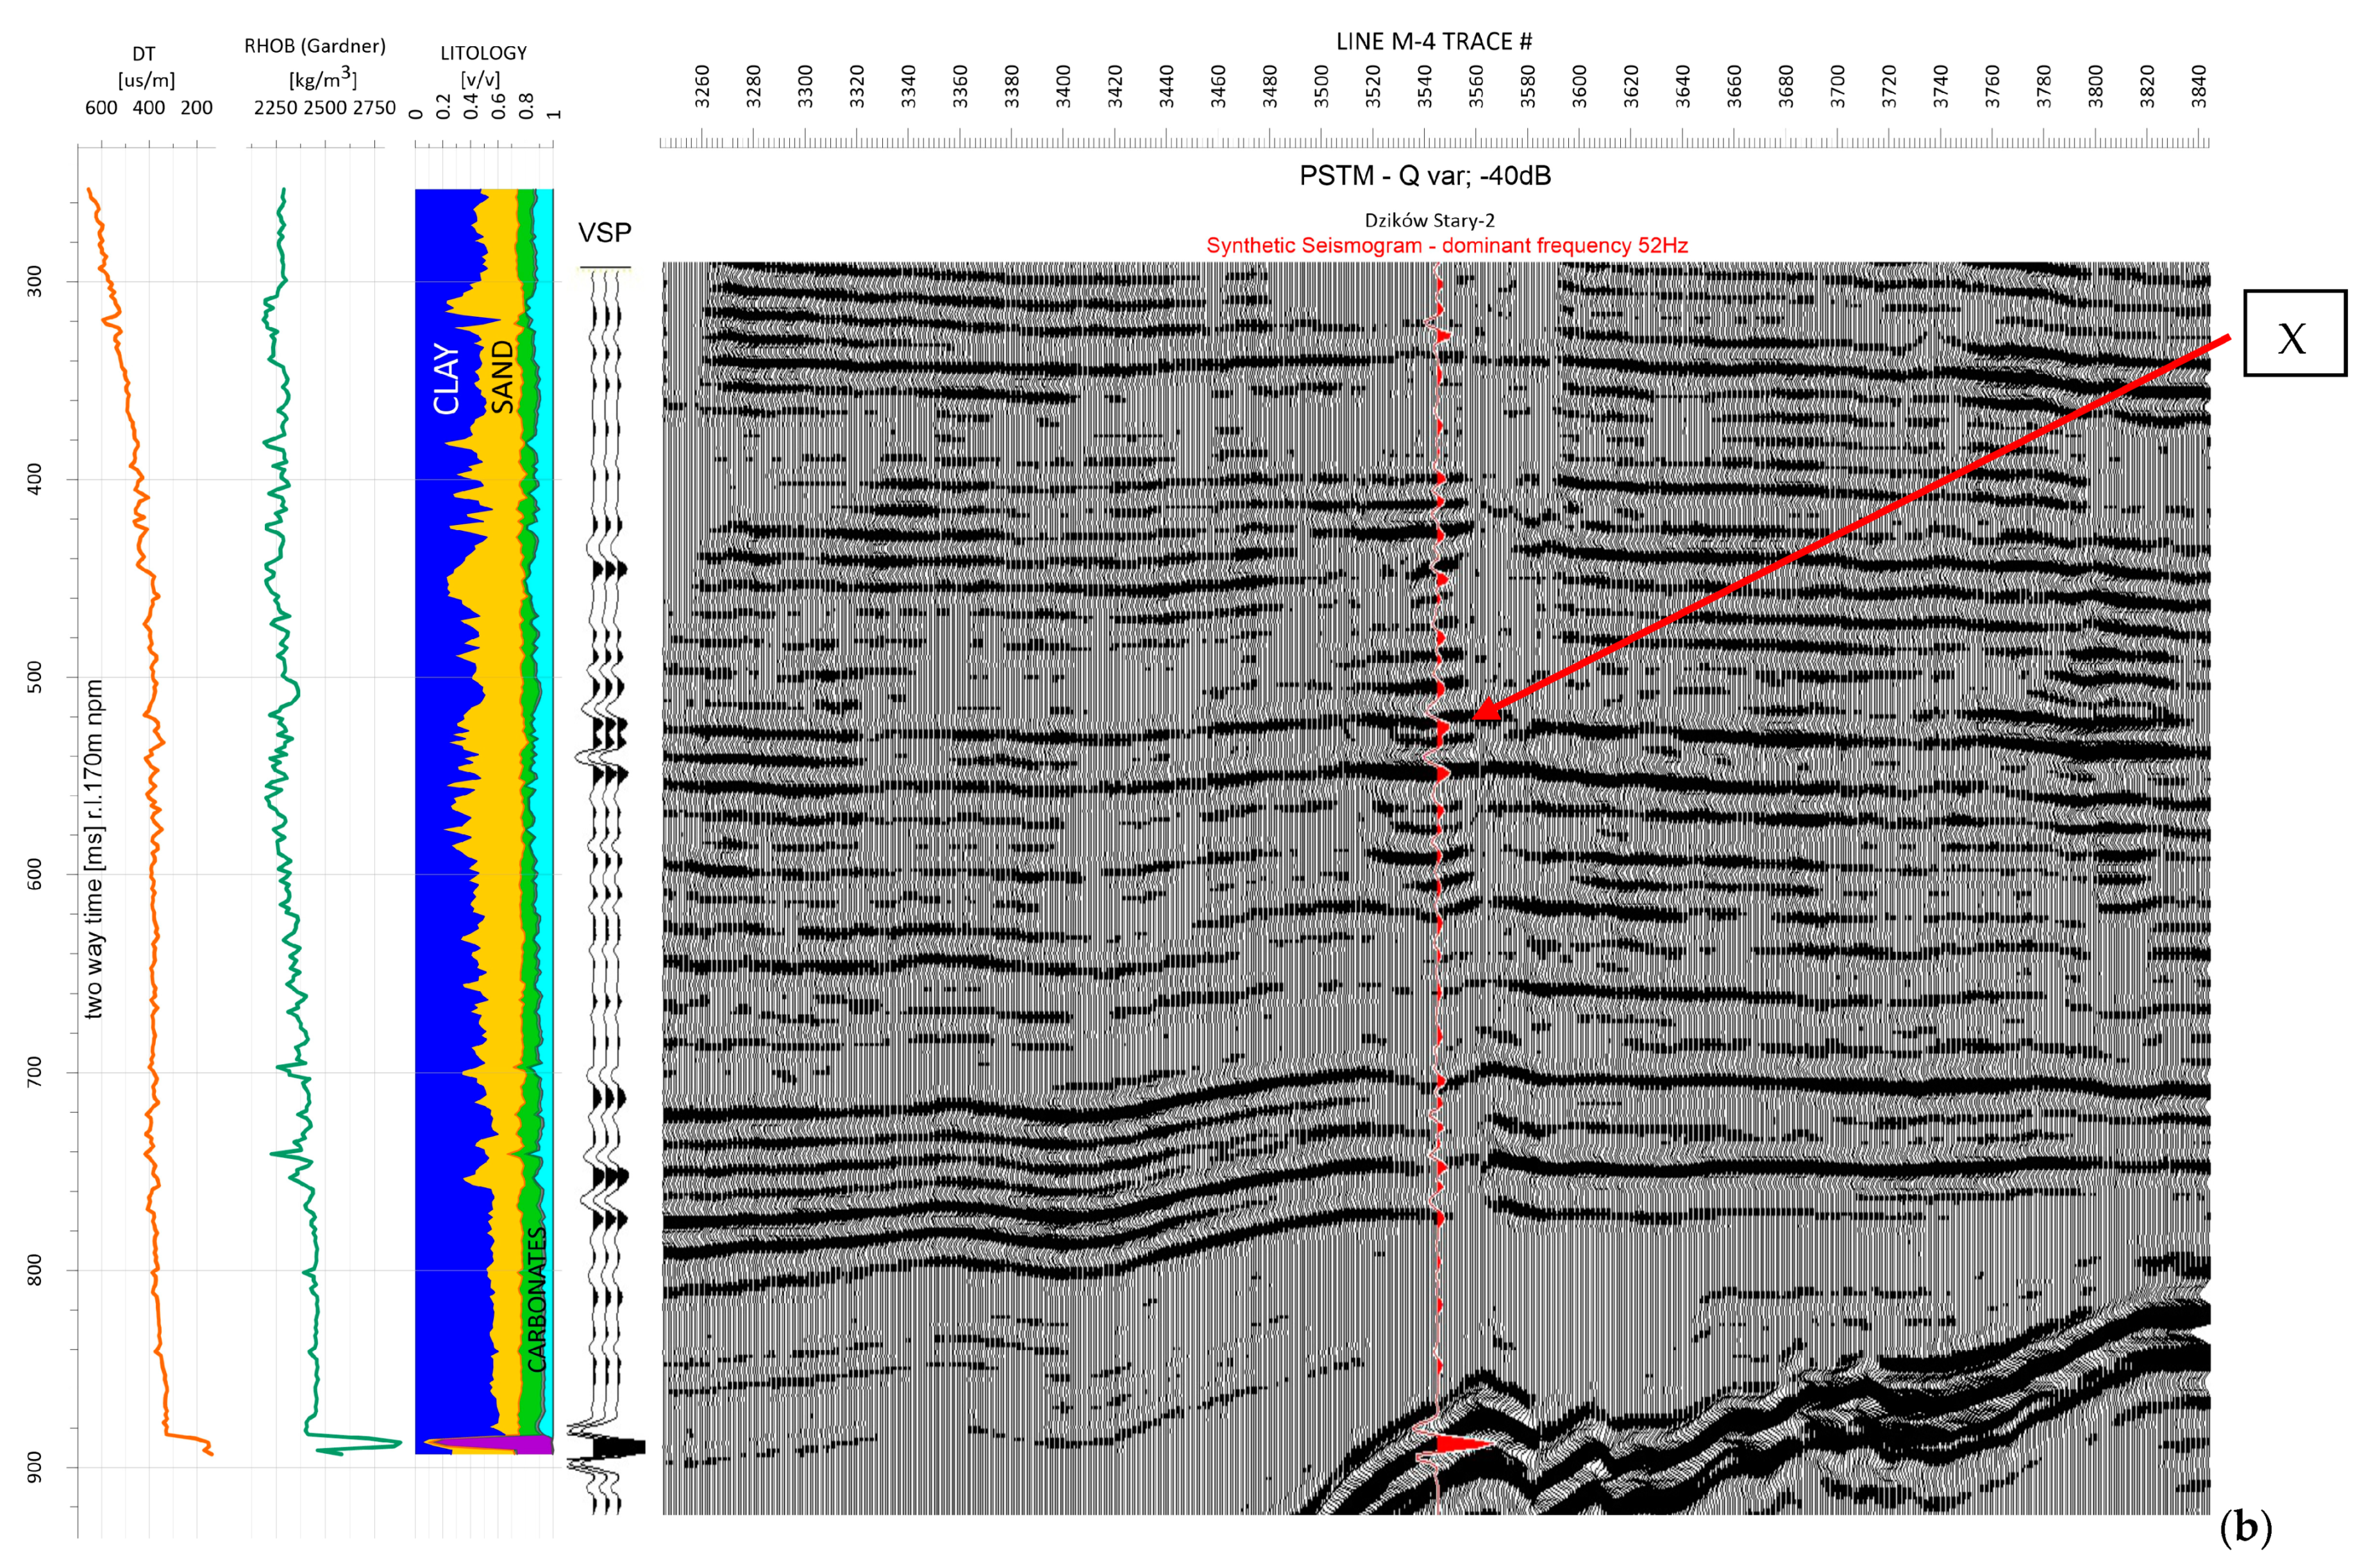
The significant increase in vertical resolution makes the sequence of reflections on the PreSTM section after IQF similar to those occurring on the VSP corridor sum. This is seen in the key reflection marked in Figure 8 with point X, which on the original PreSTM section is characterized by a single, large amplitude (upper panel Figure 11), while on the post-IQF and VSP data, it clearly splits into two reflections (lower panel Figure 11), thus signaling the presence of a thin overlap at this location, as confirmed by the lithological profile derived from the well-log data. In the higher frequency range, the IQF procedure improves the link of the synthetic seismogram to the seismic record (marked section on Figure 9). Even subtle seismic reflections of small amplitudes created after IQF are reflected in the synthetic seismogram (lower panel Figure 11).

6. Conclusions

The amplitude gain is an important factor during the inverse Q-filtering procedure. A substantial value of gain may lead to generating false reflections. A substantial increase in the dominant frequency of the signal, in relation to the quality of the seismic data, can introduce a distortion of the vertical amplitude relationships, and the reliability of the additional reflections can be difficult to establish. As a result, such seismic images, although high-resolution, will be of little value from an interpretive point of view.
A significant increase in vertical resolution of the seismic section, resulting from Q-filtering application, makes the sequence of reflections on the PreSTM section similar to those occurring on the VSP corridor sum. A noticeable effect of the increase in vertical resolution is usually the separation of some reflections (marked as X in Figure 8, Figure 9 and Figure 11), which is best seen in the central part of the section from Figure 11, along the projection of the borehole profile. At this location, we observed a “channel” (probably a channel of a former river) of Miocene formations, which is revealed by an increase in the number and amplitude of reflections. In addition, as a result of the increase in the dominant frequency of the seismic signal, low-amplitude reflections are revealed in places where they did not occur before—this is basically the case along the entire section, and especially in its lower part. In the higher frequency range, the IQF procedure improves the link of the synthetic seismogram to the seismic record; even subtle seismic reflections of small amplitudes created after IQF are reflected in the synthetic seismogram.
Using IQF as a method to increase data resolution has its limitations. One of the criteria for the correctness of the solution is the analysis of the frequency spectrum. It seems optimal to obtain as flat of a spectrum as possible over the entire useful frequency range (Figure 10 right panel). Unfortunately, due to the nonlinear increase in the magnitude of the amplitudes for higher frequencies in the IQF process, we have to deal with the so-called overboosting of the upper frequency band. As a result, the seismic section becomes uninterpretable. A parameter that allows a certain degree of control over this effect is the so-called gain limit (expressed in dB), described earlier in Section 4.2. The principle of this procedure is shown in Figure 4.
Correct selection of the mentioned gain is very important. This can be clearly seen in Figure 8 panel C where, for the same values of Q-factors, we observed very large differences in the seismic image, depending on the used amplitude limit.

Author Contributions

Conceptualization, T.M. and M.S.; methodology A.P.Ł. and M.M.; validation, A.P.Ł. and M.M.; formal analysis, A.P.Ł. and M.M.; data curation, A.P.Ł., A.C. and A.W.-P.; writing—original draft preparation, A.P.Ł., M.M. and A.W.-P.; writing—review and editing, A.P.Ł., M.M., A.W.-P. and A.C; visualization, A.P.Ł. and A.W.-P.; supervision, T.M. and M.S.; project administration, A.W.-P. All authors have read and agreed to the published version of the manuscript.

Funding

This research was funded by project No. POIR.04.01.01-00-0046/19.

Institutional Review Board Statement

Not applicable.

Informed Consent Statement

Not applicable.

Data Availability Statement

Due to legal and commercial reasons supporting data is not available.

Conflicts of Interest

The authors declare no conflict of interest.

References

  1. Mavko, G.; Kjartansson, E.; Winkler, K. Seismic wave attenuation in rocks. Rev. Geophys. 1979, 17, 1155–1164. [Google Scholar] [CrossRef]
  2. Klimentos, T. Attenuation of P- and S-waves as a method of distinguishing gas from oil and water. SEG Annu. Meet. 1990, 60, 102–105. [Google Scholar] [CrossRef]
  3. Tan, Y.; Chai, C.; Engelder, T. Use of S-wave attenuation from perforation shots to map the growth of the stimulated reservoir volume in the Marcellus gas shale. Lead. Edge 2014, 33, 1090–1096. [Google Scholar] [CrossRef] [Green Version]
  4. Ou, L.; Prasad, M. Ultrasonic anisotropic P-wave attenuation of shales under elevated pressures. In Proceedings of the SEG International Exposition and Annual Meeting 2016, Dallas, TX, USA, 16–21 October 2016; pp. 3261–3266. [Google Scholar]
  5. Zhang, Z.; Du, J.; Mavko, G.M. Reservoir characterization using perforation shots: Anisotropy, attenuation and uncertainty analysis. Geophys. J. Int. 2019, 216, 470–485. [Google Scholar] [CrossRef]
  6. Park, J.; Choi, J.; Seol, S.J.; Byun, J.; Kim, Y. A method for adequate selection of training data sets to reconstruct seismic data using a convolutional U-Net. Geophysics 2021, 86, V375–V388. [Google Scholar] [CrossRef]
  7. Ulrych, T.J. Application of homomorphic deconvolution to seismology. Geophysics 1971, 36, 650–660. [Google Scholar] [CrossRef]
  8. Rosa, A.L.R.; Ulrych, T.J. Processing via spectral modeling. Geophysics 1991, 56, 1244. [Google Scholar] [CrossRef]
  9. Gholami, A.; Sacchi, M.D. A fast and automatic sparse deconvolution in the presence of outliers. IEEE Trans. Geosci. Rem. Sens. 2012, 50, 4105–4116. [Google Scholar] [CrossRef]
  10. Canning, A.; Moulière-Reiser, D.; Weiss, Y.; Malkin, A.; Philip, E.; Grinberg, N.; Teitel, A.; Reznikov, M.; Yehezkel, V. Neural Networks Approach to Spectral Enhancement. SEG Tech. Program Expand. Abstr. 2017, 4283–4286. [Google Scholar]
  11. Choi, Y.; Seol, S.J.; Byun, J.; Kim, Y. Vertical Resolution Enhancement of Seismic Data with Convolutional U-Net. SEG Tech. Program Expand. Abstr. 2019, 2388–2392. [Google Scholar]
  12. Oszczypko, N. Powstanie i rozwój polskiej czêœci zapadliska przedkarpackiego. Przegląd Geol. 2006, 54, 396–403. [Google Scholar]
  13. Oszczypko, N. The Early-Middle Miocene Carpathian peripheral foreland basin (Western Carpathians, Poland). Przegląd Geol. 1997, 45, 1054–1063. [Google Scholar]
  14. Oszczypko, N. The W estern Carpathian foredeep-developm ent of the foreland basin in front of the accretionary wedge and its burial history (Poland). Geol. Carpathica 1998, 49, 1–18. [Google Scholar]
  15. Wdowiarz, S. O stosunku Karpat do zapadliska przedkarpackiego w Polsce. Przegląd Geol. 1976, 24, 350–357. [Google Scholar]
  16. Oszczypko, N.; Tomaś, A. Tectonic evolution of marginal part of the Polish Flysch Carpathians in the Middle Miocene. Kwart. Geol. 1985, 29, 109–128. [Google Scholar]
  17. Oszczypko, N. The structural position and tectonosedimentary evolution of the Polish Outer Carpathians. Przegląd Geol. 2004, 52, 780–791. [Google Scholar]
  18. Oszczypko, N.; Zając, R.; Garlicka, I.; Menèik, E.; Dvorak, J.; Matejovska, O. Geological map of the substratum of the Tertiary of the Western Outer Carpathians and their foreland. In Geological Atlas of the Western Outer Carpathians and Their Foreland; Poprawa, D., Nemcok, J., Eds.; Państwowy Instytut Geologiczny: Warszawa, Poland, 1989. [Google Scholar]
  19. Oszczypko, N.; Krzywiec, P.; Popadyuk, I.; Peryt, T. Carpathian Foredeep Basin (Poland and Ukraine)—Its sedimentary, structural and geodynamic evolution. In The Carpathians and Their Foreland: Geology and Hydrocarbon Resources: AAPG Memoir; Golonka, J., Picha, F.J., Eds.; AAPG: Tulsa, MA, USA, 2005; Volume 84, pp. 293–350. [Google Scholar]
  20. Myśliwiec, M. The Miocene reservoir rocks of the Carpathian Foredeep. Przegląd Geol. 2004, 52, 581–592. [Google Scholar]
  21. Krzywiec, P. Geodynamic and tectonic control on evolution of foreland basins, with references to the Carpathian Foredeep Basin. Przegląd Geol. 2006, 54, 404–412. [Google Scholar]
  22. Ney, R.; Burzewski, W.; Bachleda, T.; Górecki, W.; Jakóbczak, K.; Słupczyński, K. Zarys Paleogeografii i Rozwoju Litologiczno-Facjalnego Utworów Miocenu Zapadliska Przedkarpackiego; Komisja Nauk Geologicznych PAN Oddział w Katowicach: Warsaw, Poland, 1974; 65p. [Google Scholar]
  23. Kotlarczyk, J. An outline of the stratigraphy of Marginal Tectonic Units of the Carpathian Orogene in the Rzeszów-Przemysl area. In Geotraverse Kraków-Baranów-Rzeszów-Przemysl-Komancza-Dukla: Guide to Excursion 4; Kotlarczyk, J., Ed.; Carpatho-Balkan Geological Association, Congress: Cracow, Poland, 1985; Volume XIII, pp. 21–32. [Google Scholar]
  24. Połtowicz, S. Jednostka stebnicka i zgłobicka w budowie Karpat Polskich. Geol. Kwart. AGH 2004, 30, 85–120. [Google Scholar]
  25. Krzywiec, P. Mioceńska ewolucja tektoniczna wschodniej części zapadliska przedkarpackiego (Przemyśl–Lubaczów) w œwietle interpretacji danych sejsmicznych. Prace Państw. Inst. Geol. 1999, 168, 249–276. [Google Scholar]
  26. Krzywiec, P. Contrasting tectonic and sedimentary history of the central and eastern parts of the Polish Carpathian Foredeep Basin—Results of seismic data interpretation. Mar. Pet. Geol. 2001, 18, 13–38. [Google Scholar] [CrossRef]
  27. Krzywiec, P.; Aleksandrowski, P.; Ryzner-Siupik, B.; Papiernik, B.; Siupik, J.; Mastalerz, K.; Wysocka, A.; Kasiñski, J. Budowa geologiczna i geneza mioceñskiego zrêbu Ryszkowej Woli w rejonie Sieniawy–Rudki (wschodnia czêœæ zapadliska przedkarpackiego)—Wyniki interpretacji danych sejsmiki 3D. Przegląd Geol. 2005, 53, 656–663. [Google Scholar]
  28. Bath, M. Spectral Analysis in Geophysics (Developments in Solid Earth Geophysics); Elsevier Science Publishing Co.: Amsterdam, The Netherlands, 1974; Volume 7. [Google Scholar]
  29. Tonn, R. The determination of seismic quality factor Q from VSP data: A comparison of different computational methods. Geophys. Prosp. 1991, 39, 1–27. [Google Scholar] [CrossRef]
  30. Haase, A.B.; Stewart, R.R. Q-factor estimation from borehole seismic data: Ross Lake, Saskatchewan. CREWES Res. Rep. 2003, 15, 1–7. [Google Scholar]
  31. Cheng, P.; Margrave, G.F. Q analysis using synthetic viscoacoustic seismic data. CREWES Res. Rep. 2009, 21, 1–11. [Google Scholar]
  32. Cheng, P.; Margrave, G.F. A match-filter method for Q estimation. In Proceedings of the SEG 2012 annual meeting, Las Vegas, NV, USA, 4–7 November 2012. [Google Scholar]
  33. Wang, Y. Inverse Q-filter for seismic resolution enhancement. Geophysics 2006, 71, V51–V60. [Google Scholar] [CrossRef] [Green Version]
  34. Cui, T. Improving Seismic-to-Well Ties. Master’s Thesis, University of Calgary, Calgary, AB, Canada, 2015. [Google Scholar] [CrossRef]
  35. Margrave, G.F. Why seismic-to-well ties are difficult. In 25th Annual Report of the CREWES Project; CREWES: Calgary, AB, Canada, 2013; Volume 25. [Google Scholar]
  36. Futterman, W.I. Dispersive body waves. J. Geophys. Res. 1962, 67, 5279–5291. [Google Scholar] [CrossRef]
  37. Hale, D. Q-adaptive Deconvolution. In SEG Technical Program Expanded Abstracts; Stanford Exploration Project, Report No. 30; Society of Exploration Geophysicists: Houston, TX, USA, 1982; pp. 133–158. [Google Scholar]
  38. Hargreaves, N.D.; Calvert, A.J.; Hirsche, W.K. A Fast Inverse Q-Filter. In Proceedings of the 1987 SEG Conference, New Orleans, LA, USA, 11–15 October 1987. [Google Scholar]
  39. Schafer, R. What Is a Savitzky-Golay Filter? [Lecture Notes]. IEEE Signal Process. Mag. 2011, 28, 111–117. [Google Scholar] [CrossRef]
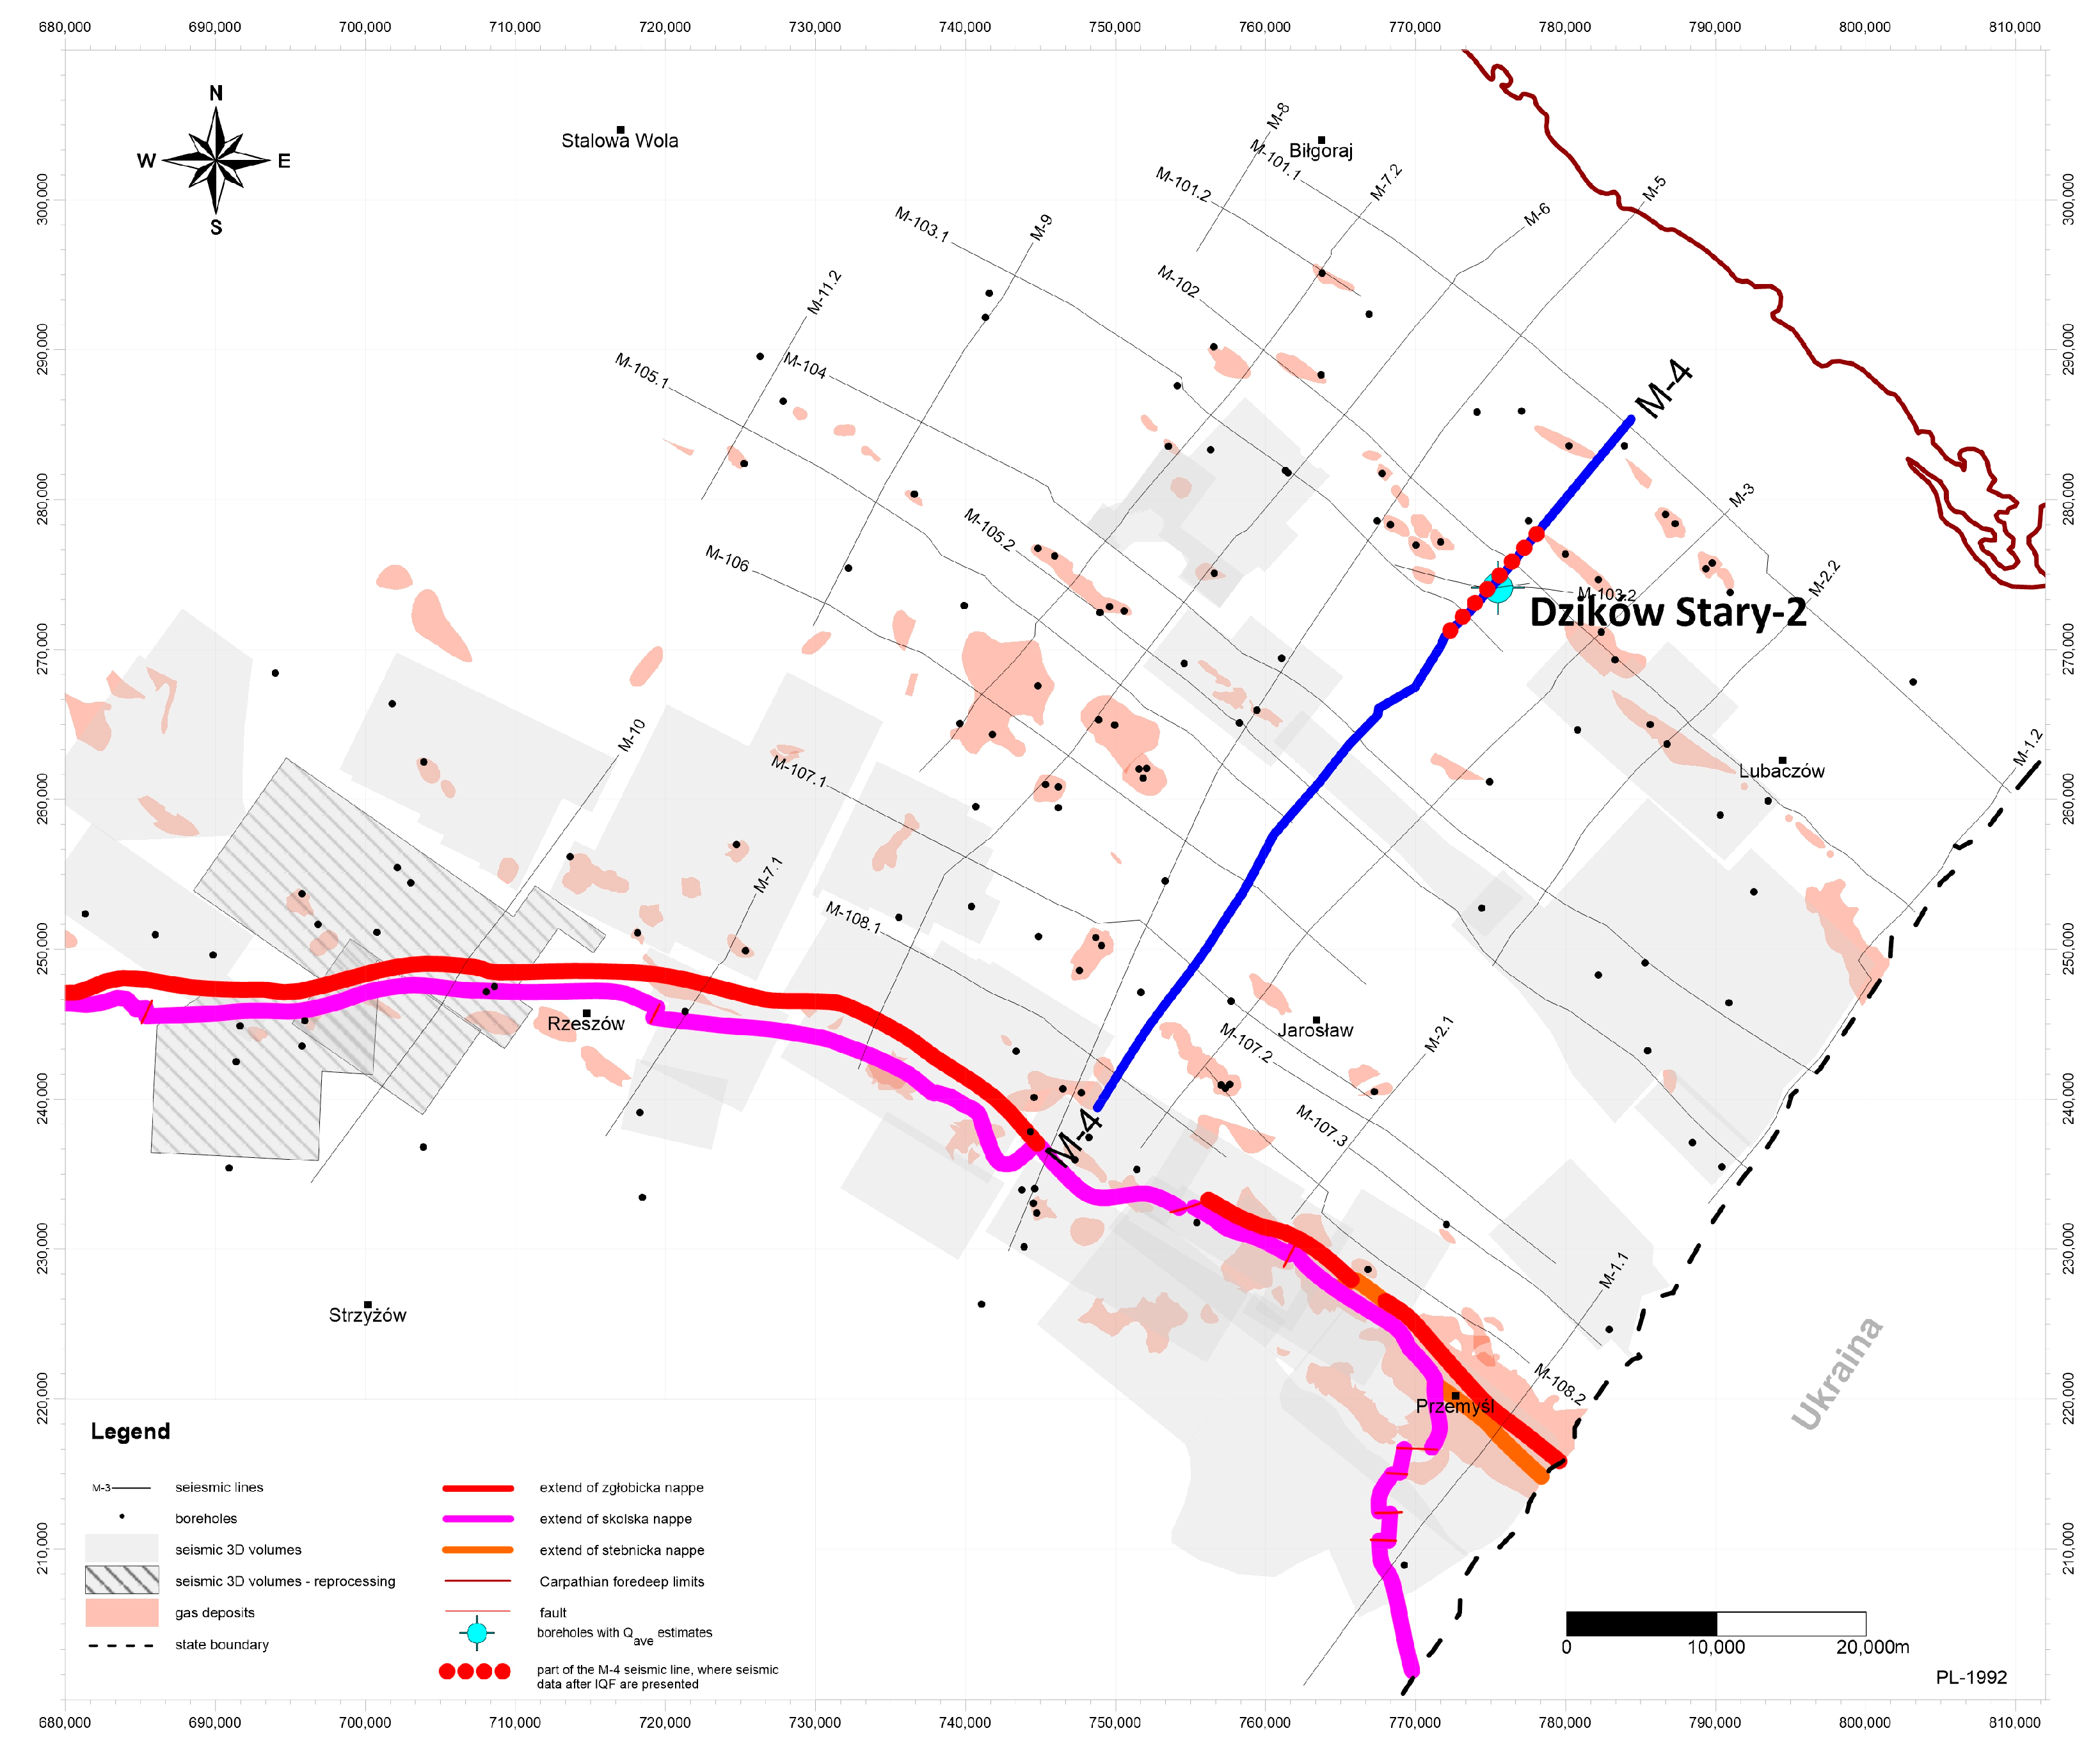
Figure 1. Localization map of the wells with VSP and acoustic data used for Q estimation (from DS-2 well). Red dots on the blue line show the extent of M-4 seismic line used for the inverse Q procedure.
Applsci 13 08564 g001
Figure 2. Zero offset VSP data after preprocessing–vertical component from the DS-2 borehole. Y axis is the one-way time, X axis is the depths in meters. Red line is the picked time of the first arrival of the direct P-wave.
Applsci 13 08564 g002
Figure 3. Example of the frequency content of the direct arrival of the downgoing p-wave. Red is the spectrum of the signal recorded at depth 230 m, black is the spectrum of the signal recorded by the receiver at depth 360 m.
Applsci 13 08564 g003
Figure 4. Gain control for amplitude compensation. Illustration of various scenarios: A: tapering is applied from a (variable) frequency controlled by the gain limit value. B: the gain is capped when it reaches the gain limit value and tapered down between two fixed frequencies. C: the gain is tapered down between two fixed frequencies (the gain limit is never reached).
Applsci 13 08564 g004
Figure 5. Part of processing flow referring to IQF application.
Applsci 13 08564 g005
Figure 6. (Left panel): Q distribution calculated in the frequency range 15–120 [Hz] using mean, median, min and max Q curves after smoothing using Savitzky-Golay filtering. (Right Panel): receivers from depths 45–299 m used as reference receivers for Q calculation.
Applsci 13 08564 g006
Figure 7. Quality factor depth distribution in the DS-2 borehole. Green line is the Q calculated using spectral ratio method on VSP data. Red lines are the Q distributions based on the dispersive method assuming dominant frequency of seismic (VSP or checkshot) data to be 45 Hz, and frequency of logging tool (acoustic logs) to be 20 kHz. Dotted lines (+/−20%) shows the possible discrepancy because of uncertainty of real frequencies.
Applsci 13 08564 g007
Figure 8. The results of the IQF procedure tested in several variants of the amplitude gain. Left panel A shows well log data with lithological interpretation, middle section B is the processed zero offset VSP. On the right panels C there are seismic sections with different amplitude gains. Point X shows example of the vertical resolution increase resulting in the separation in whole or in part of some reflections and a noticeably better fit of the seismic image to the attached VSP result. Red frame in section C indicates which amplitude gain was chosen for the degree of vertical resolution enhancement and best fit to the VSP data. By yellow color lines marked Well Tracks, by blue and orange color lines marked Synthetic Seismograms.
Applsci 13 08564 g008
Figure 9. The results of the IQF procedure tested in different distributions of Q values. Amplitude gain limit was chosen as 40 db. Left panel shows well log data with lithological interpretation, middle section is the processed zero offset VSP. On the right: seismic panels with Q depth distributions. Point X shows example of the vertical resolution increase resulting in the separation in whole or in part of some reflections and a noticeably better fit of the seismic image to the attached VSP result. The red box in section C indicates which Q distribution gives the optimal increase in the vertical resolution in terms of matching to the VSP data. By yellow color lines marked Well Tracks, by blue and orange color lines marked Synthetic Seismograms.
Applsci 13 08564 g009
Figure 10. Seismic section power spectra after PreSTM and after IQF for G = 30 and 40 dB (IQF for Q values presented at (Figure 7) with the Q value of 25 at the near surface). Broadening the frequency spectrum of the signal towards higher frequencies increases the vertical resolution of seismic data, often making it easier for interpreters to separate thin layers not imaged by classical approaches due to signal interference.
Applsci 13 08564 g010
Figure 11. Upper Panel (a): Seismic section after processing without application of the IQF. Left panel shows well log data with lithological interpretation, middle section is the processed zero offset VSP, right panel, seismic section as shown in Figure 9 for wider range of CDPs (600 CDP). Lower Panel (b) Seismic section after processing application of the IQF. Left panel shows well log data with lithological interpretation, middle section is the processed zero offset VSP, right panel, seismic section as shown in Figure 9 for wider range of CDPs (600 CDP). Point X shows example of the vertical resolution increase resulting in the separation in whole or in part of some reflections and a noticeably better fit of the seismic image to the attached VSP result.
Applsci 13 08564 g011aApplsci 13 08564 g011b
Disclaimer/Publisher’s Note: The statements, opinions and data contained in all publications are solely those of the individual author(s) and contributor(s) and not of MDPI and/or the editor(s). MDPI and/or the editor(s) disclaim responsibility for any injury to people or property resulting from any ideas, methods, instructions or products referred to in the content.