Abstract
A scientifically accurate assessment of tunnel health is the prerequisite for the safe maintenance and sustainability of the in-service road tunnel. The changing trend of tunnel health is not considered in existing research. Most evaluation indicators are static and the ambiguities or randomness at the boundary of the health level intervals is neglected in most evaluation methods. In this paper, the evaluation index system combined with dynamic, and static is set to solve these problems. The changing trend of the health state of tunnels is analyzed through the cubic b-spline function. The weights of evaluation indicators are calculated based on the AHP-improved entropy method. The health evaluation method is proposed based on combing the extension theory and the cloud model improved by the cloud entropy optimization algorithm. Finally, the evaluation results of the proposed method are compared with the detection data of the Beilongmen Tunnel of Zhangzhuo Expressway. The results demonstrate that 80% of the evaluation results in the sample tunnel data are consistent with the standard results, and the remaining 20% show a lower level of health than the standard results. This reflects the evaluation results are impacted by the trend of tunnel health status changes. The health state can be more accurately evaluated by dynamic indicators. The improved extension cloud model is feasible and applicable in the health assessment of tunnels. This work provides innovative ideas for the evaluation of the health state of tunnels and theoretical support for the formulation of reasonable maintenance measures.
1. Introduction
Since the 21st century, rapid development is experienced in tunnel construction [1,2]. However, various deficiencies such as lining cracks, pavement cracks, and water leakage have appeared as the service life of road tunnels increases [3,4]. The evaluation of tunnel health is the premise of tunnel maintenance and management. At present, some research results have been obtained. These diseases reduce the lifespan of tunnels [5]. Moreover, these diseases also threaten driving safety [6,7,8]. The evaluation indicators such as structure deformation, lining cracks, and water leakage are considered to set a tunnel evaluation index system [3,9,10,11,12,13,14,15]. The health assessment model for tunnels is set based on methods that combined qualitative with quantitative such as the analytic hierarchy process method (AHP), entropy weight method, fuzzy comprehensive evaluation method, and the Bayesian network [9,10,11,12,15]. But the problem of most evaluation indicators exists being static, without considering the changing trends of tunnel health in the current health assessment of tunnels. The ambiguity and randomness at the boundary of the health level intervals are neglected because of dividing the health level into intervals. The availability and driving safety of tunnels are substantially impacted by the scientifically accurate evaluation of tunnel health.
In terms of constructing the health evaluation index system of tunnels, Liu et al. [14] selected indicators such as leakage, lining cracks, and lining corrosion peeling to construct the health evaluation system for the tunnel lining structure. Chen et al. [15] selected eight indicators from four aspects of structural deformation, lining cracks, spalling, and leakage, and evaluated the overall health status of tunnels using inspection data. Ye et al. [3] selected a series of indicators from aspects such as lining splitting, water leakage, and tunnel bottom damage to evaluate the overall health status of the tunnel based on the data of the Liupanshan Highway Tunnel. However, a number of the evaluation indicators in existing research are static and can only reflect the health level at the time of detection. The health status of road tunnels is also affected by factors such as geographical environment, construction technology, and materials. As the service life of road tunnels increases, various differences will occur in dynamic indicators including the rate and extent of changes in their health condition. Therefore, evaluation methods based on static indicators lead to imprecise evaluation results. The existing methods can be divided into subjective weighting method, objective weighting method, and comprehensive weighting method when determining the weight of the evaluation index [16]. The subjective weighting method is a method of weight division of indicators according to the subjective opinions and experiences of decision-makers. While the objective weighting method is a method to determine the indicator weight by objective means such as mathematical statistics or optimization models. By constructing a health evaluation index system, Chen et al. [15] proposed a road tunnel health status evaluation method based on the fuzzy analytic hierarchy process (F-AHP). Wang et al. [17] used the analytic hierarchy process (AHP) to obtain the weights of each index in the tunnel structure safety evaluation system. A multi-level fuzzy comprehensive evaluation model was set for the long-term safety evaluation of tunnel structures. However, the accuracy of the above subjective weighting methods is affected by subjective factors such as expert experience, ability, education level, and personal preferences. The comprehensive weighting method as a commonly used index weighting method combines subjective and objective methods and generally considers multiple aspects to assign attribute weights. To evaluate the safety of tunnel structures, Jin et al. [18] combined AHP with game theory to construct a fuzzy multi-criteria decision-making analysis method. Liu et al. [19] used the AHP and the entropy weight method to construct a tunnel construction safety evaluation system.
The transformation between qualitative and quantitative values is unavoidable in the process of health status evaluation. The fuzziness and randomness problems exist in the boundary of health levels [20]. Academician Deyi Li proposed a cloud model which reflects the uncertainty in the concept of natural language, namely fuzziness and randomness. The cloud model can realize the conversion of qualitative and quantitative indicators through the cloud generator, which can effectively express fuzzy and random concepts [21]. Niu et al. [21] proposed an evaluation method based on the improved cloud model and the improved evidence theory to accurately evaluate the fire risk of urban public tunnels. Lin et al. [22] combined the variable weight theory with the cloud model theory to accurately evaluate the risk level of water inrush during karst tunnel construction. This approach helps to reduce the impact of subjective factors on evaluation results and rationalize the allocation of index weights. Cheng et al. [23] used the cloud model to evaluate the emergency capability of subway shield construction. Li et al. [24] set a detailed evaluation system based on the cloud model and the AHP to realize the risk assessment of highway tunnel construction. The above method proves the applicability of the cloud model in the study of highway tunnel health evaluation and effectively solves the fuzziness and randomness of the health status evaluation at the boundary. The extension theory is introduced into the health status evaluation due to its unique advantages in qualitatively or quantitatively analyzing and dealing with contradictory problems [25]. Up to now, the cloud model has been combined with the extension theory by some research fields to construct the extension cloud model. Compared with the cloud model, the extension cloud model is very suitable for health status evaluation as can solve the multi-index decision-making problem. Zou et al. [26] set a safety evaluation model for collisions of marine ships based on the extension cloud theory. The fuzziness and uncertainty of evaluation indicators are taken into account and the results of multiple evaluation indicators are integrated effectively in this model. The problem is that the uncertainty or fuzziness of evaluation level boundaries is considered inadequate in traditional mooring safety assessment methods. To solve this problem, Lu et al. [27] constructed a ship mooring safety assessment model based on the normal cloud extension theory. Li et al. [28] evaluated the collapse risk of a water diversion tunnel during construction based on the extension cloud model. However, the use of the extension cloud model is not well-researched in the study of health assessment for road tunnels. The feasibility of applying the extension cloud model in the health assessment of road tunnels and the evaluation process based on the extension cloud model still needs further research.
Based on the above, the health assessment system for tunnels is set according to dynamic and static evaluation indicators. The weight of the evaluation indicators is determined through subjective and objective combination weighting. In addition, the road tunnel health status evaluation method is set based on the improved extension cloud model. Finally, the feasibility of the method is verified by the detection data of the Zhangzhuo Expressway Tunnel. Specifically, this paper mainly contributes to the following aspects:
- The relationship between the trend of changes in road tunnel health status and its health status is considered based on selecting static evaluation indicators. The health status evaluation system for road tunnels that combines dynamic and static evaluation is set after further selecting dynamic indicators.
- The extension cloud model is set by combining the cloud model with the extension theory and improved by the cloud entropy optimization algorithm. The fuzzy or random problem of evaluation grade boundaries is solved effectively. Conflicting judgment conclusions are avoided in tunnel structural health status evaluation.
- The applicability of the enhanced extension cloud model in the health assessment of road tunnels is demonstrated by high confidence when compared with the standardized evaluation results.
After the introduction, this paper is divided into four sections. The next section mainly explains how to set a health status evaluation system for road tunnels and determine the weight of evaluation indicators through subjective or objective combination weighting. Section 3 mainly introduces how to improve the extension cloud model and evaluate the health status of road tunnels. The feasibility of the proposed method and the results are demonstrated through a case study in Section 4. The conclusions are summarized in the final section.
2. Construction of Indicator System
The construction of the tunnel health status evaluation indicator system is shown in Figure 1, which includes four main steps: (1) indicator selection; (2) indicator value calculation; (3) evaluation level division; (4) determination of indicator weights. This section briefly introduces each step.
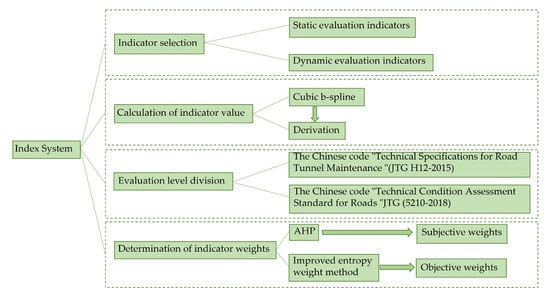
Figure 1.
Framework for the construction of the tunnel health status evaluation indicator system.
2.1. Indicator Selection
A static evaluation system for health status assessment of road tunnels is generally constructed by selecting basic evaluation indicators from tunnel detection projects, as road tunnels are influenced by multiple factors [15,29,30]. In fact, the basic evaluation indicators change over time, and the reflection of the health status of the road tunnel at the time of detection by the static evaluation system is not conducive to the formulation of later maintenance measures. The road tunnel health status evaluation system is set based on engineering reality and selection principles.
The evaluation system includes basic static evaluation indicators such as crack length, crack width, water leakage degree, damage degree of maintenance road, abnormality degree of a drainage system, pavement condition index (PCI), riding quality index (RQI), and skid resistance index (SRI). Additionally, it includes dynamic evaluation indicators that reflect the trend of tunnel health changes, such as the crack number change rate, water leakage volume change rate, pavement condition index (PCI) change rate, riding quality index (RQI) change rate, and skid resistance index (SRI) change rate, as shown in Figure 2.
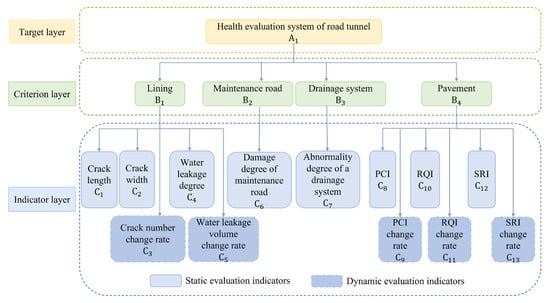
Figure 2.
Tunnel health status evaluation indicator system.
2.2. Calculation of Indicator Values
Basic indicators for evaluating the health status of road tunnels cannot be directly determined, such as changes in tunnel crack length, width, and depth trends. A significant waste of maintenance resources would occur due to the requirement of a substantial amount of manpower, material resources, and financial resources for long-term monitoring of each tunnel structure [31]. From another perspective, the health status of the tunnel can be reflected by the number of new cracks. Unstable stress and deformation of the tunnel surrounding rock and lining structure will cause the cracks to expand in depth or length and lead to the emergence of new cracks [32]. Therefore, pavement technical condition indicators including pavement condition index (PCI), riding quality index (RQI), and skid resistance index (SRI), are also evaluated to determine the static indicator values based on the historical inspection data of road tunnels.
The dynamic indicator values are obtained by fitting the scattered detection points into a smooth function curve and derivation. From a derivative perspective, the differences in health change patterns between different tunnels are taken into consideration. Common curve fitting methods include the Lagrange interpolation method, least squares fitting, Bezier curve fitting method, etc. The above methods are unsuitable for fitting the characteristics of tunnel health conditions as the process of fitting the health trend of a tunnel is complex and takes into account multiple factors. For example, the overall trend can be reflected by the least squares fitting method, but the changing trends of a specific control point (detection time) cannot be revealed. As the lifespan of tunnels increases, there will be more control points. As the number of control points increases, it becomes challenging to control the Lagrange interpolation method and Bezier curve fitting method, leading to a considerable deviation. However, the advantages of the Bezier curve fitting method are inherited by the Cubic b-spline while solving its limitations. Moving a control point does not alter the overall shape of the curve. Instead, it only affects the shape of the two near curves. Therefore, Cubic b-spline fitting is suitable for the characteristics of tunnel health condition fitting. Not only can the overall trend of the data be reflected by Cubic b-spline fitting, but the local curve can also be controlled relatively flexibly. Based on this, this paper uses the Cubic b-spline smoothing method to fit the function (Equation (1)).
where is the position vector of each vertex, and is the Bernstein basis function, also known as the Cubic b-spline basis function which the order is k and the degree is k − 1.
2.3. Evaluation Level Classification
Codes “Technical Specification for Highway Tunnel Maintenance” (JTG H12-2015) and “Technical Condition Assessment Standard for Roads” (JTG 5210-2018) are the highest technical standards in China’s highway industry and the most important industry reference.
According to the Chine code “Technical Specifications for Road Tunnel Maintenance” (JTG H12-2015), this paper divides the health state of road tunnels into 5 levels. The specific judgment criteria are shown in Table 1.

Table 1.
Hierarchy of tunnel lining structure health.
The static indicators are classified as shown in Table 2, according to the current Chine code “Technical Specifications for Road Tunnel Maintenance” (JTG H12-2015) and “Technical Condition Assessment Standard for Roads “JTG (5210-2018). The dynamic indicators are normalized based on the experience of domestic and foreign experts and common grading standards. According to the normalized value range and value principle (safety increases as the value decreases), the safety level of dynamic indicators is divided into 5 levels, as shown in Table 3.
Table 2.
Classification of static indicators.
Table 3.
Classification of dynamic indicators.
2.4. Calculation of Indicator Weights
The weight determination is a crucial stage in the evaluation procedure. The scientific dependability of the evaluation conducted for the health status of a tunnel is directly impacted by the rationality of the weight used. Problems of subjective arbitrariness arise in subjective weighting methods based on expert scores, while problems of objective distortion arise in objective weighting methods based on objective data [33]. The weight determined only by the subjective weighting method is the subjective weight, and the weight determined only by the objective weighting method is the objective weight. Subjective and objective weights are combined by the combination weighting method which is a scientific and reasonable method that can make the evaluation results more reasonable. Therefore, the combination of subjective and objective weighting is adopted to make up for the shortcomings of a single weighting method and improve the accuracy of the evaluation results.
The analytic hierarchy process (AHP) [34] is used for the calculation of subjective weight, while the entropy weight method is adopted for the calculation of objective weight. The AHP is scored by experts on health evaluation indicators at all levels in the evaluation system. The health evaluation judgment matrix is obtained according to the score results. The weight values of evaluation indexes at all levels are finally obtained after the consistency test and normalization. The entropy weight method determines the weight based on the change degree of the indicator. The greater the degree of change, the higher the weight, and vice versa. Within the conventional entropy method calculation process, there may exist a marked deviation despite a relatively minor variation between entropy values, when the entropy value of an indicator approaches 1. To solve this problem, the traditional entropy method has been improved based on previous research results [35,36], as shown in Equations (2) and (3):
where is the entropy of the indicator, and is the weight of the indicator.
where is the comprehensive weight vector, is the subjective weight. is the objective weight. is the subjective–objective weight ratio factor, which indicates the degree to which expert judgment weighs toward subjective or objective factors. Generally, subjective and objective factors are equally important, so is set to 0.5.
3. Model Establishment
In this section, the process framework is introduced for improving the extension cloud model, including two main steps: (1) improvement of the extension cloud model, and (2) determination of the comprehensive cloud correlation. Each step is briefly introduced in this section.
3.1. Construction of Improved Extension Cloud Model
Currently, the fuzziness and randomness at the boundary of grades are not fully considered by the traditional tunnel evaluation method, which makes use of interval division for classifying the tunnel health level. Therefore, the extension cloud model is introduced to solve the above problem. The cloud model mainly reflects the fuzziness and randomness in natural language concepts. The mapping between qualitative and quantitative aspects is formed by utilizing cloud generators, thereby enabling the mutual transformation between qualitative expression and quantitative calculation. The cloud generators are divided into two categories: forward cloud generator (FCG) and backward cloud generator (BCG). The forward cloud generator generates cloud droplets by inputting three digital features of the cloud to realize the transformation from qualitative to quantitative. On the contrary, the backward cloud generator regards the data as cloud droplets, and outputs three digital features of the cloud to realize the transformation from quantitative to qualitative. It can effectively express the fuzzy uncertainty and random uncertainty of knowledge concepts [25]. The principle of the cloud generator is shown in Figure 3.
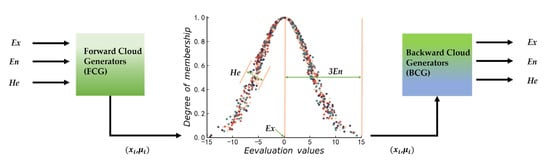
Figure 3.
Cloud generator principle.
Replacing the value in the physical element with the from the normal cloud model to obtain the extension cloud model, as shown in Equation (4).
where represents the road tunnel sample to be evaluated. represents the health indicators of the tunnel structure to be evaluated. represents the cloud description of the corresponding level of the indicator. is the expected value, which is the value that embodies qualitative concepts, reflecting the health level of the indicator. is the entropy which measures the fuzziness and randomness in qualitative concepts, reflecting the range of health levels, is the hyper-entropy, reflecting the uncertainty of correlation.
According to Equation (4), the key to solving the extension cloud model lies in calculating the digital characteristic value of the cloud, denoted by . By definition of expectation, the concept of this level is reasonably represented by the center value of the constrained interval. Therefore, the calculation formula is , where and are the level boundaries, the hyper-entropy calculation formula is generally , which can also be adjusted based on experience and actual situations [16,33]. The cloud entropy , which reflects the fuzziness of the indicator state level, is the most critical cloud characteristic parameter. The value of the cloud entropy affects the size of the health level range. Moreover, it also affects the accuracy of the results. Currently, there are mainly two cloud entropy calculation methods [37] (Equations (5) and (6)):
Cloud entropy calculation method based on the “3En” rule:
Cloud entropy calculation method based on the “50% correlation” rule:
The cloud entropy of the standard-level cloud model is calculated from different perspectives by the above two methods. The “3En” rule embodies the clarity of level division, while the “50% correlation” rule focuses more on the fuzziness of level division. The level correlation may conflict with the conclusion of the health status evaluation depending on the different cloud entropy calculation results. To reduce the ambiguity of decision-making and improve the accuracy of decision-making in the classification of tunnel structure health grade, the cloud entropy optimization algorithm is used to improve [37]:
The measured data of a certain indicator to be evaluated is supposed to , and its state level is . Then, it corresponds to the group-level cloud model. represents the cloud expected set. represents the hyper-entropy set. and represent the cloud entropy sets obtained by the two methods, and represents the optimized cloud entropy set after the cloud entropy algorithm optimization. is the level number, and the maximum deviation of the correlation degree for the level l is shown in Equation (7):
where represents the maximum correlation degree of level l obtained based on the “50% correlation” rule. represents the minimum correlation degree of level l obtained based on the ““ rule. represents the correlation degree of level l obtained by the cloud entropy optimization algorithm.
The basic idea of the cloud entropy optimization algorithm is to minimize the sum of the maximum deviation of the correlation degree, so solving the nonlinear decision model is as shown in Equation (8):
By solving the above model, the optimized cloud entropy set can be obtained for each level of a certain indicator, and then the cloud boundary model can be obtained for each health level of the indicators.
3.2. Determining the Integrated Cloud Correlation Degree
The cloud correlation degree is obtained by the forward cloud generator. The measured data of the indicator is regarded as a cloud droplet. The software MATLAB is applied to generate a normal random number , whose mean and standard deviation are and , respectively. Then, the cloud correlation degree between each measured value of the indicator and the extension cloud model can be calculated by Equation (9).
The cloud correlation degree between the measured value of the sample indicator and its health level can be calculated by Equation (7). The comprehensive evaluation matrix (Equation (10)) is formed. Then, the comprehensive evaluation vector (Equation (11)) and the level characteristic value u (Equation (12)) are calculated.
where is the comprehensive weight vector, is the part of the comprehensive evaluation vector corresponding to each health level, is the score of each component corresponding to each health level in , with scores of 1, 2, 3, 4, and 5 corresponding to health levels I to V, respectively.
The randomness in solving k is too large due to the generation of normal random numbers. The impact caused by the randomness can be reduced by solving k multiple times and taking the average value. After multiple operations, the expected value and entropy of can be obtained by Equations (13) and (14):
where l represents the number of operations, which is set to 500, represents the level characteristic value obtained from the calculation.
This paper defines as the confidence factor (Equation (15)) considering the credibility. reflects the degree of dispersion of the evaluation results. The larger the value of , the lower the credibility, conversely, the higher the credibility.
4. Case Application
The Beilongmen Tunnel is overviewed in this section. The process of tunnel health evaluation is described, and evaluation results are discussed to verify the applicability and feasibility of the health assessment method based on the improved extension cloud model.
4.1. Overview of the Beilongmen Tunnel
The Baoding section of Zhangzhuo Expressway has a total length of 72.637 km. Among them, three short tunnels, four medium tunnels, five long tunnels, and four extra-long tunnels are all double-tube six-lane tunnels designed with a speed of 80 km per hour. The cross-section is 5 m high and 14 m wide, and each lane is 3.75 m wide. At present, the Baoding section of Zhangzhuo Expressway is the longest and widest road tunnel group in Hebei Province, as shown in Figure 4a. The Beilongmen Tunnel is located in Baoding City, Hebei Province, with a total length of 4030 m, making it an extra-long tunnel. The net width of the road surface is 11.25 m, the limited width is 12.75 m, and the limited height is 5 m, as shown in Figure 4b.
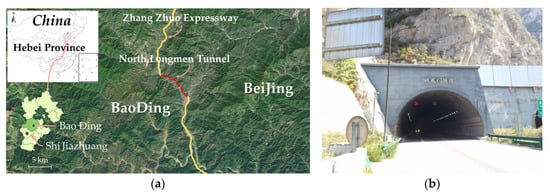
Figure 4.
Beilongmen Tunnel of Zhangzhuo Expressway Baoding section. (a) Description of the location of the Beilongmen Tunnel; (b) Description of the main entrance of the Beilongmen Tunnel.
4.2. Process of Tunnel Health Evaluation
Regular health inspections of the tunnel are carried out every year on the Zhangzhuo Expressway. Then, the health status of the highway tunnel is evaluated according to the current Chine code “Technical Specification for Highway Tunnel Maintenance” (JTG H12-2015). The detection data of these years provide data support for verifying the method of this paper. In the paper, the conventional detection data in two directions of the North Longmen Tunnel are selected for evaluation. The index value is the worst-measured value (Table 4).
Table 4.
Indicator values of Beilongmen Tunnel.
No defects were found in the selected evaluation sample tunnels, including the tunnel portals and holes. Quantitative indicators are measured using actual values, whereas non-quantitative indicators are evaluated based on actual conditions and assigned values accordingly. For example, the degree of leakage C4 can be divided into five categories: no disease, seepage, dripping, flowing, and jetting, with corresponding values of 0.1, 0.3, 0.5, 0.7, and 0.9.
The boundary values of each indicator level for the cloud model of the optimized tunnel health grade were determined according to Section 2.3 of the method for health status classification and Section 3.1 for calculation methods, as shown in Table 5.
Table 5.
Tunnel health level boundary cloud model.
Combined with the weight values specified in the current Chine code “Technical Specifications for Road Tunnel Maintenance” (JTG H12-2015) the final weights were obtained as shown in Table 6.
Table 6.
Final weights of tunnel health evaluation indicators.
This paper does not include statistics for tunnel portals, holes, hung ceilings, pre-embedded pieces, interior decorations, traffic signs, and markings as no defects were detected in the collected data.
According to the calculation method described in Section 3.2 of the method, the final evaluation results are shown in Table 7.
Table 7.
Results of Beilongmen tunnel health evaluation.
4.3. Discussion of Evaluation Results
The health status of the Beilongmen Tunnel has been good since the opening of the upstream channel for five years as shown in Table 7. The evaluation results for both upstream and downstream channels were Class I in 2014, which is in complete accordance with the standard. After 2015, the tunnel health grade has increased year by year, indicating a deterioration of the health condition, possibly due to factors such as geological environment, material degradation, traffic loads, and temperature changes. This result conforms to the degradation law of tunnels over time [38]. A health warning was issued for the downstream channel in 2017, which was three years after its opening. Relevant technical measures should be taken promptly to conduct targeted inspections to improve the safety of tunnel lining and prevent the deterioration of tunnel defects.
Comparative analysis of the evaluation results with the standard results shows that the evaluation results are basically consistent, thereby verifying the applicability and feasibility of this method. In addition, the downstream channel of the Beilongmen Tunnel was rated as Class 2 by the standard in 2017–2018, while the evaluation level determined by this method was a Level III health alert state. The reason is that the dynamic indicators such as the crack quantity change rate, leakage water quantity change rate, and pavement condition index (PCI) change rate of the tunnel showed a significant increase in 2017–2018 compared to 2016. It indicates an accelerated development of various diseases, and rapid deterioration of health. Therefore, a higher evaluation level using the gray system model. However, the difference between the evaluation results and the standard results cannot be explained in some studies that focus only on static indicators [16]. This reflects the influence of differences in the health change trend of the road tunnel on health assessment and demonstrates the advantage of dynamic indicators.
In addition, the uncertainty is overcome effectively by the extension cloud model in the evaluation process. More information can be provided under the same health level status by the level of characteristic values and confidence factors. For example, the level characteristic values for upstream and downstream tunnels in 2016 were 2.33 and 2.98, respectively, indicating that the downstream tunnel was in a more dangerous state. The randomness of sample data and the fuzziness of assessment are reflected by entropy in tunnel health assessment. The confidence factors in the results are all less than 0.05, indicating that the evaluation results are relatively reliable. It can be seen that not only is the difference in health level between the same health level reflected by the extension cloud evaluation method but also randomness or fuzziness is effectively dealt with in the evaluation process.
5. Conclusions
To accurately evaluate the health status of road tunnels, a road tunnel health status evaluation method is proposed based on an improved extension cloud model. The main conclusions are as follows:
- (1)
- The factors affecting the health status of road tunnels are complex, and the health status evaluation is a multi-index complex system. In this paper, eight static indicators and five dynamic indicators were selected from four aspects: tunnel lining, maintenance road, drainage system, and pavement. The dynamic indicator values were obtained by fitting the 5-year road tunnel disease data using the Cubic b-spline smoothing function. The dynamic and static evaluation system was set for road tunnel health status. The weights of evaluation indicators were determined based on the subjective and objective combination weighting method incorporating the AHP and improved entropy methods. The results showed that dynamic indicators can reflect the impact of changes in the health status of road tunnels on the evaluation results.
- (2)
- The randomness and fuzziness problems are solved at the boundary of levels in tunnel health status evaluation by improving the extension cloud model with the cloud entropy optimization algorithm. The extension cloud model is applied to the evaluation of the health status of road tunnels. The evaluation process of the road tunnel health status is set based on the improved extension cloud model.
- (3)
- The evaluation results were compared with the evaluation results of the current Chine code “Technical Specification for Maintenance of Road Tunnels” (JTG H12-2015). 80% of the evaluation results were consistent with the normative results, which verified the feasibility of the extension cloud model in the evaluation of the health status of road tunnels. 20% of the evaluation results had a higher level than the normative results, which reflects the evaluation results are impacted by the trend of tunnel health status changes. It indicates the necessity of considering dynamic indicators to set evaluation indicators. The credibility of the evaluation results was set by using the confidence factors test, and the confidence factors in the results were all less than 0.05.
Theoretical and applied research is carried out by combining a case study, and the final evaluation results are consistent with the normative results. However, this method also has some shortcomings and limitations: disease indicators are still not detailed enough and the interaction between tunnel diseases is not considered. To evaluate the health status of highway tunnels more scientifically and accurately, the interaction between tunnel diseases can be considered based on incorporating dynamic indicators in future studies.
In summary, the feasibility of the extension cloud model is verified in the evaluation of the health status of road tunnels. The framework for the evaluation of the road tunnel health status is set based on the improved extension cloud model. The proposed evaluation method based on the improved extension cloud model provides innovative ideas for the evaluation of the health status of road tunnels. This work can provide theoretical support for the scientific formulation of maintenance measures for road tunnels.
Author Contributions
Conceptualization, H.C., G.C., M.Z., Y.S. and J.L.; data curation, G.C. and M.Z.; resources, H.C. and G.C.; investigation, H.C., G.C., Y.S. and J.L.; methodology, H.C. and G.C., M.Z. and Y.S.; software, J.L.; visualization, Y.S.; validation, G.C. and M.Z.; writing—original draft, J.L. and Y.S.; writing—review and editing, M.Z. and Y.S.; supervision, H.C., G.C. and M.Z.; formal analysis, H.C., G.C. and M.Z.; funding acquisition, H.C. and M.Z.; project administration, H.C., G.C. and M.Z.; All authors have read and agreed to the published version of the manuscript.
Funding
This research was funded by the National Natural Science Foundation of China, grant number 52172304, the Key Funding Project of Hebei Provincial Department of Science and Technology, grant number 22370801D.
Institutional Review Board Statement
Not applicable.
Informed Consent Statement
Not applicable.
Data Availability Statement
The datasets generated for this study are available from the corresponding author upon reasonable request.
Conflicts of Interest
The authors declare no conflict of interest.
References
- Lyu, H.M.; Shen, S.L.; Yang, J.; Yin, Z.Y. Inundation analysis of metro systems with the storm water management model incorporated into a geographical information system: A case study in Shanghai. Hydrol. Earth Syst. Sci. 2019, 23, 4293–4307. [Google Scholar] [CrossRef]
- Sun, Y.; Hu, M.; Lin, S. Green and sustainable tunnel maintenance activities scheduling under uncertainty. J. Clean. Prod. 2021, 297, 126689. [Google Scholar] [CrossRef]
- Ye, F.; Han, X.; Qin, N.; Ouyang, A.; Liang, X.; Xu, C. Damage management and safety evaluation for operating road tunnel: A case study of Liupanshan tunnel. Struct. Infrastruct. Eng. 2020, 16, 1512–1523. [Google Scholar] [CrossRef]
- Zhai, J.; Wang, Q.; Wang, H.; Xie, X.; Zhou, M.; Yuan, D.; Zhang, W. Highway Tunnel Defect Detection Based on Mobile GPR Scanning. Appl. Sci. 2022, 12, 3148. [Google Scholar] [CrossRef]
- Bryne, L.E.; Ansell, A.; Holmgren, J. Investigation of restrained shrinkage cracking in partially fixed shotcrete linings. Tunn. Undergr. Space Technol. 2014, 42, 136–143. [Google Scholar] [CrossRef]
- Cui, H.; Liu, L.; Yang, Y.; Zhu, M. A Two-Stage Scheduling Model for the Tunnel Collapse under Construction: Rescue and Recon-struction. Energies 2022, 15, 743. [Google Scholar] [CrossRef]
- Leng, Z.; Tan, Z.; Yu, H.; Guo, J. Improvement of storage stability of SBS-modified asphalt with nanoclay using a new mixing method. Road Mater. Pavement Des. 2018, 20, 1601–1614. [Google Scholar] [CrossRef]
- Shen, Y.; Zheng, C.; Wu, F. Study on Traffic Accident Forecast of Urban Excess Tunnel Considering Missing Data Filling. Appl. Sci. 2023, 13, 6773. [Google Scholar] [CrossRef]
- Ye, F.; Qin, N.; Liang, X.; Ouyang, A.; Qin, Z.; Su, E. Analyses of the defects in road tunnel in China. Tunn. Undergr. Space Technol. 2021, 107, 103658. [Google Scholar] [CrossRef]
- Chen, B.; Tian, Z.; Chen, Z.-S.; Zhang, Z.-C.; Sun, W. Structural Safety Evaluation of In-Service Tunnels Using an Adaptive Neuro-Fuzzy Inference System. J. Aerosp. Eng. 2018, 31, 04018073. [Google Scholar] [CrossRef]
- Guo, Y.H.; Gong, S.; Kang, S.Y.; Tao, X.J.; Lin, L.H.; Wu, D.H. Disease evaluation of existing tunnel lining based on AHP-Extenics model. Tunnel Constr. 2020, 40, 115–122. [Google Scholar]
- Lin, C.J.; Zhang, M.; Li, L.P.; Zhou, Z.Q.; Liu, S.; Liu, C.; Li, T. Risk assessment of tunnel construction based on improved cloud model. J. Perform. Constr. Facil. 2020, 34, 04020028. [Google Scholar] [CrossRef]
- Zhu, M.; Zhu, H.; Guo, F.; Chen, X.; Ju, J.W. Tunnel condition assessment via cloud model-based random forests and self-training approach. Comput.-Aided Civ. Infrastruct. Eng 2021, 36, 164–179. [Google Scholar] [CrossRef]
- Liu, Y.; Tang, C.-A.; Wang, P.-Y.; Guan, Y.-P.; Wang, S.-H. Study on Disease Mechanism and Theoretical Quantification Method of Tunnel Structure. Adv. Civ. Eng. 2019, 2019, 4398524. [Google Scholar] [CrossRef]
- Chen, L.L.; Li, J.; Wang, Z.F.; Wang, Y.Q.; Li, J.C.; Li, L. Sustainable health state assessment and more productive maintenance of tunnel: A case study. J. Clean. Prod. 2023, 396, 136450. [Google Scholar] [CrossRef]
- Guo, Q.; Amin, S.; Hao, Q.; Haas, O. Resilience assessment of safety system at subway construction sites applying analytic network process and extension cloud models. Reliab. Eng. Syst. Saf. 2020, 201, 106956. [Google Scholar] [CrossRef]
- Wang, B.; Mo, C.; He, C.; Yan, Q. Fuzzy Synthetic Evaluation of the Long-Term Health of Tunnel Structures. Appl. Sci. 2017, 7, 203. [Google Scholar] [CrossRef]
- Jin, H.; Jin, X. Performance assessment framework and deterioration repairs design for highway tunnel using a combined weight-fuzzy theory: A case study. Iran. J. Sci. Technol. Trans. Civ. Eng. 2022, 46, 3259–3281. [Google Scholar] [CrossRef]
- Liu, P.; Wang, Y.; Han, T.; Xu, J.; Li, Q. Safety Evaluation of Subway Tunnel Construction under Extreme Rainfall Weather Conditions Based on Combination Weighting–Set Pair Analysis Model. Sustainability 2022, 14, 9886. [Google Scholar] [CrossRef]
- Li, D. Membership clouds and membership cloud generators. Comput. Res. Dev. 1995, 32, 15–20. [Google Scholar]
- Niu, Q.; Yuan, Q.; Wang, Y.; Hu, Y. Fire Risk Assessment of Urban Utility Tunnels Based on Improved Cloud Model and Evidence Theory. Appl. Sci. 2023, 13, 2204. [Google Scholar] [CrossRef]
- Lin, C.; Zhang, M.; Zhou, Z.; Li, L.; Shi, S.; Chen, Y.; Dai, W. A new quantitative method for risk assessment of water inrush in karst tunnels based on variable weight function and improved cloud model. Tunn. Undergr. Space Technol. 2020, 95, 103136. [Google Scholar] [CrossRef]
- Cheng, J.; Yang, X.; Wang, H.; Li, H.; Lin, X.; Guo, Y. Evaluation of the Emergency Capability of Subway Shield Construction Based on Cloud Model. Sustainability 2022, 14, 13309. [Google Scholar] [CrossRef]
- Li, Z.; Meng, X.; Liu, D.; Tang, Y.; Chen, T. Disaster Risk Evaluation of Superlong Highways Tunnel Based on the Cloud and AHP Model. Adv. Civ. Eng. 2022, 2022, 8785030. [Google Scholar] [CrossRef]
- Li, Q.; Zhou, H.D.; Zhang, H. Durability evaluation of road tunnel lining structure based on matter element extension-simple correlation function method-cloud model: A case study. Math. Biosci. Eng. 2021, 18, 4027–4054. [Google Scholar] [CrossRef]
- Zou, Y.; Zhang, Y.; Ma, Z. Emergency Situation Safety Evaluation of Marine Ship Collision Accident Based on Extension Cloud Model. J. Mar. Sci. Eng. 2021, 9, 1370. [Google Scholar] [CrossRef]
- Lu, F.; Li, W.; Ning, J.; Yu, R. Evaluation of anchoring safety based on normal cloud extension theory. J. Shanghai Marit. Univ. 2020, 41, 30–35. [Google Scholar]
- Li, Y.; Jin, C.L.; Gong, L.; Tian, J.; Zhu, G.Y. Risk Assessment of Water Diversion Tunnel Collapse Based on Entropy Theory and Extension Cloud Model. J. Yangtze River Sci. Res. Inst. 2022, 39, 70. [Google Scholar]
- Li, P.; Zhang, Y.-W.; Jiang, F.-Y.; Zheng, H. Comprehensive health assessment of shield tunnel structure based on prototype experiment. J. Central South Univ. 2018, 25, 681–689. [Google Scholar] [CrossRef]
- Xu, X.; Tong, L.; Liu, S.; Li, H. Evaluation model for immersed tunnel health state: A case study of Honggu Tunnel, Jiangxi Province, China. Tunn. Undergr. Space Technol. 2019, 90, 239–248. [Google Scholar] [CrossRef]
- Yang, H.; Xu, X. Structure monitoring and deformation analysis of tunnel structure. Compos. Struct. 2021, 276, 114565. [Google Scholar] [CrossRef]
- Jiang, Y.; Zhang, X.; Taniguchi, T. Quantitative condition inspection and assessment of tunnel lining. Autom. Constr. 2019, 102, 258–269. [Google Scholar] [CrossRef]
- Tan, F.; Wang, J.; Jiao, Y.-Y.; Ma, B.; He, L. Suitability evaluation of underground space based on finite interval cloud model and genetic algorithm combination weighting. Tunn. Undergr. Space Technol. 2021, 108, 103743. [Google Scholar] [CrossRef]
- Hyun, K.C.; Min, S.; Choi, H.; Park, J.; Lee, I.M. Risk analysis using fault-tree analysis (FTA) and analytic hierarchy process (AHP) applicable to shield TBM tunnels. Tunn. Undergr. Space Technol. 2015, 49, 121–129. [Google Scholar] [CrossRef]
- Deng, X.; Xu, Y.; Han, L.; Yu, Z.; Yang, M.; Pan, G. Assessment of river health based on an improved entropy-based fuzzy matter-element model in the Taihu Plain, China. Ecol. Indic. 2015, 57, 85–95. [Google Scholar] [CrossRef]
- Wan, Q.; Yu, Y. Power load pattern recognition algorithm based on characteristic index dimension reduction and improved entropy weight method. Energy Rep. 2020, 6, 797–806. [Google Scholar] [CrossRef]
- Dong, J.; Wang, D.; Liu, D.; Ainiwaer, P.; Nie, L. Operation Health Assessment of Power Market Based on Improved Matter-Element Extension Cloud Model. Sustainability 2019, 11, 5470. [Google Scholar] [CrossRef]
- Yu, G.; Zhang, S.; Hu, M.; Wang, Y.K. Prediction of road tunnel pavement performance based on digital twin and multiple time series stacking. Adv. Civ. Eng. 2020, 2020, 8824135. [Google Scholar]
Disclaimer/Publisher’s Note: The statements, opinions and data contained in all publications are solely those of the individual author(s) and contributor(s) and not of MDPI and/or the editor(s). MDPI and/or the editor(s) disclaim responsibility for any injury to people or property resulting from any ideas, methods, instructions or products referred to in the content. |
© 2023 by the authors. Licensee MDPI, Basel, Switzerland. This article is an open access article distributed under the terms and conditions of the Creative Commons Attribution (CC BY) license (https://creativecommons.org/licenses/by/4.0/).