A New Hybrid Algorithm Based on Improved MODE and PF Neighborhood Search for Scheduling Task Graphs in Heterogeneous Distributed Systems
Abstract
1. Introduction
2. Multi-Objective Task Graph Scheduling Problem
3. Related Studies
4. The Proposed Hybrid Method
| Algorithm 1: Schedule Initialization Algorithm |
| Schedule-Initialization (schedule [1…2][1…n], V, P) // V is the set of tasks, //P is the set of processors |
| For all Tasks ti ∈ V in task graph |
| ParentsCount [ti] = number of ti parents in task graph |
| ReadyTasks = {ti ϵ V | ParentsCount [ti] = 0} // Prepare the ready tasks to execute |
| j = 1 |
| While (ReadyTasks set is not Empty) |
| Choose a Task tk from the ReadyTasks set randomly |
| Add tk to Schedule [1][j] |
| Choose a Processor p from the ProcessorList randomly |
| Add p to Schedule [2][j] |
| j = j + 1 |
| For all Children ti ∈ {Successors of tk} |
| ParentsCount [ti] = ParentsCount [ti] − 1 |
| if (ParentsCount [ti] == 0) |
| Add ti to ReadyTasks set |
| Algorithm 2: Makespan Calculation |
| Makespan-Calculation (Schedule [1…2][1…n], ExecutionTime [], CommunicationTime []) |
| //ExecutionTime is the tasks execution time |
| //CommunicationTime is the cost of edges between task pairs |
| P [1|P|] = {0}, AT [1…|T|] = {0}, FT [1…|T|] = {0} |
| //|P| and |T| are the number of processors and number of tasks respectively |
| //P[pi] is the time at which processor pi becomes idle |
| // AT[ti]is the time that ti would be ready to execute |
| // FT[ti]is the finish time of taskti |
| for i = 0 to |T| |
| ti = Schedule [0][i] |
| P [Schedule [1][i]] = max (AT [ti], P [Schedule [1][i]] + ExecutionTime(ti)) |
| FT[ti] = P [schedule [1][i]] |
| for all Tasks tj ϵ Successors(ti) in the task graph |
| temp = FT [ti]; |
| if (schedule [1][i] is not same as processor assigned to tj) |
| temp = temp + Communication_time (ti, tj) |
| AT [tj] = max (temp, AT [tj]) |
| Makespan = Max (P [1…|P|]) |
| Algorithm 3: VNS method |
| VNS (Archive) // Archive consists of all non-dominated solutions found so far |
| Define a neighborhood structure // It is a modification way to change a solution |
| // The modification is performed using the mutation operator presented in Figure 9 |
| While (VNS has not been applied on 10 solutions) |
| Choose a random solution X from archive |
| for k = 1 to 10 |
| Generate a solution Y from X using the structure N |
| for p = 1 to 3 // Local Search is applied on solution Y |
| Generate a new solution Z from Y by changing 3 processors randomly |
| if (Z dominated Y) |
| Copy Z to Y |
| if (Y dominates X) |
| Copy Y to X |
| Algorithm 4: Crossover |
| Crossover (Parent1 [1…2][1…n], Parent2 [1…2][1…n]) |
| R = random (0, 1) // Generate a random number between 0 and 1 for Crossover Rate |
| If (R < CrossoverProbability) |
| Cutpoint1 = RandomNumber (1, n) |
| Cutpoint2 = RandomNumber (1, n) |
| For i = 1 to Cutpoint1 |
| Swap (Parent1 [2][i] and Parent2 [2][i]) |
| For i = Cutpoint2 to n |
| Swap (Parent1 [2][i] and Parent2 [2][i]) |
| Algorithm 5: Mutation |
| Mutation (Schedule [1…2][1…n], V) // V is the set of tasks |
| NewSchedule = Schedule // NewSchedule is mutated version of Schedule |
| For all Tasks ti ∈ V in task graph //Count the number of parents for each task |
| ParentsCount [ti] = number of ti parents in task graph |
| ReadyTasks = {ti ϵ V | ParentsCount [ti] = 0} // Prepare the ready tasks to execute |
| ReadyCount = Number of tasks in ReadyTasks set |
| p = 0, pp = 0, cutpoint = RandomNumber (1, n) |
| q = Random (1, cutpoint) // After cutpoint, the order of tasks will be changed randomly |
| While (ReadyCount >= 0) |
| SelectCount = Number of tasks in ReadyTasks set |
| SelectList = ReadyTasks |
| If (SelectCount > 1) |
| pp = pp + 1 |
| If (pp >= q) // if it is after cutpoint, the next task is selected randomly amongst ready tasks |
| s = Random (1, SelectCount) |
| t = SelectList (s) //choose a task from ready tasks randomly |
| Remove t from ReadyTasks |
| ReadyCount = ReadyCount − 1 |
| p = p + 1 |
| NewSchedule [1][p] = t |
| Else // if it is before cutpoint, the next task is selected from Schedule |
| p = p + 1 |
| t = Schedule [1][p] |
| ReadyCount = ReadyCount − 1 |
| For all Children ci ∈ {Successors of t} |
| ParentsCount [ci] = ParentsCount [ci] − 1 //decrement the number of parents by one |
| If (ParentsCount [ci] == 0) |
| Add ci to ReadyTasks set //add new ready tasks to ReadyTasks set |
| For i = 1 to 3 //exchange the processors three times |
| R1 = Random (1, n); |
| R2 = Random (1, n); |
| SWAP (NewSchedule [2] [R1] and solution [2] [R2]); |
5. Results and Discussion
5.1. Parameter Values
5.2. Performance Evaluation Using Bi-Objective Benchmarks
5.3. Performance Evaluation Using Three-Objective Benchmarks
6. Conclusions
Author Contributions
Funding
Institutional Review Board Statement
Informed Consent Statement
Data Availability Statement
Conflicts of Interest
Nomenclature List
| AT[ti] | Readiness of each task to begin execution |
| aft(s) | The summation of all completion times divided by |P| |
| BGA | Bi-objective Genetic Algorithm |
| CPGA | Critical Path Genetic Algorithm |
| Cj(s) | The time that processor pj finishes execution |
| DE | Differential Evolution |
| EP | Evolutionary Programming |
| FA | Firefly based Algorithm |
| FT[ti] | The Completion time of task i |
| GA | Genetic Algorithm |
| GE | Gaussian Elimination Graph |
| HEFT | Heterogeneous Earliest Finish Time |
| MaxjCj(s) | Completion time of last processor in schedule s |
| MODE | Multi-objective Differential Evolution |
| MOEP | Multi-objective Evolutionary Programming |
| MFA | Mean Field Annealing |
| MOGA | Multi-objective Genetic Algorithm |
| MOO | Multi-objective Optimization |
| NP | Non-deterministic Polynomial |
| NSGAII | Non-Dominated Sorting Genetic Algorithm |
| PF | Pareto-Front |
| RVEA | Reference Vector guided Evolutionary Algorithm |
| R+ | Sum of all better ranks |
| R− | Sum of all worse ranks |
| SGA | Standard Genetic Algorithm |
| Sim | mapping task i to processor pm |
| Sjn | mapping task j to processor pn |
| VNS | Variable Neighborhood Search |
| VAEA | Vector Angle-Based Evolutionary Algorithm |
| v(j, s) | All tasks assigned to processor pj |
| #p | The number of tasks |
| #t | The number of processors |
| α | Significance level |
| λj | The failure rate of processor pj |
| λmn | The communication failure rate of processors pm and pn |
References
- Basgumus, A.; Namdar, M.; Yilmaz, G.; Altuncu, A. Performance comparison of the differential evolution and particle swarm optimization algorithms in free-space optical communications systems. Adv. Electr. Comput. Eng. 2015, 15, 17–22. [Google Scholar] [CrossRef]
- Sindhya, K.; Ruuska, S.; Haanpää, T.; Miettinen, K. A new hybrid mutation operator for multiobjective optimization with differential evolution. Soft Comput. 2011, 15, 2041–2055. [Google Scholar] [CrossRef]
- Cao, B.; Li, M.; Liu, X.; Zhao, J.; Cao, W.; Lv, Z. Many-objective deployment optimization for a drone-assisted camera network. IEEE Trans. Netw. Sci. Eng. 2021, 8, 2756–2764. [Google Scholar] [CrossRef]
- Ghadiri Nejad, M.; Shavarani, S.M.; Vizvári, B.; Barenji, R.V. Trade-off between process scheduling and production cost in cyclic flexible robotic cells. Int. J. Adv. Manuf. Technol. 2018, 96, 1081–1091. [Google Scholar] [CrossRef]
- Cao, B.; Fan, S.; Zhao, J.; Tian, S.; Zheng, Z.; Yan, Y.; Yang, P. Large-scale many-objective deployment optimization of edge servers. IEEE Trans. Intell. Transp. Syst. 2021, 22, 3841–3849. [Google Scholar] [CrossRef]
- Nusen, P.; Boonyung, W.; Nusen, S.; Panuwatwanich, K.; Champrasert, P.; Kaewmoracharoen, M. Construction planning and scheduling of a renovation project using BIM-based multi-objective genetic algorithm. Appl. Sci. 2021, 11, 4716. [Google Scholar] [CrossRef]
- Wang, S.; Sheng, H.; Yang, D.; Zhang, Y.; Wu, Y.; Wang, S. Extendable multiple nodes recurrent tracking framework with RTU++. IEEE Trans. Image Process. 2022, 31, 5257–5271. [Google Scholar] [CrossRef]
- Lotfi, N. Ensemble of multi-objective metaheuristics for multiprocessor scheduling in heterogeneous distributed systems: A novel success-proportionate learning-based system. SN Appl. Sci. 2019, 1, 1398. [Google Scholar] [CrossRef]
- Lu, C.; Zheng, J.; Yin, L.; Wang, R. An improved iterated greedy algorithm for the distributed hybrid flowshop scheduling problem. Eng. Optim. 2023, 1–9. [Google Scholar] [CrossRef]
- Lu, C.; Gao, R.; Yin, L.; Zhang, B. Human-Robot Collaborative Scheduling in Energy-efficient Welding Shop. IEEE Trans. Ind. Inform. 2023, 1–9. [Google Scholar] [CrossRef]
- Lotfi, N.; Acan, A. Solving multiprocessor scheduling problem using multi-objective mean field annealing. In Proceedings of the 2013 IEEE 14th International Symposium on Computational Intelligence and Informatics (CINTI), Budapest, Hungary, 19–21 November 2013; pp. 113–118. [Google Scholar]
- Chitra, P.; Revathi, S.; Venkatesh, P.; Rajaram, R. Evolutionary algorithmic approaches for solving three objectives task scheduling problem on heterogeneous systems. In Proceedings of the 2010 IEEE 2nd International Advance Computing Conference (IACC), Patiala, India, 19–20 February 2010; pp. 38–43. [Google Scholar]
- Goli, A.; Golmohammadi, A.M.; Verdegay, J.L. Two-echelon electric vehicle routing problem with a developed moth-flame meta-heuristic algorithm. Oper. Manag. Res. 2022, 15, 891–912. [Google Scholar] [CrossRef]
- Chitra, P.; Venkatesh, P.; Rajaram, R. Comparison of evolutionary computation algorithms for solving bi-objective task scheduling problem on heterogeneous distributed computing systems. Sadhana 2011, 36, 167–180. [Google Scholar] [CrossRef]
- Fonseca, C.M.; Fleming, P.J. Genetic algorithms for multiobjective optimization: Formulation discussion and generalization. InIcga 1993, 93, 416–423. [Google Scholar]
- Nejad, M.G.; Güden, H.; Vizvári, B. Time minimization in flexible robotic cells considering intermediate input buffers: A comparative study of three well-known problems. Int. J. Comput. Integr. Manuf. 2019, 32, 809–819. [Google Scholar] [CrossRef]
- Chen, Y.; Li, D.; Ma, P. Implementation of multi-objective evolutionary algorithm for task scheduling in heterogeneous distributed systems. J. Softw. 2012, 7, 1367–1374. [Google Scholar] [CrossRef]
- Bahlouli, K.; Lotfi, N.; Ghadiri Nejad, M. A New Multi-Heuristic Method to Optimize the Ammonia–Water Power/Cooling Cycle Combined with an HCCI Engine. Sustainability 2023, 15, 6545. [Google Scholar] [CrossRef]
- Robič, T.; Filipič, B. Differential evolution for multiobjective optimization. In Proceedings of the Evolutionary Multi-Criterion Optimization: Third International Conference, EMO 2005, Guanajuato, Mexico, 9–11 March 2005; Proceedings 3. Springer: Berlin/Heidelberg, Germany, 2005; pp. 520–553. [Google Scholar]
- Deng, W.; Shang, S.; Cai, X.; Zhao, H.; Song, Y.; Xu, J. An improved differential evolution algorithm and its application in optimization problem. Soft Comput. 2021, 25, 5277–5298. [Google Scholar] [CrossRef]
- Yildiz, A.R. A new hybrid differential evolution algorithm for the selection of optimal machining parameters in milling operations. Appl. Soft Comput. 2013, 13, 1561–1566. [Google Scholar] [CrossRef]
- Song, E.; Li, H. A hybrid differential evolution for multi-objective optimisation problems. Connect. Sci. 2022, 34, 224–253. [Google Scholar] [CrossRef]
- Rauf, H.T.; Bangyal, W.H.; Lali, M.I. An adaptive hybrid differential evolution algorithm for continuous optimization and classification problems. Neural Comput. Appl. 2021, 33, 10841–10867. [Google Scholar] [CrossRef]
- Zhou, X.; Sun, K.; Wang, J.; Zhao, J.; Feng, C.; Yang, Y.; Zhou, W. Computer Vision Enabled Building Digital Twin Using Building Information Model. IEEE Trans. Ind. Inform. 2022, 19, 2684–2692. [Google Scholar] [CrossRef]
- Lv, Z.; Wu, J.; Li, Y.; Song, H. Cross-layer optimization for industrial Internet of Things in real scene digital twins. IEEE Internet Things J. 2022, 9, 15618–15629. [Google Scholar] [CrossRef]
- Cao, B.; Gu, Y.; Lv, Z.; Yang, S.; Zhao, J.; Li, Y. RFID reader anticollision based on distributed parallel particle swarm optimization. IEEE Internet Things J. 2020, 8, 3099–3107. [Google Scholar] [CrossRef]
- Li, B.; Tan, Y.; Wu, A.G.; Duan, G.R. A distributionally robust optimization based method for stochastic model predictive control. IEEE Trans. Autom. Control 2021, 67, 5762–5776. [Google Scholar] [CrossRef]
- Xiong, Z.; Li, X.; Zhang, X.; Deng, M.; Xu, F.; Zhou, B.; Zeng, M. A Comprehensive Confirmation-based Selfish Node Detection Algorithm for Socially Aware Networks. J. Signal Process. Syst. 2023, 1–9. [Google Scholar] [CrossRef]
- Zhou, G.; Zhang, R.; Huang, S. Generalized buffering algorithm. IEEE Access 2021, 9, 27140–27157. [Google Scholar] [CrossRef]
- Parsa, S.; Lotfi, S.; Lotfi, N. An evolutionary approach to task graph scheduling. In Adaptive and Natural Computing Algorithms, Proceedings of the 8th International Conference, ICANNGA 2007, Warsaw, Poland, 11–14 April 2007; Proceedings, Part I; Springer: Berlin/Heidelberg, Germany, 2007; pp. 110–119. [Google Scholar]
- Fontes, D.B.; Gaspar-Cunha, A. On multi-objective evolutionary algorithms. In Handbook of Multicriteria Analysis; Springer: Berlin/Heidelberg, Germany, 2010; pp. 287–310. [Google Scholar]
- Zenggang, X.; Mingyang, Z.; Xuemin, Z.; Sanyuan, Z.; Fang, X.; Xiaochao, Z.; Yunyun, W.; Xiang, L. Social similarity routing algorithm based on socially aware networks in the big data environment. J. Signal Process. 2022, 94, 1253–1267. [Google Scholar] [CrossRef]
- Cao, B.; Zhang, W.; Wang, X.; Zhao, J.; Gu, Y.; Zhang, Y. A memetic algorithm based on two_Arch2 for multi-depot heterogeneous-vehicle capacitated arc routing problem. Swarm Evol. Comput. 2021, 63, 100864. [Google Scholar] [CrossRef]
- Ma, P.Y. A task allocation model for distributed computing systems. IEEE Trans. Comput. 1982, 100, 41–47. [Google Scholar]
- Omara, F.A.; Arafa, M.M. Genetic algorithms for task scheduling problem. J. Parallel Distrib. Comput. 2010, 70, 13–22. [Google Scholar] [CrossRef]
- Deb, K.; Pratap, A.; Agarwal, S.; Meyarivan, T.A. A fast and elitist multiobjective genetic algorithm: NSGA-II. IEEE Trans. Evol. Comput. 2002, 6, 182–197. [Google Scholar] [CrossRef]
- Correa, R.C.; Ferreira, A.; Rebreyend, P. Scheduling multiprocessor tasks with genetic algorithms. IEEE Trans. Parallel Distrib. Syst. 1999, 10, 825–837. [Google Scholar] [CrossRef]
- Fogel, D.B.; Fogel, L.J. Using evolutionary programming to schedule tasks on a suite of heterogeneous computers. Comput. Oper. Res. 1996, 23, 527–534. [Google Scholar] [CrossRef]
- Nejad, M.G.; Kashan, A.H. An effective grouping evolution strategy algorithm enhanced with heuristic methods for assembly line balancing problem. J. Adv. Manuf. Syst. 2019, 18, 487–509. [Google Scholar] [CrossRef]
- Eswari, R.; Nickolas, S. Modified multi-objective firefly algorithm for task scheduling problem on heterogeneous systems. Int. J. Bio-Inspired Comput. 2016, 8, 379–393. [Google Scholar] [CrossRef]
- Sathappan, O.L.; Chitra, P.; Venkatesh, P.; Prabhu, M. Modified genetic algorithm for multiobjective task scheduling on heterogeneous computing system. Int. J. Inf. Technol. Commun. Converg. 2011, 1, 146–158. [Google Scholar] [CrossRef]
- Doğan, A.; Özgüner, F. Biobjective scheduling algorithms for execution time–reliability trade-off in heterogeneous computing systems. Comput. J. 2005, 48, 300–314. [Google Scholar] [CrossRef]
- Wang, Y.; Sun, X. A many-objective optimization algorithm based on weight vector adjustment. Comput. Intell. Neurosci. 2018, 2018, 4527968. [Google Scholar] [CrossRef]
- Xiang, Y.; Peng, J.; Zhou, Y.; Li, M.; Chen, Z. An angle based constrained many-objective evolutionary algorithm. Appl. Intell. 2017, 47, 705–720. [Google Scholar] [CrossRef]
- Goli, A.; Ala, A.; Mirjalili, S. A robust possibilistic programming framework for designing an organ transplant supply chain under uncertainty. Ann. Oper. Res. 2022, 1–38. [Google Scholar] [CrossRef]
- Cheng, R.; Jin, Y.; Olhofer, M.; Sendhoff, B. A reference vector guided evolutionary algorithm for many-objective optimization. IEEE Trans. Evol. Comput. 2016, 20, 773–791. [Google Scholar] [CrossRef]
- Duan, Y.; Zhao, Y.; Hu, J. An initialization-free distributed algorithm for dynamic economic dispatch problems in microgrid: Modeling, optimization and analysis. Sustain. Energy Grids Netw. 2023, 34, 101004. [Google Scholar] [CrossRef]
- Li, X.; Sun, Y. Stock intelligent investment strategy based on support vector machine parameter optimization algorithm. Neural Comput. Appl. 2020, 32, 1765–1775. [Google Scholar] [CrossRef]
- Mao, Y.; Zhu, Y.; Tang, Z.; Chen, Z. A novel airspace planning algorithm for cooperative target localization. Electronics 2022, 11, 2950. [Google Scholar] [CrossRef]
- Ganesan, T.; Vasant, P.; Elamvazuthi, I.; Shaari, K.Z. Game-theoretic differential evolution for multiobjective optimization of green sand mould system. Soft Comput. 2016, 20, 3189–3200. [Google Scholar] [CrossRef]
- Opara, K.R.; Arabas, J. Differential Evolution: A survey of theoretical analyses. Swarm Evol. Comput. 2019, 44, 546–558. [Google Scholar] [CrossRef]
- Hansen, P.; Mladenović, N. Variable neighborhood search: Principles and applications. Eur. J. Oper. Res. 2001, 130, 449–467. [Google Scholar] [CrossRef]
- Liberti, L.; Drazic, M. Variable Neighbourhood Search for the Global Optimization of Constrained NLPs. Available online: http://www.lix.polytechnique.fr/~liberti/vnsgo05.pdf (accessed on 14 June 2023).
- Han, Y.; Li, J.Q.; Gong, D.; Sang, H. Multi-objective migrating birds optimization algorithm for stochastic lot-streaming flow shop scheduling with blocking. IEEE Access 2018, 7, 5946–5962. [Google Scholar] [CrossRef]
- Derrac, J.; García, S.; Molina, D.; Herrera, F. A practical tutorial on the use of nonparametric statistical tests as a methodology for comparing evolutionary and swarm intelligence algorithms. Swarm Evol. Comput. 2011, 1, 3–18. [Google Scholar] [CrossRef]
- Topcuoglu, H.; Hariri, S.; Wu, M.Y. Performance-effective and low-complexity task scheduling for heterogeneous computing. IEEE Trans. Parallel Distrib. Syst. 2002, 13, 260–274. [Google Scholar] [CrossRef]
- Li, J.Q.; Han, Y.Y.; Wang, C.G. A hybrid artificial bee colony algorithm to solve multi-objective hybrid flowshop in cloud computing systems. In Cloud Computing and Security, Proceedings of the Third International Conference, ICCCS 2017, Nanjing, China, 16–18 June 2017; Revised Selected Papers, Part I; Springer International Publishing: Berlin/Heidelberg, Germany, 2017; pp. 201–213. [Google Scholar]
- Habibi, M.; Navimipour, N.J. Multi-objective task scheduling in cloud computing using an imperialist competitive algorithm. Int. J. Adv. Comput. Sci. Appl. 2016, 7, 289–293. [Google Scholar] [CrossRef]
- Ghadiri Nejad, M.; Gueden, H.; Vizvári, B.; Vatankhah Barenji, R. A mathematical model and simulated annealing algorithm for solving the cyclic scheduling problem of a flexible robotic cell. Adv. Mech. Eng. 2018, 10, 1687814017753912. [Google Scholar] [CrossRef]
- Reddy, G.; Reddy, N.; Phanikumar, S. Multi objective task scheduling using modified ant colony optimization in cloud computing. Int. J. Intell. Eng. Syst. 2018, 11, 242–250. [Google Scholar] [CrossRef]
- Jena, R.K. Multi objective task scheduling in cloud environment using nested PSO framework. Procedia Comput. Sci. 2015, 57, 1219–1227. [Google Scholar] [CrossRef]
- Srichandan, S.; Kumar, T.A.; Bibhudatta, S. Task scheduling for cloud computing using multi-objective hybrid bacteria foraging algorithm. Future Comput. Inform. J. 2018, 3, 210–230. [Google Scholar] [CrossRef]

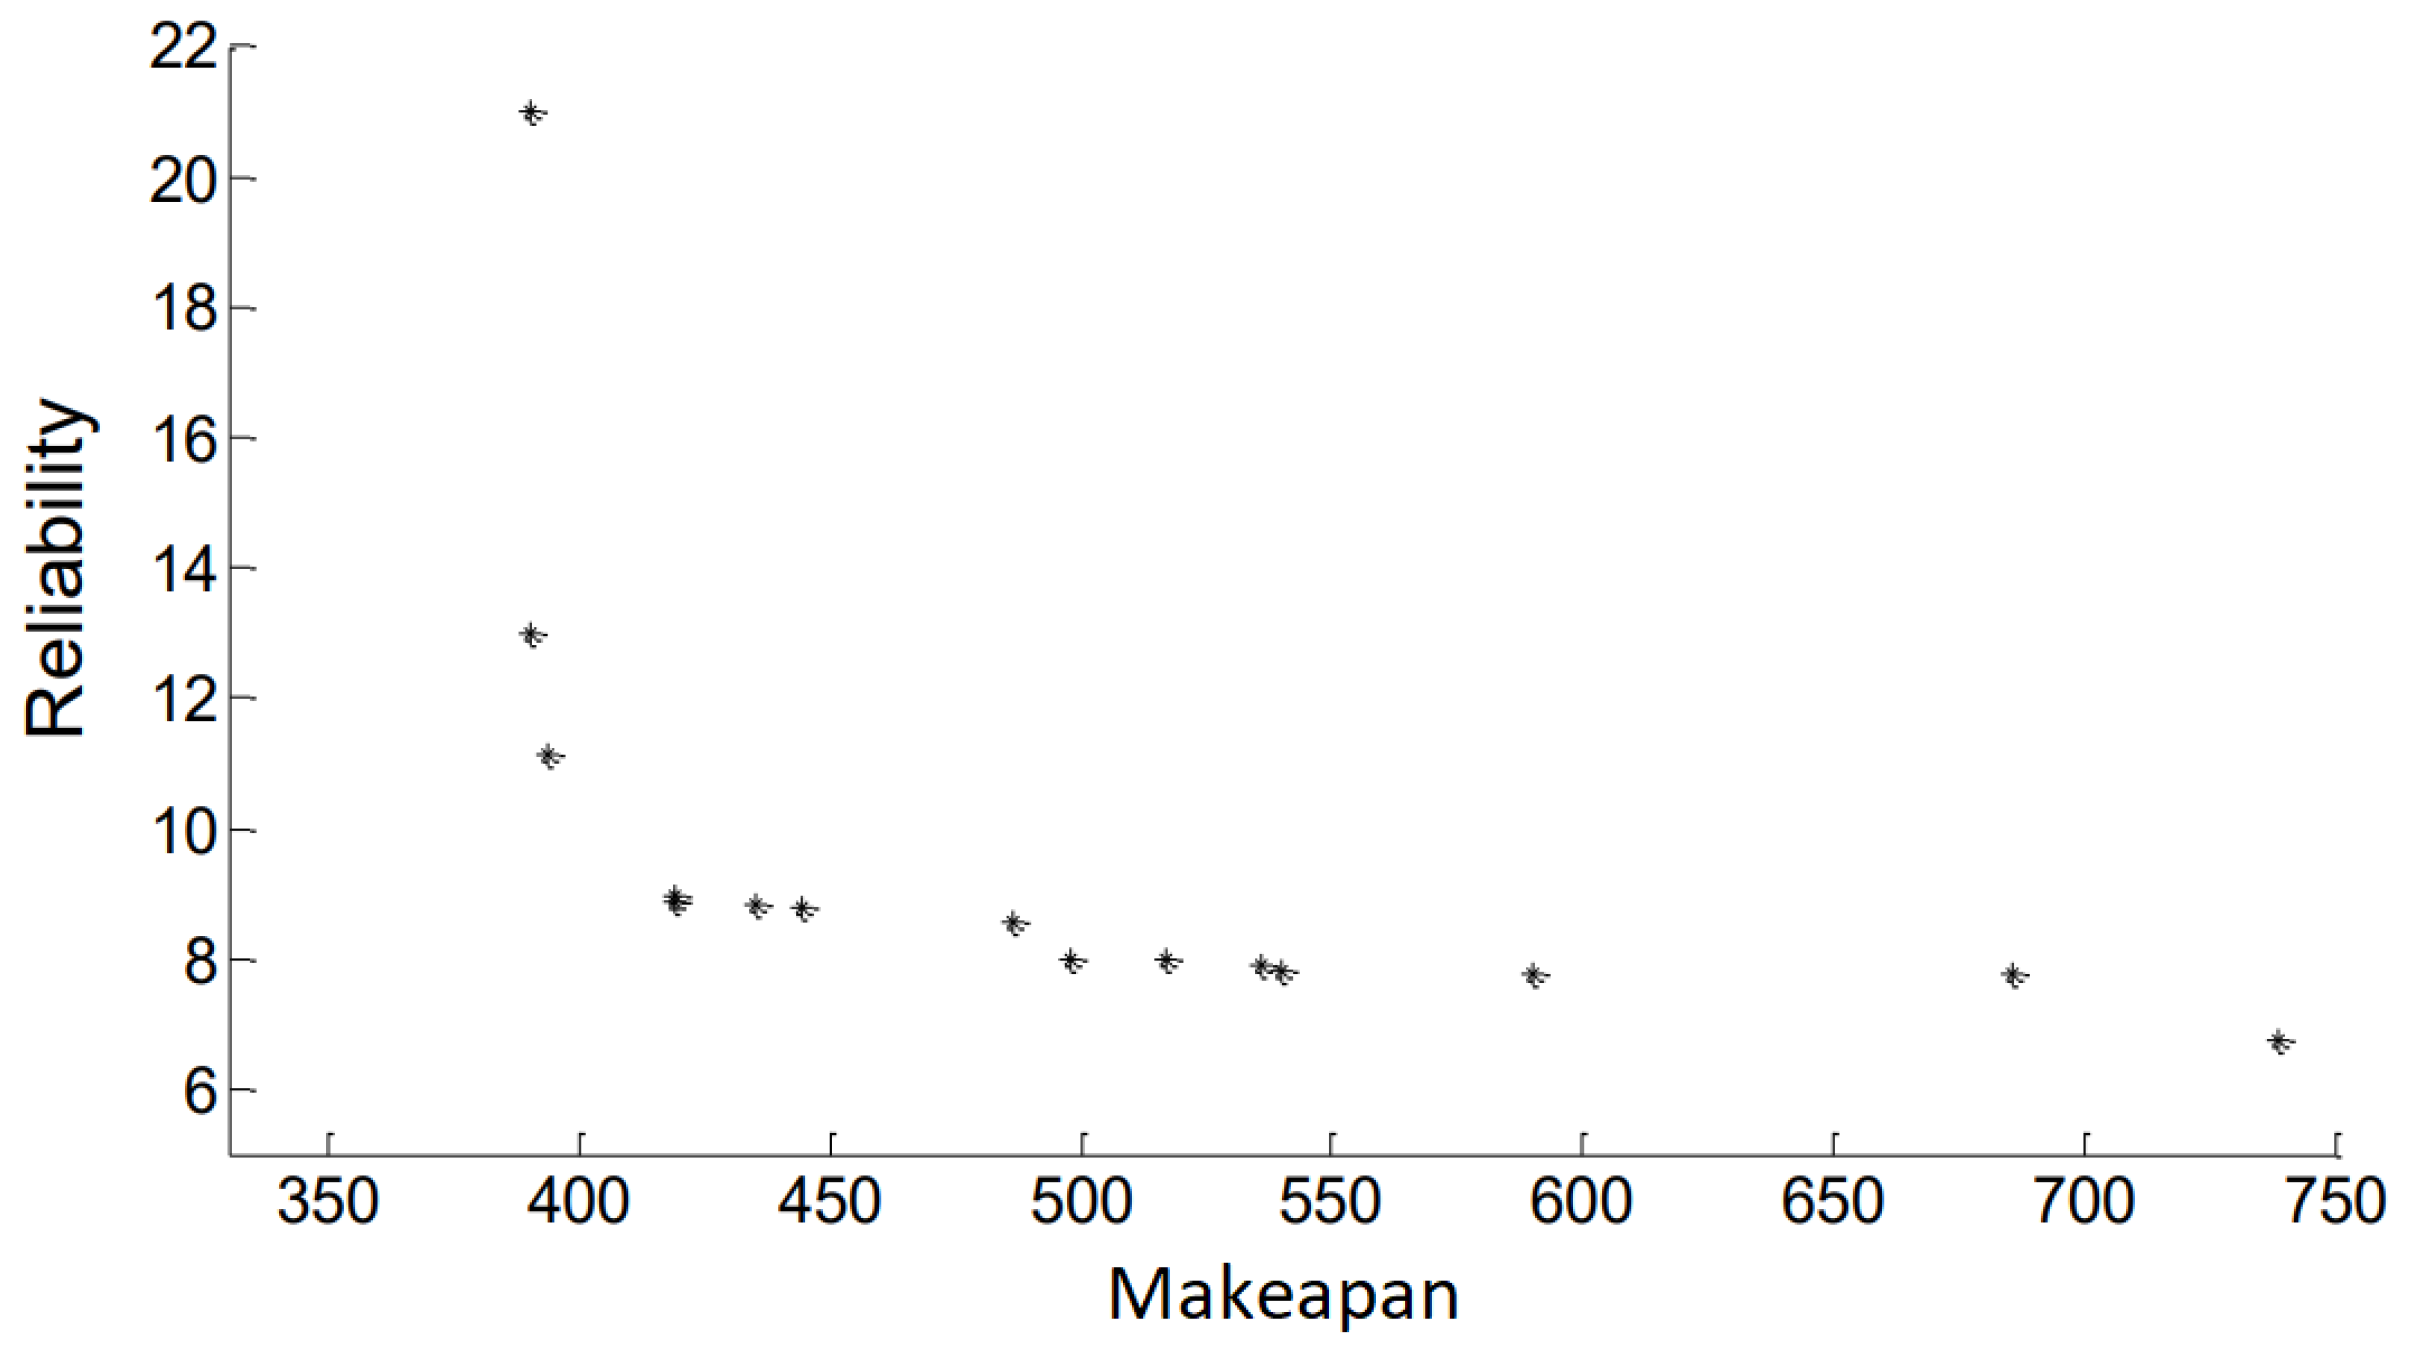
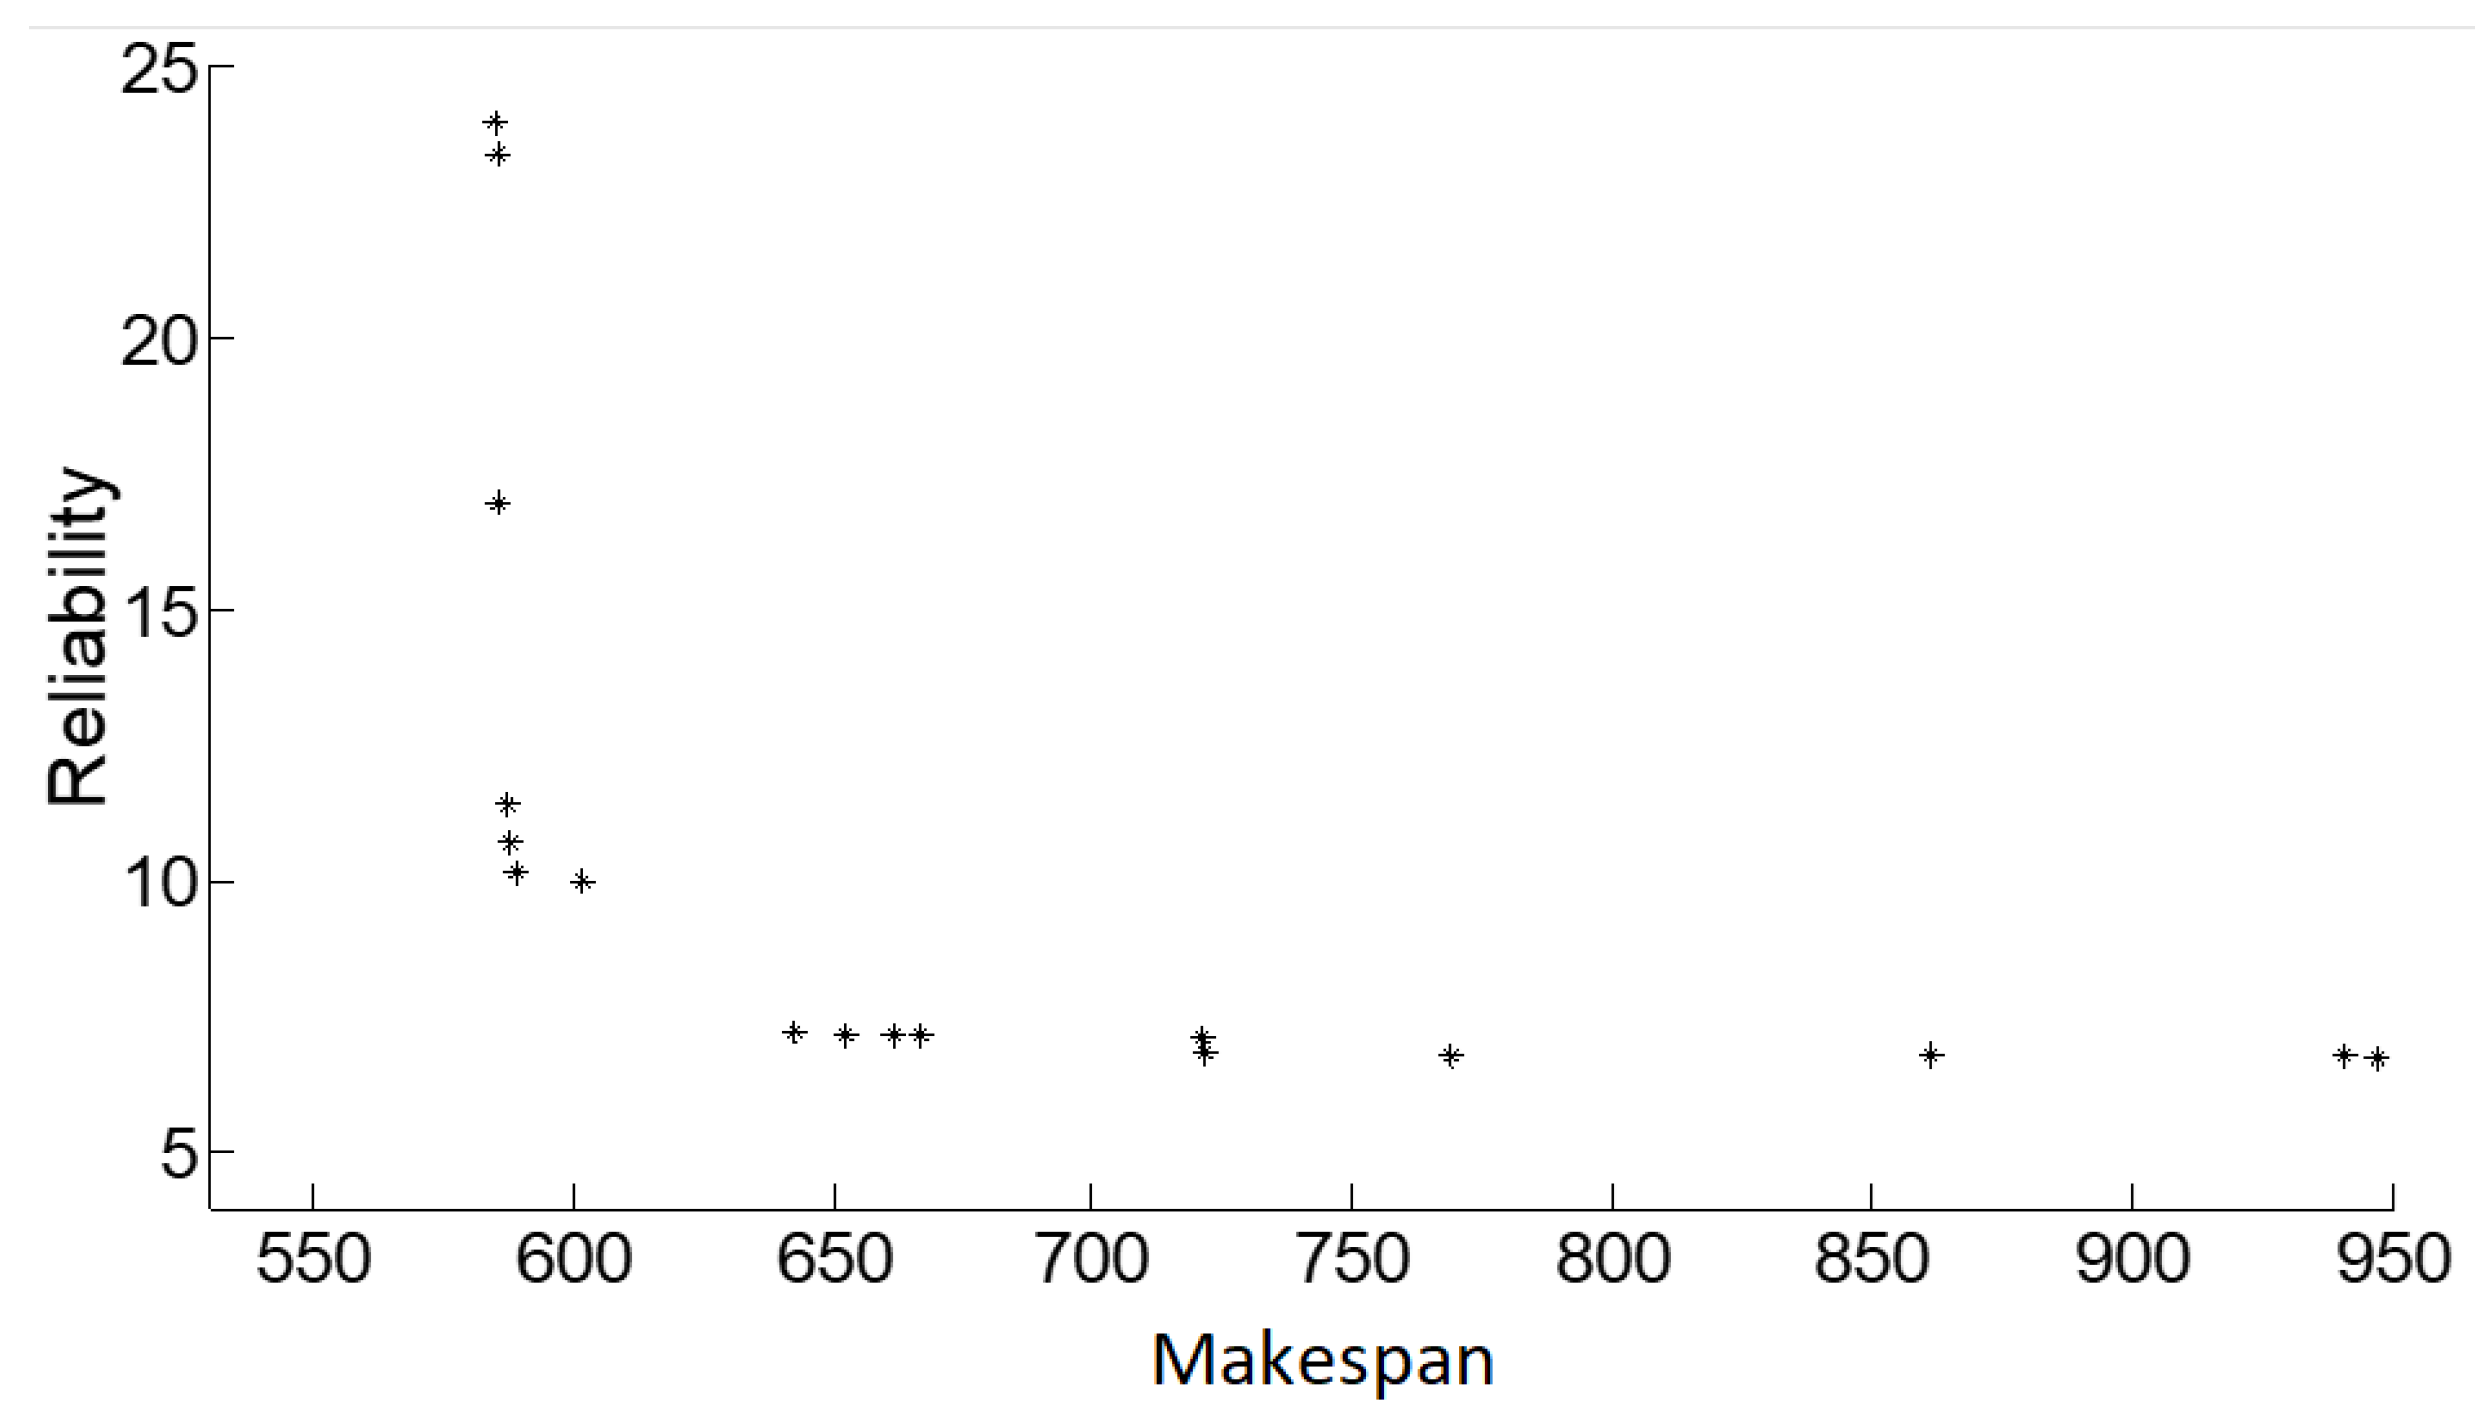
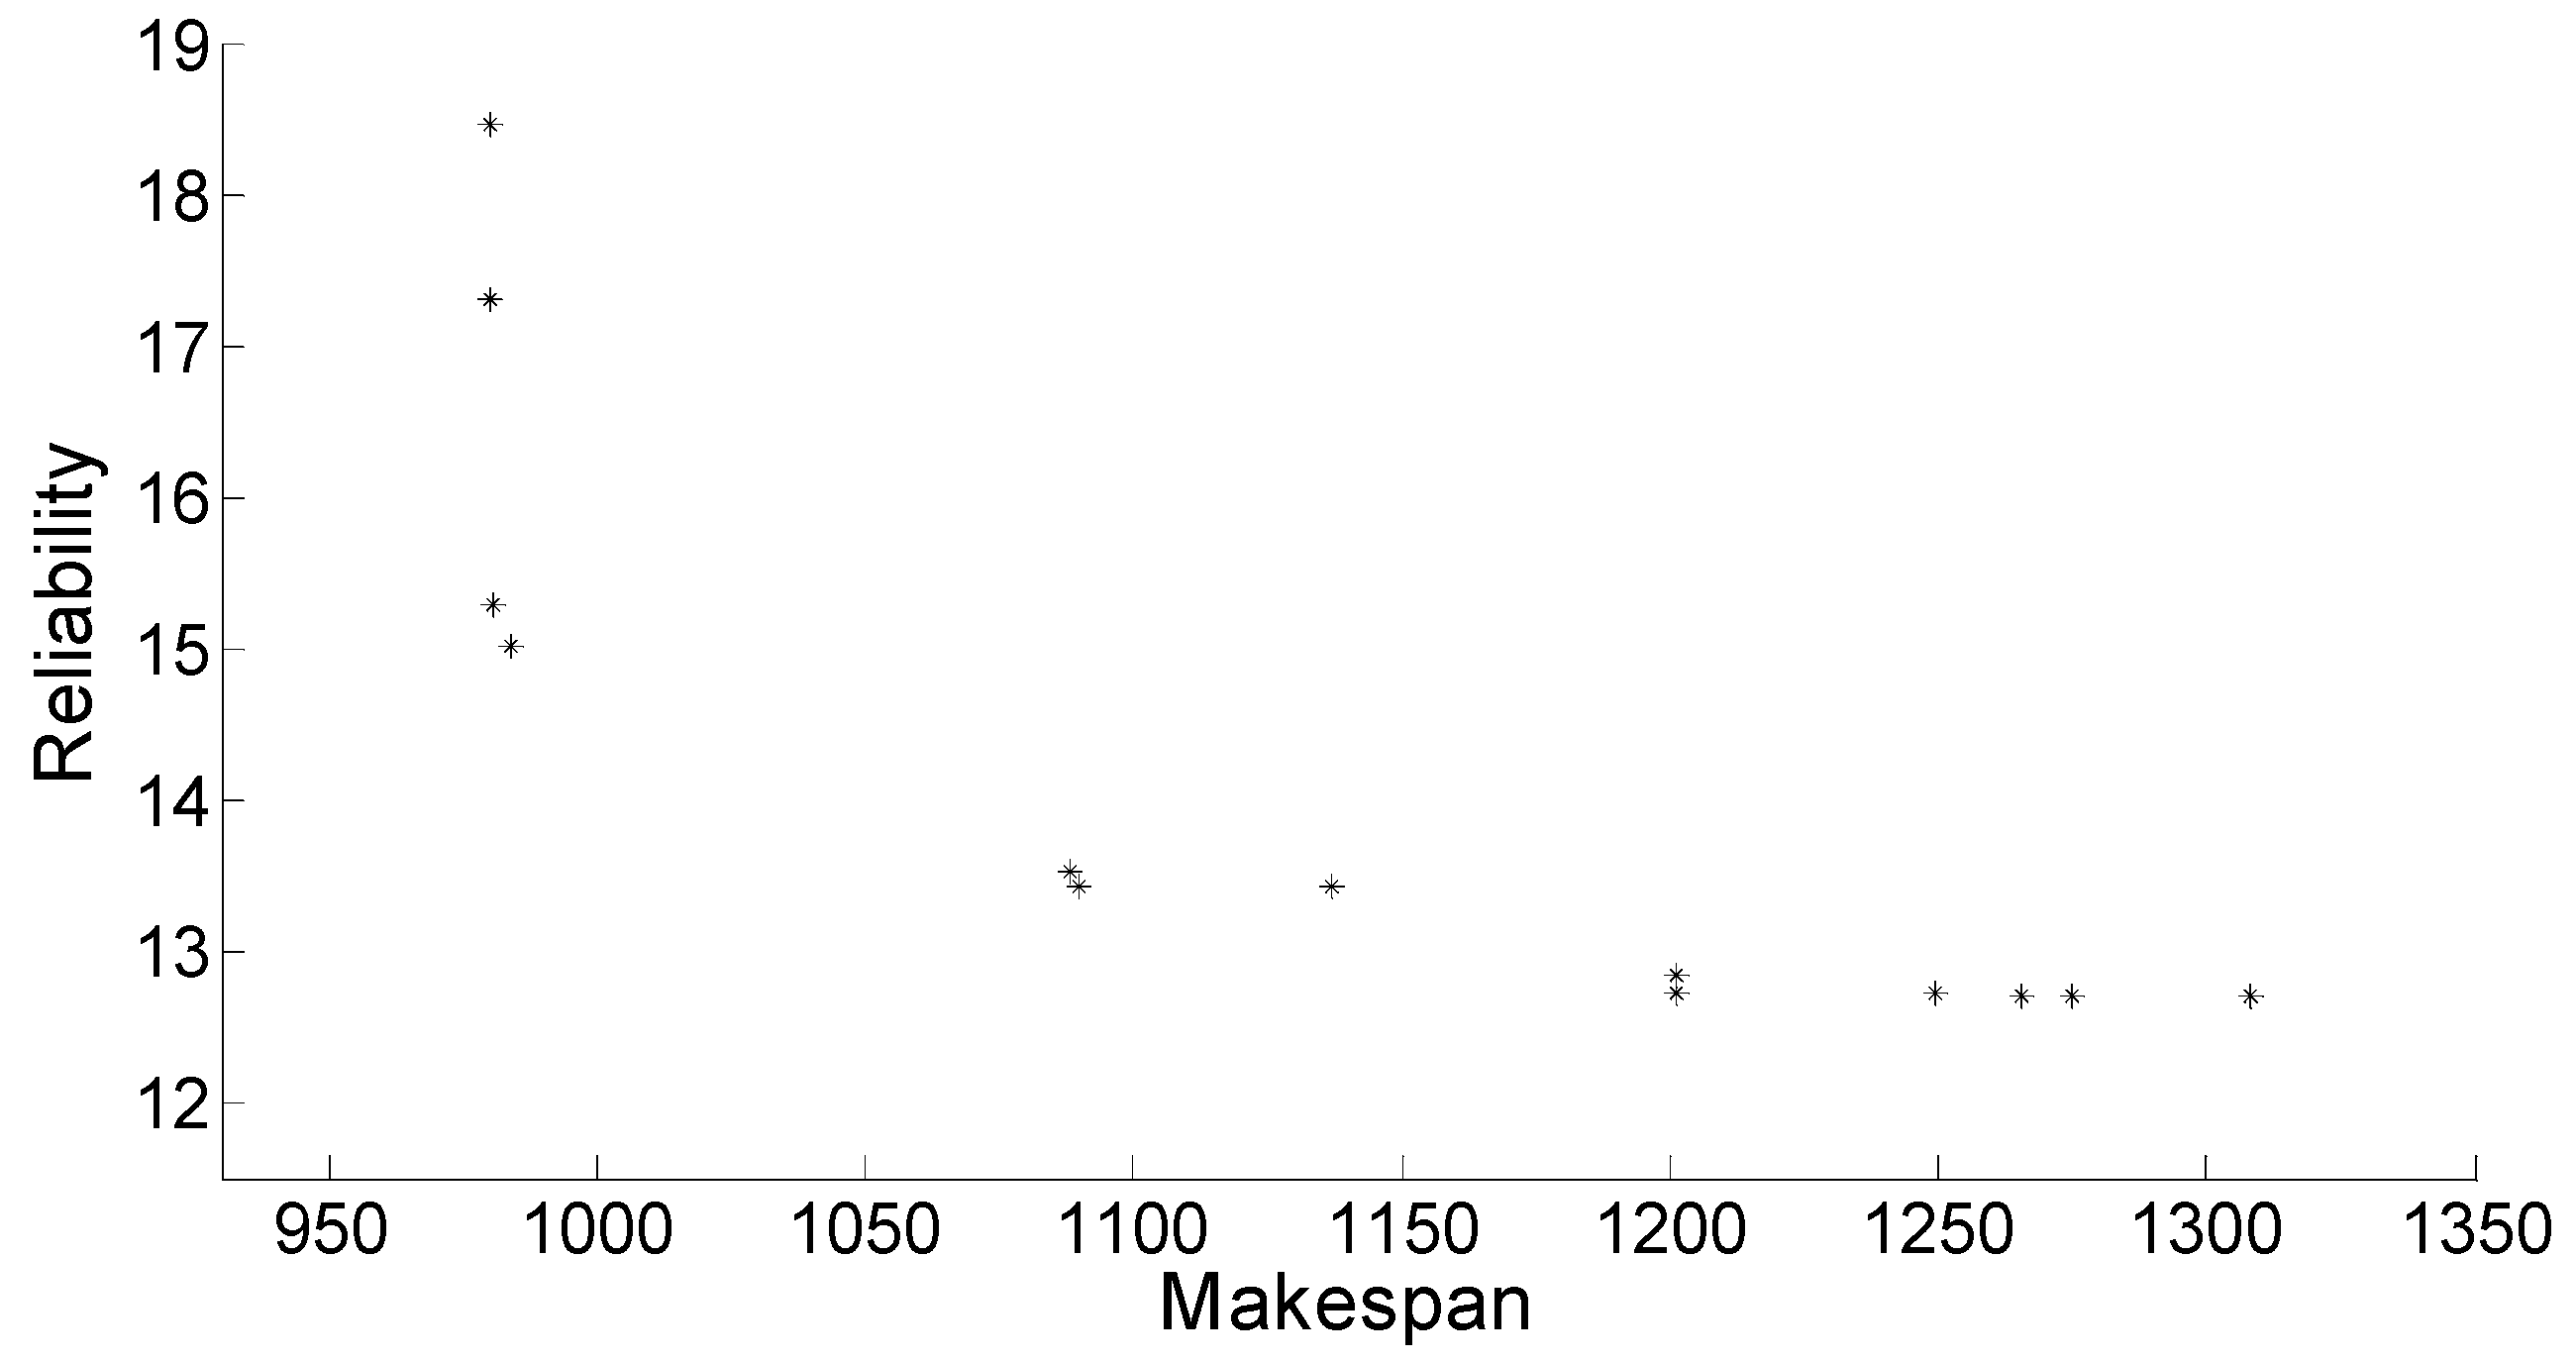
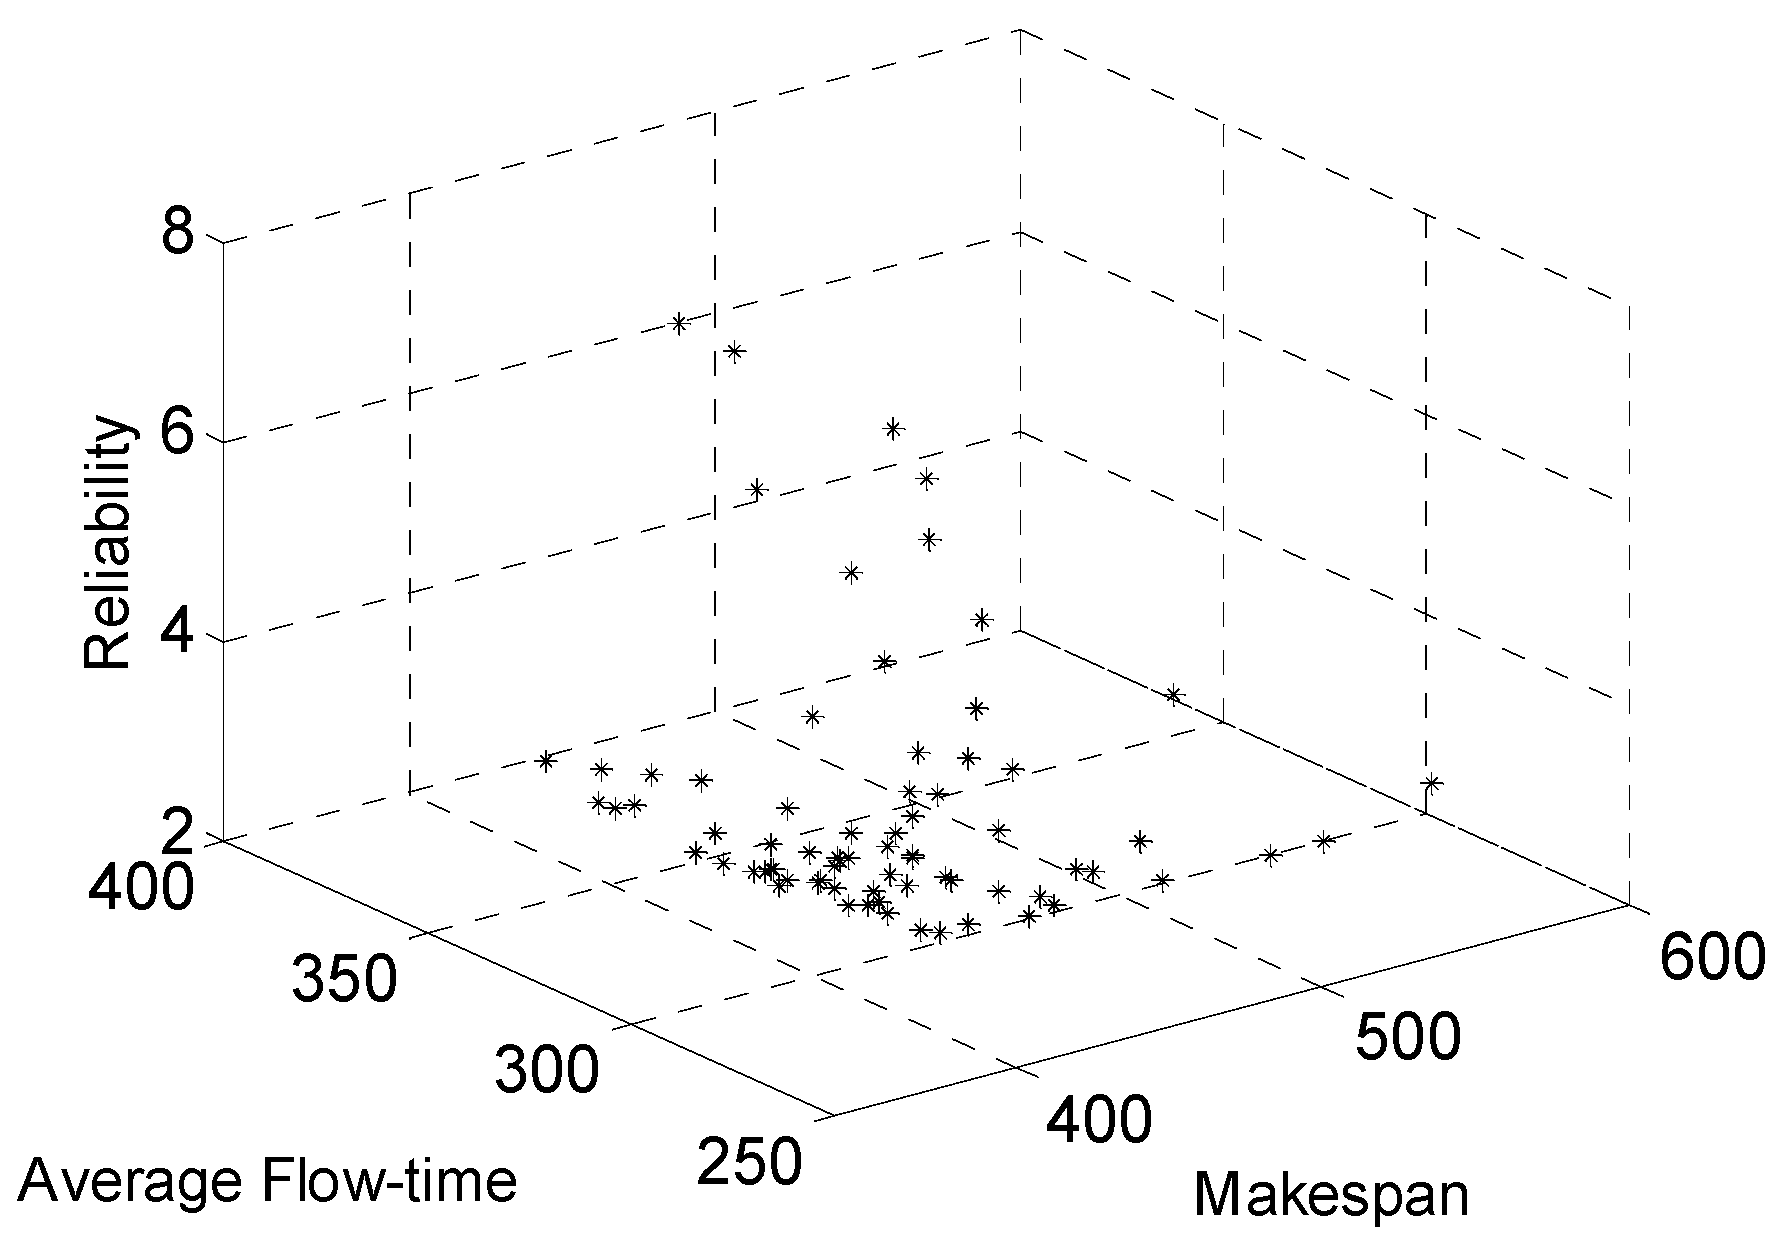
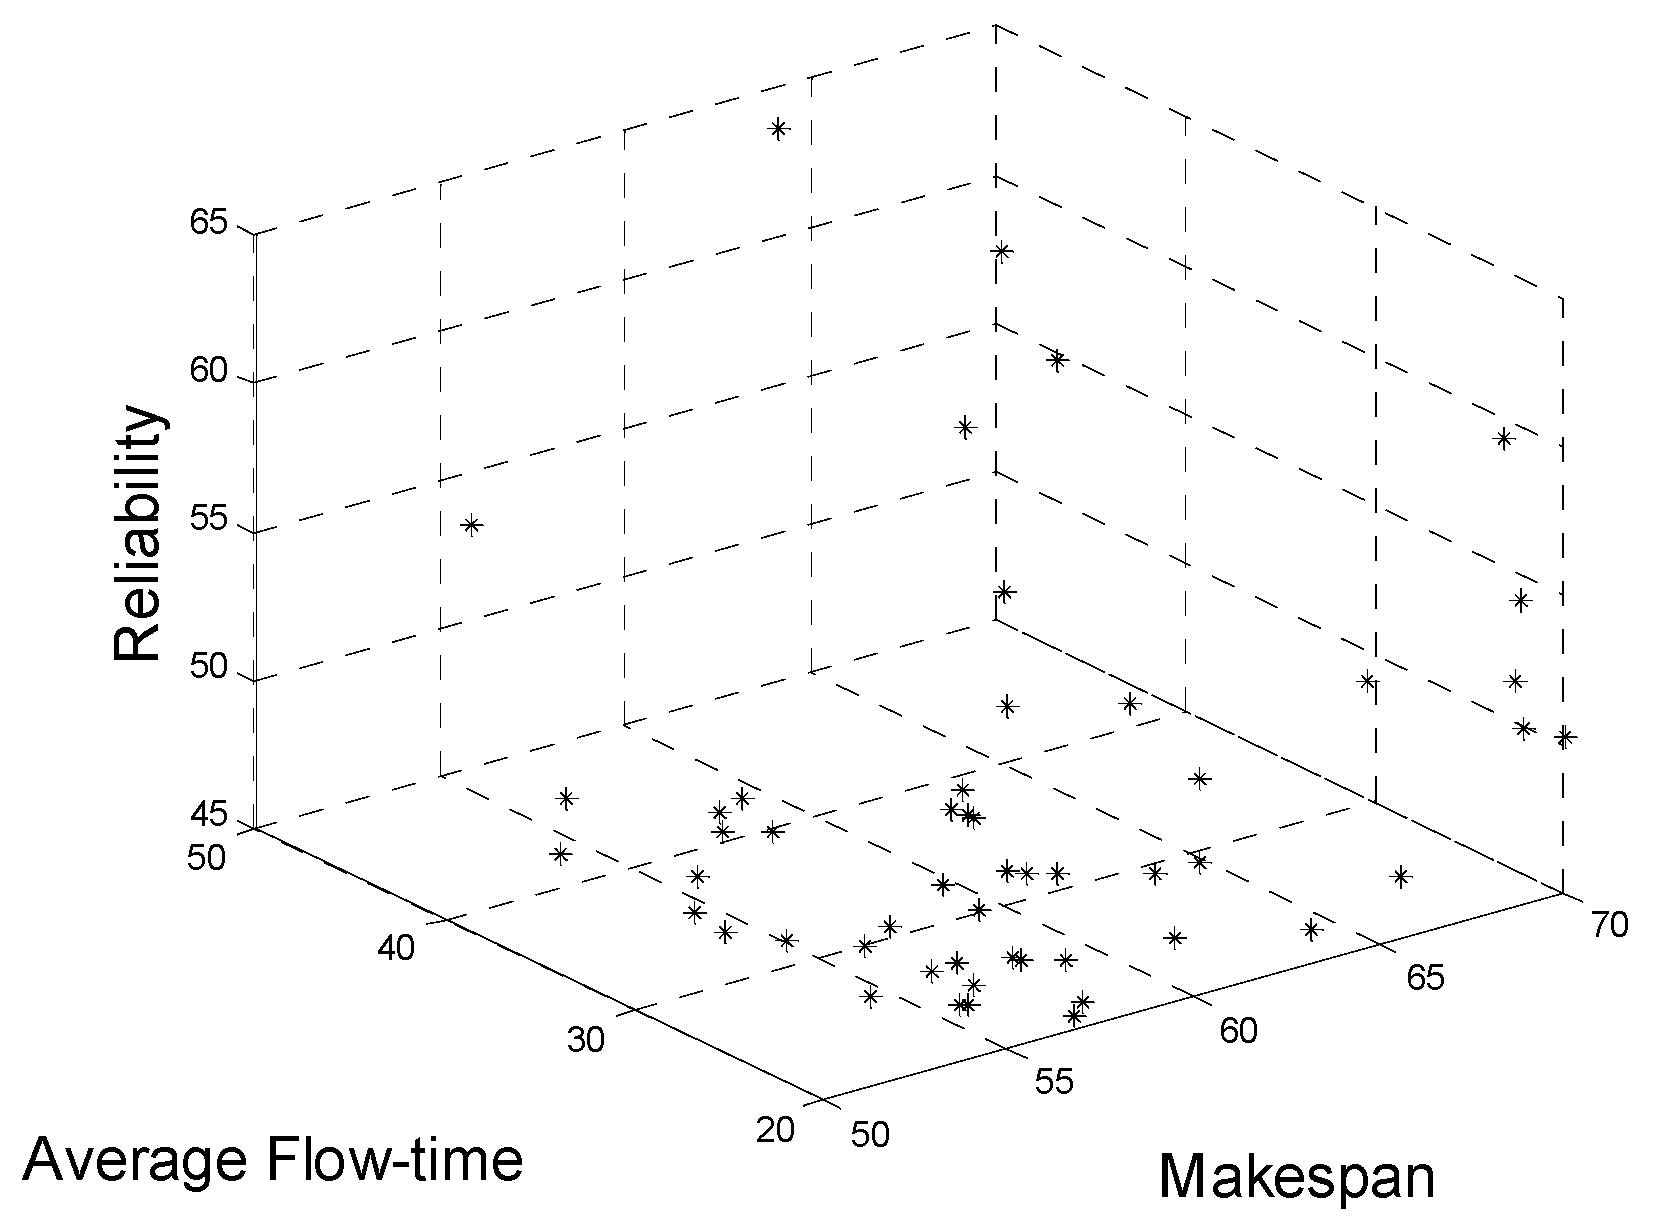

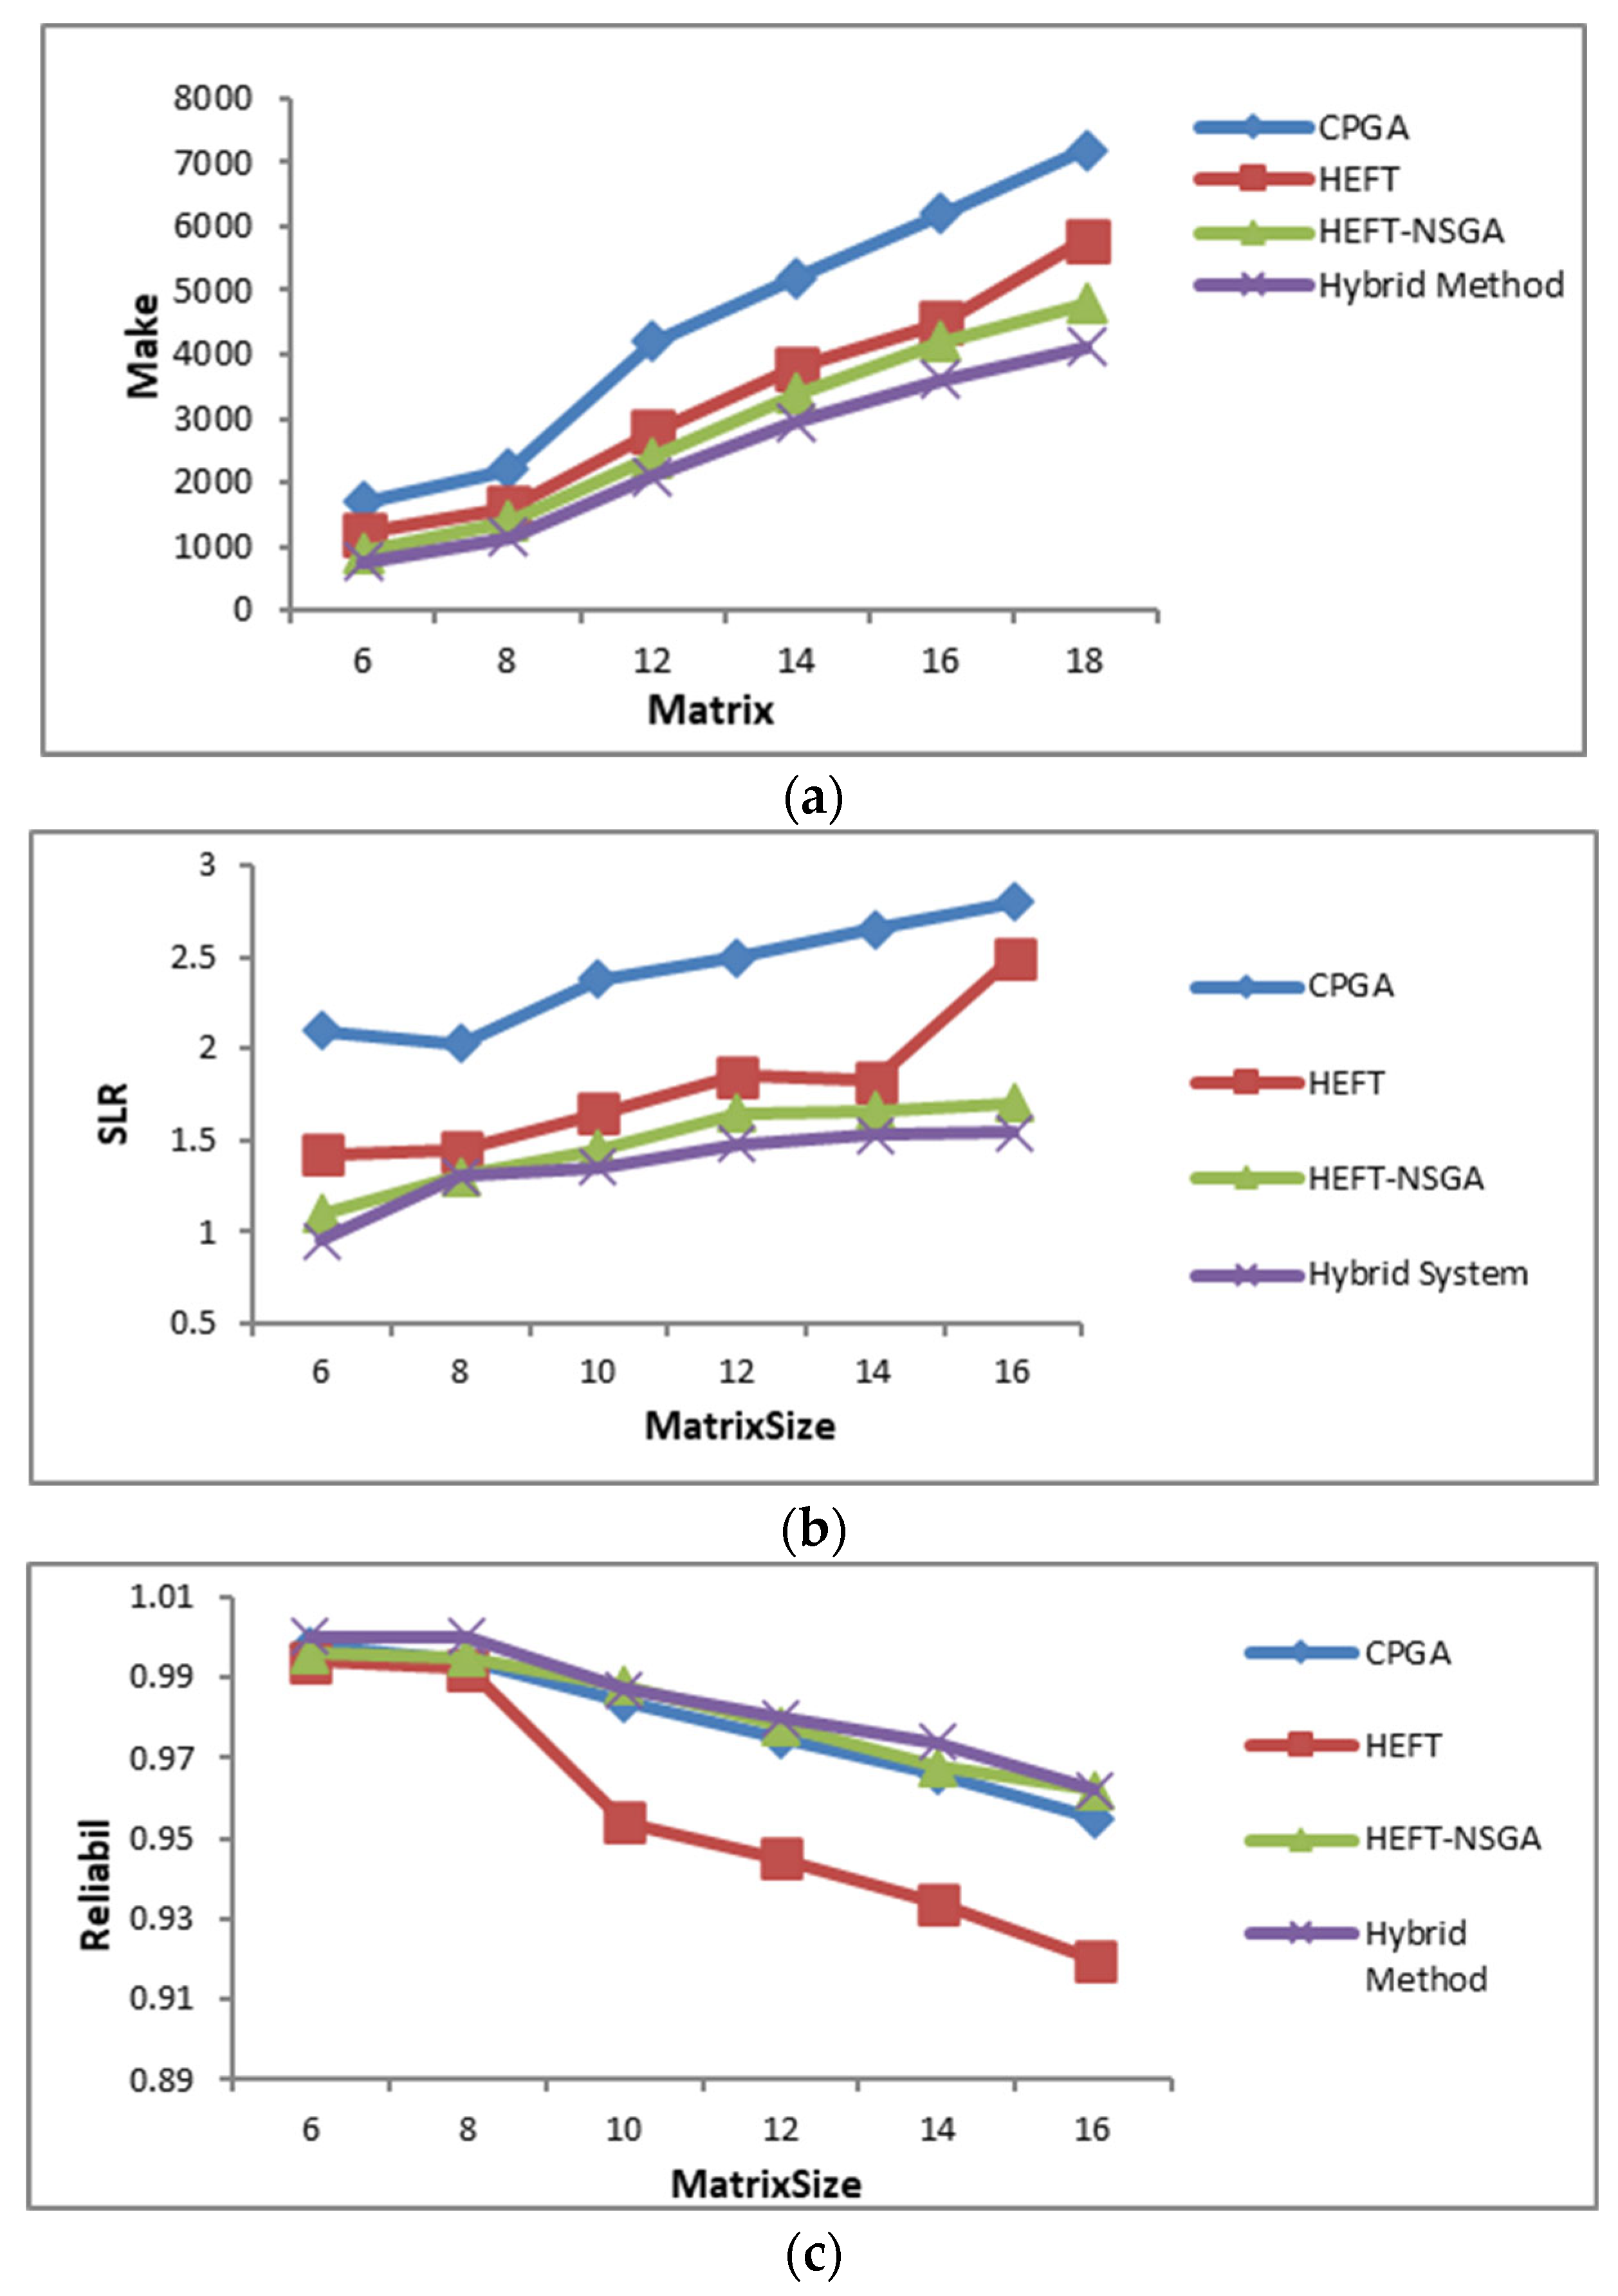
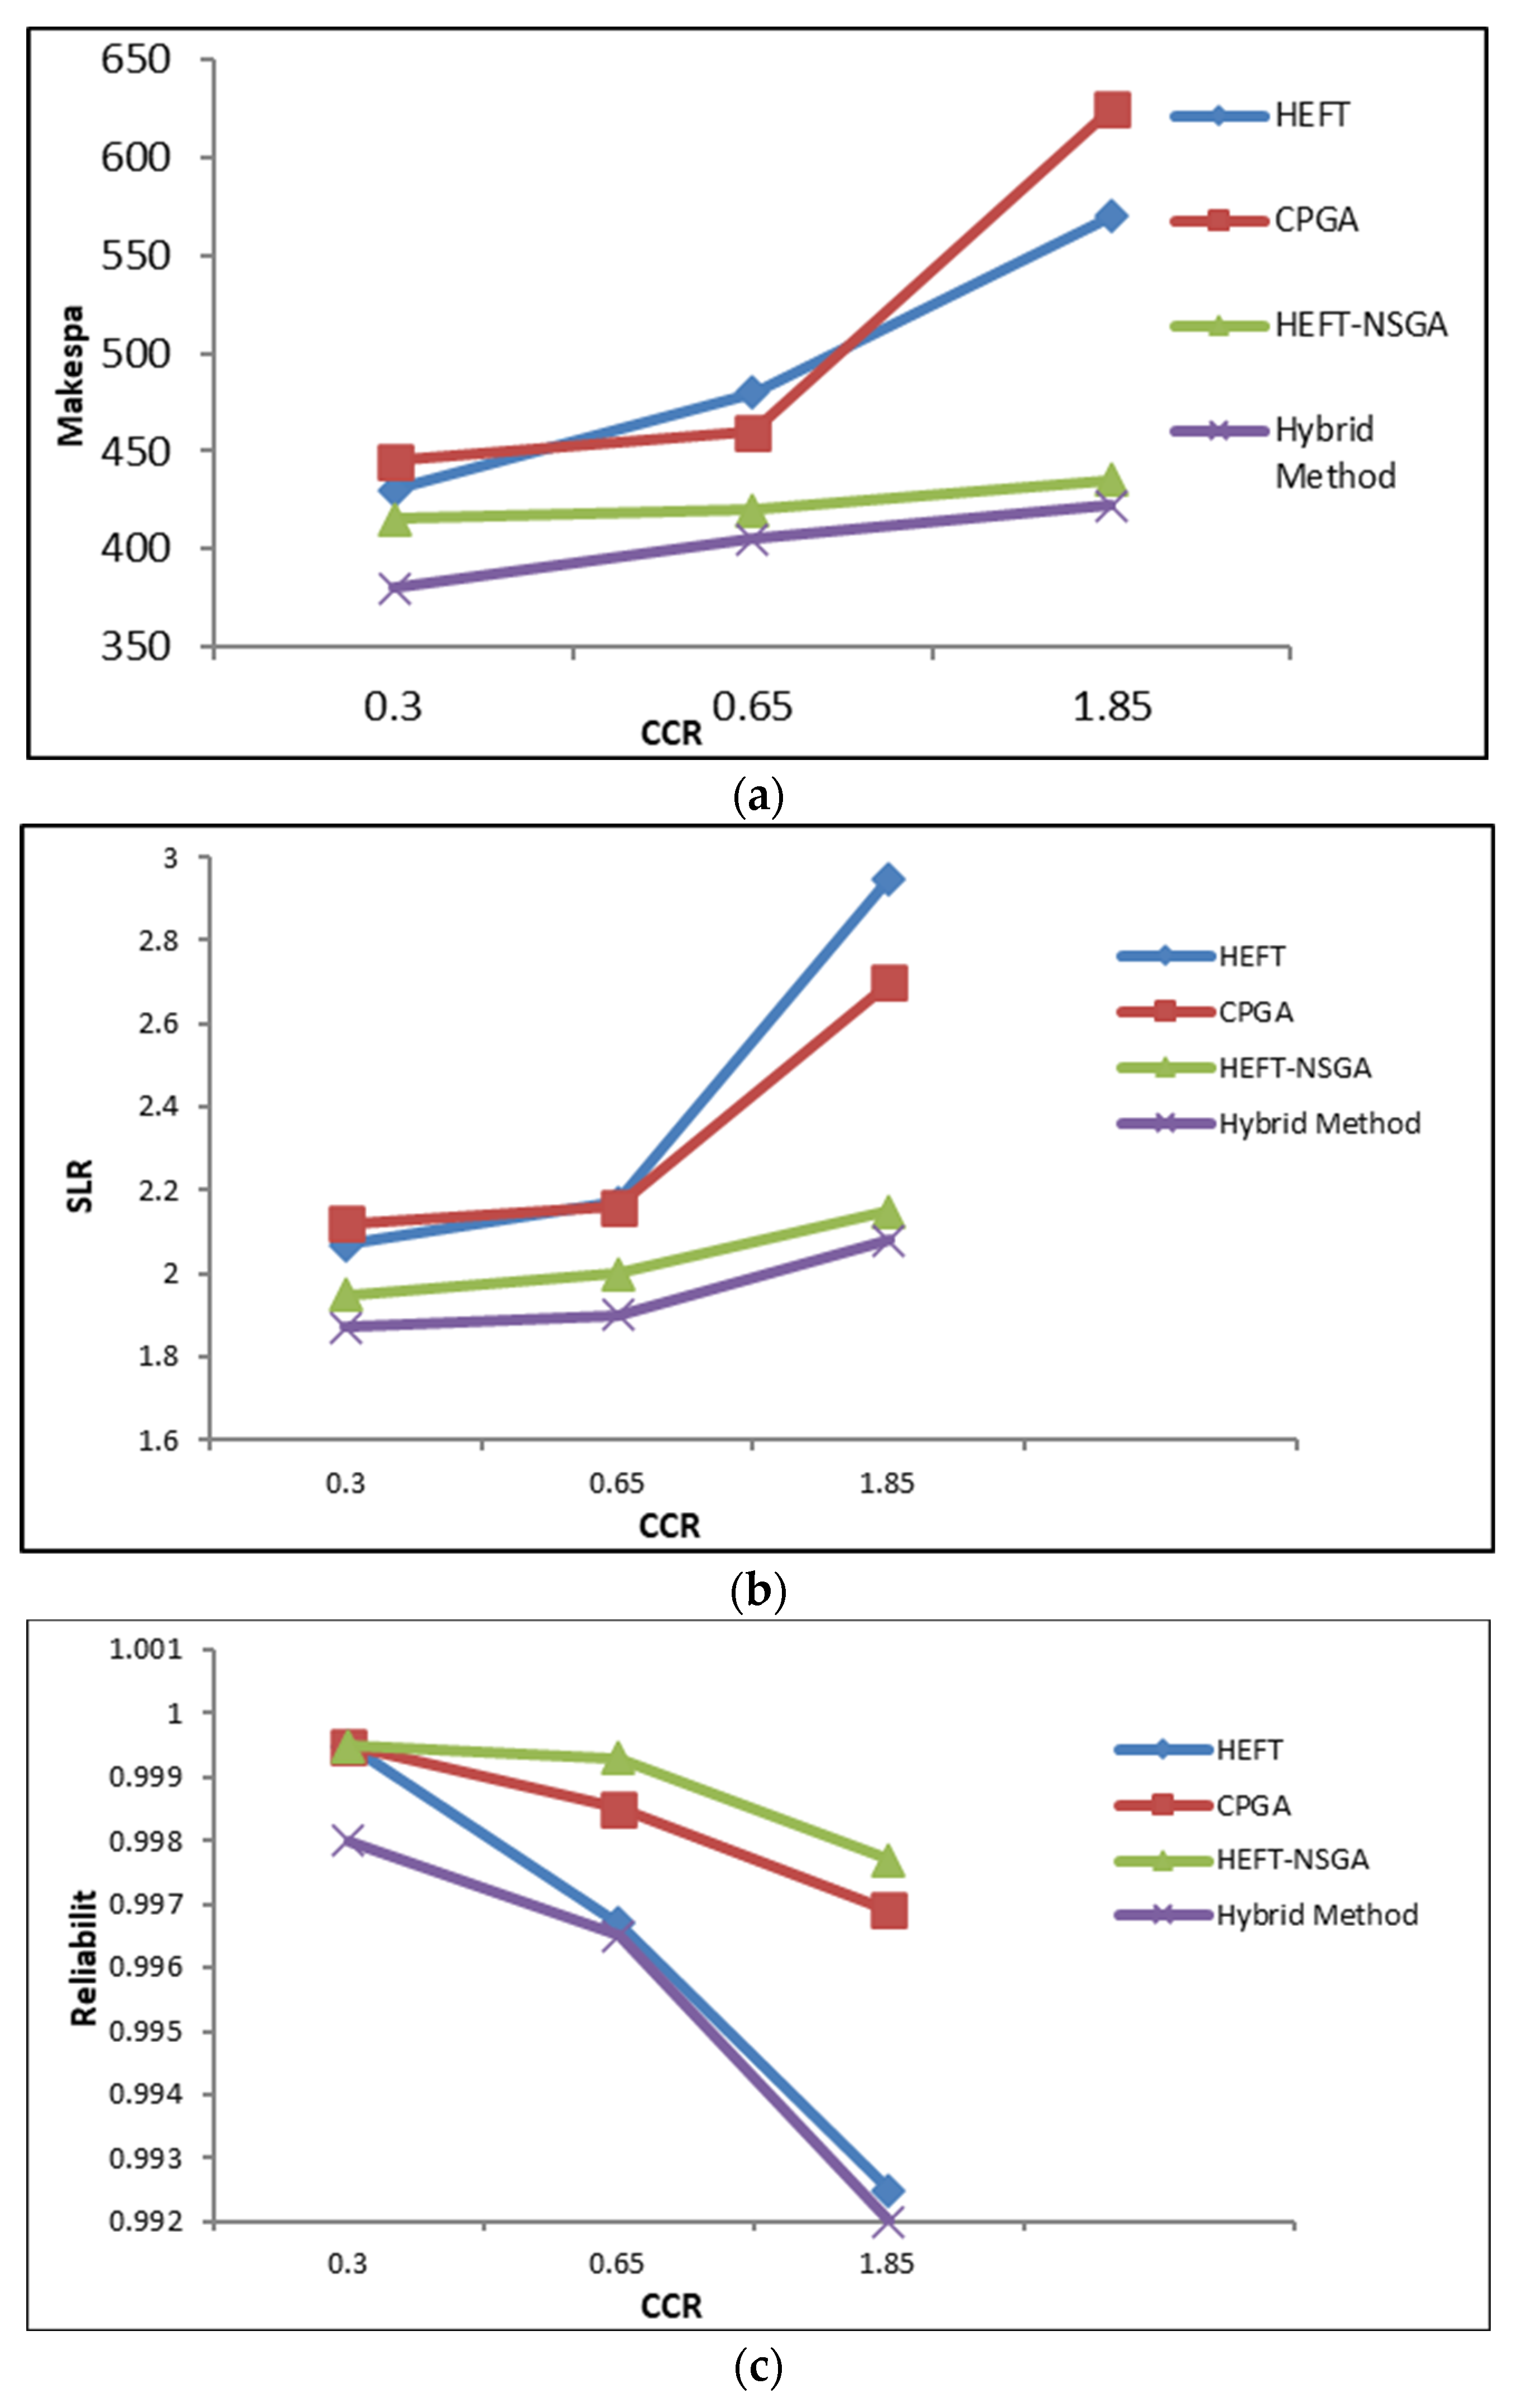
| Method Title | Single-Objective Algorithm (Applying Weighted-Sum) | Multi-Objective Algorithm | Bi-Objective TGS | Three-Objective TSG | Reference Number |
|---|---|---|---|---|---|
| SGA | √ | ✗ | √ | ✗ | [15] |
| EP | √ | ✗ | √ | ✗ | [15] |
| Hybrid GA | √ | ✗ | √ | ✗ | [15] |
| EP | √ | ✗ | ✗ | √ | [12] |
| GA | √ | ✗ | ✗ | √ | [12] |
| MOGA | ✗ | √ | √ | √ | [14,31] |
| MOEP | ✗ | √ | √ | √ | [14,32] |
| HEFT | √ | ✗ | √ | √ | [17,34] |
| CPGA | √ | ✗ | √ | √ | [17,35] |
| HEFT-NSGA | ✗ | √ | √ | √ | [17] |
| MFA | ✗ | √ | ✗ | √ | [11] |
| FA | √ | ✗ | √ | ✗ | [13] |
| MGA | √ | ✗ | √ | ✗ | [42] |
| BGA | √ | ✗ | √ | ✗ | [41] |
| MOO+Local Search | ✗ | √ | √ | ✗ | [15] |
| Ensemble System | ✗ | √ | √ | √ | [8] |
| NSGA-II-WA | ✗ | √ | √ | √ | [43] |
| VAEA | ✗ | √ | √ | √ | [44] |
| RVEA | ✗ | √ | √ | √ | [46] |
| Algorithm | Parameter Values | ||||
|---|---|---|---|---|---|
| MODE | |Pop| | Scaling_Factor | #of Generations | PC | PM |
| 200 | 0.5 | 300 | 0.8 | 0.4 | |
| Objective | Method | CCR = 1 | CCR = 2 | CCR = 3 |
|---|---|---|---|---|
| Makespan | FA | 458 | 687 | 1144 |
| MGA | 591 | 1070 | 1426 | |
| BGA | 616 | 1103 | 1490 | |
| NSGA-II-WA | 433 | 841 | 1065 | |
| Ensemble System | 420 | 657 | 1069 | |
| Hybrid Method | 418 | 642 | 1055 | |
| Reliability index | FA | 9.45 | 7.4 | 15.48 |
| MGA | 13.17 | 15.93 | 23.54 | |
| BGA | 9.48 | 12.20 | 22.47 | |
| NSGA-II-WA | 10.56 | 8.30 | 16.66 | |
| Ensemble System | 8.29 | 6.76 | 14.83 | |
| Hybrid Method | 8.05 | 6.61 | 13.40 |
| CCR | Spacing | Hypervolume |
|---|---|---|
| 1 | 35.65 | 0.91823 |
| 2 | 28.90 | 0.883519 |
| 3 | 31.26 | 0.940621 |
| Method | R+ | R− | α | p Value |
|---|---|---|---|---|
| FA | 78 | 25 | 0.05 | 0.002364 |
| MGA | 62 | 18 | 0.01 | 0.000231 |
| BGA | 81 | 12 | 0.01 | 0.000843 |
| NSGA-II-WA | 71 | 25 | 0.01 | 0.091024 |
| Ensemble System | 61 | 28 | 0.05 | 0.115243 |
| Hybrid Method | 56 | 32 | 0.06 | 0.325524 |
| Objective | Method | Makespan | Reliability Index |
|---|---|---|---|
| Best Makespan | GA | 584 | 14.88 |
| EP | 594 | 15.77 | |
| HGA | 562 | 13.37 | |
| NSGA-II-WA | 511 | 11.23 | |
| Ensemble System | 471.23 | 8.85 | |
| Hybrid Method | 468.92 | 8.73 | |
| Best Reliability index | GA | 961 | 6.64 |
| EP | 964 | 7.19 | |
| HGA | 1243 | 4.35 | |
| NSGA-II-WA | 680.37 | 4.03 | |
| Ensemble System | 661.43 | 3.62 | |
| Hybrid Method | 648.25 | 3.62 |
| Method | R+ | R− | α | p-Value |
|---|---|---|---|---|
| GA | 62 | 19 | 0.035 | 0.002938 |
| EP | 49 | 28 | 0.042 | 0.007328 |
| HGA | 32 | 21 | 0.032 | 0.006401 |
| NSGA-II-WA | 41 | 32 | 0.041 | 0.008324 |
| Ensemble System | 44 | 29 | 0.052 | 0.019232 |
| Hybrid Method | 36 | 27 | 0.057 | 0.029351 |
| Objective | Method | Makespan | Reliability Index | Flow Time |
|---|---|---|---|---|
| Best Makespan | GA | 416 | 372.75 | 7.18 |
| EP | 419 | 368.5 | 7.02 | |
| NSGA-II-WA | 412 | 325.43 | 6.85 | |
| Ensemble System | 404.10 | 303.59 | 5.18 | |
| Hybrid Method | 398.45 | 301.34 | 4.41 | |
| Best Reliability index | GA | 603 | 280.75 | 5.6 |
| EP | 632 | 292 | 5.6 | |
| NSGA-II-WA | 511.60 | 308.16 | 4.23 | |
| Ensemble System | 483.88 | 266.06 | 3.81 | |
| Hybrid Method | 461.02 | 242.16 | 3.11 | |
| Best Average FlowTime | GA | 810 | 281.25 | 3.07 |
| EP | 818 | 284.55 | 3.10 | |
| NSGA-II-WA | 659.63 | 308.41 | 3.49 | |
| Ensemble System | 502.76 | 276.34 | 2.83 | |
| Hybrid Method | 502.76 | 258.55 | 2.62 |
| Objective | Method | Makespan | Reliability Index | Flow Time |
|---|---|---|---|---|
| Best Makespan | NSGAII | 62 | 25 | 53 |
| MFA | 59 | 25 | 51 | |
| NSGA-II-WA | 54 | 25 | 51 | |
| Ensemble System | 52 | 21 | 53 | |
| Hybrid Method | 50 | 22 | 51 | |
| Best Reliability index | NSGAII | 65 | 24 | 49 |
| MFA | 61 | 24 | 50 | |
| NSGA-II-WA | 61 | 24 | 49 | |
| Ensemble System | 59 | 19 | 46 | |
| Hybrid Method | 60 | 18 | 47 | |
| Best Average FlowTime | NSGAII | 65 | 24 | 49 |
| MFA | 61 | 24 | 50 | |
| NSGA-II-WA | 59 | 24 | 47 | |
| Ensemble System | 59 | 21 | 43 | |
| Hybrid Method | 58 | 21 | 41 |
Disclaimer/Publisher’s Note: The statements, opinions and data contained in all publications are solely those of the individual author(s) and contributor(s) and not of MDPI and/or the editor(s). MDPI and/or the editor(s) disclaim responsibility for any injury to people or property resulting from any ideas, methods, instructions or products referred to in the content. |
© 2023 by the authors. Licensee MDPI, Basel, Switzerland. This article is an open access article distributed under the terms and conditions of the Creative Commons Attribution (CC BY) license (https://creativecommons.org/licenses/by/4.0/).
Share and Cite
Lotfi, N.; Ghadiri Nejad, M. A New Hybrid Algorithm Based on Improved MODE and PF Neighborhood Search for Scheduling Task Graphs in Heterogeneous Distributed Systems. Appl. Sci. 2023, 13, 8537. https://doi.org/10.3390/app13148537
Lotfi N, Ghadiri Nejad M. A New Hybrid Algorithm Based on Improved MODE and PF Neighborhood Search for Scheduling Task Graphs in Heterogeneous Distributed Systems. Applied Sciences. 2023; 13(14):8537. https://doi.org/10.3390/app13148537
Chicago/Turabian StyleLotfi, Nasser, and Mazyar Ghadiri Nejad. 2023. "A New Hybrid Algorithm Based on Improved MODE and PF Neighborhood Search for Scheduling Task Graphs in Heterogeneous Distributed Systems" Applied Sciences 13, no. 14: 8537. https://doi.org/10.3390/app13148537
APA StyleLotfi, N., & Ghadiri Nejad, M. (2023). A New Hybrid Algorithm Based on Improved MODE and PF Neighborhood Search for Scheduling Task Graphs in Heterogeneous Distributed Systems. Applied Sciences, 13(14), 8537. https://doi.org/10.3390/app13148537


