Abstract
A novel multifactor algorithm is developed with the aim of estimating GHG emissions in the EU countries and forecasting different future scenarios. This is created starting from (1) GDP, (2) population and (3) renewable energy share (RES). The determination coefficient (R2) of the multiple regression adopted reaches a value of 0.96; thus, only 4% of the GHG variation cannot be explained by the combination of the three variables. Germany is removed from the model after analysing the statistical outliers, as it presents an unusual behaviour within the European context. Also, France, Italy and Ireland are removed in the forecast analysis since they are characterised by corrected weighting values above the threshold value of the algorithm (0.156). The results show that GHG emissions decrease 14% in a low-growth-rate scenario, increase 24% in an average-growth scenario and increase 104% in a high-growth-rate scenario. Countries that improve the most are the ones that are currently underdeveloped in RES and are expected to decrease their population in the future (Croatia, Latvia, Cyprus and Greece). Other countries currently well positioned but with expected population growth (Sweden, Luxemburg and Denmark) or with expected intense GDP growth (Estonia and Malta) may lack decarbonisation levers. Therefore, policy makers should introduce additional subsidy schemes and tax exemptions in both developed and less developed countries to meet EU decarbonisation targets.
1. Introduction
Water vapour, carbon dioxide, methane, nitrous oxide and ozone are active gases naturally present in the Earth’s atmosphere. They are commonly known as greenhouse gases (GHGs) because they let most of the incoming solar radiation heat the Earth’s surface while they prevent some of the emitted thermal infrared (IR) radiation from escaping into space, thereby trapping some of the surface heat energy. As a result, the average surface temperature of the Earth’s air is about 30 °C higher than it would be without the absorption and reradiation of infrared energy by the atmosphere [1].
In addition to global warming, a paper published by Santana et al. [2] shows that polluting emissions such as particulate matter, ozone, carbon monoxide, sulphur dioxide and nitrogen dioxide caused by human activity increase the amount of hospitalisations due to respiratory diseases.
Over geological timescales, greenhouse gas concentrations have fluctuated cyclically. These fluctuations are caused by unclear mechanisms; however, Earth’s temperature fluctuates between ice ages and warmer interglacial conditions [3]. In recent decades, concentrations of greenhouse gases in the atmosphere have changed rapidly due to human activities. In particular, the amount of carbon dioxide (CO2) has almost doubled since preindustrial times (from about 270 molecules of CO2 per million molecules of air in 1850 to 420 parts per million today) [4]. Human-induced warming reached 1 °C above preindustrial levels in 2017 and will reach 1.5 °C by 2040 if the current rate of warming (0.2 °C per decade) continues [5].
Global CO2 emissions hit a record high of 37 billion metric tons in 2019 [6]. In 2020, restrictions imposed by the COVID-19 pandemic caused a 5% drop, but, as lockdowns eased, global CO2 emissions rebounded again to 37 billion metric tons in 2021 [6]. Since the Industrial Revolution, global emissions have predominantly come from Europe and the United States [7]. However, from the second half of the 20th century, there has been a significant increase in emissions from the rest of the world: currently, China alone is responsible for almost a third of global emissions [7]. At the same time, 2.73 billion metric tons of CO2 were released into the atmosphere in the European Union in 2021, which is significantly lower than the peak in 1979 (3.99 billion metric tons) [8]. As of 2021, the main emitter is Germany, mainly due to its energy mix based on coal, whose combustion produces 50% more CO2 than natural gas [8].
The first legally binding climate treaty was adopted in Kyoto in 1997 and entered into force in 2005. It committed industrialised countries to reduce their emissions to 5% below 1990 levels, but it did not compel developing countries like China or India. The 2015 Paris Agreement committed all countries to set emissions reduction targets to prevent the global average temperature from rising 2 °C above preindustrial levels and to continue efforts to keep it below 1.5 °C. Global net-zero emissions, or carbon neutrality (i.e., when the amount of GHGs emitted equals the amount captured from the atmosphere), is expected to be met in the second half of this century [9].
In 2018, as part of the “Clean energy for all Europeans package”, the European Commission (EC) agreed to update the efficiency target of at least 32.5% relative to the 2007 modelling projections for 2030 [10]. With the 2021′s European Green Deal, the EC also set a target to reduce GHG emissions by 55% from 1990 levels by 2030 (Fit For 55), aiming to be carbon neutral by 2050 [11]. This follows the EU’s 2020 target of a 20% reduction in emissions compared to 1990 and a 20% share of renewable energy in gross energy consumption. Some member states (MSs), such as Austria and Germany, have transposed the directive with more ambitious net-zero targets by 2040 and 2045, respectively.
While a study published by Santana [12] states that the new energy trends are not likely to improve air quality and human health, currently 73% of global GHG emissions come from energy production [7], and the increase in the renewable share is directly related to the long-term perspective of economic growth in industrialised countries [13].
In 2005, tradable green certificate schemes and carbon pricing mechanisms were introduced in the EU with the Emissions Trading System (ETS). They were driven by coal and gas prices from 2005 to 2007; by electricity prices from 2008 to 2012 [14]; and by a focus on auctioning rather than free allocation from 2013 to 2020 [15]; from 2021 to 2030, the focus is on sectors most at risk of relocating their production outside of the EU [16]. In December 2022, the Council and the European Parliament implemented the Carbon Border Adjustment Mechanism (CBAM) to prevent the risk of carbon leakage, which occurs when companies move their carbon-intensive production outside the EU, where less stringent climate policies prevail, or when EU products are replaced by more carbon-intensive imports [17]. Since 2021, emissions-regulated carbon pricing has increased exponentially and has reached the estimated threshold (between EUR 40 and EUR 80 per tonne) needed to meet the Paris target of a temperature increase “well below 2 °C” [18].
Currently, various organisations such as the Global Reporting Initiative (GRI), the Carbon Disclosure Project (CDP) and the Science Based Targets initiative (SBTi) help companies and other public or private entities to disclose their environmental impacts through detailed programmes. In fact, carbon footprint accounting and disclosure is the first step required to set emission reduction targets, plan a decarbonisation pathway and implement strategies in line with the Paris Agreement goals. Thousands of companies around the world have already committed to one of the above programmes [19].
However, it is not clear whether public and private initiatives will be sufficient to meet the targets, or whether the current trend in emissions cannot be reversed to achieve a net-zero target by the second half of the century.
Recently, Marotta et al. analysed various factors that influence GHGs emissions. For example, a study on the built environment [20] correlates GDP growth (economic dimension) with GHG emissions and renewable energy use (environmental dimension), based on the concept of the environmental Kuznets curve (EKC) hypothesis about the nonlinear relationship between economic growth and environmental degradation as shown in Figure 1.
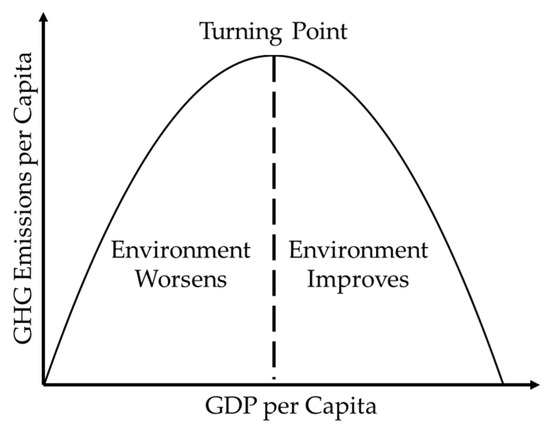
Figure 1.
U-patterned environmental Kuznets curve (EKC).
A study conducted by Vasylieva et al. [21] shows the long-term relationship for EU countries and Ukraine with all the indicators statistically significant at 1% and 5% levels. The findings prove that a 1% increase in the share of renewable energy over total energy consumption (RES) leads to a decrease in greenhouse gas emissions in the interval (0.166103, 0.220551). Another recent study published by Simionescu et al. [22] assesses the impact of economic growth on pollution in six EU MSs using the EKC and the renewable energy Kuznets curve (RKC). The results show that although the RES is part of the European Green Deal, more efforts are needed to achieve the Paris targets. On the other hand, economic progress is likely to be lower if the RES is promoted too quickly.
A study developed by Fakher and Inglesi-Lotz [23] reveals that the RES significantly improves overall environmental quality (EQ), while consumption of nonrenewable energy contributes to environmental degradation (ED). The findings show that in OECD countries, a 1% increase in RES increases EQ in a range between 0.012% and 0.018% and that a 1% increase in economic growth decreases EQ in a range between 0.103% and 0.143%. A further study conducted by Leitão and Lorente [24] highlights how the RES correlates negatively with CO2 emissions in the European Union (EU-28). A 1% increase in RES is associated with a reduction in CO2 emissions between −0.128% and −0.197%. These results support the assumptions of Directive 2009/28/EC and the Paris Agreement.
The panel data random-effects regression model of another paper published by Busu [25] reveals that the RES has a positive impact on economic growth within the EU-28, with biomass having the largest impact on economic growth. A 1% increase in biomass primary production would affect economic growth by 0.15%. Since R-squared is 0.2456, the econometric analysis shows that 24.56% of the variance of economic growth (dependent variable) is determined by RES (independent variable), and 75.46% of the variance of the endogenous variable is still determined by other factors.
Previous research developed by Bölük and Mert [26] from a panel model for the EU-16 confirms that GHG emissions and GDP have a U-shaped relationship and highlights that regulations in the EU have not really improved efforts to reduce emissions. Policy measures should be decoupled from economic growth and implemented immediately. The model with a significance level of 0.05 shows that the RES halves GHG emissions compared to fossil fuels.
Per capita environmental footprint and CO2 emissions are considered in another paper published by Altıntaş and Kassouri [27] that evaluates the EKC hypothesis with a data set of 14 EU countries. Three statistical models are adopted, and the findings at a 1% significance show that the U-shaped EKC perfectly describes the relationship between CO2 emissions and growth in Europe. Sound policies are required to accelerate the transition to RES and to reduce the environmental footprint. One study developed by Rehman and Rehman [28] models the nexus between population growth and CO2 emissions in Asia, where 60% of the world’s population lives. The degree of proximity between the two curves shows values between 0.7299 and 0.9208, underlining the relationship and importance of CO2 emissions and population growth.
All the studies mentioned emphasise the solid relationship between economic growth, GHG emissions and RES during the last decades and unanimously ask for stronger and more targeted policies adoption. However, none of them uses the data to estimate different future scenarios, which is the ultimate objective of this paper. In fact, this study aims to forecast GHG emissions in the coming decades at the country or regional level by means of a multifactor model based on national statistical data of (1) GDP, (2) population and (3) RES.
2. Materials and Methods
The method unfolds in the following stages:
- Independent variables and data collection.
- Relationship of independent variables with GHGs.
- Algorithm development and validation.
- Future forecast scenarios.
2.1. Independent Variables and Data Collection
Eurostat provides data of GHG emissions generated in each MS since 2000. However, the EU has undergone a great evolution in these two decades due to legislative changes aimed at mitigating the effects of climate change. Therefore, to develop a more accurate and updated predictive model, only the decade between 2010 and 2020 is adopted. In addition, Eurostat does not offer public data in years near to 2000 in some of the independent variables needed to develop the algorithm.
The analysis considers data taken from the Eurostat database for 27 EU countries (EU-27): Belgium, Bulgaria, Czechia, Denmark, Germany, Estonia, Ireland, Greece, Spain, France, Croatia, Italy, Cyprus, Latvia, Lithuania, Luxembourg, Hungary, Malta, Netherlands, Austria, Poland, Portugal, Romania, Slovenia, Slovakia, Finland and Sweden. Every country is expected, in addition to the Paris Agreement, to transpose the European Directives, with a 2030 target to reduce GHG emissions by 55% compared to 1990 (Fit For 55), and ultimately be carbon neutral by 2050. This, together with comparable growing economies and similar population densities of the EU member states, guarantees a solid and consistent analysis.
During the preliminary analysis required for the development of the algorithm, several metrics have been analysed: gross domestic product (GDP), country surface area, population, construction activity, energy consumption, renewable energy share (RES), employment in construction, number of green buildings certifications, GHG emissions and heating degree days. However, the variables that appear to influence the most GHG emissions are three, as highlighted in the literature review [20,21,22,23,24,25,26,27,28]: GDP, population and RES. For this, data of GDP (in million euros), population (in million people) and RES (in % of renewables over total energy use) of each of the analysed years are collected from Eurostat. If polluting gas emissions like particulate matter were considered, a methodology similar to the one followed by Vormittag et al. [29] would have been adopted.
Moreover, the Pearson correlation between the GHG emissions and the three factors is analysed, and results are presented in Table 1.

Table 1.
Pearson’s correlation between GHG emissions and the independent variables.
The findings indicate a moderate correlation (≥0.40) of the variable RES, while GDP and population obtained a higher correlation with the GHG emissions (>0.95). As a result, the correlation in the three independent variables analysed is considered significant (sig. < 0.05) with 95% confidence, and therefore the three independent variables are used in the algorithm.
2.2. Relationship of Independent Variables with GHGs
A correlation between the GHG emissions and each factor—GDP, population and RES—is explored for each country. Results are presented in XY graphs showing the relation between the GHG emissions and each variable, as well as the trend of the data relation.
2.3. Algorithm Development and Validation
The methodology developed in a paper published by Villoria Sáez et al. [30] consisting on four phases is used to develop the algorithm.
First, the independent variables (i.e., GDP “a”, population “b” and RES “c”) are weighted on a scale between 0 and 1, using Equation (1), so they can be compared on the same value scale. In total, 108 weighting values are obtained. Subsequently, the relation between the calculated weighting values () and the amount of GHGs released into the atmosphere is explored.
where:
- is the analysed variable (GDP “a”, population “b” or RES “c”);
- is the analysed MS (n = 1, 2, 3, 4, 5, 6 … 27);
- is the value of the variable for the analysed MS “”;
- is the weighting value of each variable for the analysed MS ”.
Second, SPSS 28 statistical software is used for a multiple regression analysis (Equation (2)) to obtain the coefficients—using the data obtained from the twenty-seven MSs—in order to establish the significance that each independent variable will have in the final model.
where:
- is the amount of GHG emissions estimated for the MS “”;
- is the coefficient that represents how changes in each of the independent variables “” () influence the dependent variable “”;
- is the residual error, i.e., difference between the observed values () and those estimated by the model of the dependent variable () (Equation (3)).
Third, Equation (4) is used to merge the three weighting values () into one single coefficient “Corrected Weighting Value” (FPc).
where:
- is the corrected weighting value for the MS “”.
Fourth, a statistical analysis to identify outliers in the data set has been performed. The statistical z-score, as a statistical measure that indicates the deviation of a particular observation from the standard deviation, is estimated. For this, the z-score is calculated in all the selected variables: dependent (GHG emissions) and independent (GDP, population and RES). Thanks to the statistical z-score, it is identified that Germany is the only member state that presents an unusual behaviour (outlier) within the European context, in three of the four variables analysed (GHG emissions, GDP and population), so it is discarded in the successive steps. In fact, Germany is the largest economy of the European Union and its industry is highly technological, with an emphasis on the metallurgy and chemistry sectors [31]. However, as a result of 2011’s decision to shut down all nuclear power plants by 2022, coal is still responsible for 37% of Germany’s electricity production [32], in contrast with the Integrated Energy and Climate Programme (Integrierte Energie-und Klimaprogramm, 2007), which required the reduction of emissions by 40% in 2020 [33]. For this reason, CO2 emissions in the country had a growth rate of 0.1% in the period 2007–2017, opposite to the EU’s trend [34].
Fifth, a polynomial regression using SPSS statistical software is performed to analyse the correlation between the corrected weighting factor of each MS (FPci) and GHG emissions. The adjustment curve closest to the data is obtained, and its efficiency is tested with a confidence level of 95% (p < 0.05). This algorithm allows us to estimate the amount of GHG emissions generated in a country once the corrected weighted factor is known. Finally, the deviations between the values obtained with the algorithm and those obtained with Eurostat values are analysed for 2010–2020.
2.4. Future Forecast Scenarios
The GHG emissions are estimated in a future scenario for the EU-26 MSs. For this, the growth or decrease in each dependent variable (GDP, population and RES) is obtained from the Eurostat database. The percentage growth rate of each variable from 2010 to 2020 for the three independent variables is calculated, and Table 2 shows the yearly minimum and maximum growth rates as well as the average of each EU MS.
Table 2.
Growth rates of each independent variable for the EU-26 MSs.
In the EU-26, from 2010 to 2020 the GDP had an average growth rate around 1.81%, reaching a minimum of −4.73% (2020) due to the pandemic restrictions and a maximum of 4.16% (2017). The average growth of the population is 0.14%, reaching a minimum of 0.03% (2019) and a maximum of 0.38% (2014). Similarly, the average growth of the RES is around 3.39%, reaching a minimum of 0.89% (2016) and a maximum of 5.69% (2012). These growth rates (Table 2) are used to calculate the values for the three independent variables until 2050, considering three scenarios: low, average and high growth rate.
Then, the proposed algorithm is used to obtain the estimated amount of GHG emissions generated in the three different scenarios for each year and EU MS. First, yearly FPc values of each MS are obtained following Equations (1)–(4), and countries with negative FPc values or values above 0.156 are discarded from the study as they exceed the threshold values of the algorithm. Finally, GHG emissions generation ratios of the remaining countries are obtained with Equations (5)–(9). The future trend of GHG emissions generation of the twenty-six countries is analysed for the three scenarios.
3. Results
Figure 2 shows the correlation between the amount of GHG emissions generation and each factor. It can be seen that GDP and population have a stronger relation to the amount of GHG emissions generated than renewable share (RES).
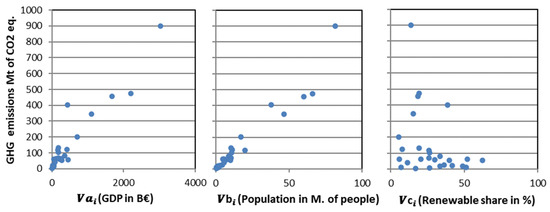
Figure 2.
Amount of GHG emissions generated in relation to independent variables: GDP “a”, population “b” and RES “c”. Mean values between years 2010 and 2020.
Table 3 shows the average amount of GHG emissions, GDP (), population () and RES () reported by each EU MS to Eurostat from 2010 to 2020.
Table 3.
Mean values of the data collected from Eurostat between 2010 and 2020.
3.1. Algorithm and Validation
The equations presented in the previous section are now adopted to determine the algorithm needed to obtain the estimated amount of GHG emissions generated in the three different scenarios for each year and EU MS.
3.1.1. Weighted Values
Table 4 shows the weighted values of the three independent variables, calculated using Equation (1).
Table 4.
Weighting values of each member state.
Based on the results obtained in Table 4, the following equations can be used to calculate the weighted value () of any other country (i), once the GDP (Equation (5)), population (Equation (6)) and RES (Equation (7)) are known.
where:
- is the GDP in billion euros of the additional country ();
- is the population in millions of people of the additional country ();
- is the RES in percentage of the additional country ();
- is the weighting factor corresponding to the GDP of the additional country ();
- is the weighting factor corresponding to the population of the additional country ();
- is the weighting factor corresponding to the RES of the additional country ();
- is the weighting value of each variable for the analysed MS ”.
3.1.2. Standardised Coefficients
Results of the multiple regression model show a strong correlation between the quantities of GHG emissions and the independent variables. The determination coefficient (R2) reaches a value of 0.98; only a very small percentage of the GHG variation (2%) cannot be explained by the combination of the three variables, GDP, population and RES. On the other hand, the obtained p-values for the estimation of the GHG emissions generation are less than 0.05. This confirms that, with a confidence level of 95%, the variation explained by the model is not due to chance. Ultimately, these values are sufficiently high to consider the influence of the variables in the estimation of GHG emissions generation proven.
The standardised coefficients allow us to establish the relative significance of the input variables (independent variables) on the output variable (dependent variable). The standardised coefficients are as follows: = 0.250 (GDP); = 0.738 (population) and = –0.001 (RES). The variables “GDP” and “Population” present greater influence (greater standardised coefficients) than the other independent variable (RES). However, the estimation model shows a greater degree of accuracy when the “RES” variable is included instead of including only GDP and population.
3.1.3. Corrected Weighted Factors (FPc)
The standardised coefficients are used to calculate the corrected weighted factors (FPc), which are significant to each variable in the final equation of GHG emissions estimation (Equation (8)). In short, the corrected weighting factor of any other country can be calculated with the weighted values once the GDP, population and RES in the country are given.
where:
- is the corrected weighting factor.
Therefore, MSs can obtain their weighting factors by using Equations (5)–(7) once the three independent variables (GDP, population and RES) are known. Further, MSs can then estimate GHG emissions by using Equations (8) and (9).
3.1.4. Final Algorithm and Validation
The correlation between the amount of GHG emissions generated and the corrected weighted factor (FPc) of the MS is shown in Figure 3. Thus, the final equation for GHG emissions estimation (Equation (9)) is established, aiming to estimate the amount of GHG emissions generated () in an MS (i), once the corrected weighted factor (FPc) of the MS is calculated (Equation (9)):
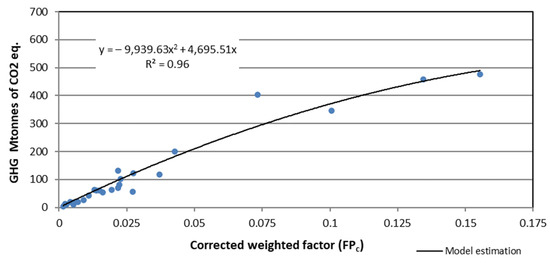
Figure 3.
Correlation between the corrected weighting factor (FPc) and the average amount of GHG emissions generation reported to Eurostat in 2010–2020 for each analysed MS.
The model shows a strong accuracy in predictions with a high R2 value of 0.96. Therefore, the developed estimation model can be effective in estimating GHG emissions in an EU MS and could be considered as a cost-effective approach for planning corrective measures. The results obtained with the equation show a mean deviation of around 22% compared to the average amount of GHG emissions generation reported to Eurostat in 2010–2020.
The maximum deviation is found in Malta, where it reached 59%. If the countries (Sweden, Poland, Malta, Latvia and Croatia) with higher deviations (>35%) were removed from the model, the accuracy would reach 15%. However, in that scenario, there are some limitations that must be taken into account, and the countries that do not meet these values fixed in the following ratios have to be excluded from the model: GHG/population ratio below 6.19; GDP/RES ratio below 601.69 and GHG/population ratio above 920.68.
Finally, the amounts estimated with the multifactor equation are compared with the data reported to Eurostat for each single year from 2010 to 2020. For this, the relation between the amount of GHG emissions generation reported to Eurostat by each EU MS and the amount estimated with the multifactor equation are shown in Figure 4.
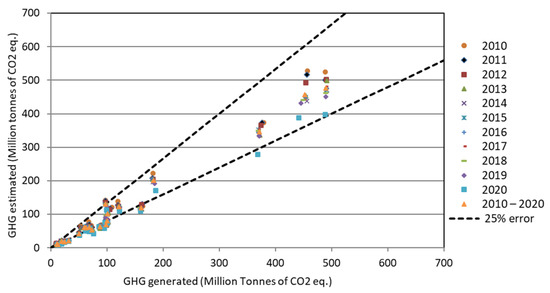
Figure 4.
GHGs estimated with the proposed equation vs. the amount of GHG emissions reported to Eurostat.
Excluding the countries mentioned before (Sweden, Poland, Malta, Latvia and Croatia), the highest mean deviation is found for the year 2020 (25%) compared to other data for years 2010 (19%); 2011 (16%); 2012 (17%); 2013 (18%); 2014 (17%); 2015 (16%); 2016 (15%); 2017 (15%); 2018 (15%) and 2019 (18%). This is mainly due the lockdowns that in 2020 drastically decreased human activities and overall GHG emissions [35].
The proposed model shown in Figure 3 has been developed using the data available in the Eurostat database for the dependent and independent variables during the last ten years. The values estimated with the multifactor algorithm have been compared against annual data (2010, 2011, etc.) to ensure robustness and accuracy of the model in case of changes of the adjustment data. The validation results confirm the solidity of the model against sensitivity to changes in data setting (overfitting), as well as accuracy in avoiding systematic errors (underfitting).
3.2. Future Forecast of GHG Emissions
GHG emissions generation ratios are obtained for all MSs analysed following Equations (1)–(9). However, France, Ireland and Italy are removed because they reach FPc values above 0.156 in one or more years (2023–2050) in one of the scenarios (high, average or low) analysed. This reflects the level of significance for Germany, France, Italy and Ireland identified in a study published by González-Sánchez and Martín-Ortega [36] that analyses GDP and RES among other variables to understand GHG emissions trends in the Eurozone.
Figure 5 shows the projection of GHG emissions obtained for the twenty-three EU MSs (without Germany, France, Ireland and Italy) until 2050 with a focus on the best and worst performers in each of the three scenarios (low, average and high growth rate).
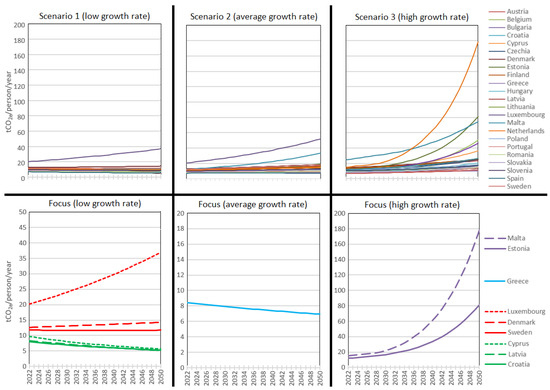
Figure 5.
Greenhouse gas projection until 2050 for the 23 EU MSs and focus on best and worst performers in every scenario (low growth rate, average growth rate and high growth rate). Values are express in tonnes of CO2 equivalent per person per year.
The model provides reasonable results that can be considered valid until 2050. Figures from scenario 1 (low growth rate) show that GHG emissions are yearly reduced in most of the countries, except in Luxemburg, Denmark and Sweden where there is a small growth due to an upward trend in the last ten years. This can be explained by the fact that these countries are already performing diligently, and may lack additional decarbonisation levers while their population and human activity (GDP) continue to grow as forecasted.
As regards Sweden, in 2012, this country already achieved the target of 50% RES that was established by the government for 2020 [37]. Today, more than 40% of electricity production in Sweden is based on hydroelectric power [32], 40% on nuclear power and more than 10% on wind power, a fact that explains the extremely low emission rate in this country [38]. In addition, the society and industry reduced at minimum the energy consumption [39], and families mainly use biofuels to heat their homes [32]. A similar picture characterises Denmark, where RES dominates the energy mix [40], with 43% of the electricity coming from wind farms after investments in the late 1970s that led to the gradual closure of thermal power plants [32].
On the contrary, the highest decreases in GHG emissions are found for Croatia (34%), Latvia (38%) and Cyprus (41%), all characterised by a common trend in scenario 1: population slightly decreasing with the consequent reduction of activities that release GHGs into the air. However, in the last decades, these countries have not decreased their emissions yet [41], mainly because they have a very low degree of competition in the electrical market, meaning a market share of the largest generator in the electricity market above 60% in 2019 [42]. This means that currently, electricity has a high cost and there is less stimulus in phasing out fossil fuels.
In general, an average growth rate in the next ten years (scenario 2) can result in an increase in GHG emissions for all MSs except Greece. This result can be explained by the reduction of the Greek GDP (−2.90%) and consequent limited human activities, which have a consistent weight in the algorithm (25%) despite the other variables (population and RES) increases. Today, Greece still relies heavily on coal and lignite, which are extremely detrimental to environment [43]. However the trend started to change in the last decade, when penetration of renewables (mostly from wind and photovoltaics) was triggered from the phase-out of lignite-fired power generation targeted by the government by 2028 [44] and simultaneous feed-in tariff-supporting schemes in compliance with European Directives [45]. With respect to this, a survey undertaken by Kosmopoulos et al. [46] shows that financial payback is as important as simple paperwork for citizens.
The model also shows a high growing rate projection (scenario 3) that highlights a strong increase in GHG emissions for all the EU MSs, in particular Estonia (585%) and Malta (1078%). These projections are due to uncontrolled GDP growth (>13%), which could be harmful for the environment without the support of strong policies, together with low values of RES. Estonia has opted only for feed-in tariff models to enhance RES adoption, but the results are disappointing from both private and commercial companies [47]. Malta, the worst-performing country in the EU in relation to RES [48], struggles with environmental boundaries that discourage the adoption of solar and wind power generation plants [49], even if some solutions are being developed [50]. Estonia and Malta are among the worst-performing countries also according to a paper published by Ligus and Peternek [51] that introduces the index of sustainable energy development (SEDAI) composed of 47 indicators connected to EU policies.
Figure 6 shows the average GHG emissions for the twenty-three EU MSs (without Germany, France, Italy and Ireland) for each year until 2050. Results show that GHG emissions generation increases in two scenarios, when the growing trend is high or kept as an average. In particular, the highest increase is achieved in scenario EU-23 max.—rising around 104% by 2050 compared to the year 2022. An average growth will result in a GHG emissions increase of around 24%, while a low growing rate can reduce the GHG emissions up to 14% compared to 2022.
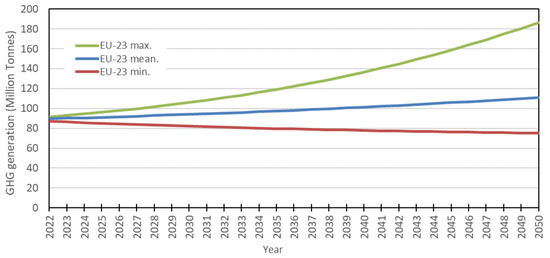
Figure 6.
Evolution of GHG emissions for the UE-23 until 2050.
4. Discussion and Conclusions
GHG concentrations on Earth have fluctuated cyclically over geological timescales, but they have been growing dramatically since the Industrial Revolution due to human activities. This study presents a new model for GHG estimation for EU member states (MSs), considering three independent variables: GDP, population and renewable energy share (RES). None of the studies in the literature uses past data to forecast different GHG emissions scenarios in the coming decades at the country or regional levels. The corrected weighting factor (FPc) is determined for each MS once the values of the three independent variables are known, and the amount of GHGs released in the atmosphere is estimated by means of an equation presented in the Section 3.
The multifactor algorithm developed using the data from the EU MSs shows a strong correlation between the amounts of GHG emissions and the independent variables. The determination coefficient (R2) reaches a value of 0.96. In general, the proposed estimation model differs by 22% from the actual data reported by Eurostat. However, it could reach a higher accuracy (15%) if some threshold values (GHG/population ratio below 6.19; GDP/RES ratio below 601.69 and GHG/population ratio above 920.68) are taken into account and countries that do not meet these values are excluded. Therefore, the model developed in this article can be used by EU member states to know in advance the amount of GHGs generated and thus optimise and plan GHG management strategies.
Germany is removed because it reaches FPc values above 0.20 in scenario 3 starting from 2029. In the model, the country is characterised by a consistent deviation compared to the standard deviation of the other European countries, because the Integrated Energy and Climate Programme (Integrierte Energie-und Klimaprogramm, 2007), which set as a target the reduction of emissions by 40% in 2020 [33], was in opposition with the simultaneous shutdown of all nuclear power plants and the resulting higher dependence on coal for electricity production, which caused a constant increase in GHG emissions. The importance of sound policy was recognised, and in 2021 the German Bundestag passed the new Climate Protection Act, which established the national goal of climate neutrality by 2045. As a milestone towards the final goal, GHG emissions are to be reduced by at least 65% from 1990 levels by 2030.
The model’s future projection shows that GHG emissions in 2050 could vary significantly compared to 2022 across the EU-23 studied (Germany, France, Italy and Ireland are not included since they have corrected weighting values above the threshold value of 0.156); an increase of up to 104% in a high growth rate (scenario 3); an increase of up to 24% in an average growth rate (scenario 2); and a decrease of up to 14% in a low growth rate (scenario 1).
The results of scenario 1 (low growth rate) show that GHG emissions decrease in most countries, except in Sweden, Luxemburg and Denmark where a small upward trend is observed. In fact, these countries have already reached high levels of renewable electricity generation thanks to the implementation of several initiatives. For instance, Sweden has introduced various incentives such as subsidy schemes, a quota system, special tax regulation mechanisms and tax exemptions in case RES is adopted [37]. To continue on the decarbonisation path, these three countries should explore additional levers to offset the impact of growing population and human activities, for example, by focusing on reducing overall energy demand or developing renewable power generation plans.
Scenario 1 also shows countries with a consistent decrease in GHG emissions, such as Croatia, Latvia and Cyprus, where population and related polluting activities are expected to decline. In all these countries, investments are being implemented to encourage the acquisition and use of RES plants; a feed-in tariff and a premium tariff are being introduced to promote on-site electricity generation, but due to suspicions of corruption, the feed-in tariff has been abolished as of January 2020 [37]. Other measures could be to increase competition in the electricity market, as in other EU countries, where the market share of the largest generator in the electricity market is below 50% [42].
The results of scenario 2 (average growth rate) show an increase in GHG emissions for all MSs except Greece. This result can be explained by the decrease in the GDP variable in Greece and the resulting limited human activities, which have a consistent weight in the algorithm (25%), although the other variables (population and RES) increase. The government has set a target to phase out lignite-fired power generation by 2028, which is stimulating investments in renewable energy and promoting sustainable development [44]. In addition, a large-scale campaign to install photovoltaic systems was launched, triggered by feed-in tariff schemes but followed by downward pricing policies. However, people are willing to proceed with the installation if they are reassured with a financial payback and simple paperwork. People are also less reluctant than in the past to build renewable energy parks across the country that may impact the natural environment [46].
The results of scenario 3 (high growth rate) show a strong increase in GHG emissions for all EU MSs, especially for Estonia and Malta, mainly due to a strong GDP growth (>13%) that is not supported by sound policies to reduce environmental impacts. Estonia has opted for feed-in tariff models only, which means that private and commercial companies can sell green electricity to their domestic energy markets, but this does not encourage the adoption of RES [47]. As for Malta, the deep waters around the coast hardly allow for conventional offshore wind energy, while onshore wind energy and ground-based photovoltaic parks are not compatible with the high population density and limited availability of open land [49]. One solution could be the implementation of offshore photovoltaics and wave energy converters (WECs), but policy makers are required to introduce more consistent support mechanisms such as grant programs to spread the practice [50].
Thus, the findings of this paper are clearly negative and show that current policies are not sufficient to achieve the EU target of a 55% reduction by 2030 and carbon neutrality by 2050. At the current pace, GHG emissions are projected to decrease only in the low-growth-rate scenario. If the decarbonisation targets set out in the European Agenda are to be met, robust and immediate action is needed.
Almost three-quarters of global GHG emissions come from energy production [7], thus the application of additional legislations concerning energy efficiency and renewable energy production is essential. The share of RES could be increased through measures to accelerate economic growth in less developed countries and the promotion of national initiatives in the form of feed-in tariffs, but also subsidy schemes, quota systems, specific tax regulatory mechanisms and tax exemptions along the lines of more developed countries such as Sweden. In parallel, the long-term perspective of economic growth in industrialised countries depends to a large extent on increased energy consumption from renewable sources [13].
Other support mechanisms that governments can put in place include tradable green certificate schemes and carbon pricing mechanisms. Following the lead of policy makers in the most developed countries (e.g., Sweden), which have implemented a carbon pricing mechanism since the 1990s, the EU introduced the Emissions Trading System (ETS) in 2005. The ETS was driven by coal and gas prices in the First Phase (2005–2007), electricity prices in the Second Phase (2008–2012) [14], a focus on auctioning rather than free allocation in the Third Phase (2013–2020) [15] and a focus on sectors most at risk of relocating their production outside of the EU in the Fourth Phase (2021–2030). Several low-carbon funding mechanisms will be established to support energy-intensive industrial and power sectors, such as the Innovation Fund and the Modernisation Fund [16].
Until 2018, emissions regulated by carbon pricing were covered by a price below EUR 10 per ton of CO2. However, the report of the High-Level Commission on Carbon Prices states that the price needed to meet the Paris target of a temperature increase “well below 2 °C” is between EUR 40 and EUR 80 per ton of CO2 by 2020 and between EUR 50 and EUR 100 per ton of CO2 by 2030. Fortunately, the price has increased exponentially since 2021 and was never below EUR 60 per ton of CO2 in 2022, which is in line with the Paris target [18].
However, with less stringent climate policies prevailing in many non-EU countries, the Council and the European Parliament reached a political agreement in December 2022 to implement the Carbon Border Adjustment Mechanism (CBAM) to prevent the risk of carbon leakage, which occurs when EU-based companies move their carbon-intensive production abroad, where less stringent climate policies prevail, or when EU products are replaced by more carbon-intensive imports. The CBAM promotes cleaner industrial production in non-EU countries and is aligned with the expiration of the allocation of free allowances to support the decarbonisation of EU industry. The CBAM will come into effect in October 2023 and will ensure that the carbon price for imports is equal to the carbon price for domestic production [17].
The results of this paper show that EU directives are not sufficient, and that each MS should introduce additional local measures. Adopting economic bonuses for countries that achieve relevant results compared to benchmarks may be a solution. These benefits could be additional means to invest in environmentally friendly practices. In contrast, countries that do not support the environmental transition, whose application procedures are too complicated or that are involved in corruption may be subject to economic sanctions. Also, the model would be improved by incorporating policies and other cultural strategies as variables of the model or developing new algorithms considering normalisation and new regressors.
The main limitation of this study is that the algorithm does not consider Germany, the largest GHG emitter in Europe [8], as it achieves FPc values above 0.20 in scenario 3 from 2029, and France, Italy and Ireland, as they have poor significance. Another limitation of this study concerns the availability of data which refer to the period from 2010 to 2020. In fact, some data are missing in the databases before 2010, and the data for the period after 2020 have not yet been published at the time of publication of the manuscript.
The impact of newly introduced national and EU measures could be investigated in future studies to adapt the proposed methodology and the accuracy of the algorithm to contribute to a better GHG estimation and to propose additional strategies for the European Union.
Author Contributions
Conceptualization, A.M., C.P.-A., A.R.S., P.V.S. and G.M.; data curation, A.M. and C.P.-A.; formal analysis, A.M., A.R.S. and P.V.S.; investigation, A.M., C.P.-A., A.R.S. and G.M.; methodology, C.P.-A. and P.V.S.; project administration, A.M.; supervision, C.P.-A. and A.R.S.; writing—original draft, A.M., C.P.-A. and P.V.S.; writing—review and editing, A.M. All authors have read and agreed to the published version of the manuscript.
Funding
This research received no external funding.
Institutional Review Board Statement
Not applicable.
Informed Consent Statement
Not applicable.
Data Availability Statement
This study did not report any additional data.
Conflicts of Interest
The authors declare no conflict of interest.
References
- Ledley, T.S.; Sundquist, E.T.; Schwartz, S.E.; Hall, D.K.; Fellows, J.D.; Killeen, T.L. Climate Change and Greenhouse Gases. Eos Trans. Am. Geophys. Union 1999, 80, 453–458. [Google Scholar] [CrossRef]
- Santana, J.C.C.; Miranda, A.C.; Yamamura, C.L.K.; da Silva Filho, S.C.; Tambourgi, E.B.; Lee Ho, L.; Berssaneti, F.T. Effects of Air Pollution on Human Health and Costs: Current Situation in São Paulo, Brazil. Sustainability 2020, 12, 4875. [Google Scholar] [CrossRef]
- Ma, Q. NASA GISS: Science Briefs: Greenhouse Gases: Refining the Role of Carbon Dioxide. Available online: https://www.giss.nasa.gov/research/briefs/1998_ma_01/ (accessed on 19 August 2022).
- Florides, G.A.; Christodoulides, P. Global Warming and Carbon Dioxide through Sciences. Environ. Int. 2009, 35, 390–401. [Google Scholar] [CrossRef] [PubMed]
- Masson-Delmotte, V.; Zhai, P.; Pörtner, H.-O.; Roberts, D.; Skea, J.; Shukla, P. Global Warming of 1.5 °C. In An IPCC Special Report on the Impacts of Global Warming of 1.5 °C above Pre-Industrial Levels and Related Global Greenhouse Gas Emission Pathways; 2018; p. 616. Available online: https://www.ipcc.ch/site/assets/uploads/sites/2/2019/06/SR15_Full_Report_Low_Res.pdf (accessed on 19 August 2022).
- Tiseo, I. Annual CO2 Emissions Worldwide 1940–2020. Available online: https://www.statista.com/statistics/276629/global-co2-emissions/ (accessed on 27 August 2022).
- Ritchie, H.; Roser, M.; Rosado, P. CO2 and Greenhouse Gas Emissions. Our World Data. 2020. Available online: https://ourworldindata.org/co2-and-greenhouse-gas-emissions (accessed on 19 August 2022).
- Tiseo, I. EU Carbon Dioxide Emissions. Available online: https://www.statista.com/statistics/450017/co2-emissions-europe-eurasia/ (accessed on 27 August 2022).
- Maizland, L. Global Climate Agreements: Successes and Failures. Available online: https://www.cfr.org/backgrounder/paris-global-climate-change-agreements (accessed on 27 August 2022).
- European Commission. Directive (EU) 2018/2002 of the European Parliament and of the Council of 11 December 2018 Amending Directive 2012/27/EU on Energy Efficiency (Text with EEA Relevance). 2018. Available online: https://eur-lex.europa.eu/legal-content/EN/TXT/PDF/?uri=CELEX:32018L2002&rid=7 (accessed on 19 August 2022).
- European Commission. Stepping Up Europe’s 2030 Climate Ambition Investing in a Climate-Neutral Future for the Benefit of Our People. 2020. Available online: https://knowledge4policy.ec.europa.eu/publication/communication-com2020562-stepping-europe%E2%80%99s-2030-climate-ambition-investing-climate_en (accessed on 19 August 2022).
- Santana, J.C.C.; Machado, P.G.; Nascimento, C.A.O.D.; Ribeiro, C.D.O. Economic and Environmental Assessment of Hydrogen Production from Brazilian Energy Grid. Energies 2023, 16, 3769. [Google Scholar] [CrossRef]
- Ślusarczyk, B.; Żegleń, P.; Kluczek, A.; Nizioł, A.; Górka, M. The Impact of Renewable Energy Sources on the Economic Growth of Poland and Sweden Considering COVID-19 Times. Energies 2022, 15, 332. [Google Scholar] [CrossRef]
- Keppler, J.H.; Mansanet-Bataller, M. Causalities between CO2, Electricity, and Other Energy Variables during Phase I and Phase II of the EU ETS. Energy Policy 2010, 38, 3329–3341. [Google Scholar] [CrossRef]
- Cai, W.; Pan, J. Stochastic Differential Equation Models for the Price of European CO2 Emissions Allowances. Sustainability 2017, 9, 207. [Google Scholar] [CrossRef]
- Cucchiella, F.; D’Adamo, I.; Gastaldi, M.; Koh, L.; Santibanez-Gonzalez, E.D.R. Assessment of Ghg Emissions in Europe: Future Estimates and Policy Implications. Environ. Eng. Manag. J. 2020, 19, 131–142. [Google Scholar]
- European Commission. Carbon Border Adjustment Mechanism. Available online: https://taxation-customs.ec.europa.eu/green-taxation-0/carbon-border-adjustment-mechanism_en (accessed on 28 January 2023).
- Stiglitz, J.; Stern, N. Report of the High-Level Commission on Carbon Prices. Available online: https://www.carbonpricingleadership.org/report-of-the-highlevel-commission-on-carbon-prices (accessed on 28 January 2023).
- Huusko, H. Set Science-Based Emission Reduction Targets | UN Global Compact. Available online: https://www.unglobalcompact.org/take-action/action/science-based-target (accessed on 27 August 2022).
- Marotta, A.; Porras-Amores, C.; Rodríguez Sánchez, A. Are Green Buildings an Indicator of Sustainable Development? Appl. Sci. 2023, 13, 3005. [Google Scholar] [CrossRef]
- Vasylieva, T.; Lyulyov, O.; Bilan, Y.; Streimikiene, D. Sustainable Economic Development and Greenhouse Gas Emissions: The Dynamic Impact of Renewable Energy Consumption, GDP, and Corruption. Energies 2019, 12, 3289. [Google Scholar] [CrossRef]
- Simionescu, M.; Păuna, C.B.; Niculescu, M.-D.V. The Relationship between Economic Growth and Pollution in Some New European Union Member States: A Dynamic Panel ARDL Approach. Energies 2021, 14, 2363. [Google Scholar] [CrossRef]
- Fakher, H.A.; Inglesi-Lotz, R. Revisiting Environmental Kuznets Curve: An Investigation of Renewable and Non-Renewable Energy Consumption Role. Environ. Sci. Pollut. Res. 2022, 29, 87583–87601. [Google Scholar] [CrossRef] [PubMed]
- Leitão, N.C.; Lorente, D.B. The Linkage between Economic Growth, Renewable Energy, Tourism, CO2 Emissions, and International Trade: The Evidence for the European Union. Energies 2020, 13, 4838. [Google Scholar] [CrossRef]
- Busu, M. Analyzing the Impact of the Renewable Energy Sources on Economic Growth at the EU Level Using an ARDL Model. Mathematics 2020, 8, 1367. [Google Scholar] [CrossRef]
- Bölük, G.; Mert, M. Fossil & Renewable Energy Consumption, GHGs (Greenhouse Gases) and Economic Growth: Evidence from a Panel of EU (European Union) Countries. Energy 2014, 74, 439–446. [Google Scholar] [CrossRef]
- Altıntaş, H.; Kassouri, Y. Is the Environmental Kuznets Curve in Europe Related to the Per-Capita Ecological Footprint or CO2 Emissions? Ecol. Indic. 2020, 113, 106187. [Google Scholar] [CrossRef]
- Rehman, E.; Rehman, S. Modeling the Nexus between Carbon Emissions, Urbanization, Population Growth, Energy Consumption, and Economic Development in Asia: Evidence from Grey Relational Analysis. Energy Rep. 2022, 8, 5430–5442. [Google Scholar] [CrossRef]
- Vormittag, E.M.; Rodrigues, C.G.; André, P.A.D.; Saldiva, P.H.N. Assessment and Valuation of Public Health Impacts from Gradual Biodiesel Implementation in the Transport Energy Matrix in Brazil. Aerosol Air Qual. Res. 2018, 18, 2375–2382. [Google Scholar] [CrossRef]
- Villoria Sáez, P.; Porras-Amores, C.; del Río Merino, M. New Quantification Proposal for Construction Waste Generation in New Residential Constructions. J. Clean. Prod. 2015, 102, 58–65. [Google Scholar] [CrossRef]
- de Souza Mendonça, A.K.; Barni, G.D.A.C.; Moro, M.F.; Bornia, A.C.; Kupek, E.; Fernandes, L. Hierarchical Modeling of the 50 Largest Economies to Verify the Impact of GDP, Population and Renewable Energy Generation in CO2 Emissions. Sustain. Prod. Consum. 2020, 22, 58–67. [Google Scholar] [CrossRef]
- Sahlian, D.N.; Popa, A.F.; Creţu, R.F. Does the Increase in Renewable Energy Influence GDP Growth? An EU-28 Analysis. Energies 2021, 14, 4762. [Google Scholar] [CrossRef]
- Oei, P.-Y.; Hermann, H.; Herpich, P.; Holtemöller, O.; Lünenbürger, B.; Schult, C. Coal Phase-out in Germany—Implications and Policies for Affected Regions. Energy 2020, 196, 117004. [Google Scholar] [CrossRef]
- Alola, A.A.; Yalçiner, K.; Alola, U.V.; Akadiri, S.S. The Role of Renewable Energy, Immigration and Real Income in Environmental Sustainability Target. Evidence from Europe Largest States. Sci. Total Environ. 2019, 674, 307–315. [Google Scholar] [CrossRef]
- Marotta, A.; Porras-Amores, C.; Rodríguez Sánchez, A. Resilient Built Environment: Critical Review of the Strategies Released by the Sustainability Rating Systems in Response to the COVID-19 Pandemic. Sustainability 2021, 13, 11164. [Google Scholar] [CrossRef]
- González-Sánchez, M.; Martín-Ortega, J.L. Greenhouse Gas Emissions Growth in Europe: A Comparative Analysis of Determinants. Sustainability 2020, 12, 1012. [Google Scholar] [CrossRef]
- Simionescu, M.; Strielkowski, W.; Tvaronavičienė, M. Renewable Energy in Final Energy Consumption and Income in the EU-28 Countries. Energies 2020, 13, 2280. [Google Scholar] [CrossRef]
- Rubins, M.; Pilvere, I. Development of Renewable Energy Policy in Latvia. In Proceedings of the International Scientific Conference, Jelgava, Latvia, 4–5 May 2017. [Google Scholar]
- Simionescu, M.; Bilan, Y.; Krajňáková, E.; Streimikiene, D.; Gędek, S. Renewable Energy in the Electricity Sector and GDP per Capita in the European Union. Energies 2019, 12, 2520. [Google Scholar] [CrossRef]
- Ntanos, S.; Skordoulis, M.; Kyriakopoulos, G.; Arabatzis, G.; Chalikias, M.; Galatsidas, S.; Batzios, A.; Katsarou, A. Renewable Energy and Economic Growth: Evidence from European Countries. Sustainability 2018, 10, 2626. [Google Scholar] [CrossRef]
- Karmellos, M.; Kosmadakis, V.; Dimas, P.; Tsakanikas, A.; Fylaktos, N.; Taliotis, C.; Zachariadis, T. A Decomposition and Decoupling Analysis of Carbon Dioxide Emissions from Electricity Generation: Evidence from the EU-27 and the UK. Energy 2021, 231, 120861. [Google Scholar] [CrossRef]
- Fotis, P. Sustainable Development and Competition: New Evidence from EU Countries. E3S Web Conf. 2021, 296, 06045. [Google Scholar] [CrossRef]
- Oyebanji, M.O.; Kirikkaleli, D. Energy Productivity and Environmental Deregulation: The Case of Greece. Environ. Sci. Pollut. Res. 2022, 29, 82772–82784. [Google Scholar] [CrossRef] [PubMed]
- Stamopoulos, D.; Dimas, P.; Sebos, I.; Tsakanikas, A. Does Investing in Renewable Energy Sources Contribute to Growth? A Preliminary Study on Greece’s National Energy and Climate Plan. Energies 2021, 14, 8537. [Google Scholar] [CrossRef]
- Loumakis, S.; Giannini, E.; Maroulis, Z. Renewable Energy Sources Penetration in Greece: Characteristics and Seasonal Variation of the Electricity Demand Share Covering. Energies 2019, 12, 2441. [Google Scholar] [CrossRef]
- Kosmopoulos, P.; Kantzioura, A.; Kosmopoulos, I.; Kleskas, K.; Kosmopoulos, A. Public Opinion in Greece about Photovoltaics & Renewable Energy Sources; Skiathos Island, Greece. Available online: https://www.researchgate.net/publication/354067042_PUBLIC_OPINION_IN_GREECE_ABOUT_PHOTOVOLTAICS_RENEWABLE_ENERGY_SOURCES (accessed on 23 August 2021).
- Poljanskihh, A.; Levina, A.; Dubgorn, A. Investment in Renewable Energy: Practical Case in Estonia. MATEC Web Conf. 2018, 193, 05065. [Google Scholar] [CrossRef]
- Pacesila, M.; Burcea, S.G.; Colesca, S.E. Analysis of Renewable Energies in European Union. Renew. Sustain. Energy Rev. 2016, 56, 156–170. [Google Scholar] [CrossRef]
- Kotzebue, J.R.; Weissenbacher, M. The EU’s Clean Energy Strategy for Islands: A Policy Perspective on Malta’s Spatial Governance in Energy Transition. Energy Policy 2020, 139, 111361. [Google Scholar] [CrossRef]
- Franzitta, V.; Curto, D.; Milone, D.; Rao, D. Assessment of Renewable Sources for the Energy Consumption in Malta in the Mediterranean Sea. Energies 2016, 9, 1034. [Google Scholar] [CrossRef]
- Ligus, M.; Peternek, P. The Sustainable Energy Development Index—An Application for European Union Member States. Energies 2021, 14, 1117. [Google Scholar] [CrossRef]


Disclaimer/Publisher’s Note: The statements, opinions and data contained in all publications are solely those of the individual author(s) and contributor(s) and not of MDPI and/or the editor(s). MDPI and/or the editor(s) disclaim responsibility for any injury to people or property resulting from any ideas, methods, instructions or products referred to in the content. |
© 2023 by the authors. Licensee MDPI, Basel, Switzerland. This article is an open access article distributed under the terms and conditions of the Creative Commons Attribution (CC BY) license (https://creativecommons.org/licenses/by/4.0/).