Article

Improvement of Luminescence and Photocatalytic Performance of ZnO:Eu3+ Nanocrystals Activated by Na+ Ions

1
Laboratory of Composite Materials and Clay Minerals, National Center of Research in Material Sciences, Hammam-Lif 2050, Tunisia
2
Laboratory of Chemistry for Inorganic/Organic Hybrid Functionalized Materials, School of Chemistry and Chemical Engineering, Anhui University, Hefei 230601, China
3
Graduate School of Science, Nagoya University, 2-24-16 Furo-Cho, Chikusa-ku, Nagoya 464-8602, Aichi, Japan
4
Department of Physics, College of Science, Princess Nourah Bint Abdulrahman University, P.O. Box 84428, Riyadh 11671, Saudi Arabia
5
Department of Physics, College of Sciences, University of Bisha, P.O. Box 551, Bisha 61922, Saudi Arabia
*
Author to whom correspondence should be addressed.
Appl. Sci. 2023, 13(14), 8448; https://doi.org/10.3390/app13148448
Submission received: 26 May 2023 / Revised: 15 July 2023 / Accepted: 18 July 2023 / Published: 21 July 2023
(This article belongs to the Special Issue Recent Developments in the Application of Nanomaterials in Photonics)

Abstract

:
Undoped and codoped (Eu/Na) ZnO nanocrystals (NCs) were successfully manufactured through an economical sol-gel method. X-ray diffraction (XRD) analysis demonstrated pure hexagonal wurtzite structure without secondary phases for all the samples. The size of the NCs was found to decrease with codoping by Eu3+/Na+ which is related to the existence of strain and stress in the lattice. The dominance of the E2(high) mode in Raman spectra indicates the good crystallinity of the samples. The study from the X-ray photoelectron spectroscopy (XPS) shows the successful insertion of both Eu3+ and Na+ ions into the ZnO lattice and the generation of the zinc and oxygen vacancies (Vo) defects. The band gap energy was reduced and the Urbach energy increased with Na+ content, proving the distortion of the lattice. From the photoluminescence (PL) study, the activation of the Eu3+ ions by Na+ ones was evidenced. Longer PL lifetimes were obtained from Eu3+ ions when they were sensitized by Na+, which may be beneficial to several applications. A process of excitation transfer from both the ZnO host and Na+ sensitizers to the Eu3+ ions was evidenced and discussed. As an application, we tested the performances of the prepared NCs as photocatalysts for Rhodamine B photodegradation under sunlight irradiation. The ZnO NCs codoped with 1% Eu/4% Na displayed the best photodegradation rate with a good stability and a high kinetic rate constant k of 0.021 min−1. The photocatalytic mechanism is discussed in terms of longer radiative recombination from Eu3+ and the generated oxygen vacancies.

1. Introduction

Luminescent materials or materials containing luminescent centers with long lifetimes are very promising in various fields such as white LED [1] and photocatalysis [2]. As the classical white LEDs suffer from insufficient red light emission, a continuous interest is given to Eu3+-doped phosphors since europium is well-known for its high red emission. Sensitization of rare earths by metallic ions in crystalline or amorphous materials is a good way to enhance their luminescence, extend their charge carrier lifetimes [3,4,5], and obtain better results in applications. However, the host material is of great interest for this purpose since it should exhibit good thermal and chemical stability, a high solubility of the doping elements, and mainly generate a process of charge transfer to the luminescent centers.
Nanocrystalline ZnO is one of the promising hosts for rare earth and metallic ions since it has a direct large band gap (3.37 eV), high exciton binding energy (60 meV), and high thermal and chemical stabilities. Further, the wide luminescence spectrum of ZnO [6] (covering a part of the UV and most of the visible region) overlaps with the Eu3+ absorption bands [7], which can generate further processes of excitation transfer. Moreover, as an effective strategy to improve ZnO photocatalytic activity, doping with metallic ions has attracted significant attention because these ions could efficiently trap the photoinduced charge carriers [8,9]. Previously, we have shown a large enhancement of visible light absorption by doping ZnO NCs with Na+ ions [10], which was due to the formation of an acceptor level related to NaZn species, as revealed from a photoluminescence (PL) study. Thereafter, the photocatalytic activities were evaluated. As a result, we have shown that doping ZnO with Na is a simple and efficient way to achieve a high photodegradation of organic dyes in water.
On the other hand, several studies conducted thus far have focused on the doping of ZnO with rare earth (RE) ions [11,12]. As known, Eu3+ is the most-studied RE ion thanks to its efficient red emission, which is solicited in many applications. In addition, Eu3+ doping can decrease the optical band gap and improve light absorption in the entire visible region for maximum utilization of the solar spectrum [13]. Furthermore, the longer charge carrier lifetime relative to Eu3+ ions is promising for the application of ZnO-Eu3+ as an efficient photocatalyst under sunlight irradiation. However, the presence of an activator such as Na+ in the ZnO:Eu host can enhance the red luminescence of Eu3+ and extend the charge carrier lifetime, which is beneficial for the photodegradation of dyes in water. In fact, alkali metals (Na+, Li+ and K+), which are widely used as sensitizers, can modify the environment around Eu3+ ions and transfer electrons by interactions since they occupy both substitutional or interstitial sites and create oxygen vacancies [10]. Othmen et al. [2] showed the successful insertion of Sm3+ ions into the ZnO crystal lattice and both PL features and photocatalytic efficiency were optimized for 1.5% doping. The fast and complete photodegradation of RhB was reported under solar irradiation. Both the PL lifetime and Sm3+ reduction, through oxygen vacancies, were involved in the photocatalytic mechanism. Deng et al. [14] showed a beneficial effect of Bi+ in ZnWO4:Dy3+ for the generation of electron-hole pairs and as a trapping center for reducing their recombination, allowing for a high photodegradation of dyes under UV light irradiation.
Based on the above-mentioned considerations, the goal of this investigation is to prepare, by a low-cost method, efficient ZnO:Eu3+/Na+ photocatalysts with longer recombination rates. We investigated the influence of both Eu and Na dopants on the structural, vibrational, and optical properties of ZnO NCs. The PL features of Eu3+ were optimized through Na+ content, and its role as an activator is highlighted. The photocatalytic efficiency of the synthesized NCs was assessed through the photodegradation of RhB under sunlight irradiation at different doping concentrations. Finally, we show the photocatalytic mechanism and the stability of the best photocatalyst.

2. Experimental

2.1. Samples Synthesis

An economical sol-gel method was adopted for the synthesis of ZnO NCs. The sol was prepared using 2 g of zinc acetate dehydrate as a starting precursor, europium (III) chloride hexahydrate and sodium acetate as doping, citric acid as a stabilizer (the number of moles of citric acid is equal to the sum of the number of moles of cations), and water as a solvent. After magnetic stirring for 3 h, the sol was dried at 80 °C, and the obtained powders underwent thermal annealing at 500 °C for 4 h. The undoped and Eu-doped samples are termed ZnO and ZnEu, respectively. For codoped samples, the Eu3+ concentration is kept the same, about 1 at.%, and the Na+ concentration is varied from 1 to 5 at.% (ZnO-1%Eu-x%Na, x = 1–5). The corresponding samples are denoted as ZnEuNa1, ZnEuNa2, ZnEuNa3, ZnEuNa4, and ZnEuNa5, respectively.

2.2. Characterizations

X-ray diffraction (XRD) patterns were collected on a Philips X’Pert diffractometer (Malvern, UK) supplied with copper X-ray tube (λ = 1.5406 Å), at 40 kV and 100 mA. The morphology behaviour was examined by Transmission Electron Microscopy (TEM; Japan Electronics Co., LTD JEM-2100, Tokyo, Japan). Raman spectra were recorded by using a Labram HR spectrometer equipped with the 488 nm wavelength beam from an Ar laser. A UV-vis spectrometer manufactured by Perkin Elmer (Lambda 950) was utilized to measure the diffuse reflectance spectra. PL spectra were obtained by exciting the samples from Xe-lamp (366 nm) or laser diode (405 nm).

2.3. Photocatalysis

We prepared a mixture of diluted RhB aqueous solution (C = 5 × 10⁻⁶ M) and 5 mg of the ZnO NCs. First, the mixture was kept in dark for 3 h under magnetic stirring to accomplish the adsorption-desorption equilibrium of RhB with the NCs. After that, the suspension was irradiated for different time intervals (from 0 min to 120 min) under real sun light irradiation with estimated intensity of 700 W/m2 (location at Tunis region—month of september). UV-vis absorption spectra were recorded at different time intervals.

3. Results and Discussion

3.1. XRD Analysis

Figure 1 illustrates the X-ray diffraction patterns of the prepared ZnO NCs. According to the card JCPDS 01-089-7102, all the diffracted peaks are typical to the hexagonal wurtzite structure of ZnO [15,16]. The sharp and intense peaks indicate the good crystalline quality of the prepared ZnO samples. We notice the absence of new peaks for the doped ZnO NCs which confirms the absence of new phases and indicates the insertion of both the Eu3+ and Na+ ions into the ZnO lattice without any amorphous component and other additional crystalline phases. Therefore, the hexagonal phase of the oxide obtained is not affected by the doping process. Similar results were obtained for other ZnO doping with Mg [17], Sb [18] and La-Sm-Er [19].
Moreover, the reduced intensity of the peaks and their broadening with further doping are indications of the important stress and strain applied to the ZnO NCs related to the higher mismatch between the ionic radius of the dopants Eu3+ (0.095 nm) and Na+ (0.102 nm) with respect to Zn (0.074 nm) [20].
The lattice parameters a and c, as well as the volume V of the unit cell were calculated using the following expression [21]:
1 d 2 = 4 3 h 2 + h k + k 2 a 2   + l 2 c 2
V = 3 2   a 2 c = 0.866   a 2 c
According to Table 1, there is a slight variation in the values of a and c which can be attributed to the successful insertions of Eu3+ and Na+ ions in the ZnO lattice [22]. In addition, the c/a ratio remains constant indicating that there is no change in the crystal structure following the incorporation of doping ions (Eu3+ and Na+). This value is in good agreement with the standard one (1.6) obtained for ZnO [23].
Figure 2 shows a shift of the peaks toward high diffraction angle, which confirms the effective insertion of the Eu3+ and Na+ ions into the ZnO crystal lattice. On the other hand, since the ionic radii of doping ions are greater with respect to that of Zn2+, some of the Eu3+ and Na+ ions can occupy interstitial positions in the ZnO lattice [24].
The crystallite size D is calculated using the Debye Scherrer equation:
D = k   λ β c o s θ
where k is the shape factor, λ is the X-ray wavelength, β is the peak FWHM, and θ is the diffracting angle.
An estimate of the average crystallite size was made for the first three most intense peaks (Table 2).
The reduction in the crystallite size following Eu3+ and Na+ incorporation indicates the insertion of the rare earth ions may alter the nucleation of the ZnO nanocrsytallites and as the mismatch is higher only a small portion of the dopant is tolerated by ZnO. Thus, the excess of Eu3+ dopant forms Eu-oxide clusters embedded in ZnO, consisting of structures with four or eight Eu atoms, as revealed recently from DFT calculations [25]. The present results are in good agreement with those reported for different ZnO doping with rare earth’s [2,12] and transition metals (Na+ [10] and Mg2+ [26]).
Crystal imperfections induces lattice strain ε which can be determined from the Williamson-Hall expression [27]:
β   cos θ = k   λ D + 4   ε sin θ
The term βcosθ (y-axis) is plotted against 4sinθ (x-axis) in Figure 3 and ε is calculated from the slope.
As summarized in Table 2, the lattice strain ε increases with further Na doping, revealing the high imperfections in the lattice induced from the doping process. However, the reduction of the crystallite size D can be explained from the growth inhibition of the ZnO crystal by Eu3+ doping. Because of the crystallite size reduction, the specific surface area of the ZnO NCs will increases which is benefic for the photocatalytic activity.
A TEM image of ZnEuNa4 sample is shown in Figure 4a. It shows the formation of quasi-uniform spherical nanoparticules with diameters in 15–25 nm range, which is in good agreement with the XRD analysis. Energy dispersive X-ray spectroscopy (EDS) mapping on 2 × 2 μm2 area was provided for the sample ZnEuNa4, to determine the compositional elements of the ZnEuNa4 sample (Figure 4b). As expected, the spectrum showed the presence of Zn, O, Eu and Na elements, in the atomic % 48.29, 47.1, 0.96 and 3.65, respectively.

3.2. Raman Analysis

As revealed from Figure 5, the band relative to the E2(high) mode dominates all the Raman spectra. It confirms the good crystallinity of the hexagonal wurtzite structure of ZnO NCs [28]. This band, centered at 437 cm−1, does not show any shift with doping, but its width decreases with the Eu3+ monodoping and increases with Na+ codoping. The absence of the peak relating to sodium and its compounds point out that the würtzite phase of ZnO remains dominant and an effective substitution of Zn2+ by Na+ has been achieved following doping [10]. The large peak at around 330 cm−1 is attributed to E2(high)–E2(low) mode. Its presence shows the good crystalline quality of all the samples [9]. However, a band at 378 cm−1 appears only for the monodoping with Eu3+ ion. This band corresponds to the vibration mode A1(TO) and its presence confirms the good crystalline quality of the sample. Indeed, the monodoping allows the Eu3+ ion to fill the vacant site of Zn2+ and therefore reduces the density of defects in crystal lattice [2]. In addition, a weak abnormal peak appears around 251cm−1 in the spectrum of the highly Na+ doped sample (ZnEuNa5). We think it would be related to the B1(low) silent mode [17]. In fact, the high Na+ doping can deform the crystal lattice and break the selection rules, which activates the silent Raman modes in the lattice [29].
The band located around the frequency 580 cm−1, related to A1(LO) mode, decreases in intensity with Eu3+ monodoping, which implies a reduction in the density of defects. However, it increases with the Na+ content which leads to the creation of other defects in the structure due to, on the one hand, the large ion radius of Na+ ion compared to Zn2+ ion, and on the other hand to the low solubility of transition metals in the ZnO lattice.
The non-appearance of additional vibration modes, corresponding to secondary phases, confirms the insertion of Eu3+ and Na+ ions in the ZnO structure. In addition, the fact that the Raman peaks do not show a shift is a sign that doping causes little deformation in the ZnO lattice. Thus, the Raman and XRD results are in good agreement.

3.3. XPS Analysis

To further verify the successful co-doping of Eu and Na elements in ZnO nanocrystals, XPS data were investigated to evidence the different chemical composition, transition states and functionality of both doping elements.
Figure 6a shows the full-survey spectrum of the Eu/Na co-doped sample and the presence of expected Zn, O, Eu, and Na elements, which demonstrates the purity of the ZnO phase. Figure 6b) depicts highly symmetric peaks centered at 1021.5 eV and 1044.5 eV, attributed to Zn 2p3/2 and Zn 2p1/2 levels, respectively, which is consistent with the expected material [30]. Furthermore, the dominance of the Zn 2p3/2 peak over the Zn 2p1/2 one indicates that most of Zn at the surface exist in the ionic form Zn2+ [18]. The Eu scan (Figure 6b) shows two intense peaks centered at 1134.1 eV and 1163.6 eV are assigned to Eu3+(Eu3d5/2) and Eu3+(Eu3d3/2) spin-orbit splitting core levels, which evidence the successful doping of the europium ions in the ZnO lattice [31]. However, the peaks centered at 1136.7 eV and 1166.3 eV can be attributed to Eu2+(Eu3d5/2) and Eu2+(Eu3d3/2) spin-orbit splitting core levels. Their presence provides a partial reduction of Eu3+ to Eu2+ in the ZnO host to keep charge valence when Eu3+ substitutes Zn2+ [32]. In addition, the high resolution of O1s was deconvoluted into principal peaks (see Figure 6c). The intense one located at 530.28 eV could be assigned to the lattice oxygen bound with zinc (Zn-O). While the other peak at 531.7 eV is more probably relative to the oxygen defects on the nanocrystal surface. The peak at 1071.7 eV is assigned to the Na1s level, for Na doping [33].

3.4. UV-Visible Measurements

Figure 7 illustrates the absorption spectra of the ZnEuNa NCs. Using these data, the band gap energy of direct transition is determined. As shown in Table 3, the values of Eg varied in the range 3.23–3.28 eV, and are comparable with those obtained for ZnO:Eu nanoparticles by B. Poornaprakash et al. [34]. The incorporation of the Eu3+ ion does not allow a significant change in the Eg value. However, Eg decreases following codoping by Na+ ions. In fact, the simple doping with Eu3+ ions decreases the density of defects since these ions occupy the vacant sites of Zn. Therefore, the crystallinity of ZnO is improved by simple doping at a low level. However, the addition of Na+ ions with larger ionic radii in respect of Zn, can create various defects in the crystal lattice. For lower concentration, the Na+ ion substitutes the Zn2+ which migrate to interstitial sites and act as deep donor levels positioned close to the conduction band. Likewise, the zinc vacancies (VZn) act as acceptor defects located near the valence band. Thus, most transitions occur between the energy levels located at the edges of the bands related to the deep defects (zinc vacancy VZn and Zinc interstitial Zni) [35]. The more Na+ ions are introduced, the more the concentration of defects and the densities of energy levels at the edges of the bands are high, thus reducing the energies of the transitions. Similar shifts in gap energies have been reported [36,37].
The UV-visible curves exhibit a band tail (inset Figure 7) corresponding to the well-known Urbach energy Eu. The absorption coefficient α in this zone is depicted as [38]:
α = α 0 exp ( ( h v E g ) / E u )
The decrease in the Urbach energy after Eu3+ doping (Table 3) confirmed the reduction in the defects density, as previously mentioned. It confirms the improvement in crystalline quality of the samples. However, the value of Eu increases with codoping rate up to 3% Na+ concentration, which shows the creation of additional defects by the incorporation of this element whose ionic radius is larger than that of Zn2+. Beyond 3% in Na+ ion, Urbach’s energy gradually decreases because sodium limits the formation of ZnO NCs and it will be located on the surface.
In conclusion, the variations of both Eg and Eu with the added Na+ concentration show the successful dopant insertion in the lattice with a tendency to affect the ZnO crystallinity [23].

3.5. Luminescence Study

The emission of the elaborated NCs (Figure 8) was studied under an excitation wavelength of 366 nm from a Xenon lamp using an optical filter which cuts up to 410 nm. As a result, the exciton band of ZnO does not appear in the spectra. This is normally centered at 370 nm and the ratio of its intensity to that of visible band characterizes the ZnO crystallinity [15]. Moreover, no PL bands relative to Eu3+ appear because the excitation wavelength is not resonant for any energy transition in Eu3+.
Figure 8 shows two kinds of emission for ZnO NCs. The first type, revealed by the intense band in the blue-violet range (~415 nm), results from the transition of the level defects of Zinc interstitial (Zni) to the valence band or also from the conduction band to the level of zinc vacancies (VZn) which is located slightly above the valence band. The intensity of this band increases slightly with Na+ content in ZnO. As it has been reported previously, Na+ ion can occupy a Zn site to form the acceptor complexe NaZn whose energy level is located near the valence band [39]. Thus, the formed acceptor complex contributes to the blue-green emission from ZnO nanocrystals. The second type of emission is presented by the wide band located in the visible region It originates from various oxygen defects in ZnO such as oxygen vacancies (VO), oxygen interstitials (Oi) and oxygen anti-sites [40]. For undoped ZnO NCs, the large PL band suggests the contribution of all types of oxygen defects. However, the disappearance of this band is noticed after doping with Na+ ion.
In order to show the emission peaks related to Eu3+ ions, we have chosen to excite the samples by the 405 nm wavelength. Figure 9 shows the well-known emission peaks assigned to the intra-4f shell transition D 0 5 F j 7 (j = 1–4) in Eu3+ ion [41]. The observed peaks correspond to D 0 5 F 1 7 (at 591 nm), D 0 5 F 2   7 (at 615 nm), D 0 5 F 3 7 (at 650 nm) and D 0 5 F 4 7 (at 695 nm) [42]. The most intense emission is related to D 0 5 F 2   7 which arises from the electric-dipole transition, allowed when the Eu3+ ion is found on a site of low symmetry. We cannot exclude that the emission arises from a fraction of Eu3+ located at the surface of the ZnO nanocrystal [43].
In addition, the red emission is observed for all NCs codoped (Eu3+/Na+) which shows that the Eu3+ ions are active in the ZnO NCs despite the thermal annealing not being performed at high temperature. The PL intensity is improved by Na+ addition till 4 at.% and then decreases. The Eu3+ emission is governed from an excitation transfer process from Na+ ions which act as sensitizers for Eu3+ [44]. In addition, the disappearance of the visible band of ZnO after doping with Eu3+ ions is a sign of excitation transfer from deep levels to Eu3+ ions.
The PL decays, measured for the emission relative the D 0 5 F 2   7 transition, confirm the excitation process of Eu3+ ions (Figure 10). In fact, the PL lifetime increases from 0.173 ms for Eu3+ monodoped ZnO to 0.366 ms after 1%Na+ addition (Table 4). Then, it increases considerably with further Na+ addition and reaches 0.67 ms for the ZnEuNa4 sample, indicating the important role of the sodium ions as activator of Eu3+ ones. The high mobility of Na+ ions and their interactions with Eu3+ lead to an important charge transfer that is reflected by the considerable improvement of the luminescence properties. It is known that Na incorporation in ZnO leads to the formation of NaZn complexes, acting as acceptor levels [10]. The transitions from the ZnO conduction band to such NaZn levels are at the origin of the violet emission which is close to the energy of the D 2 5 F 2   7 transition of Eu3+ (405 nm). Thus, an easy and resonant excitation transfer from these levels to Eu3+ is evidenced.
Further, we think that the achievement of relatively longer recombination times is promising for possible application of the present NCs in several fields such as optoelectronics, photovoltaics and photocatalysis.

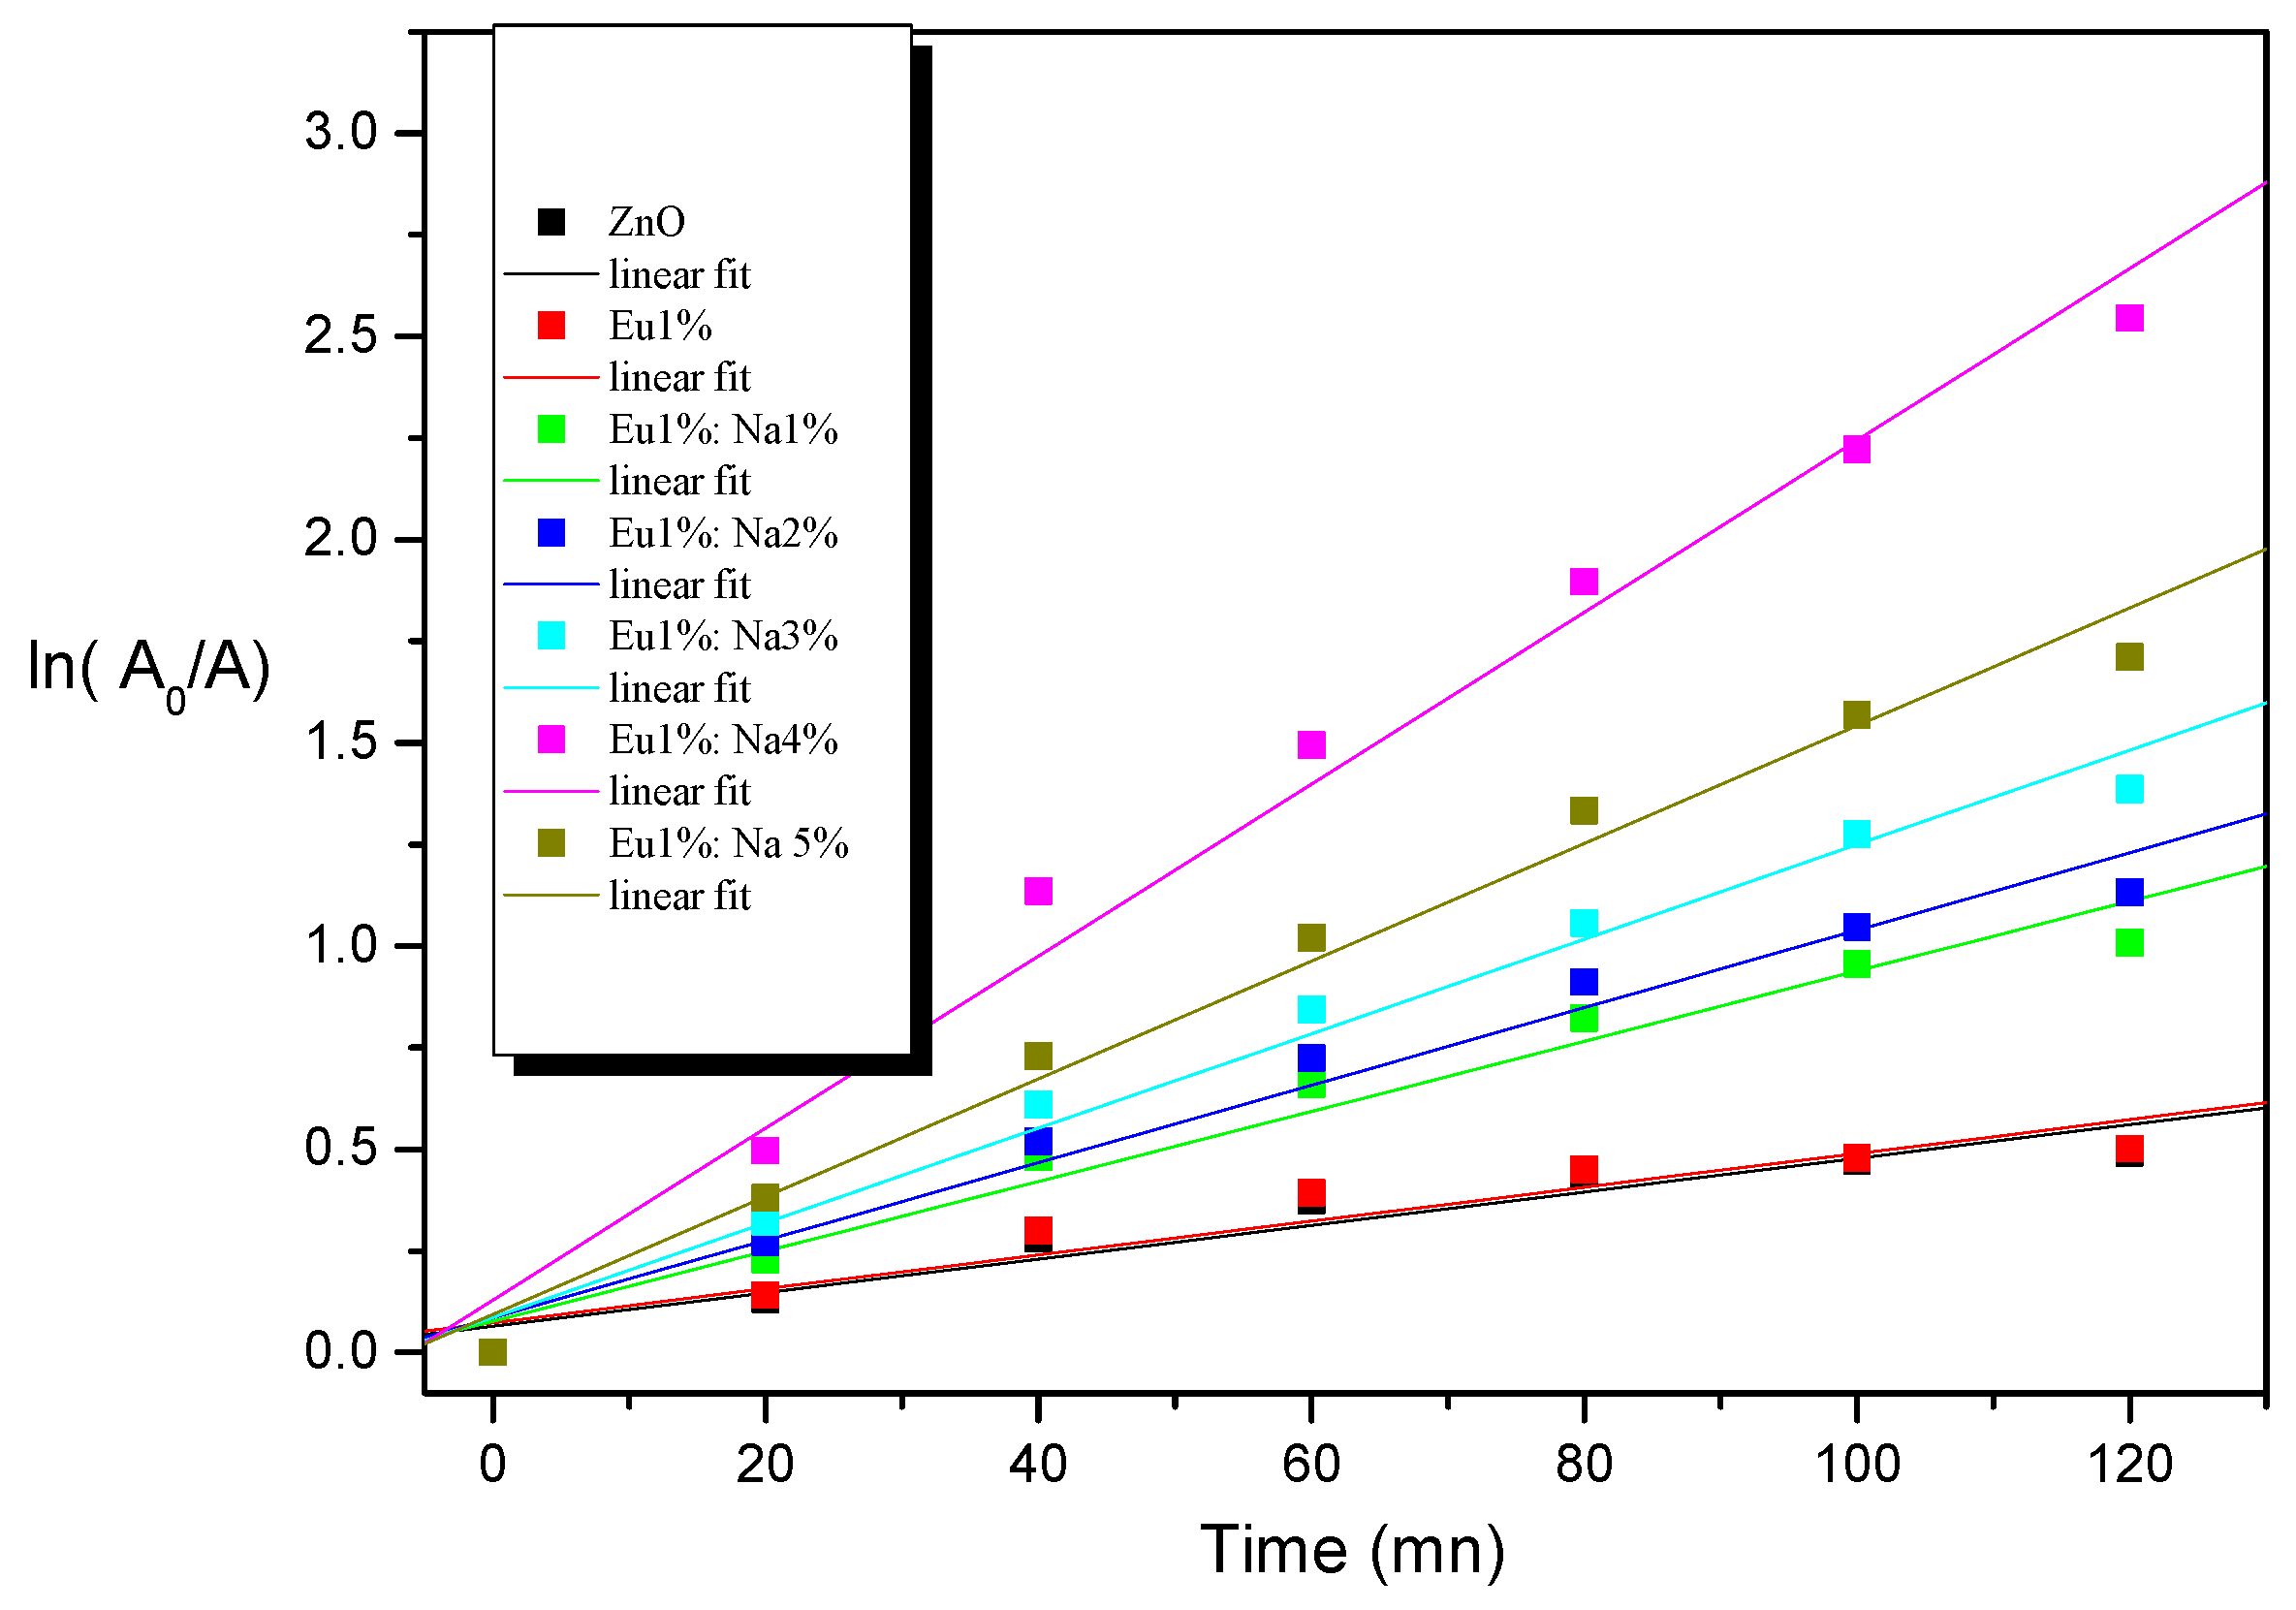
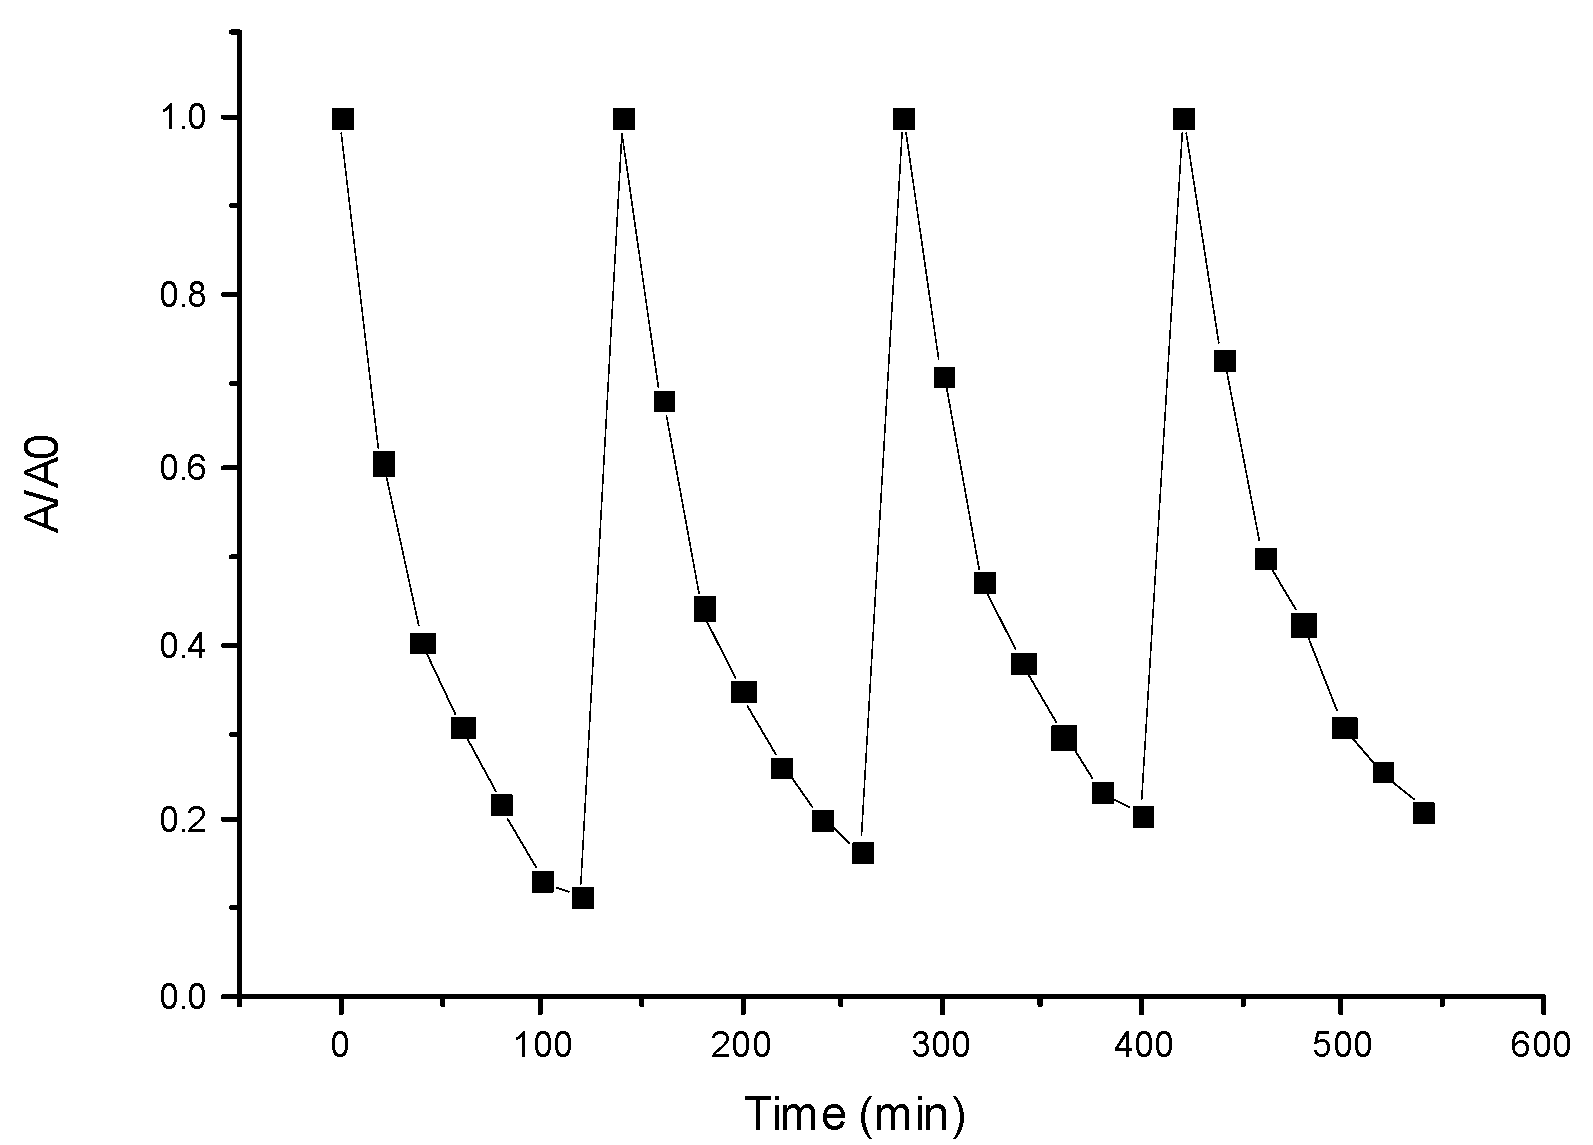
3.6. Photocatalytic Study

The evolution of the photocatalytic degradation of RhB at different concentrations of doping is presented in Figure 11. The photodegradation rate is determined from the expression:
Degradation   rate   ( % ) = A 0 A t A 0 × 100
A0 and A represent the absorbances of the RhB solution before and after irradiation during a time t, respectively.
The photodegradation rate of RhB in solution without photocatalyst is only about 5% after 120 min of irradiation. However, in the presence of the undoped ZnO photocatalyst, the photodegradation rate reaches 40%, in the same conditions. Interestingly, with the presence of ZnO-Eu-Na photocatalyst, the photodegradation rate further increased and reached about 93% for the same time of solar irradiation (Table 4). In addition, the ZnEuNa4 sample exhibits the greatest efficiency of photocatalytic degradation. When the result of this degradation reaction as a function of irradiation time are plotted (ln(A0/A) = f(t)), a linear curve is obtained (Figure 12), indicating a reaction with first order kinetic [45]. From Table 4, there is an improvement in the rate of photocatalytic oxidation of RhB, especially for the ZnEuNa4 photocatalyst, which clearly proves the influence of doping and its importance in the photodegradation of pollutant.
The dominant species contributing to the RhB photodegradation can be identified by proceeding to a study of scavenger addition. For this goal, we added Ethanol and Benzoquinone (BQ) to the mixture during the irradiation for the quenching of the hydroxyl [46,47] and superoxide [48] radicals, respectively. As shown in Figure 13, the photodegradation efficiency reaches 90% in the absence of scavengers for the ZnEuNa4 photocatalyst. However, the efficiency is limited to 32% and 19% in the presence of ethanol and BQ, respectively. The less capability of RhB degradation in the presence quenching agents proves that the hydroxyl and superoxide radicals are the major species in the presence of the photocatalysts and react identically to insure the RhB photodeterioration under sunlight irradiation.
To test the stability of the ZnEuNa4 photocatalyst, the powder was centrifuged and washed with absolute ethanol and DI water after each cycle of photodegradation. As shown from Figure 14, the recycled usage has no appreciable effect on the photocatalytic properties of ZnEuNa4 photocatalyst till four runs, showing its high efficiency and its good stability.
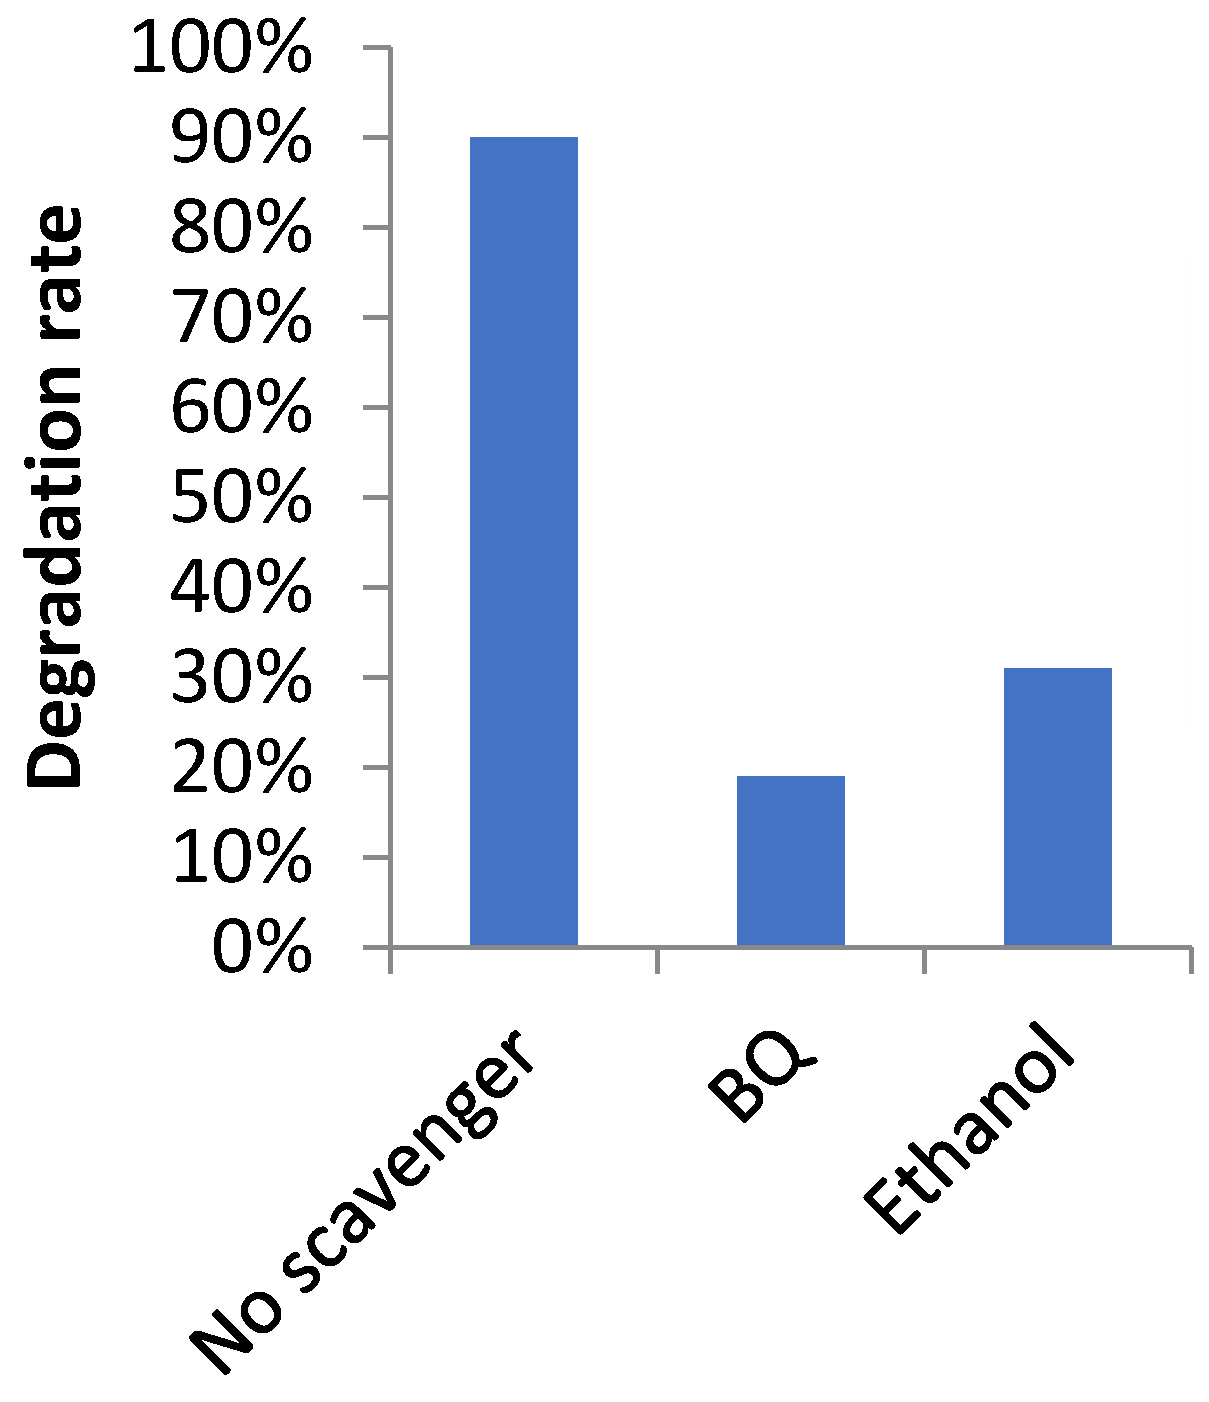
Photocatalytic Mechanism
The main condition for an effective semiconductor photocatalyst is the high photon absorption capacity, generation, separation, and transfer of electron-hole pairs to the surface [49].
In the present case, since most of the photons emitted from the sun has less energy than the band gap of ZnO, it is suggested that the photocreated electrons and holes are assisted by deep energy levels associated to the various defects in ZnO host, particularly the single oxygen defects V O + , which show the dominant emission:
Z n O + V O + v i s i b l e   e x c i t a t i o n V O + + e + h + V o + h +
The water molecules localized on the surface of ZnO nanocrystals can capture the generated holes in the valence band to produce hydroxyl radicals O H :
H 2 O + h + O H + H +
Also, the excited electron in the conduction band can be captured by O2 molecules to form the superoxide radical O 2 which is a stronger radical anion for RhB decomposition:
O 2 + e O 2
The hydroxyl and superoxide radicals are known as extremely strong oxidant for the decomposition of dye molecules [50] (Figure 15a):
R h B + O H R h B i n t e r m i d i a t e s C O 2 + H 2 O
R h B + O 2 R h B i n t e r m i d i a t e s C O 2 + H 2 O
The ZnEuNa4 sample has the best photocatalytic efficiency. The physical process behind this result is the reduction of the density of oxygen defects, as revealed from the analysis of the spectra of PL. Indeed, the energy levels related of oxygen vacancy (VO), and which ensures the separation of charges, are practically eliminated thanks to the doping by occupying some sites in the lattice.
For the doped ZnO nanostructrures, the extended PL lifetime allows the adsorbed organic molecules in the ZnO crystallite surface to trap the photogenerated electrons and prevents their recombination [51,52,53,54]. Therefore, the Eu3+ ion undergoes a reduction and moves to the unstable Eu2+ state that may transfer its electron to the adsorbed O2 to form the O 2 radical. The formed Eu3+/Eu2+ redox pairs serve as scavangers to trap the photogenerated carriers and hinder their recombinations, further to promote the visible light absorption [54]:
E u 3 + + e               E u 2 +
E u 2 + + O 2 E u 3 + + O 2
R h B + O 2 R h B i n t e r m i d i a t e s C O 2 + H 2 O
Here it is important to mention that the presence of Eu3+/Eu2+ could form a midgap states in ZnO band gap. Further, under visible light irradiation, photo-generated electrons at Eu energy bands could be excited to the conduction band of ZnO.
Simultaneously, the photocreated holes could participate in two-step excitation process (first transition: valence band—vacancies level; second transition: vacancies level –Eu midgap states) and react with adsorbed water to create a highly reactive hydroxyl radical (Figure 15b).
H 2 O + h + O H + H +
R h B + O H R h B i n t e r m i d i a t e s C O 2 + H 2 O
Further to its role as sensitizer of Eu3+ ions, Na+ may form dipoles with other species which promotes the separation of the photocreated electron-hole pairs and enhances the absorption of the photocatalyst.

4. Conclusions

ZnO:Eu:Na nanocrystals were synthesized from a simple solgel method. XRD, Raman and XPS analysis showed the incorporations of both Eu3+ and Na+ ions in the ZnO lattice without altering the structure. The PL study showed the role of Na+ ions as sensitizers for the excitation of Eu3+ ions. The process of excitation transfer from ZnO intrinsic defects and Na+ ions was confirmed by PL lifetimes. The photocatalytic efficiency of ZnO:Eu:Na NCs for the degradation of RhB under sunlight irradiation was improved by further Na+ doping. The ZnEuNa4 photocatalyst was almost stable after four runs and was the most effective with the high kinetic rate constant k = 21.16 × 10⁻³ min−1. By testing the quenching agents, both superoxide and holes are suggested as the main active species in the presence of the ZnEuNa4 photocatalyst under sunlight irradiation. The proposed photocatalytic mechanism involves the capture of photogenerated electrons by oxygen vacancies due to longer recombination rates. We have shown that oxygen vacancies induce the reduction of Eu3+ ions which result in the formation of further O 2 and O H radicals, which are the key agents for RhB decomposition.
The synthesized ZnO:Eu:Na photocatalyst along with its high efficiency and stability is a potential candidate for decomposition of dyes. Further, the good PL features and the significantly longer lifetimes could be beneficial in some optoelectronic applications, such as red light-emitting devices.

Author Contributions

Conceptualization, W.B., R.N., A.B.G.T. and H.E.; Methodology, B.G., A.B.G.T. and H.E.; Validation, F.H.A. and H.E.; Formal analysis, R.N., B.G. and F.H.A.; Investigation, W.B.; Resources, R.N. and E.S.; Writing—original draft, W.B.; Writing—review & editing, B.G., A.B.G.T. and H.E.; Visualization, J.-M.S. and E.S.; Supervision, J.-M.S. and H.E. All authors have read and agreed to the published version of the manuscript.

Funding

This research was funded by Princess Nourah bint Abdulrahman University Researchers Supporting Project number (PNURSP2023R223), Princess Nourah bint Abdulrahman University, Riyadh, Saudi Arabia.

Institutional Review Board Statement

Not applicable.

Informed Consent Statement

Not applicable.

Data Availability Statement

Not applicable.

Acknowledgments

The authors express their gratitude to Princess Nourah bint Abdulrahman University Researchers Supporting Project number (PNURSP2023R223), Princess Nourah bint Abdulrahman University, Riyadh, Saudi Arabia. Furthermore, the authors are thankful to the Deanship of Scientific Research at University of Bisha for supporting this work through the Fast-Track Research Support Program.

Conflicts of Interest

The authors declare no conflict of interest.

References

  1. Wang, Y.; Liang, Z.; Jiang, K.; Lin, Y.; He, D.; Liu, J.; Wang, W.; Wang, J.; Deng, B.; Zhang, D.; et al. SrLaNaTeO6:Eu3+ red-emitting phosphors with high luminescence efficiency and high thermal stability for high CRI white LEDs. Ceram. Int. 2023, 49, 579–590. [Google Scholar] [CrossRef]
  2. Othmen, W.B.H.; Ali, M.B.; Bouslama, W.; Elhouichet, H. Solar driven photocatalytic properties of Sm3+ doped ZnO nanocrystals. Ceram. Int. 2020, 46, 18878. [Google Scholar] [CrossRef]
  3. Wangkhem, R.; Yaba, T.; Singh, N.S.; Ningthoujam, R.S. Red emission enhancement from CaMoO4:Eu3+ by co-doping of Bi3+ for near UV/blue LED pumped white pcLEDs: Energy transfer studies. J. Appl. Phys. 2018, 123, 124303. [Google Scholar] [CrossRef]
  4. Saad, M.; Elhouichet, H. Good optical performances of Eu3+/Dy3+/Ag nanoparticles co-doped phosphate glasses induced by plasmonic effects. J. Alloys Compd. 2019, 806, 1403. [Google Scholar] [CrossRef]
  5. Jlassi, I.; Mnasri, S.; Elhouichet, H. Concentration dependent spectroscopic behavior of Sm3+-doped sodium fluoro-phosphates glasses for orange and reddish-orange light emitting applications. J. Lumin. 2018, 199, 516–527. [Google Scholar] [CrossRef]
  6. Nasser, R.; Elhouichet, H. Production of acceptor complexes in sol-gel ZnO thin films by Sb doping. J. Lumin. 2018, 196, 11–19. [Google Scholar] [CrossRef]
  7. Saad, M.; Stambouli, W.; Sdiri, N.; Elhouichet, H. Effect of mixed sodium and vanadium on the electric and dielectric properties of zinc phosphate glass. Mater. Res. Bull. 2017, 89, 224–231. [Google Scholar] [CrossRef]
  8. Bousslama, W.; Elhouichet, H.; Férid, M. Enhanced photocatalytic activity of Fe doped ZnO nanocrystals under sunlight irradiation. Optik 2017, 134, 88–98. [Google Scholar] [CrossRef]
  9. Nasser, R.; Othmen, W.B.H.; Elhouichet, H.; Férid, M. Preparation, characterization of Sb-doped ZnO nanocrystals and their excellent solar light driven photocatalytic activity. Appl. Surf. Sci. 2017, 393, 486–495. [Google Scholar] [CrossRef]
  10. Tabib, A.; Bouslama, W.; Sieber, B.; Addad, A.; Elhouichet, H.; Férid, M.; Boukherroub, R. Structural and optical properties of Na doped ZnO nanocrystals: Application to solar photocatalysis. Appl. Surf. Sci. 2017, 396, 1528–1538. [Google Scholar] [CrossRef]
  11. Kumar, M.; Singh, G.; Chauhan, M.S. Europium (Eu3+)—Doped ZnO nanostructures: Synthesis, characterization, and photocatalytic, chemical sensing and preliminary assessment of magnetic properties. Ceram. Int. 2021, 47, 17023–17033. [Google Scholar] [CrossRef]
  12. Ahmad, I.; Akhtar, M.S.; Ahmed, E.; Ahmad, M.; Keller, V.; Khan, W.Q.; Khalid, N.R. Rare earth co-doped ZnO photocatalysts: Solution combustion synthesis and environmental applications. Sep. Purif. Technol. 2020, 237, 116328. [Google Scholar] [CrossRef]
  13. Zong, Y.; Li, Z.; Wang, X.; Ma, J.; Men, Y. Synthesis and high photocatalytic activity of Eu-doped ZnO nanoparticles. Ceram. Int. 2014, 40, 10375–10382. [Google Scholar] [CrossRef]
  14. Deng, S.; Zhang, W.; Hu, Z.; Feng, Z.; Hu, P.; Wu, H.; Ma, L.; Pan, Y.; Zhu, Y.; Xiong, G. Dual-functional Bi3+, Dy3+ co-doping ZnWO4 for photoluminescence and photocatalysis. Appl. Phys. A 2018, 124, 526. [Google Scholar] [CrossRef]
  15. Bousslama, W.; Sieber, B.; Elhouichet, H.; Gelloz, B.; Addad, A.; Ferid, M. Enhancement of the intensity ratio of ultraviolet to visible luminescence with increased excitation in ZnO nanoparticles deposited on porous anodic alumina. J. Phys. D Appl. Phys. 2013, 46, 505104. [Google Scholar] [CrossRef]
  16. Bousslama, W.; Elhouichet, H.; Gelloz, B.; Sieber, B.; Addad, A.; Moreau, M.; Férid, M.; Koshida, N. Structural and Luminescence Properties of Highly Crystalline ZnO Nanoparticles Prepared by Sol–Gel Method. Jpn. J. Appl. Phys. 2012, 51, 04DG13. [Google Scholar] [CrossRef]
  17. Abed, C.; Bouzid, C.; Elhouichet, H.; Gelloz, B.; Ferid, M. Mg doping induced high structural quality of sol–gel ZnO nanocrystals: Application in photocatalysis. Appl. Surf. Sci. 2015, 349, 855–863. [Google Scholar] [CrossRef]
  18. Nasser, R.; Othmen, W.B.H.; Elhouichet, H. Effect of Sb doping on the electrical and dielectric properties of ZnO nanocrystals. Ceram. Int. 2019, 45, 8000–8007. [Google Scholar] [CrossRef]
  19. Pascariu, P.; Cojocaru, C.; Olaru, N.; Samoila, P.; Airinei, A.; Ignat, M.; Sacarescu, L.; Timpu, D. Novel rare earth (RE-La, Er, Sm) metal doped ZnO photocatalysts for degradation of Congo-Red dye: Synthesis, characterization and kinetic studies. J. Environ. Manag. 2019, 239, 225–234. [Google Scholar] [CrossRef]
  20. Trandafilovic, L.V.; Jovanovi’c, D.J.; Zhang, X.; Ptasinska, S.; Dramicanin, M.D. Enhanced photocatalytic degradation of methylene blue and methyl orange by ZnO:Eu nanoparticles. Appl. Catal. B Environ. 2017, 203, 740–752. [Google Scholar] [CrossRef] [Green Version]
  21. Zak, A.K.; Majid, W.H.A.; Abrishami, M.E.; Yousefi, R. X-ray analysis of ZnO nanoparticles by Williamson–Hall and size–strain plot methods. Solide State Sci. 2011, 13, 251–256. [Google Scholar] [CrossRef]
  22. Faraz, M.; Naqvi, F.K.; Shakira, M.; Khare, N. Synthesis of samarium-doped zinc oxide nanoparticles with improved photocatalytic performance and recyclability under visible light irradiation. New J. Chem. 2018, 42, 2295–2305. [Google Scholar] [CrossRef]
  23. George, A.; Sharma, S.K.; Chawla, S.; Malik, M.M.; Qureshi, M.S. Detailed of X-ray diffraction and photoluminescence studies of Ce doped ZnO nanocrystals. J. Alloys Compd. 2011, 509, 5942–5946. [Google Scholar] [CrossRef]
  24. Anand, V.; Sakthivelu, A.; Kumar, K.D.A.; Valanarasu, S.; Ganesh, V.; Shkir, M.; Kathalingam, A.; AlFaify, S. Novel rare earth Gd and Al co-doped ZnO thin films prepared by nebulizer spray method for optoelectronic applications. Superlattices Microstruct. 2018, 123, 311–322. [Google Scholar] [CrossRef]
  25. Mukherjee, S.; Katea, S.N.; Rodrigues, E.M.; Segre, C.U.; Hemmer, E.; Broqvist, P.; Rensmo, H.; Westin, G. Entrapped Molecule-Like Europium-Oxide Clusters in Zinc Oxide with Nearly Unaffected Host Structure. Small 2023, 19, 2203331. [Google Scholar] [CrossRef]
  26. Abed, C.; Ali, M.B.; Addad, A.; Elhouichet, H. Growth, Structural and optical properties of ZnO-ZnMgO-MgO nanocomposites and their photocatalytic activity under sunlight irradiation. Mater. Res. Bull. 2019, 110, 230–238. [Google Scholar] [CrossRef]
  27. Kumar, B.R.; Hymavathi, B. X-ray peak profile analysis of solid-state sintered alumina doped zinc oxide ceramics by Williamson–Hall and size-strain plot methods. J. Asian Ceram. Soc. 2017, 5, 94–103. [Google Scholar] [CrossRef] [Green Version]
  28. Bouslama, W.; Ali, M.B.; Sdiri, N.; Elhouichet, H. Conduction mechanisms and dielectric constant features of Fe doped ZnO nanocrystals. Ceram. Int. 2021, 47, 19106–19114. [Google Scholar] [CrossRef]
  29. Manjón, F.J.; Mari, B.; Serrano, J.; Romero, A.H. Silent Raman modes in zinc oxide and related nitrides. J. Appl. Phys. 2005, 97, 053516. [Google Scholar] [CrossRef] [Green Version]
  30. Nasser, R.; Song, J.; Elhouichet, H. Epitaxial growth and properties study of p-type doped ZnO:Sb by PLD. Superlattices Microstruct. 2021, 155, 106908. [Google Scholar] [CrossRef]
  31. Althumairi, N.A.; Baig, I.; Kayed, T.S.; Mekki, A.; Lusson, A.; Sallet, V.; Majid, A.; Fouzri, A. Characterization of Eu doped ZnO micropods prepared by chemical bath deposition on p-Si substrate. Vacuum 2022, 198, 110874. [Google Scholar] [CrossRef]
  32. Yu, H.; Zhang, B.; Chen, X.; Qian, X.; Jiang, D.; Wu, Q.; Wang, J.; Xu, J.; Su, L. Color-tunable visible photoluminescence of Eu:CaF2 single crystals: Variations of valence state and local lattice environment of Eu ions. Opt. Express 2019, 27, 523–532. [Google Scholar] [CrossRef]
  33. Andrello, C.; Gouder, T.; Favergeon, L.; Desgranges, L.; Tereshina-Chitrova, E.; Havela, L.; Konings, R.J.M.; Eloirdi, R. In-situ high-resolution photoelectron spectroscopy study on interaction of sodium with UO2+x film (0 ≤ x ≤ 1). J. Nucl. Mater. 2021, 545, 152646. [Google Scholar] [CrossRef]
  34. Poornaprakash, B.; Chalapathi, U.; Sekhar, M.C.; Rajendar, V.; Vattikuti, S.P.; Reddy, M.S.P.; Suh, Y.; Park, S.-H. Effect of Eu3+ on the morphology, structural, optical, magnetic, and photocatalytic properties of ZnO nanoparticles. Superlattices Microstruct. 2018, 123, 154–163. [Google Scholar] [CrossRef]
  35. Bian, M.; Zhang, H.; Zhang, J.; Li, Z. Effects of post-annealing on photoluminescence of Eu-doped ZnO microsphere for single-component white-light materials. Optik 2020, 209, 164602. [Google Scholar] [CrossRef]
  36. Manikandan, A.; Manikandan, E.; Meenatchi, B.; Vadivel, S.; Jaganathan, S.K.; Ladchumananandasivam, R.; Henini, M.; Maaza, M.; Aanand, J.S. Rare earth element (REE) lanthanum doped zinc oxide (La: ZnO) nanomaterials: Synthesis structural optical and antibacterial studies. J. Alloys Compd. 2017, 723, 1155–1161. [Google Scholar] [CrossRef] [Green Version]
  37. Yu, K.S.; Shi, J.Y.; Zhang, Z.L.; Liang, Y.M.; Liu, W. Synthesis, Characterization, and Photocatalysis of ZnO and Er-Doped ZnO. J. Nanomater. 2013, 2013, 75. [Google Scholar] [CrossRef] [Green Version]
  38. Ghosh, S.; Nambissan, P.M.G.; Thapa, S.; Mandal, K. Defect dynamics in Li substituted nanocrystalline ZnO: A spectroscopic analysis. Physica B 2014, 454, 102–109. [Google Scholar] [CrossRef]
  39. Frodason, Y.K.; Johansen, K.M.; Galeckas, A.; Vines, L. Broad luminescence from donor-complexed LiZn and NaZn acceptors in ZnO. Phys. Rev. B 2019, 100, 184102. [Google Scholar] [CrossRef]
  40. Shen, H.; Shi, X.; Wang, Z.; Hou, Z.; Xu, C.; Duan, L.; Zhao, X.; Wu, H. Defects control and origins of blue and green emissions in sol-gel ZnO thin films. Vacuum 2022, 202, 111201. [Google Scholar] [CrossRef]
  41. Ennouri, M.; Gelloz, B.; Elhouichet, H. Impact of Ag species on luminescence and spectroscopic properties of Eu3+ doped fluoro-phosphate glasses. J. Non-Cryst. Solids 2021, 570, 120938. [Google Scholar] [CrossRef]
  42. Nouri, A.; Beniaiche, A.; Soucase, B.M.; Guessas, H.; Azizi, A. Photoluminescence study of Eu+3 doped ZnO nanocolumns prepared by electrodeposition method. Optik 2017, 139, 104–110. [Google Scholar] [CrossRef]
  43. Gao, M.; Yan, C.; Li, B.Z.; Zhou, L.J.; Yao, J.C.; Zhang, Y.J.; Liu, H.L.; Cao, L.H.; Cao, Y.T.; Yang, J.H.; et al. Strong red emission and catalytic properties of ZnO by adding Eu2O3 shell. J. Alloys Compd. 2017, 724, 537–542. [Google Scholar] [CrossRef]
  44. Kumar, D.; Singh, B.P.; Srivastava, M.; Srivastava, A.; Singh, P.; Srivastava, A.; Srivastava, S.K. Structural and photoluminescence properties of thermally stable Eu3+activated CaWO4 nanophosphor via Li+ incorporation. J. Lumin. 2018, 203, 507–514. [Google Scholar] [CrossRef]
  45. Othmen, W.B.H.; Sieber, B.; Cordier, C.; Elhouichet, H.; Addad, A.; Gelloz, B.; Moreau, M.; Barras, A.; Ferid, M.; Boukherroub, R. Iron addition induced tunable band gap and tetravalent Fe ion in hydrothermally prepared SnO2 nanocrystals: Application in photocatalysis. Mater. Res. Bull. 2016, 83, 481. [Google Scholar] [CrossRef]
  46. Chen, S.; Hu, Y.; Meng, S.; Fu, X. Study on the separation mechanisms of photogenerated electrons and holes for composite photocatalysts g-C3N4-WO3. Appl. Catal. B Environ. 2014, 150–151, 564–573. [Google Scholar] [CrossRef]
  47. Sin, J.C.; Lam, S.M.; Satoshi, I.; Lee, K.T.; Mohamed, A.R. Sunlight photocatalytic activity enhancement and mechanism of novel europium-doped ZnO hierarchical micro/nanospheres for degradation of phenol. Appl. Catal. B Environ. 2014, 148–149, 258–268. [Google Scholar] [CrossRef]
  48. Salah, N.; Hameed, A.; Aslam, M.; Abdelwahab, M.S.; Babkair, S.S.; Bahabri, F.S. Flow controlled fabrication of N doped ZnO thin films and estimation of their performance for sunlight photocatalytic decontamination of water. Chem. Eng. J. 2016, 291, 115–127. [Google Scholar] [CrossRef]
  49. Fu, M.; Li, Y.; Wu, S.; Lu, P.; Liu, J.; Dong, F. Sol–gel preparation and enhanced photocatalytic performance of Cu-doped ZnO nanoparticles. Appl. Surf. Sci. 2011, 258, 1587–1591. [Google Scholar] [CrossRef]
  50. Alkallas, F.H.; Trabelsi, A.B.G.; Nasser, R.; Mansour, S.A.; Song, J.-M.; Elhouichet, H. Promising Cr-Doped ZnO Nanorods for Photocatalytic Degradation Facing Pollution. Appl. Sci. 2022, 12, 34. [Google Scholar] [CrossRef]
  51. Hanifehpour, Y.; Soltani, B.; Amani-Ghadim, A.R.; Hedayati, B.; Khomami, B.; Joo, S.W. Synthesis and characterization of samarium-doped ZnS nanoparticles: A novel visible light responsive photocatalyst. Mater. Res. Bull. 2016, 76, 411–421. [Google Scholar] [CrossRef]
  52. Nasser, R.; Elhouichet, H.; Ferid, M. Effect of Mn doping on structural, optical and photocatalytic behaviors of hydrothermal Zn1−xMnxS nanocrystals. Appl. Surf. Sci. 2015, 351, 1122–1130. [Google Scholar] [CrossRef]
  53. Guesmi, A.; Bouzidi, C.; Elhouichet, H. Spectroscopic properties of Dy3+ doped ZnO for white luminescence applications. Spectrochim. Acta Part A Mol. Biomol. Spectrosc. 2017, 177, 164–169. [Google Scholar] [CrossRef]
  54. Kumar, S.G.; Kavitha, R. Lanthanide ions doped ZnO based photocatalysts. Sep. Purif. Technol. 2021, 274, 118853. [Google Scholar] [CrossRef]
Figure 1. XRD patterns of undoped and doped ZnO NCs.
Applsci 13 08448 g001
Figure 2. Evolution of the preferred orientation peak (1 0 1) with the doping concentration.
Applsci 13 08448 g002
Figure 3. Williamson Hall plots of undoped and doped ZnO NCs.
Applsci 13 08448 g003
Figure 4. (a) TEM image of ZnEuNa4 sample; (b) EDS spectrum of ZnEuNa4 sample.
Applsci 13 08448 g004
Figure 5. Raman spectra of undoped and Eu, Na codoped ZnO NCs.
Applsci 13 08448 g005
Figure 6. XPS spectra of the (a) Zn-2p, (b) Eu3d (c) Fitted XPS spectra of the O-1s and (d) Na1s core level regions.
Applsci 13 08448 g006
Figure 7. Absorption spectra of undoped and Eu, Na codoped ZnO NCs.
Applsci 13 08448 g007
Figure 8. PL spectra of undoped and Eu, Na codoped ZnO NCs for λexc = 366 nm.
Applsci 13 08448 g008
Figure 9. PL spectra of undoped and Eu, Na codoped ZnO NCs for λexc = 405 nm.
Applsci 13 08448 g009
Figure 10. PL decays relatives to D 0 5 F 2   7 transition (λexc = 615 nm).
Applsci 13 08448 g010aApplsci 13 08448 g010b
Figure 11. Relative photocatalytic activity of ZnO:Eu:Na NCs under sunlight irradiation.
Applsci 13 08448 g011
Figure 12. Photodegradation kinetics of RhB using the ZnO:Eu:Na photocatalysts.
Applsci 13 08448 g012
Figure 13. Effects of scavengers on the photocatalytic efficiency of ZnEuNa4 photocatalyst.
Applsci 13 08448 g013
Figure 14. Cycling photocatalysis experiment in the presence of ZnEuNa4 photocatalyst under sunlight irradiation.
Applsci 13 08448 g014
Figure 15. Proposed photocatalytic mechanism under sunlight irradiation for: (a) undoped ZnO and (b) ZnEuNa4 photocatalysts.
Applsci 13 08448 g015
Table 1. Lattice parameters and volume V of undoped and doped ZnO NCs.
SamplesZnOZnEuZnEuNa1ZnEuNa2ZnEuNa3ZnEuNa4ZnEuNa5
d 100 (Å)2.8242.8152.8222.7932.7922.7972.800
d 002 (Å)2.6122.6062.6092.5852.5852.5942.591
a (Å)3.2613.2513.2583.2253.2243.2303.233
c (Å)5.2255.2125.2195.1715.1715.1885.182
c/a1.6021.6031.6011.6031.6031.6061.602
V3)48.14247.71247.99446.59846.55846.88446.912
Table 2. Crystallite size and strain of undoped and doped ZnO NCs.
SampleZnOZnEuZnEuNa1ZnEuNa2ZnEuNa3ZnEuNa4ZnEuNa5Zn
5Na [10]
DD-Sr (nm)27.4918.6515.9415.4215.215.3015.22-
ε   (10−3)1.811.601.552.012.523.132.901.49
DW-H (nm)47.6325.0620.2621.1922.8326.2024.5724.5
Table 3. Variation of Eg and Eu with the doping concentration.
SamplesZnOZnEuZnEuNa1ZnEuNa2ZnEuNa3ZnEuNa4ZnEuNa5Zn5Na [10]ZnEu [13]
Eg (eV)3.273.283.273.253.243.233.263.383.31
Eu (eV)0.0920.0740.0940.1020.1080.1030.1000.108-
Table 4. Variations of PL lifetime and kinetic constant with the doping concentration.
SamplesZnOZnEuZnEuNa1ZnEuNa2ZnEuNa3ZnEuNa4ZnEuNa5
PL lifetime τ (ms)-0.1730.3660.4670.5270.6730.842
Kinetic constant (10−3 min−1)4.144.168.619.5411.6321.1614.49
photodegradation percentage (%)40406468759382
Disclaimer/Publisher’s Note: The statements, opinions and data contained in all publications are solely those of the individual author(s) and contributor(s) and not of MDPI and/or the editor(s). MDPI and/or the editor(s) disclaim responsibility for any injury to people or property resulting from any ideas, methods, instructions or products referred to in the content.

