Abstract
The fracture characteristics of bedded sandstone determine the stability and safety of in situ coal gasification technology. Four semicircular stratified sandstone specimens with different strengths (0.3, 0.6, 1.0, and 1.5 times that of rock matrix) and seven different bedding angles (θ = 0°, 15°, 30°, 45°, 60°, 75°, and 90°) were numerically simulated using RFPA2D-Basic V2.0 software. The SCB specimen had no prefabricated crack, and its radius was 25 mm. The loading rate was 0.000001 m/step. The results show that the fracture characteristics of the sandstone are affected by both the strength of the laminae and the angle; the fracture toughness and peak strength of the ultra-weak sandstone, as well as the weak sandstone, are reduced and more easily affected by the bedding angle; the strength rate of the strong sandstone is higher than that of the homogeneous sandstone, and the difference between the fracture characteristics of the two is not significant. This paper suggests that the key mechanism of this phenomenon is the anisotropy between the bedding and the sandstone, along with the competition/synergy between the main crack and the bedding plane bias crack during fracture propagation. These research results can provide a theoretical reference for the safety and stability of underground engineering in China.
1. Introduction
Lignite accounts for a large proportion of China’s coal reserves. According to the national coal resource survey, the proven reserves of brown coal are 131.142 billion tons. This is equivalent to 13% of China’s total coal reserves (1.00326 trillion tons) [1]. However, due to its high oxygen content, lignite is prone to spontaneous combustion. Lignite has a high water content and is difficult to store. In addition, due to the high contents of volatile substances and relatively low heat content in lignite, burning lignite for power generation often leads to serious air pollution. Therefore, China’s research focus is on the efficient and clean utilization of lignite resources. Underground in situ pyrolysis and gasification is an important method to enable clean utilization of lignite in China. Some scholars have found that one of the most effective methods is underground pyrolysis and gasification. The pyrolysis and gasification of coal refers to heating coal to high temperatures without air and producing pyrolysis products through physical and chemical changes, such as gases (CH4, H2, and CO2), liquids (tar), and solids (coke) [2,3]. In the process of underground coal pyrolysis and gasification, gas needs to seep into the outlet pipeline through the surrounding coal and rock mass, but if the gas cannot smoothly penetrate into the outlet pipeline, it may diffuse and penetrate into other surrounding rocks, causing environmental pollution [4]. In the process of coal pyrolysis and gasification, the movement of gas is mainly controlled by the permeability and mechanical properties of the surrounding coal and rock mass.
The fracture properties of layered rock mass, as shown in Figure 1, are divided into two main parts: mechanical properties, and crack propagation behavior [5]. Among them, the mechanical properties of layered rock have been studied by scholars. Li et al., (2007) conducted direct shear tests on three specimens of layered salt rock without an interlayer, pure hard gypsum, and laminated salt rock with a hard gypsum interlayer, and they obtained the shear strength parameters of the three specimens, finding that the shear strength parameters at the intersection of the hard gypsum interlayer and salt rock were slightly stronger than those of the pure laminated salt rock and pure hard gypsum specimens [6]. To investigate the effects of different test conditions on shale crack extension, Fan et al., (2008) considered the laminar dip angle, the height-to-width ratio of the specimen, and the rate of test loading, and the elastic modulus and compressive strength of the shale both decreased and then increased with the increasing angle between the laminar surface and the loading direction, while the length of the main crack increased and then decreased [7]. Nasseri et al., (1996) conducted uniaxial and triaxial tests on four types of schist and analyzed the variation of strength and deformation anisotropy with the dip angle and confining pressure in detail [8]. Wasantha et al., (2014) studied the peak strength and deformation characteristics of layered sandstone with different bedding dip angles in dry and saturated states, and they analyzed the energy dissipation characteristics of the sample under loading deformation and failure by using the monitored acoustic emission data [9]. Yao et al., (2018) found that the mechanical properties of layered sandstone under static loading showed significant differentiation with the change in the dip angle [10].
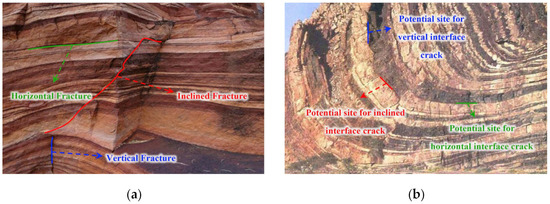
Figure 1.
(a) Layered red sandstone with vertical, horizontal, and inclined fractures through bedding contacts (Badami, India). (b) The folded layers in a valley in Namibia with potential sites for vertical, horizontal, and inclined interface cracks [11].
Some scholars have also studied the crack propagation behavior of layered rock mass, e.g., Heng et al., (2014) analyzed the influence of the bedding direction on the expansion behavior of hydraulic cracks [12]. The fracture propagation behavior of layered rock mass has also been studied by scholars; for example, using layered phyllite, Li et al., (2015) investigated the deformation and failure of layered rock mass under dynamic splitting tensile strain and discovered that there are three different failure mechanisms, depending on the bedding angle [13]. Based on the three-point bending test and Brazilian disc splitting test, Heng et al., (2015) studied the evolution mechanism of crack propagation in shale samples with well-bedding. Under the condition of three-point bending, when the bedding intersects horizontally or diagonally, the crack path will be offset along the bedding plane, and the smaller the bedding angle, the stronger the crack propagation ability will be. When the bedding is vertical, the crack will propagate along the bedding plane until the failure is complete and the fracture plane is smooth and flat. The crack propagation under the Brazilian splitting condition also has a similar phenomenon to that mentioned above [14]. Xiao (2017) studied fracture propagation behavior in sand–mudstone interbedded rock mass based on the finite element method and found that the difference between bedding strength and principal stress has a significant influence on the fracture propagation and fracturing pressure [15]. Huang et al., (2020) conducted experimental and numerical three-point bending tests on semicircular sandstone specimens with open-mode cracks to investigate the influence of bedding parameters on their mechanical fracture behavior. The experimental study focused on the effects of the loading direction and laminar dip angle on the fracture loading, fracture morphology, and damage process [16].
However, while the angle of layers, layer thickness, and layer spacing are key criteria impacting the construction, the strength qualities of the layered surface (e.g., degree of cementation) are equally important [17,18]. As a result, the author used RFPA2D-Basic software to create a numerical model of semicircular (SCB) layered sandstone specimens, and then conducted a numerical simulation study of semicircular bending with seven different laminar dips for laminated sandstone specimens containing four different strength layers of cells (without preset fractures), combined with the stress–strain curve, peak stress, acoustic emission (AE) location map (Pang et al., 2014; Zuo et al., 2019; Liu et al., 2021; Xue et al., 2021) [19,20,21,22], AE energy (or the number of events), and damage cloud map of the model. The mechanical properties and damage patterns of the laminated sandstone specimens under semicircular bending loading conditions were investigated, and the failure damage mechanism was analyzed by studying the entire process of crack initiation, extension evolution, and penetration of the sandstone specimens. This provides a theoretical reference for the safety and stability of artificial storage lanes in geothermal reservoirs in China.
2. Model Establishment and Parameter Selection
2.1. Model Building
The geometric characteristics of the numerical model and the loading method are shown in Figure 2.
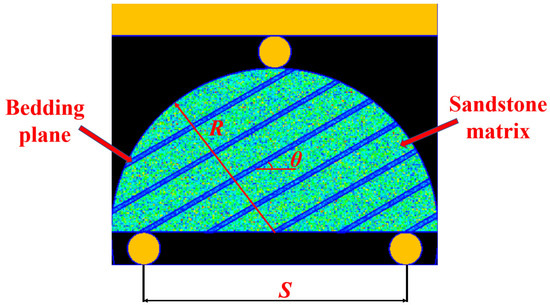
Figure 2.
The model of layered sandstone.
The height of the whole grid cell model was 40 mm, the width was 50 mm, and the grid cell was divided into 280 × 224 = 62,720 square-shaped meso-elements. The radius of the semicircular specimen model R = 25 mm; three circular rigid bodies were established as supports for the three-point bending experiment, with a radius of 2.5 mm, and the span ratio of the bottom support was taken as 0.8 (span S = 40 mm), while a bearing plate was also established at the top with the same parameters as the supports. In this paper, the angle θ between the laminar surface direction and the horizontal direction is defined as the laminar surface inclination angle, and a total of seven different laminar surface inclination angles (θ = 0°, 15°, 30°, 45°, 60°, 75°, and 90°) are set in this paper [23], with a laminar surface thickness of 0.6 mm and a layer spacing of 4.46 mm. As the bedding density remains constant, the number of beddings varies with the bedding angle in the semicircular sample model. For example, when θ = 0°, there are four bedding layers in the sample model, and when θ = 90°, there are nine bedding layers in the sample model. According to the experience of using the software, to make the simulation effect better and the calculation results more accurate, we carried out optimization of the modeling [24]. During the modeling, the mouse was used to draw the layering directly on the grid interface, instead of establishing the layering by inputting coordinate parameters. In this simulation, the loading method of displacement control in the standard model was used. The bottom of the model was fixed, and the pressure was applied on the bearing plate with the initial value set to 0.000001 m, after which each step was loaded with the same 0.000001 m until the specimen was damaged.
2.2. Parameter Selection
The macro-mechanical parameters used in this simulation of sandstone are referred to as the data measured in the uniaxial compression experiments in Peng’s paper [25], as shown in Table 1. The RFPA2D Basic V2.0 software introduced the Weibull distribution function to characterize the non-uniformity of the properties of the medium, with the homogeneity coefficient m as the link to establish the medium’s macro-mechanical parameters and mesoscopic mechanical parameters. The fine mechanical parameters of the medium can be calculated by the following fitting equation:
where Emacroscopic represents the macroscopic strength of the dielectric material, fmacroscopic represents the macroscopic elastic modulus of the dielectric material, Emicroscopic represents the mesoscopic mean of the dielectric strength, and fmicroscopic represents the mesoscopic mean of the dielectric elastic modulus.

Table 1.
Macroscopic mechanical parameters.
The homogeneity coefficient m of strength and elastic modulus is 2, and the homogeneity of Poisson’s ratio and density is 100. The calculated meso-mechanical parameters and other input parameters of the model are summarized in Table 2.

Table 2.
Model input parameters.
In this simulation study, four different bedding planes were set, and the strength of the bedding plane was taken as 0.3, 0.6, 1.0, and 1.5 times the strength of the sandstone matrix, while all other parameters were kept constant. It should be noted that the laminae with 1.0 times the strength of the matrix are homogeneous sandstone, and they were set as the control group to more intuitively reveal the effect of bedding strength on the fracture characteristics of sandstone. Due to the large coordinate parameters required to draw the bedding plane, the vertex coordinates of each bedding plane are listed in Table 3 only with the inclination angle of the bedding plane being 45°. The bedding planes are numbered from left to right.

Table 3.
Coordinate parameters of the bedding planes.
3. Analysis of the Tensile Strength
3.1. Stress–Strain Curve
The longitudinal stress–strain curves of sandstone samples with different bedding angles and strengths were drawn as shown in Figure 3. It can be seen from the figure that the longitudinal stress–strain curves of the sandstone samples in each group have similar changing trends, which have experienced an elastic deformation stage, yield stage, brittle failure stage, and residual failure stage. The curves are all straight lines at the beginning, and the stress and strain are proportional, in contrast to the experimental results of previous scholars. This is because there is a compaction stage in the conventional experimental compression process, and the compression structure of sandstone samples is denser under the action of the pressure head, so the curve is an arc curve rather than a straight line. With the continuous loading of displacement, the slope of the curve decreases somewhat, but it is not obvious. When the peak value is reached, the curve drops sharply. Brittle failure occurs in the sandstone sample at this time, and then it enters the residual failure stage, at which point the whole failure process ends. The slope of the curve decreases with continuous displacement loading, but it is not very obvious; when the peak is reached, the curve drops steeply; obviously, the sandstone specimen suffers brittle damage at this time, and then after entering the residual damage phase, to the end of the entire damage process.
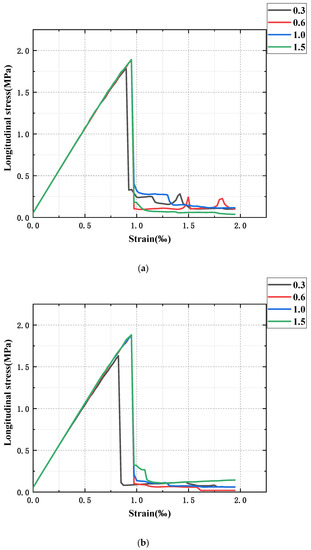
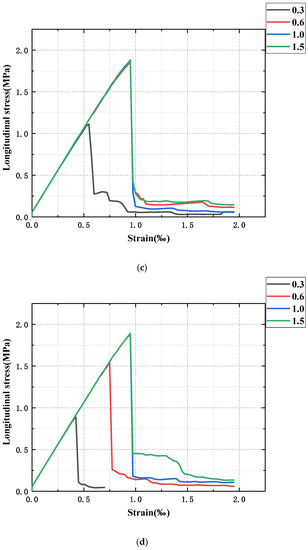
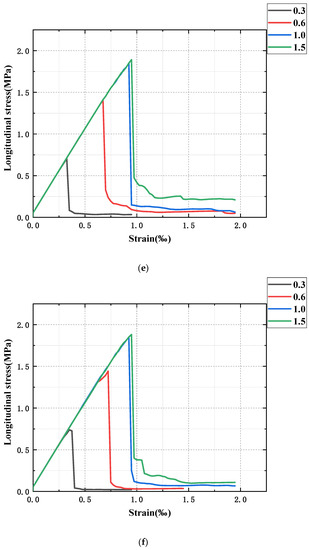
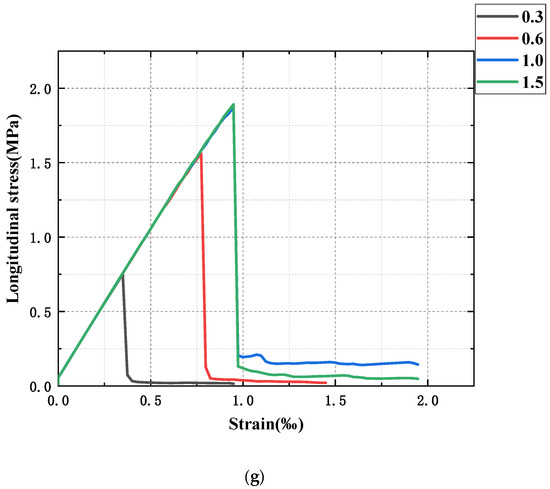
Figure 3.
Stress-strain curves of different sandstone. (a) 0°; (b) 15°; (c) 30°; (d) 45°; (e) 60°; (f) 75°; (g) 90°.
By comparing the stress–strain curves of ultra-weak bedding (bedding strength of 0.3 times the sandstone strength), weak bedding (bedding strength of 0.6 times the sandstone strength), strong bedding (bedding strength of 1.5 times the sandstone strength), and homogeneous sandstone (bedding strength of 1 times sandstone strength), we found the following: (1) With the change in the bedding angle, the strength of the ultra-weak sandstone decreases obviously. However, the variation is not linear; from 0° to 15°, the variation range is small, but when the bedding angle is greater than 30°, the strength of the ultra-weak sandstone decreases sharply, to only half of the strength of homogeneous sandstone, and reaches the minimum value at 60°, which is about 1/3 of the strength of the homogeneous sandstone. The observation of the strain value of sandstone when the fracture occurs shows that the strain of homogeneous sandstone is about 1% when the fracture occurs, while that of the ultra-weak sandstone is 0.85% when the bedding angle is 0° and drops to 0.6% when the bedding angle is 30°, and then decreases slowly with the increase in the angle until it reaches the minimum value at 60°; when the strain is less than 0.4%, the sandstone has fractured. (2) With the increase in the angle of the bedding, the change in the strength of the weakly bedded sandstone is relatively small, and there is an obvious weakening of the strength only after 45°, and the weakening is significantly smaller than that of the ultra-weak bedded sandstone; the strength of the weakly bedded sandstone decreases by 20% compared with that of the homogeneous sandstone, but it is also far beyond that of the ultra-weakly bedded sandstone, at about 1.5–2 times the strength of the latter. At the same time, the change law of strain and the strength of different layer angles are essentially the same. (3) Strong sandstone (bedding strength of 1.5 times that of sandstone) has no strength difference from homogeneous sandstone, which is somewhat stronger than the mean strength of sandstone. In addition, by comparing the curves of sandstone with different bedding angles, it was found that the strength of all sandstone with bedding strength is the highest at 0° and the lowest at 60°. With the increase in the bedding angle, the sandstone strength shows a “U”-type change pattern; that is, it first decreases, reaches the minimum value at 60 h, and then increases.
3.2. Peak Stress
According to the above stress–strain curves, the peak stress of sandstone with different bedding angles and different bedding strengths was extracted. It can be seen from Figure 4 that the peak stress of sandstone is controlled by the bedding angle θ and the bedding strength when the bedding strength is smaller than the matrix. With the increasing bedding dip angle, the peak stress of ultra-weak sandstone and weak sandstone first declines and then climbs, forming an asymmetric “U” shape as a whole, with the smallest value at 60°. Peak stress exhibits a distinct decreasing pattern from 15° to 60° and a sluggish increasing trend from 60° to 90°; when the sandstone’s bedding strength surpasses its strength, the bedding angle has no effect on the peak stress.
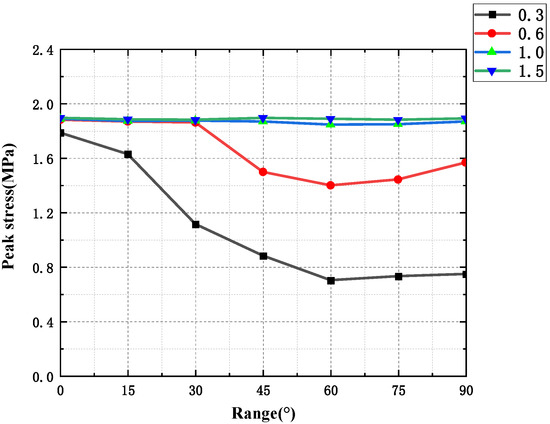
Figure 4.
Peak stress curves of different sandstone specimens.
The reason for this phenomenon is that the bedding planes of the above two specimens are both weak, and their existence will weaken the bearing capacity of the rock mass and make its failure stress level lower than that of the intact rock mass (i.e., the strength of the bedding and the matrix is equal). When θ = 0°and 15°, the damage model of the rock mass is the tensile damage that occurs through the bedding and along the bedding rupture, and the bearing capacity of the rock mass at this time mainly depends on the strength of the rock matrix, so its peak is slightly smaller than that of the intact rock mass. When θ = 30°, the damage type is mainly tension damage along with the bedding; local penetration rupture is produced, and its bearing capacity is affected by the joint influence of bedding strength and matrix strength. When θ = 60°, the damage model is tension damage completely along with the bedding, and its load-bearing capacity depends entirely on the strength of the bedding surface, so the peak value is the lowest. When θ = 45°, 75°, or 90°, the rock body occurs completely along with the bedding tension damage, and the bearing capacity mainly depends on the bedding strength, while the degree of influence of its matrix strength on the bearing capacity varies with the change in the dip angle. In addition, the interaction between cracks can also affect its carrying capacity, and the peak stress is larger than when θ = 60. When the strength of the bedding reaches the strength of the matrix, the peak stress does not affect the bedding angle. When the strength of the bedding increases within a certain range, the peak stress does not change with the strength of bedding. This is because even if the bedding strength is increased, the thickness of the bedding surface is very thin compared to the matrix, and the properties of the two are relatively similar at this time; the rock mass is a homogeneous material, and the mechanical properties are isotropic, so the bearing capacity will not be affected by anything.
4. Analysis of Damage Characteristics
In order to investigate the damage mechanism of sandstone with different bedding angles and strengths, the damage process and damage mode were studied in two aspects by combining the stress cloud map obtained from the simulations and the acoustic emission results. The various stages of the damage process of layered sandstone were analyzed in depth, and the types of damage modes of laminated sandstone under the influence of lamina strength and dip angle were summarized.
4.1. Damage Process
It is mentioned in Section 3.1 that the failure process of layered sandstone goes through the elastic deformation stage, yield stage, brittle damage stage, and residual failure stage. In this section, the acoustic emission curve and stress cloud map are combined to further study this process. It should be noted that, according to the previous results, we found that although the data on the strength and peak stress of sandstone with different bedding strengths and different bedding angles were different, the damage process was similar. Therefore, this section studies weakly layered sandstone, and the results can be applied to other sandstone.
In Figure 5, each stage of the damage process is analyzed:


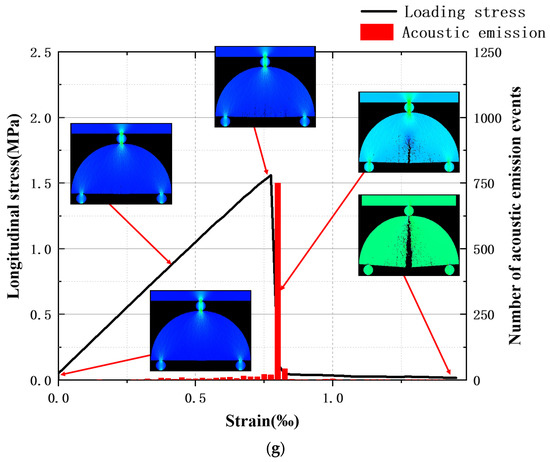
Figure 5.
Fracture processes of different sandstone: (a) 0°; (b) 15°; (c) 30°; (d) 45°; (e) 60°; (f) 75°; (g) 90°.
- Elastic deformation stage: Stress increases linearly with strain, and the slope of the curve remains constant. With the continuous loading of the displacement, the strain energy gradually accumulates, but the number of AE events does not change significantly, and no cracks are generated at this time.
- Yield stage: This is also the stage of crack emergence, expansion, and penetration. When the stress exceeds 50% of the peak value, the slope of the curve decreases somewhat, but it is not obvious; there is a trace of AE events, but no obvious fluctuations; at this time, the tiny cracks sprout. When the stress exceeds 80% of the peak value, the number of AE events fluctuates slightly, but there is no obvious increase, and the micro-cracks begin to expand and penetrate to form larger cracks. A small amount of plastic deformation occurs in the rock at this stage, but it is not significant.
- Brittle damage stage: After the stress exceeds the peak value, the curve drops suddenly, the accumulated strain energy is released instantly, and the number of AE events shows a steep increase in the number of single peaks; the cracks generated in the yield stage extend rapidly, and the specimen undergoes brittle damage.
- Residual damage stage: The brittle damage occurs in an instant, followed by the residual damage stage, where the AE signal suddenly disappears. The stress level is extremely low in this stage, and the specimen is biased. In the whole damage process, the elastic stage is the longest, followed by the yield stage. The brittle damage stage is instantaneous, so the residual damage stage, when the rock body has destroyed the end, strictly speaking, cannot be attributed to the main process of damage. The figure shows a schematic diagram of the stress bar in the y-directional stress field damage cloud, in which the negative sign represents the compressive stress and the opposite is the tensile stress. It can be seen that the y-directional stress field damage cloud varies with the stress–strain curve as follows: the stress state before the peak stage is compressive.
4.2. Destruction Mode
From the damage process, it can be seen that different bedding angles lead to different crack propagation trajectories. By compiling the shear stress damage clouds of the residual stages of the four bedding strength specimens under different bedding angles and focusing on the process of crack propagation (Figure 6), the damage patterns of each group of specimens were analyzed as follows:
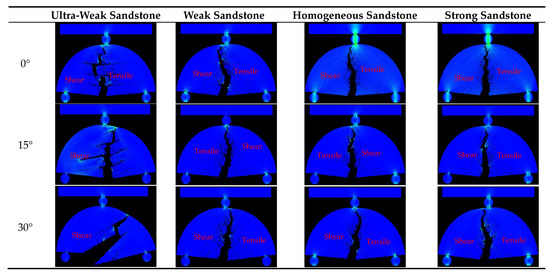
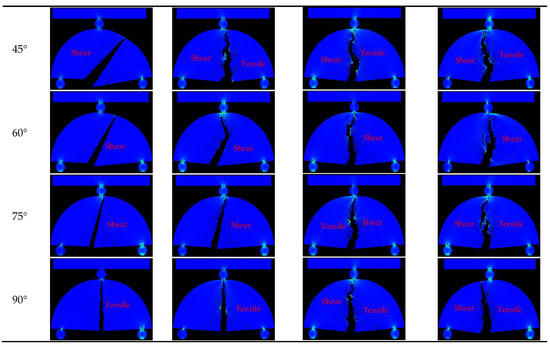
Figure 6.
Cloud images of different sandstone fracture modes.
For the ultra-weakly bedded sandstone, the rupture patterns were similar at θ = 0° and 15°. Advanced cracks occurred on the bedding plane, and multiple secondary cracks were generated along the bedding plane. The primary cracks started from the middle matrix part at the bottom of the specimen and expanded toward the loading point, but the secondary cracks led the primary cracks to migrate along the bedding surface, and the crack expansion path eventually showed an intermittent step pattern. Therefore, the rupture mode was a mixed type of tension rupture with mainly through-layer tension rupture, accompanied by the migration of the main crack along the bedding surface. When θ = 30°, 45°, 60°, 75°, or 90°, the layered surface will also rupture superficially, and multiple cracks along the layered surface will appear. With the loading of displacement, these cracks interact with one another; that is, the cracks in the rock body fracture competitively with one another, and eventually the crack at a certain layer “win” becomes the main crack and expands until the end of the damage. When θ = 30°, the crack expands mainly along the 30° bedding plane, but localized penetration rupture occurs in the process. Therefore, the damage mode is dominated by the tension rupture along the bedding surface, and local tension rupture through the layers is produced. At other angles, the cracks expand along the bedding plane until the end of the damage, so the entire damage mode is tension rupture along the laminae.
In the case of weakly bedded sandstone, the damage patterns are similar for θ = 0°, 15°, 30°, and 45°. Advanced cracks still occur on the bedding plane, but they are not as obvious as when the bedding strength is 0.3 times, and the guiding effect of secondary cracks on the main crack is obviously weakened. The damage model is still a mixed type of tension rupture with mainly tension rupture through the plies, accompanied by the migration of the main crack along the bedding plane. With the increase in the bedding inclination angle, the extension direction of the main crack tends to be more vertical. When θ = 60°, the damage mode is mainly tension rupture along the bedding plane, and the transbedding tensile fracture occurs locally. When θ = 75° and 90°, the crack completely develops a tensile fracture along the bedding plane.
In the case of the strongly bedded sandstone, the damage pattern of each laminated dip specimen is very similar to that of the homogeneous sandstone, which shows that the strength and dip angle of the bedding have little effect on the damage pattern of the specimens at this time, and the damage patterns that occur are essentially the same, with all of them being tension rupture through the layers in the direction of the loading point. Among them, when the bedding angle is 30° and 60°, there is a great difference between the fracture trajectory of homogeneous sandstone and the fracture trajectory of the two in the form of “symmetry”. These two bedding angles lead to relatively active offset fractures and frequent shear fractures, leading to a large offset of the main fractures, similar to ultra-weak sandstone. The peak stresses during the fracture of sandstone with different bedding strengths all reach the minimum value at the bedding angle of 60°, which also indicates that the offset cracks show a certain activity at this time. A portion of the stress is applied along the direction of the bedding plane, causing a shear fracture to occur and, thus, the crack deflection phenomenon.
5. Discussion
Combining the contents of Section 3 and Section 4, we believe that there are two main reasons for the different fracture characteristics of sandstone with different bedding angles and different bedding strengths: Anisotropy between the bedding and the sandstone, along with the competition/synergy between the main cracks and the bedding surface, offsets cracks during fracture expansion. The sandstone fracture characteristics of different bedding strengths are mainly because of the former, and the sandstone fracture characteristics of different bedding angles are mainly because of the latter. The effects of the lamina angle and the bedding strength on the fracture characteristics of sandstone are discussed in detail in both directions below.
5.1. Lamination and Sandstone Anisotropy
By comparing the fracture modes of the four sandstone specimens, we found that the crack propagation trajectories of ultra-weak sandstone and homogeneous sandstone are quite different, which we attributed to the large anisotropy between the bedding strength and the collective strength of the sandstone. Based on the stress–strain curve, we can see that the strength of ultra-weak bedding is worse than that of homogeneous sandstone. According to the peak stress curve and Formulas (2) and (3), it can be concluded that the fracture toughness of ultra-weak sandstone is also relatively poor.
where KIC is the fracture toughness, Pmax is the fracture load, is the critical dimensionless factor derived from the finite element method, and . The strength and the fracture toughness increase as the strength of the laminae increases; therefore, we believe that the strength and the fracture toughness of the ultra-weakly laminated sandstone bedding are small and cause the overall strength and fracture toughness to be affected. When the ultra-weakly laminated sandstone receives external load through divine tension damage, it is relatively more prone to fracture due to the low laminar fracture toughness. Due to the presence of the bedding and the adhesive force between it and the sandstone matrix, the fractured bedding structure will exert some tension on the sandstone matrix in the horizontal direction, which will cause the sandstone matrix to fracture under a much smaller load. The difference between the bedding strength and fracture toughness of weakly bedded sandstone and those of the sandstone matrix is small, so the overall strength and fracture toughness of weakly bedded sandstone will decrease, but the decrease is small. As for the strongly bedded sandstone, because its bedding strength and fracture toughness are greater than those of the sandstone matrix, when the sandstone matrix fractures, its bedding has not yet fractured, so some compressive force will be applied to the sandstone matrix in the horizontal direction. Therefore, the peak stress of strongly stratified sandstone will be slightly higher than that of homogeneous sandstone.
In addition, when the crack propagates unsteadily in the vertical layer of the layered material, the laminar peeling phenomenon will occur due to the relatively weak inter-laminar bonding force. We can imagine the laminated sandstone as a whole consisting of several individual sandstone layers as well as a combination of laminae, and each sandstone layer is subjected to different tensile forces when the cracks expand. In the case where the strength of the bedding plane, as well as the fracture toughness, is less than that of the sandstone matrix, when the first sandstone layer cracks, the second sandstone layer is subjected to a greater tensile force than the first, because the bedding plane exerts a tensile force on the second part of the sandstone, and so on—the individual sandstone layers are subjected to increasing tensile forces, so the laminated sandstone in general will fracture under smaller loads. Conversely, when the strength and fracture toughness of the bedding surface are smaller than those of the sandstone matrix, the individual sandstone layers are subjected to less and less tensile force due to the compressive force exerted by the bedding on the sandstone matrix, so the laminated sandstone as a whole needs a greater load to fracture.
5.2. Competition/Synergy between the Main Crack and the Layer Surface Offset Crack
By comparing the fracture extension trajectories of ultra-weakly laminated sandstone with different lamina angles, we found that they were more different from those of homogeneous sandstone. It is obvious from the fracture mode diagram that the interference of the bedding plane during the crack extension—especially at 0°–30°—causes the main crack of the fracture to be severely disturbed by the bedding plane. This is due to the inter-laminar slip effect. When the bedding intersects the loading direction obliquely at a small angle (θ < 45°), the sandstone specimens from the interfacial shear slip at the bedding plane under the axial load. As there is less adhesion between the bedding plane and the sandstone matrix, shear slip causes the bedding plane to separate from the sandstone matrix, resulting in the appearance of offset cracks along the bedding plane. When the bedding angle is small, the offset cracks favor the horizontal direction and the main cracks favor the vertical direction, and the competition between them leads to a large variation in the crack expansion trajectory. When the bedding angle is large, the offset cracks are biased in the vertical direction and the main crack is also in the vertical direction, and the two do not compete with one another, but instead promote one another, so the crack expansion trajectory does not change much.
6. Conclusions
The deformation damage characteristic was evaluated using the finite element program RFPA2D Basic V2.0, based on three-point bending tests of semicircular beam (SCB) specimens, and considering the layer inclination and strength. The following are the key findings of this study:
Under the influence of the weak surface and dip angle of laminae, the mechanical properties of sandstone have significant anisotropy. When the lamina strength is 0.3 and 0.6 times that of the rock matrix, the peak stress tends to decrease and then increase with the increase in the lamina dip angle, the overall shape is similar to a “U”, and θ = 60° is the cutoff point, i.e., the peak stress is the smallest at this time; under the same lamina dip angle, the peak stress gradually increases with the increase in the lamina.
The failure mode of sandstone is controlled by the joint control of the weak surface of the lamina and the dip angle. When θ = 0° and 15°, the weak plane will show advanced fracture along the bedding direction, and the secondary cracks will lead the main crack to migrate along the bedding direction and then hinder the main crack from expanding in the direction of the loading.
When θ = 30°, 45°, 60°, 75°, or 90°, several cracks appear on the weak surface along the bedding direction, and one of the cracks finally competes successfully and begins to expand. When θ = 30°, the cracks partially break through the bedding, while at other angles the cracks continue to expand along the bedding direction until the end of failure.
The number of AE events corresponds to the failure mode, and the distribution range of AE events is the widest when the sample has a mixed fracture of cross-layer fracture and the fracture along the bedding plane. The distribution range of AE events is the smallest when the fracture is completely along the bedding plane. When pure translaminar rupture occurs, AE events have a small distribution range.
When the strength of the bedding is weaker than that of the rock matrix, the cumulative number of AE events at θ = 0° and 15° gradually decreases with the strengthening of the bedding. The cumulative number of AE events at θ = 30° first increases and then decreases, while the cumulative number of AE events at the remaining dip angles gradually increases, and when the strength of the laminae reaches that of the rock matrix, the cumulative number of AE events at all dip angles tends to be equal.
There was no preset crack in this study, and the failure type was not affected by the bedding strength and dip angle. According to the AE location maps of each sample, it can be seen that the failure type was a tensile failure. By observing the whole process of crack propagation, the failure mode of the samples can be divided into the following four types: pure lamellar tensile failure; dominant translaminar tensile fracture, accompanied by the migration of the main crack along the bedding plane; dominant tensile fractures along the bedding, with transbedding tensile fractures occurring locally; and complete tensile fracture along the bedding.
Author Contributions
Conceptualization, G.W. and T.M.; methodology, T.M., G.W. and G.F.; investigation, G.W. and T.M.; resources, L.M.; software, W.Y.; formal analysis, Z.Z.; writing—original draft preparation, Z.Z.; writing—review and editing, Y.H.; project administration, X.L. All authors have read and agreed to the published version of the manuscript.
Funding
This research was funded by the financial support from the Youth Program of the National Natural Science Foundation of China (51904195), the Scientific and Technological Innovation Programs of Higher Education Institutions in Shanxi (2019L0640), the Key Research and Development Project of Shanxi Province (201903D121025), the Fundamental Research Program of Shanxi Province (201901D211300; 20191142), TYUST-SRIF (20172018), and the Outstanding Doctoral Award Fund in Shanxi Province (20192032). Experimental data can be found at the NGDC repository of the British Geological Survey (ID 136076). We also wish to thank the National Natural Science Foundation of China (Grant No. 52104143); The Fundamental Research Funds for the Central Universities (Grant No. 2021SCU12039); and the Natural Science Foundation of Sichuan Province, China (Grant No. 2022NSFSC0193).
Data Availability Statement
No new data were created or analyzed in this study. Data sharing is not applicable to this article.
Conflicts of Interest
The authors declare no conflict of interest.
References
- Yin, L.Q. Lignite resources and utilization outlook in China. Coal Sci. Technol. 2004, 8, 12–14. (In Chinese) [Google Scholar]
- Anthony, D.B.; Howard, J.B. Coal devolatilization and hydrogastification. AIChE J. 1976, 22, 625–656. [Google Scholar] [CrossRef]
- Arenillas, A.; Rubiera, F.; Pis, J.J.; Cuesta, M.; Iglesias, M.; Jiménez, A.; Suárez-Ruiz, I. Thermal behaviour during the pyrolysis of low rank perhydrous coals. J. Anal. Appl. Pyrolysis 2003, 68–69, 371–385. [Google Scholar] [CrossRef]
- Humenick, M.J.; Mattox, C.F. Groundwater pollutants from underground coal gasification. Water Res. 1978, 12, 463–469. [Google Scholar] [CrossRef]
- Tian, Z.; Tang, C.; Liu, Y.; Tang, Y. Zonal disintegration test of deep tunnel under plane strain conditions. Int. J. Coal Sci. Technol. 2020, 7, 337–349. [Google Scholar] [CrossRef]
- Li, Y.P.; Jiang, W.D.; Liu, J.; Chen, J.W.; Yang, C.H. Direct shear test of deep layered salt rock in Yunying Salt Mine, Hubei Province. J. Rock Mech. Eng. 2018, 26, 6. [Google Scholar]
- Fan, X.Y.; Guo, D.Y.; Zhang, Q.G.; Xu, F.L.; Liang, Y.C.; Lu, X.W. Experimental study on shale crack propagation mechanism considering bedding, loading rate and size effects. Sci. Technol. Eng. 2018, 18, 9. [Google Scholar]
- Nath, F.; Mokhtari, M. Optical visualization of strain development and fracture propagation in laminated rocks. J. Pet. Sci. Eng. 2018, 167, 354–365. [Google Scholar] [CrossRef]
- Wasantha, P.L.P.; Ranjith, P.G.; Shao, S.S. Energy monitoring and analysis during deformation of bedded-sandstone: Use of acoustic emission. Ultrasonics 2014, 54, 217–226. [Google Scholar] [CrossRef]
- Yao, N.; Ye, Y.C.; Wang, Q.H.; Luo, B.Y.; Wang, W.Q. Numerical simulation of uniaxial compression behavior of gently inclined layered rock mass by particle flow. J. Eng. Geol. 2018, 26, 9. [Google Scholar]
- Alneasan, M.; Behnia, M.; Bagherpour, R. Analytical investigations of interface crack growth between two dissimilar rock layers under compression and tension. Eng. Geol. 2019, 259, 105188. [Google Scholar] [CrossRef]
- Heng, S.; Yang, C.H.; Cao, Y.J.; Guo, T.Y.; Wang, L.; Hou, Z.K. Experimental study on fracture morphology of shale hydraulic fracturing. J. Geotech. Eng. 2014, 36, 9. [Google Scholar]
- Li, Q. The view of technological innovation in coal industry under the vision of carbon neutralization. Int. J. Coal Sci. Technol. 2021, 8, 1197–1207. [Google Scholar] [CrossRef]
- Heng, S.; Yang, C.H.; Guo, T.Y.; Wang, C.Y.; Wang, L. Effect of bedding on hydraulic fracture propagation in shale. J. Rock Mech. Eng. 2015, 34, 228–237. [Google Scholar]
- Xiao, W. Propagation of fracture in thin interbedded sand and mudstone. J. Chengde Pet. Coll. 2017, 19, 4. [Google Scholar]
- Huang, D.; Li, B.; Ma, W.-Z.; Cen, D.-F.; Song, Y.-X. Effects of bedding planes on fracture behavior of sandstone under semi-circular bending test. Theor. Appl. Fract. Mech. 2020, 108, 102625. [Google Scholar] [CrossRef]
- Kawakami, G.; Kawamura, M. Sediment flow and deformation (SFD) layers: Evidence for intrastratal flow in laminated muddy sediments of the Triassic Osawa Formation, northeast Japan. J. Sediment. Res. 2002, 72, 171–181. [Google Scholar] [CrossRef]
- He, J.; Afolagboye, L.O. Influence of layer orientation and interlayer bonding force on the mechanical behavior of shale under Brazilian test conditions. Acta Mech. Sin. 2018, 34, 349–358. [Google Scholar] [CrossRef]
- Pang, Y.; Wang, G.; Ding, Z. Mechanical model of water inrush from coal seam floor based on triaxial seepage experiments. Int. J. Coal Sci. Technol. 2014, 1, 428–433. [Google Scholar] [CrossRef]
- Zuo, J.; Wang, J.; Jiang, Y. Macro/meso failure behavior of surrounding rock in deep roadway and its control technology. Int. J. Coal Sci. Technol. 2019, 6, 301–319. [Google Scholar] [CrossRef]
- Liu, B.; Zhao, Y.; Zhang, C.; Zhou, J.; Li, Y.; Sun, Z. Characteristic strength and acoustic emission properties of weakly cemented sandstone at different depths under uniaxial compression. Int. J. Coal Sci. Technol. 2021, 8, 1288–1301. [Google Scholar] [CrossRef]
- Xue, D.; Lu, L.; Zhou, J.; Lu, L.; Liu, Y. Cluster modeling of the short-range correlation of acoustically emitted scattering signals. Int. J. Coal Sci. Technol. 2021, 8, 575–589. [Google Scholar] [CrossRef]
- Fu, J.; Haeri, H.; Sarfarazi, V.; Naderi, A.A.; Marji, M.F.; Xu, L. Influence of arch shaped notch angle, length and opening on the failure mechanism of rock like material and acoustic emission properties: Experimental test and numerical simulation. Theor. Appl. Fract. Mech. 2023, 125, 103879. [Google Scholar] [CrossRef]
- Sarfarazi, V.; Naderi, A.; Zhou, L.; Haeri, H.; Fatehimarji, M. Study on shear fracture behavior of soft filling in concrete specimens: Experimental tests and numerical simulation. Struct. Eng. Mech. 2023, 85, 337–351. [Google Scholar]
- Peng, Y.; Liu, G.; Wang, C.Y.; Wang, D.C.; Jia, P. Effect of inhomogeneity on macroscopic creep characteristics of sandstone. Sichuan Build. Mater. 2021, 47, 82–83, 85. [Google Scholar]
Disclaimer/Publisher’s Note: The statements, opinions and data contained in all publications are solely those of the individual author(s) and contributor(s) and not of MDPI and/or the editor(s). MDPI and/or the editor(s) disclaim responsibility for any injury to people or property resulting from any ideas, methods, instructions or products referred to in the content. |
© 2023 by the authors. Licensee MDPI, Basel, Switzerland. This article is an open access article distributed under the terms and conditions of the Creative Commons Attribution (CC BY) license (https://creativecommons.org/licenses/by/4.0/).