Article

Safety Assessment and Uncertainty Quantification of Electromagnetic Radiation from Mobile Phones to the Human Head

1
College of Electrical Engineering, Automation Jilin Jianzhu University, Changchun 130118, China
2
Key Laboratory for Comprehensive Energy Saving of Cold Regions Architecture of Ministry of Education, Jilin Jianzhu University, Changchun 130118, China
*
Author to whom correspondence should be addressed.
Appl. Sci. 2023, 13(14), 8107; https://doi.org/10.3390/app13148107
Submission received: 1 June 2023 / Revised: 7 July 2023 / Accepted: 10 July 2023 / Published: 12 July 2023

Abstract

:
With the rapid development of the mobile communication technology, the design of mobile phones has become more complex, and research on the electromagnetic radiation from mobile phones that reaches the human head has become important. Therefore, first of all, a model of mobile phone daily use was established. Then, based on the established simulation model, the safety of human head exposure to mobile phones was evaluated. The generalized polynomial chaos (gPC) method was used to establish a proxy model of the specific absorption rate (SAR) of the human head at different frequencies to perform a parameter uncertainty quantification (UQ). Finally, the Sobol method was used to quantify the influence of relevant variables on the SAR. The simulation results showed that the gPC method can save time and cost while ensuring accuracy, and the SAR value is greatly influenced by the electromagnetic materials of the mobile phone shell. Combined with the above analysis, this paper can provide reasonable suggestions for the design of mobile phone electromagnetic materials.

1. Introduction

With the rapid development of the electromagnetic wave technology, people rely more and more on mobile phones. The electromagnetic radiation generated by the use of mobile phones has increasingly serious adverse effects on important parts of the human body, such as the head and the heart, which has also become a cause for concern [1,2]. A portion of in vitro and in vivo research studies have indicated that electromagnetic radiation directly affects biological systems [3,4]. The Institute of Electrical and Electronics Engineers (IEEE) and The International Commission for Non-ionizing Radiation Protection (ICNIRP) have formulated relevant human electromagnetic field exposure limit standards [5,6], which have been applied in the research on the safety assessment of antenna electromagnetic exposure [7]. Experiments have shown that even the current acceptable radiation value for mobile phones will lead to metabolic changes in the brain, with unknown results. With the acceptable electromagnetic radiation value, difficulties in the design of mobile phones and antennas have become more acute. For SAR measurement methods, international standards specify the relevant measurement criteria [8]. The quantification of the SAR of mobile phone electromagnetic radiation by the human head, has high time and economic costs; so, it is necessary to use computer simulations to simulate the electromagnetic radiation emitted by mobile phones to the human head. A heterogeneous source term identified by medical imaging using pixel information quantified into greyscale numbers and Hounsfield units has been very helpful in quantifying the SAR [9,10]. Even if laboratories use the same mobile phone model, the same material parameters, and the same electromagnetic simulation software, the calculation results of electromagnetic radiation simulation calculations will contain errors due to the uncertainty of the electromagnetic parameters [11]. Obviously, the uncertainty quantification of the electromagnetic radiation from mobile phones to the human head has become an urgent problem to be solved, but this is a challenging task. In this paper, the gPC method was used to construct a SAR computational proxy model for UQ.
The core idea of the gPC method is to represent the random response as a linear combination of polynomials [12,13]. The Monte Carlo (MC) method is based on the law of large numbers and requires an extremely accurate analysis, which implies a large computational cost [14]. Compared with the MC method, the gPC method has a relatively high calculation accuracy and does not need to calculate the derivative information of the function. In addition, once the function expansion of the random response is completed, any statistics can be easily obtained. However, the computation amount of the gPC method will increase significantly with the increase of the polynomial expansion order. In order to improve the computational efficiency, Baltman et al. proposed a variety of adaptive regression methods [15,16], which retain the main terms and low-order cross terms in the orthogonal polynomial expansion, while ignoring some unimportant high-order cross terms. Thus, the calculation efficiency is greatly improved. The MC method is a traditional UQ method used to calculate the statistical characteristics of a model. In electromagnetic simulations, the calculation cost of the model is very high; so, it is necessary to properly select the sample size of the MC method. In other engineering applications, usually 10,000 runs of the simulation in the MC method were verified [17,18]. In this paper on electromagnetic radiation, considering the computational cost and accuracy, 1000 runs of the MC method were used in the simulation model to verify the effectiveness of the above gPC method.
The Sobol method is the most classic global sensitivity analysis method [19]. This method decomposes the variance into a function of a single parameter and a combination of multiple parameters, decomposes the original model, and performs a large number of calculations to quantify the impact of different parameters and combinations on the model. The first-order sensitivity index indicates the influence of a single variable on the overall model, the second-order sensitivity index and the higher-order sensitivity index indicate the influence of the relationship between multiple variables on the model, and the total sensitivity index includes the total impact of the first-order sensitivity and higher-order sensitivity indices. In this paper, the combination of the gPC and Sobol global sensitivity analysis methods was used to realize the fast calculation of the Sobol global sensitivity index and normalize the obtained sensitivity, which can quantify the impact of different variables and combinations of variables on the model output.
The content of this paper is as follows: the second section of this paper introduces the gPC method and its solution and the sensitivity analysis method based on the PC-based Sobol index; in the third section, an electromagnetic simulation model of a mobile phone and mobile phone antenna, a human head electromagnetic simulation model, and the electromagnetic radiation scene are presented; in the fourth section, the SAR of the human head subjected to electromagnetic radiation at different frequencies is evaluated, the uncertainty of the SAR of the human head is quantified by the gPC method, and its global sensitivity is analyzed. Compared with the MC method, the accuracy and efficiency of the proposed method are described, reporting the calculation results and a discussion; the fifth section presents the conclusion.

2. Parameter Uncertainty Quantification Method

2.1. gPC Method

The generalized chaotic polynomial method was used to solve the uncertainty of electromagnetic radiation. First, the original model was expressed as a functional Y, and then the functional model was expanded in the form of a generalized chaotic polynomial. The expanded result is:
Y = c 0 I 0 + i 1 = 1 c i 1 I 1 ξ i 1 + i 1 = 1 i 2 = 1 i 1 c i 1 i 2 i 1 i 2 I 2 ξ i 1 , ξ i 2 + i 1 = 1 i 2 = 1 i 1 i 3 = 1 i 2 c i 1 i 2 i 3 I 3 ξ i 1 , ξ i 2 , ξ i 3 + = i = 0 c ^ i Φ i ξ
In the above formula, I n ξ i 1 , , ξ i n is the nth-order representation of the mixed orthogonal polynomial, which is a function of the multidimensional standard random variable ξ i 1 , , ξ i n . Φ i ξ is composed of the product of one-dimensional orthogonal polynomial basis functions. Each basis function corresponds to a different random variable. Table 1 lists the orthogonal polynomial basis functions corresponding to different distribution types. Each distribution type has its own unique orthogonal polynomial basis functions. The variables in this paper showed normal distribution and uniform distribution.
Formula (1) shows that the chaotic polynomial expansion contains infinite items but cannot handle infinite items in the actual calculation. In order to improve the calculation efficiency, it is usually necessary to truncate the chaotic polynomial, and the truncation order is the P order. Therefore, the generalized chaotic polynomial expansion model can be expressed by truncating the expansion (2):
Y = i = 0 p c ^ i Φ i ξ
c ^ i is a polynomial coefficient. After the P-order truncation of the generalized chaotic polynomial expansion, the expansion contains the Q terms, and the p polynomial expansion terms remains after the first term is removed. The specific value of Q is related to the truncation order P and the dimension d, which can be expressed as:
Q = 1 + p = d + P ! d ! P !
The chaotic polynomial in Formula (3) should satisfy:
Φ i ξ Φ j ξ = Φ i ξ Φ j ξ W ξ d ξ = Φ i 2 δ i j
In Formula (4), represents the inner product operation in multidimensional space, and its weight function W ξ is the product of the one-dimensional weight function corresponding to each dimension random variable ξ 1 , , ξ d , which is the Kronecker function δ i j :
δ i j = 1 , i = j 0 , i j
Then, we used the random response surface method to solve chaotic polynomials.

2.2. Random Response Surface Method

In the calculation process of the PC method, calculating the expansion coefficient is a crucial step. Isukapalli first proposed a method based on linear regression to solve the PC coefficient [20], which mainly constructs the response surface based on random probability space and can only use the Hermite orthogonal polynomial to construct the chaotic polynomial expansion model at the earliest. In this paper, it was extended to the gPC expansion model, and the calculation process of the stochastic response surface method adopted in this paper was as follows:
a.
Construction of the generalized chaotic polynomial expansion model
Through the determination of the input variables and output variables of the system, according to their different distribution types and truncation processing, we obtained a chaotic polynomial model that can be expressed in a truncated polynomial form; the model is
Y = i = 0 p b ^ i Φ i ξ
To distinguish it from Equation (2), the polynomial coefficients to be found are expressed as b ^ i , where ξ is a set of D-dimensional standard random variables ξ 1 , , ξ d .
b.
Estimation of the coefficient of interest
(1) A certain number of sample points were selected by the MC method, and n valid samples ξ S = ξ 1 S , , ξ j S , , ξ N S T were selected from the standard random space, where each sample point was denoted as S, i.e., ξ j S is ξ j S = ξ j 1 S , , ξ j d S .
(2) The sample points were transformed from the standard random space to the original random space, obtaining:
X j 1 S = T 1 ξ j 1 S , , X j i S = T i ξ j i S , , X j d S = T d ξ j d S
j i S = T i ξ j i S represents the value of the one-dimensional sample point ξ j i S in the j-th sample point in the original random space. For example, X i in the formula obeys a normal distribution, and ξ i is a standard normal random variable, then:
T i ξ j i S = σ X i ξ j i S + μ X i
σ X i and μ X i represent the mean and standard deviation of the one-dimensional random input variable c, respectively.
(3) The real response function value obtained after calculating the selected effective sample points through the original model to obtain the response function g(X) can be expressed as:
G = g X 1 S , , g X N S T
g X N S indicates the true response function value of the Nth sample point.
(4) Using least-squares regression to estimate the coefficients and then substituting the sample ξ S = ξ 1 S , , ξ j S , , ξ N S T and its true response function value G = g X 1 S , , g X N S T into the gPC expansion model, respectively, we obtained the following expressions:
Φ 0 ξ 1 S Φ 1 ξ 1 S Φ P ξ 1 S Φ 0 ξ 2 S Φ 1 ξ 2 S Φ P ξ 2 S Φ 0 ξ N S Φ 1 ξ N S Φ P ξ N S b 0 b 1 b p = g X 1 S g X 2 S g X N S
The above formula can be abbreviated as Ab = G, where the matrix A can be expressed as:
A = Φ 0 ξ 1 S Φ 1 ξ 1 S Φ P ξ 1 S Φ 0 ξ 2 S Φ 1 ξ 2 S Φ P ξ 2 S Φ 0 ξ N S Φ 1 ξ N S Φ P ξ N S , b = b 0 b 1 b p , G = g X 1 S g X 2 S g X N S
Finally, the coefficients of the polynomial chaotic could be obtained by the Formula:
b = A A T 1 A T G
The above process completed the solution of the gPC coefficients, and the analytical solution obtained by solving the proxy model could then be used to estimate the statistical properties of the output Y = g(X) of the constructed gPC proxy model using the MC method.

2.3. Global Sensitivity Analysis

The combination of the generalized chaotic polynomial and the Sobol global sensitivity analysis method was used to realize a fast calculation of the Sobol global sensitivity index. By combining the coefficients of the chaotic polynomial, the global sensitivity index of different random input variables can effectively obtained, and the first-order sensitivity index is obtained as:
S X i = V a r E Y | ξ i V a r Y = i I i c ^ i 2 E φ i 2 i = 1 m 1 c ^ i 2 E φ i 2
ξ i represents the corresponding standard normal random variable x i , I i represents the set of polynomials φ i containing only the random variable ξ i , and c ^ i represents the coefficient of the polynomial φ i . E φ i 2 can be calculated by the following formula:
E φ i 2 = i 1 ! i 2 ! i n ! = i = 1 n i i !
where n is the dimension of the random input variables in the model. Through the above analysis and using the coefficients of the chaotic polynomial, the total sensitivity index of the input parameters X i can be expressed as:
S X i T = 1 S X i
S X i indicates to add all items not related to x and the corresponding Sobol global sensitivity index. The Sobol first-order sensitivity index S X i and the total sensitivity index S X i T of the random input variables X i can be obtained directly by using the generalized chaotic polynomial method, which is faster and more efficient than the Monte Carlo method. In addition, with the increase of the truncated order of the generalized chaotic polynomial, the calculation accuracy will be improved accordingly. Therefore, the generalized chaotic polynomial method is feasible to solve the sensitivity analysis problem.

3. Electromagnetic Simulation Model and Electromagnetic Radiation Scenarios

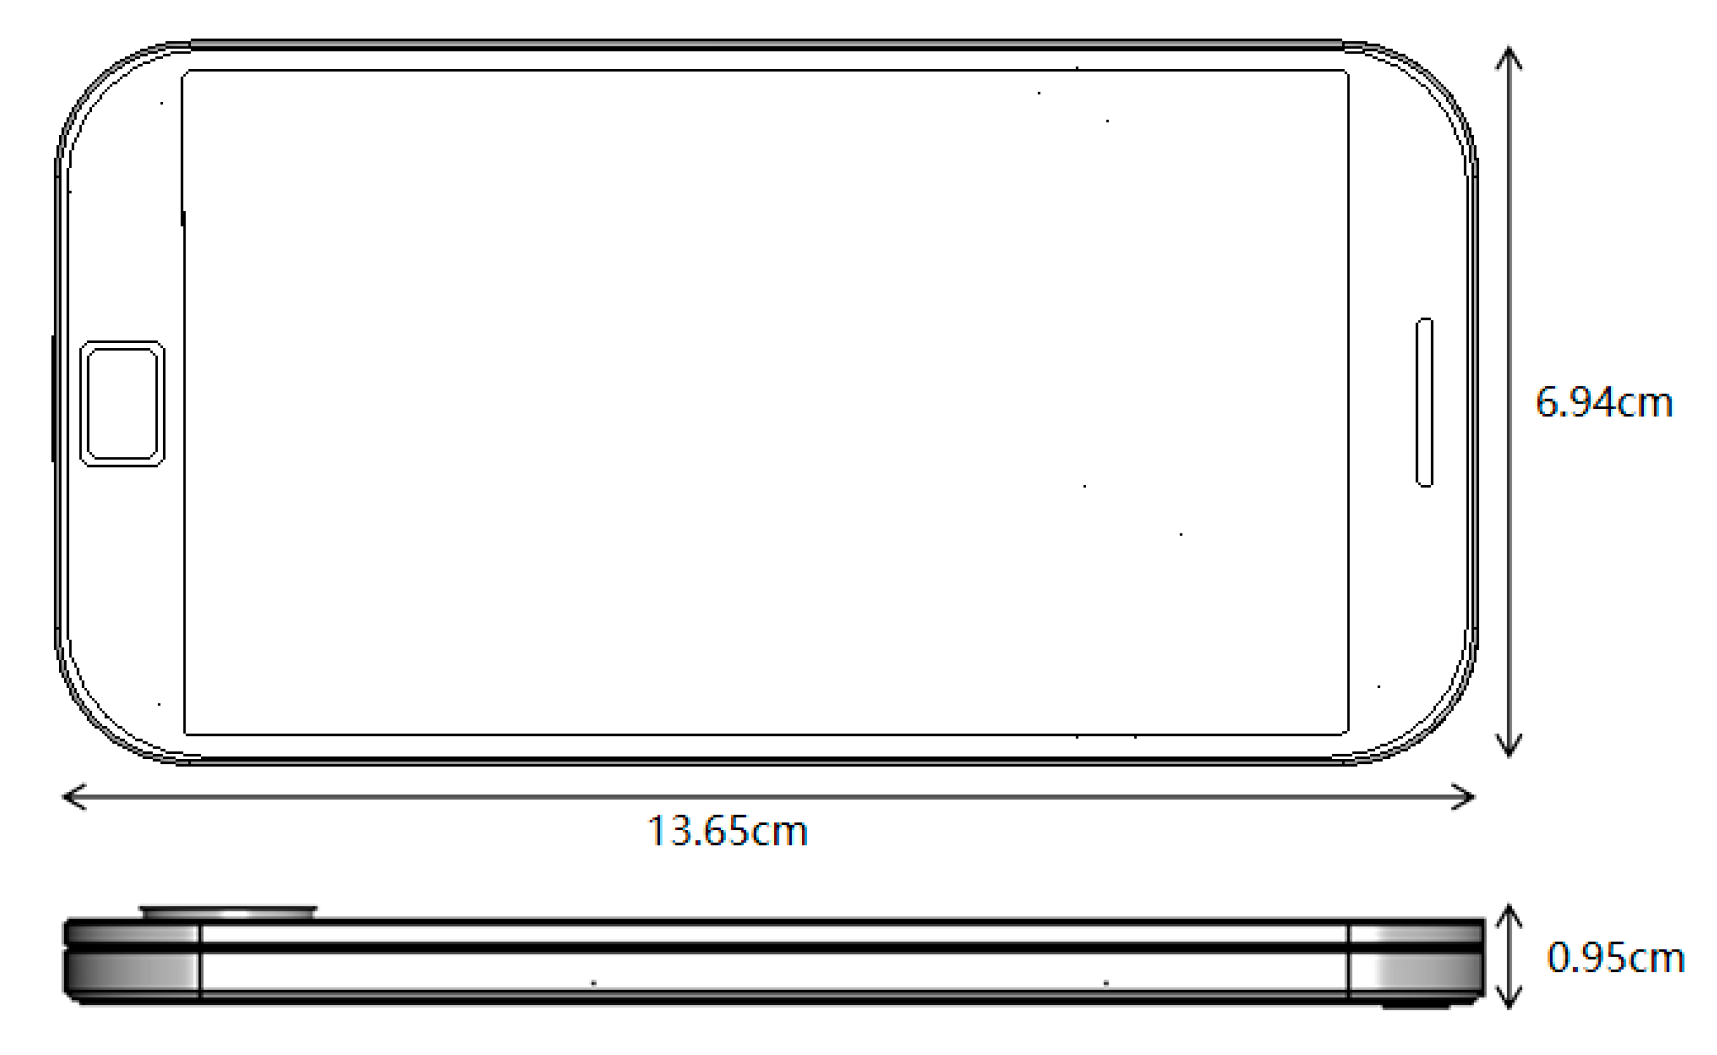
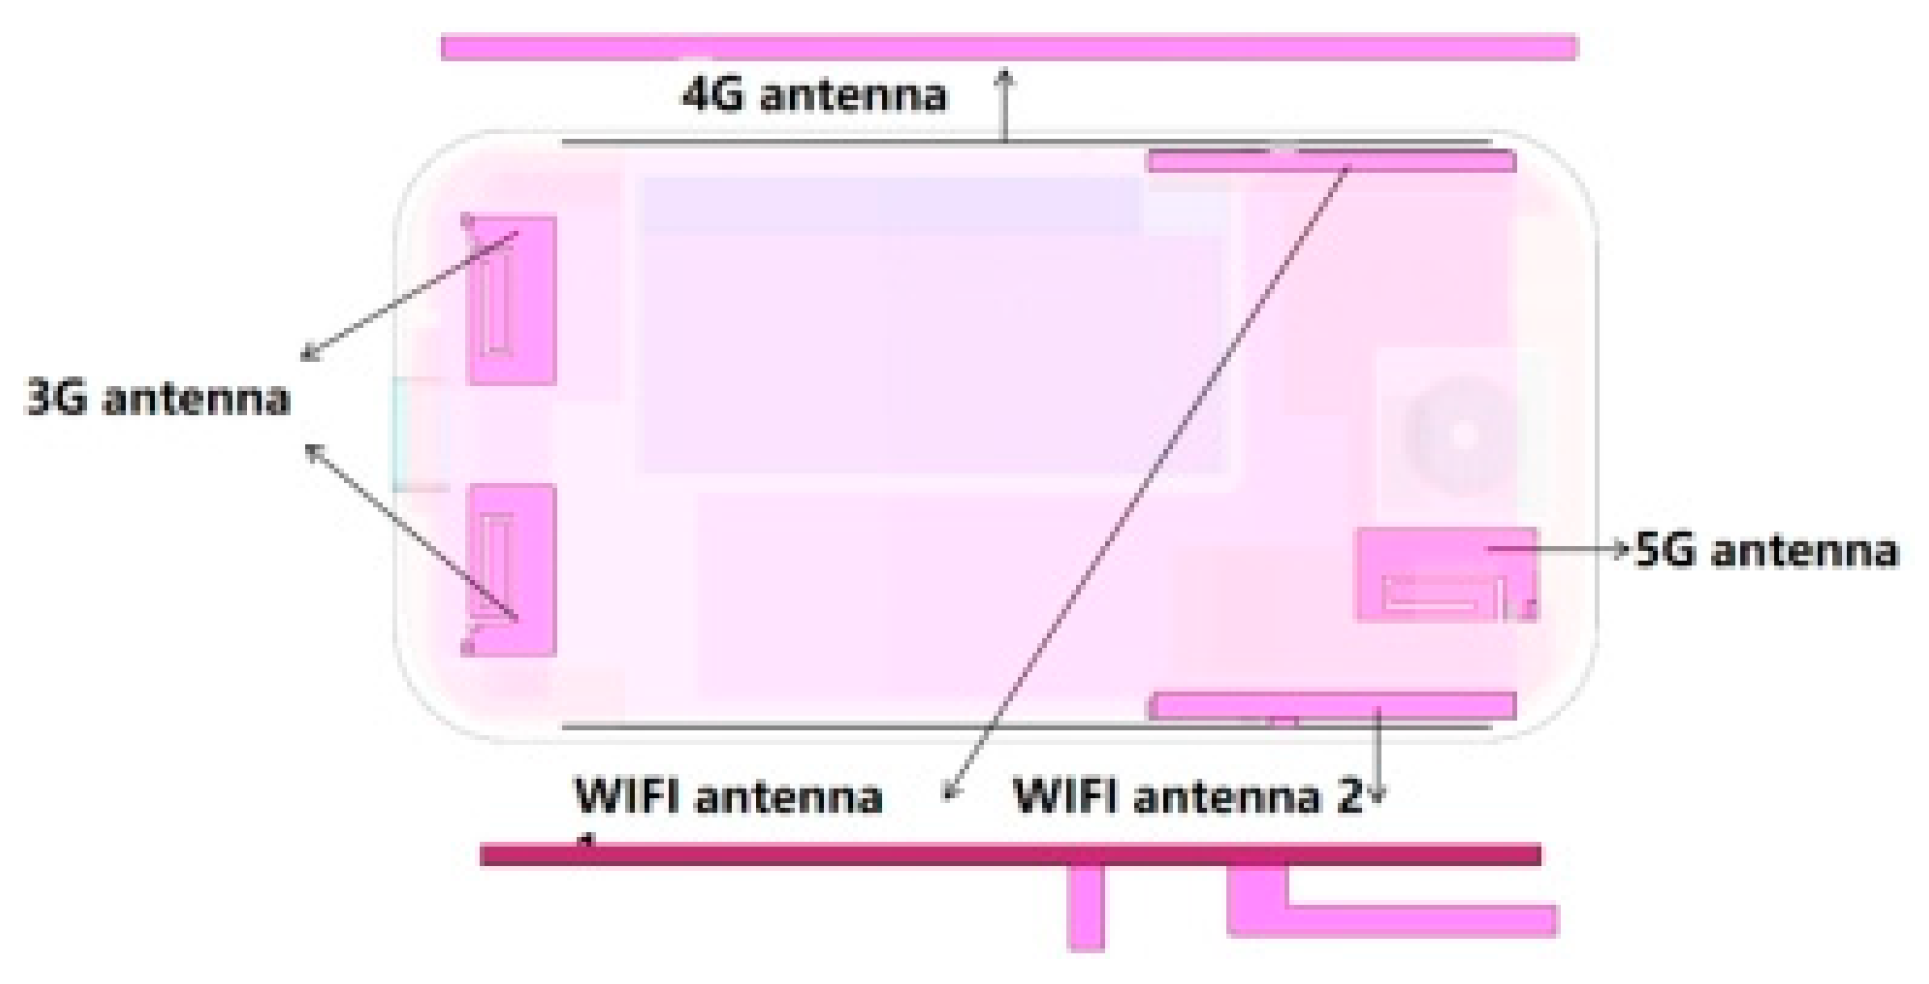
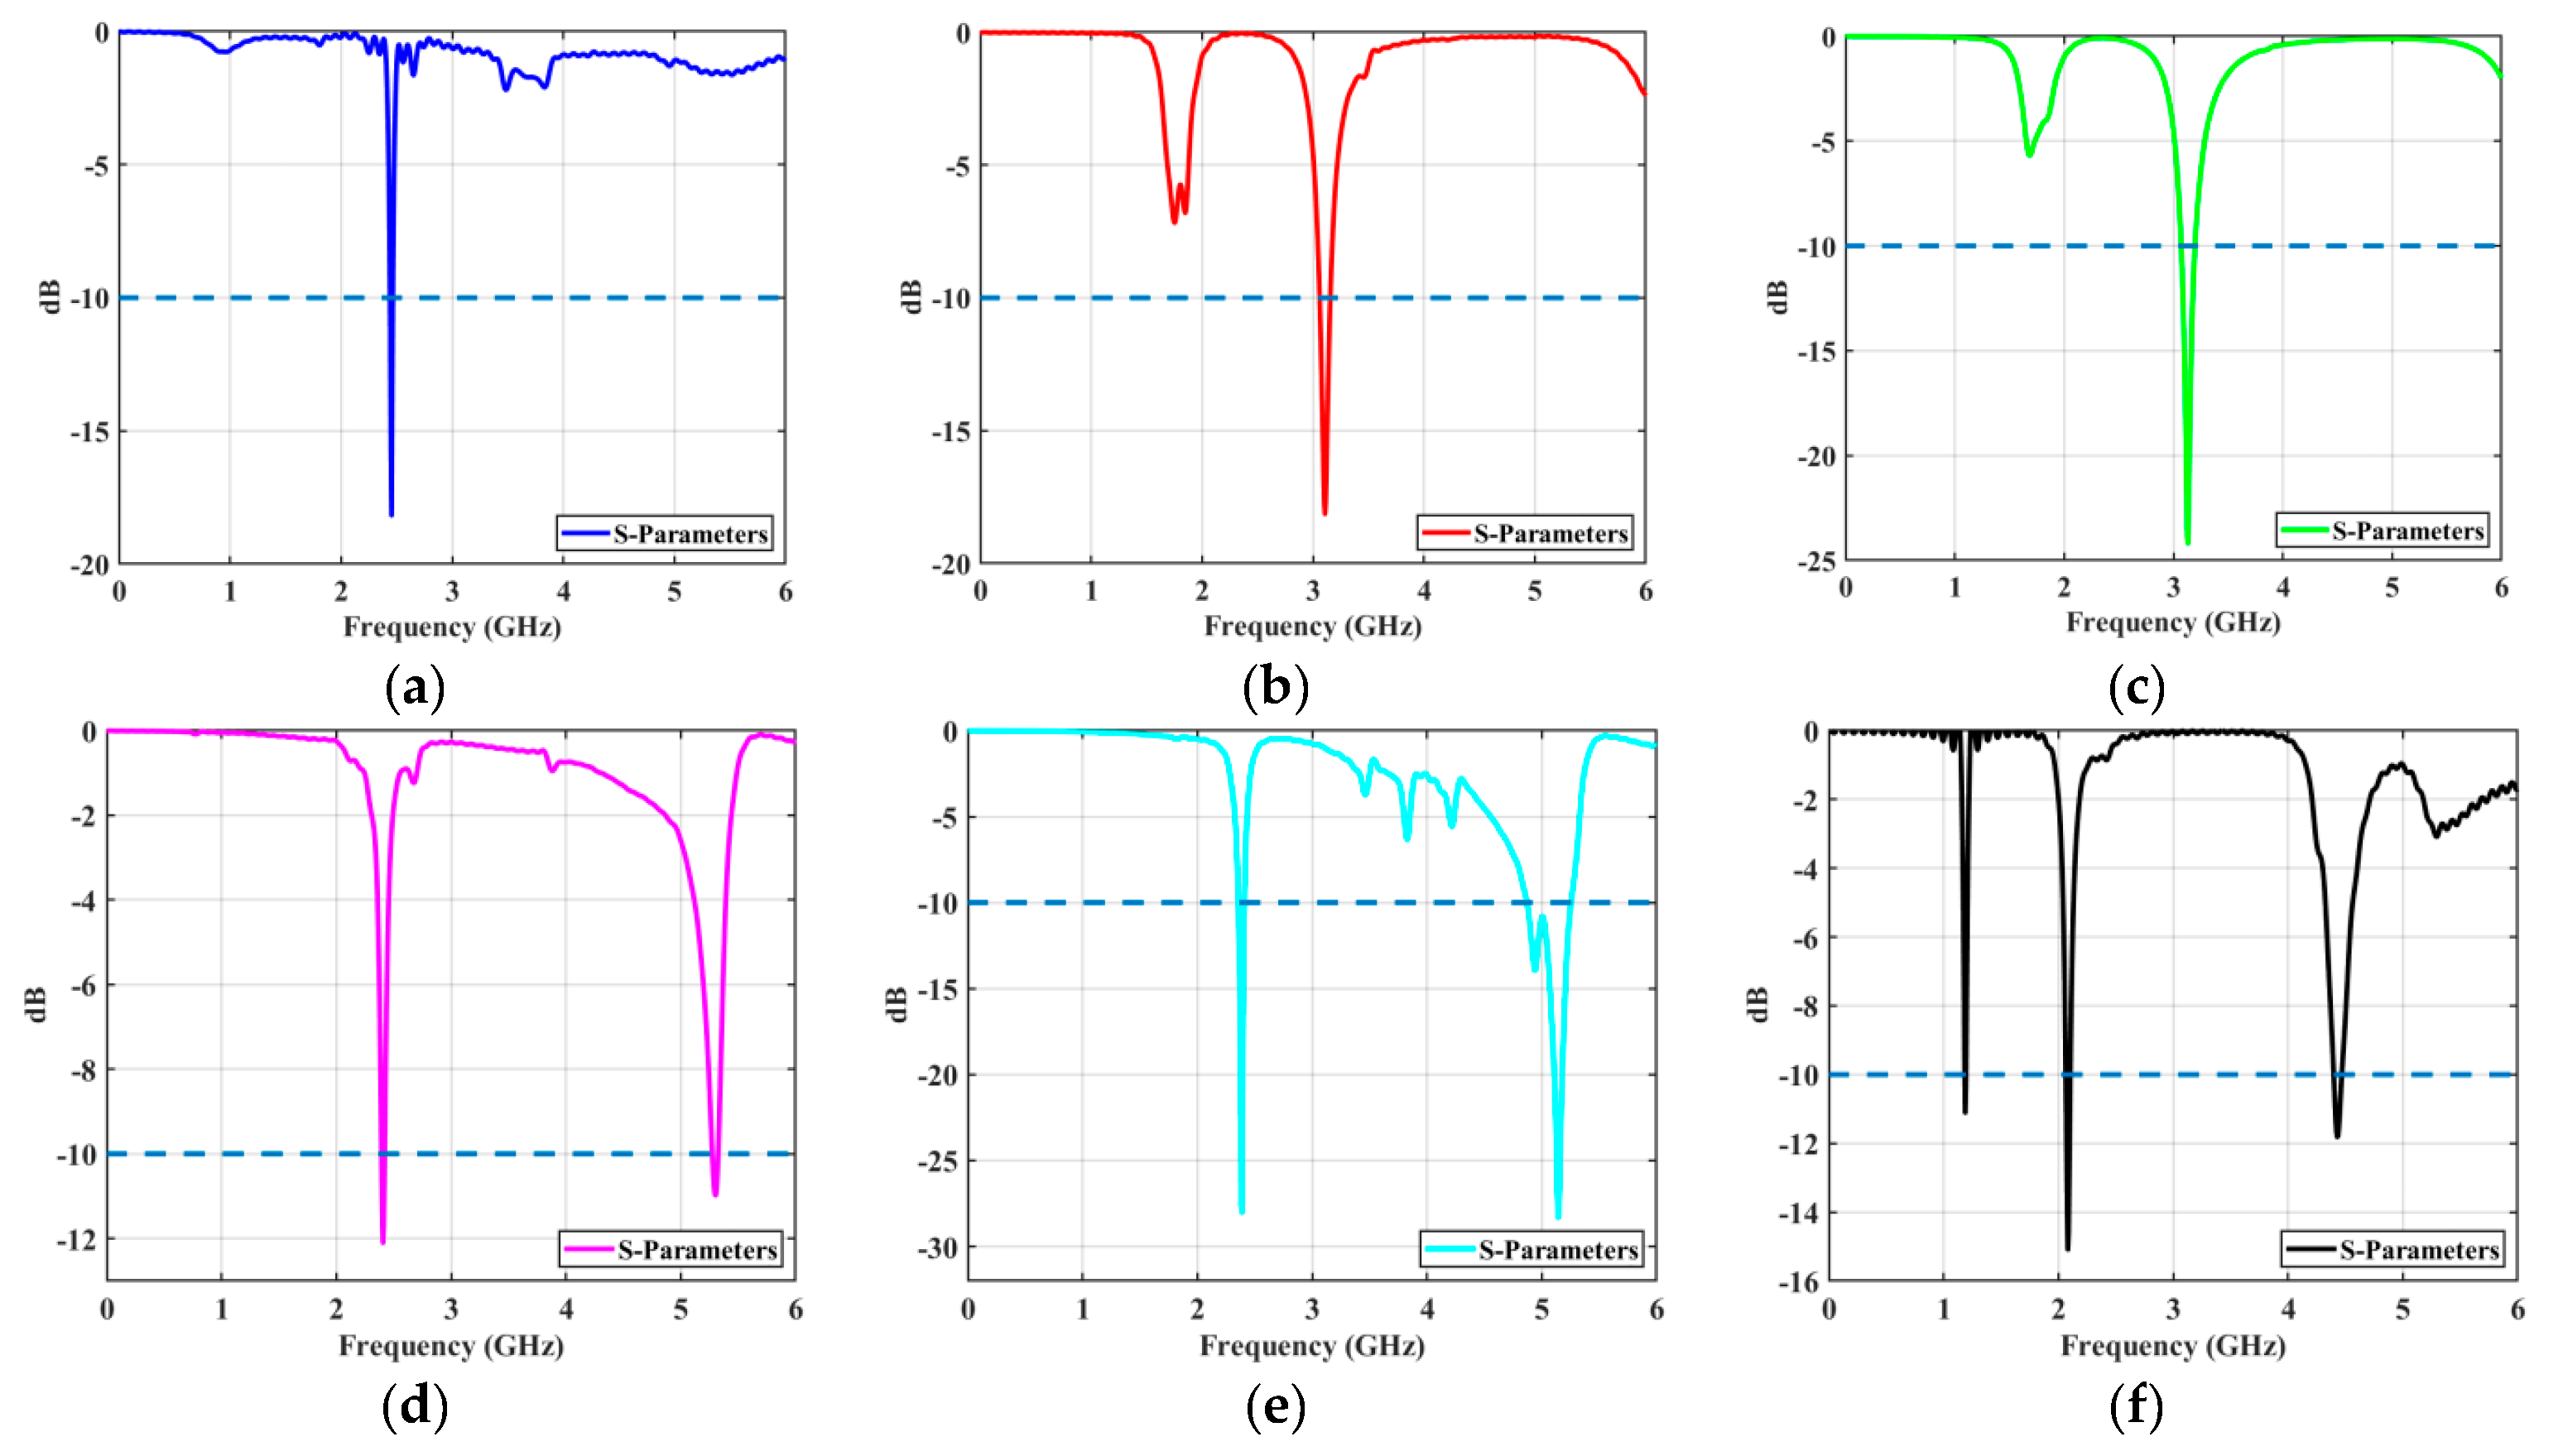
3.1. Mobile Phone Electromagnetic Simulation Model

Since recent mobile phones integrate many antennas and can operate with multiple-input multiple-output (MIMO) at multiple frequencies, the latest mobile phone models are included in the revision of IEC/IEEE62704-3 [21]. However, the electromagnetic simulation models of commercial mobile phones are usually not public; so, it is necessary to establish an adequate electromagnetic simulation model. The main components of a typical mobile phone are reported in [22]. The mobile phone electromagnetic simulation model used in this paper was developed by Dassault and included in CST Studio Suite [23], as shown in Figure 1. The length, width, and height of the mobile phone body are 13.65 cm, 6.94 cm, and 0.95 cm, respectively, which are basically the same as those of a commonly used mobile phone body, providing a certain reference value. Due to the precise modeling of the modeling software, the geometric shapes of the main components of the mobile phone were fully considered, and different components were assigned different electromagnetic parameters, as shown in Table 2.
The electromagnetic model of the mobile phone antenna used in this paper is shown in Figure 2. The antennas used in the mobile phone model were PIFA antennas and patch antennas. The mobile communication module used patch antennas, and the antenna WIFI module used PIFA antennas. The system used two patch antennas located on the back cover of the mobile phone to realize the 3G frequency band, and the side antenna was used to realize the 4G frequency band. In order to cover the specific frequency band of 5G, the mobile phone also embedded an additional patch antenna. The RF system was based on two PIFA antennas. After modification and installation, it could operate in the 2.4 GHz and 5 GHz bands.
With the mobile phone antenna model used in this paper, the return loss simulation results were obtained through simulation calculations.
Figure 3 shows the S parameters (return loss) of these antenna modules, where S11 is the return loss of the 4G antenna, S22 and S33 are the return loss of the two 3G antennas, respectively, S44 and S55 are the return loss of WIFI antenna 1 and WIFI antenna 2, and S66 is the return loss of the 5G antenna. The results demonstrated the return losses were all lower than −10 dB, which is in line with the requirements of the antenna design. Therefore, these antennas can cover 2100 MHz in 3G, 2300 MHz in 4G, 3500 MHz in 5G, and 5200 MHz in WIFI and could be used for the SAR simulation.

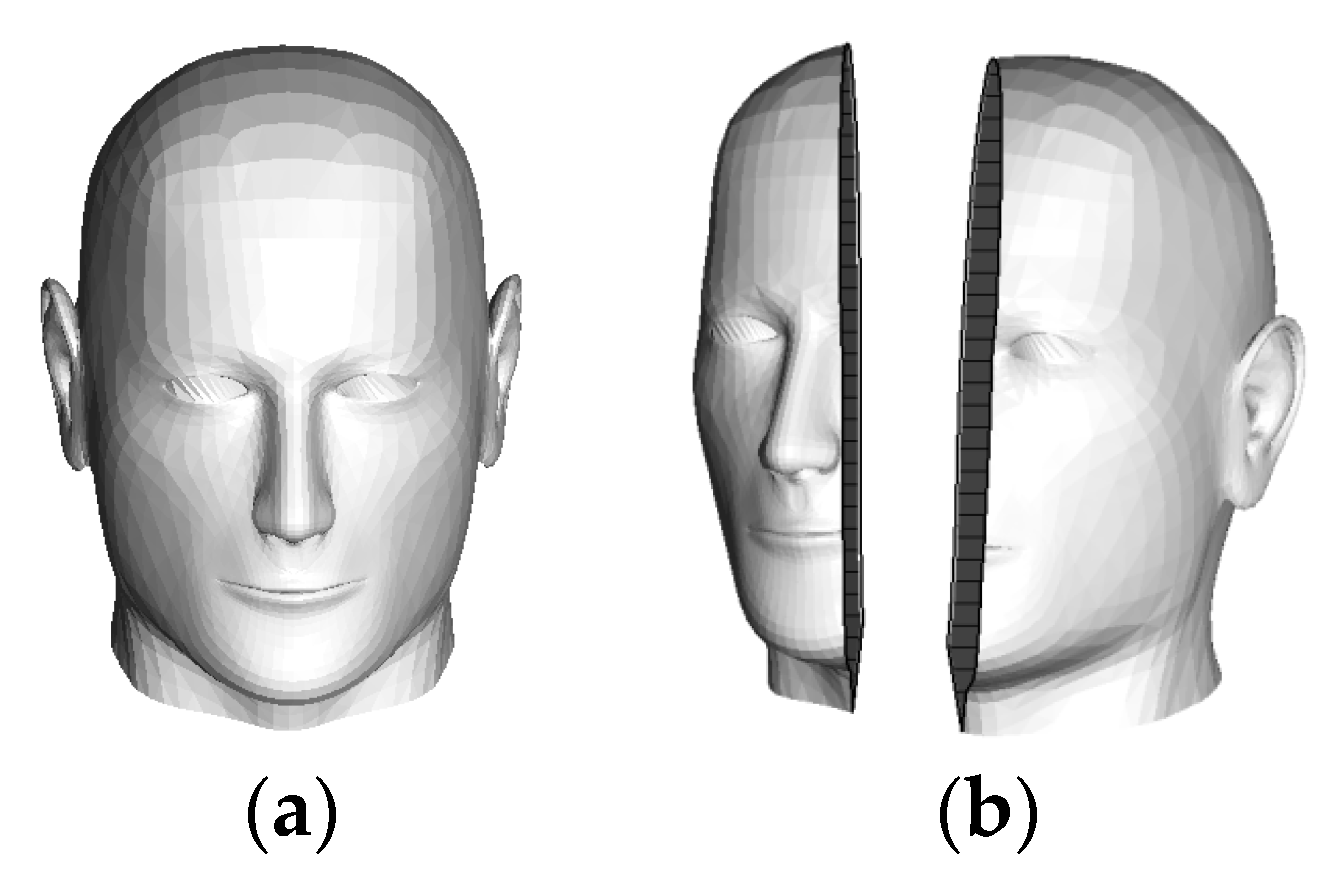
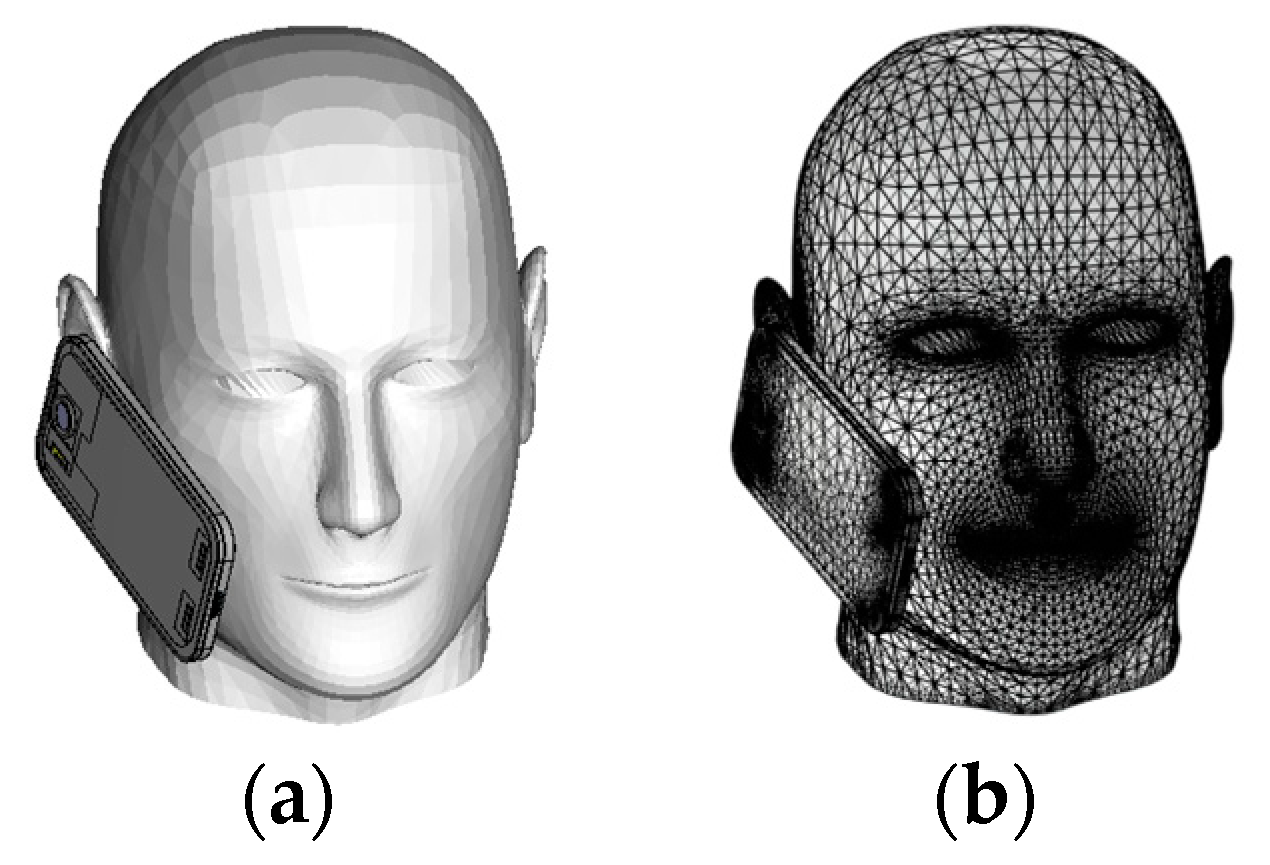
3.2. Electromagnetic Simulation Model of the Human Head

The electromagnetic simulation model of the human head and its sections are shown in Figure 4. The human head simulation model was constructed according to the standard IEC/IEEE 62704-1 [24]. Because the uncertainty of the SAR at different frequencies needed to be calculated and analyzed, the interstitial fluid electromagnetic material in the head was defined as a broadband frequency-related material. These data were obtained from Gabriel et al. [25,26,27,28] and the Italian National Research Council Institute of Applied Physics [29] and could be applied to all the frequency characteristics considered in this paper.

3.3. Electromagnetic Radiation Scenarios

In order to study the UQ of the human head SAR with respect to mobile phone electromagnetic radiation, an electromagnetic radiation scenario was designed, as shown in Figure 5, taking into account the head position and the distance between the mobile phone and the human head in real situations. The boundary conditions were set in the electromagnetic simulation setup as a perfect matching layer. The entire electromagnetic simulation model was meshed, and the final number of converged meshes was 817,915. The meshing diagram of the electromagnetic simulation model is shown in Figure 5b.

4. Electromagnetic Exposure Safety Assessment and Uncertainty Quantification

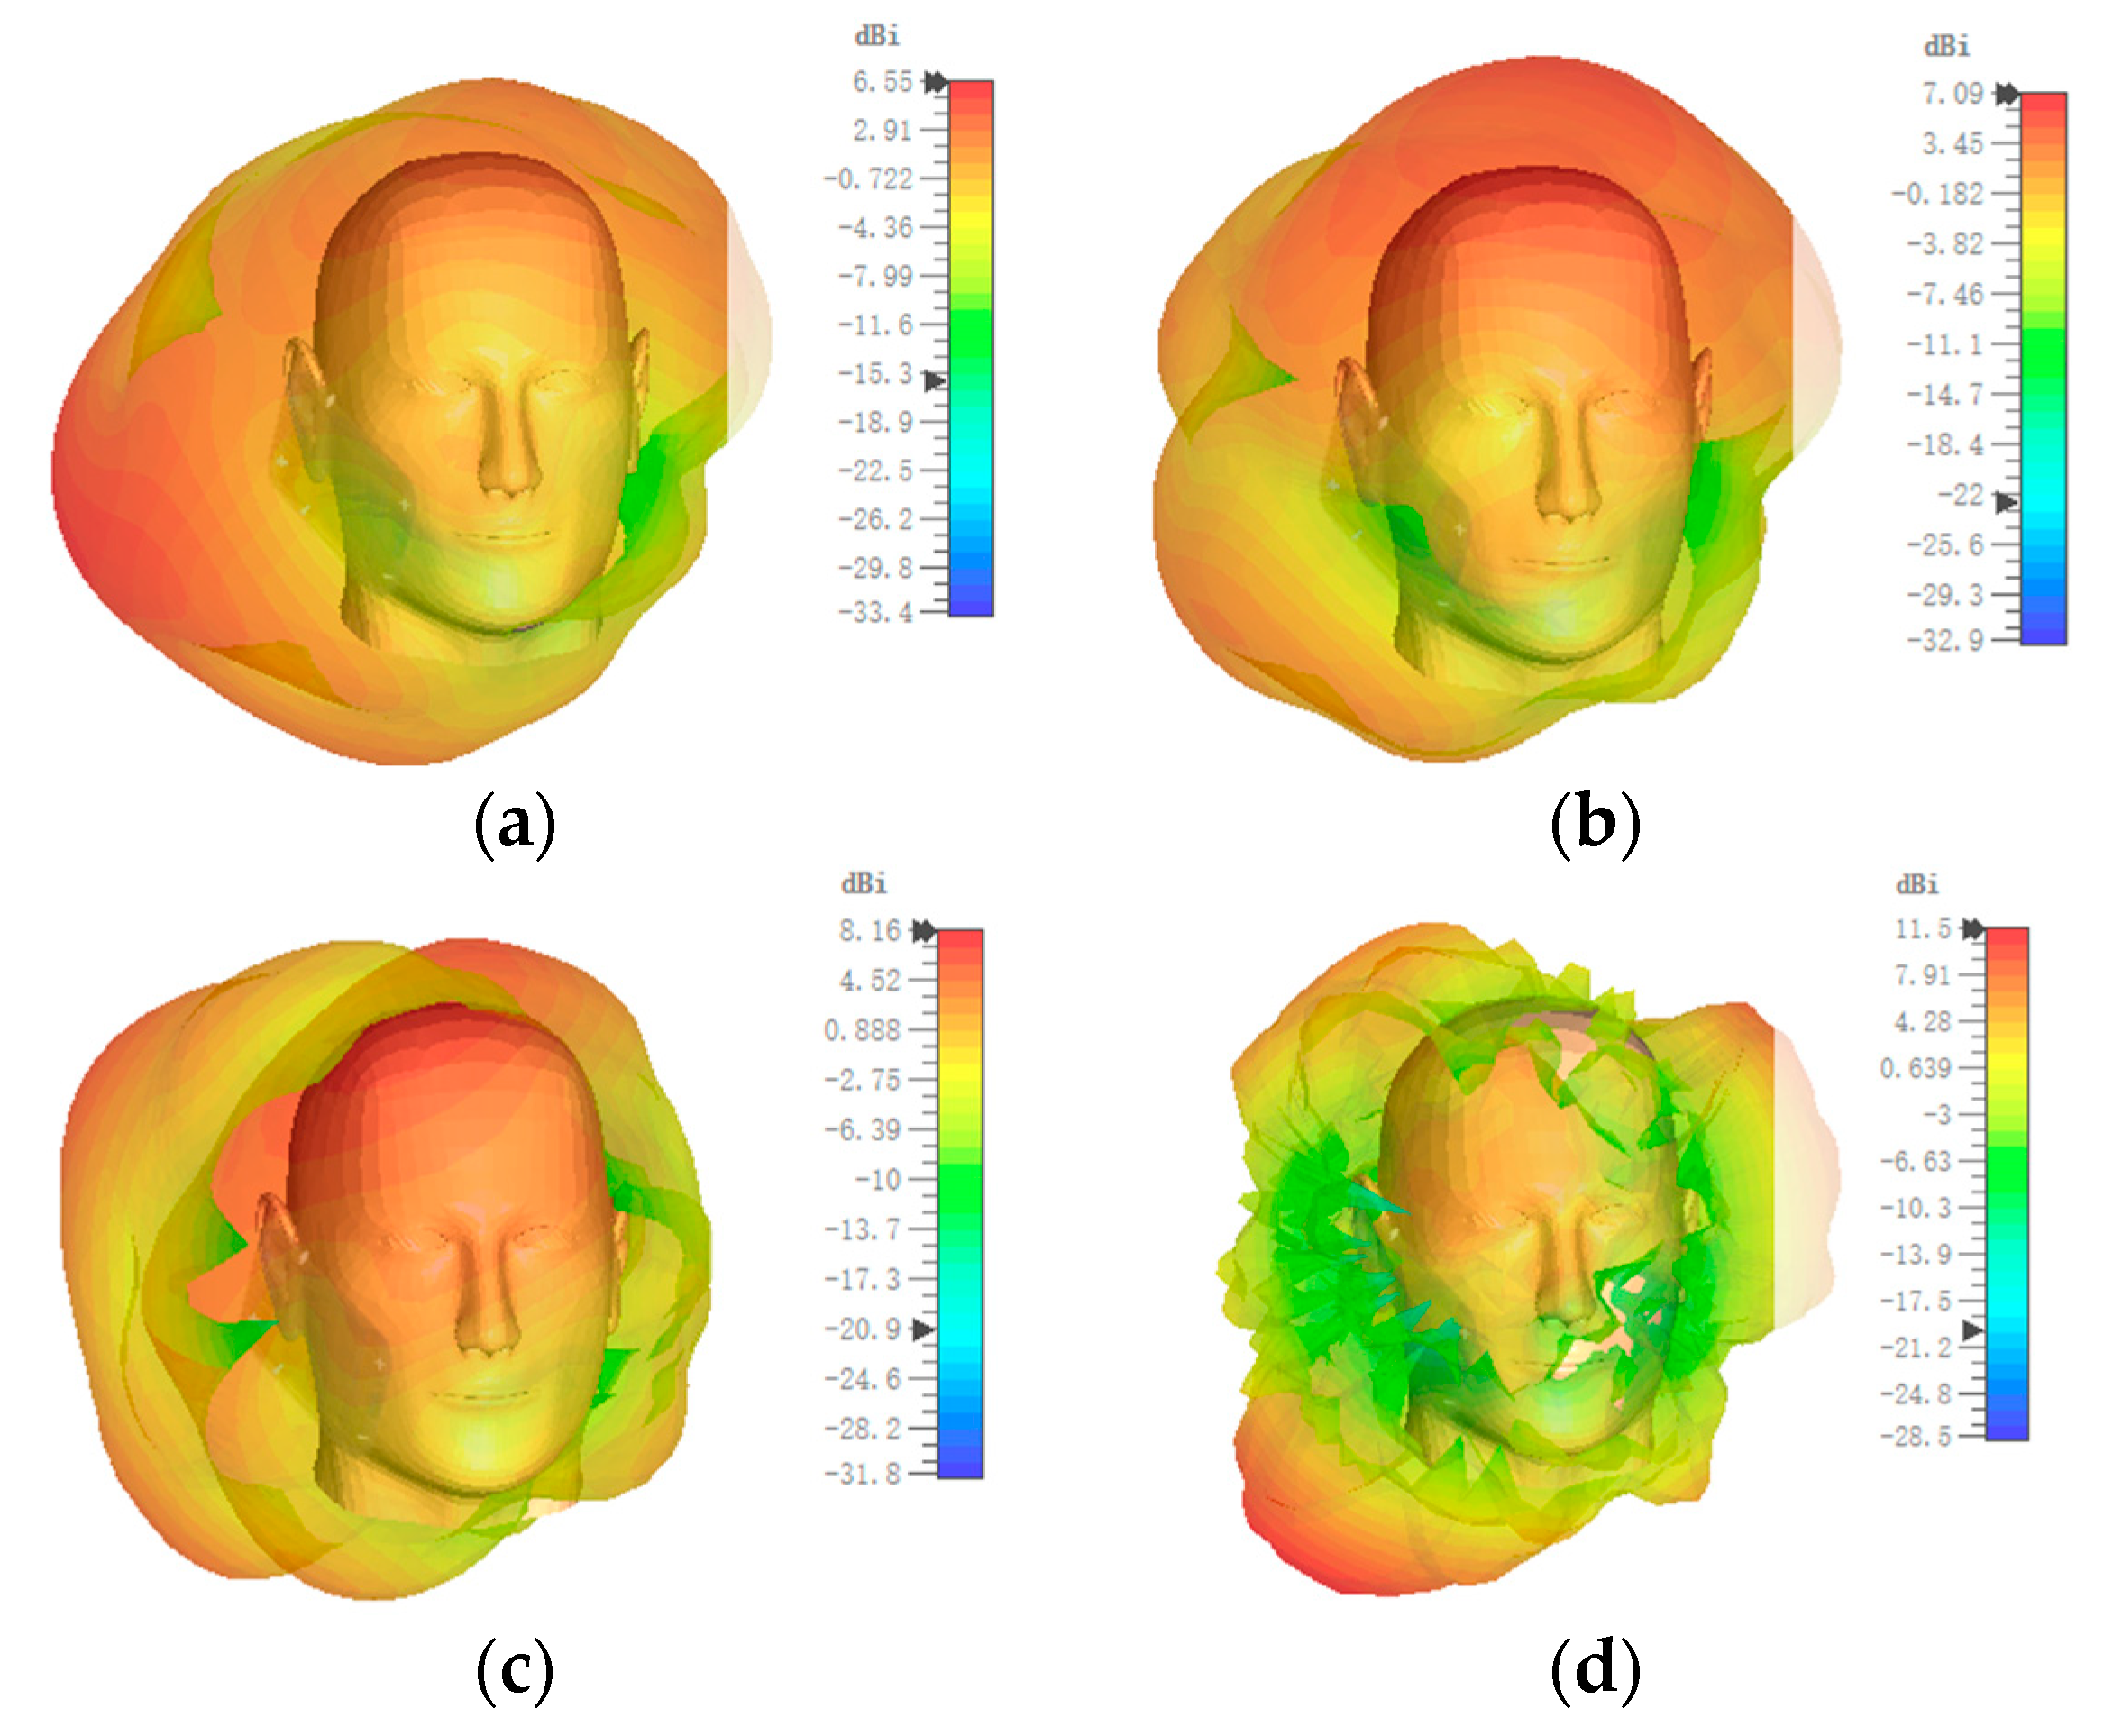
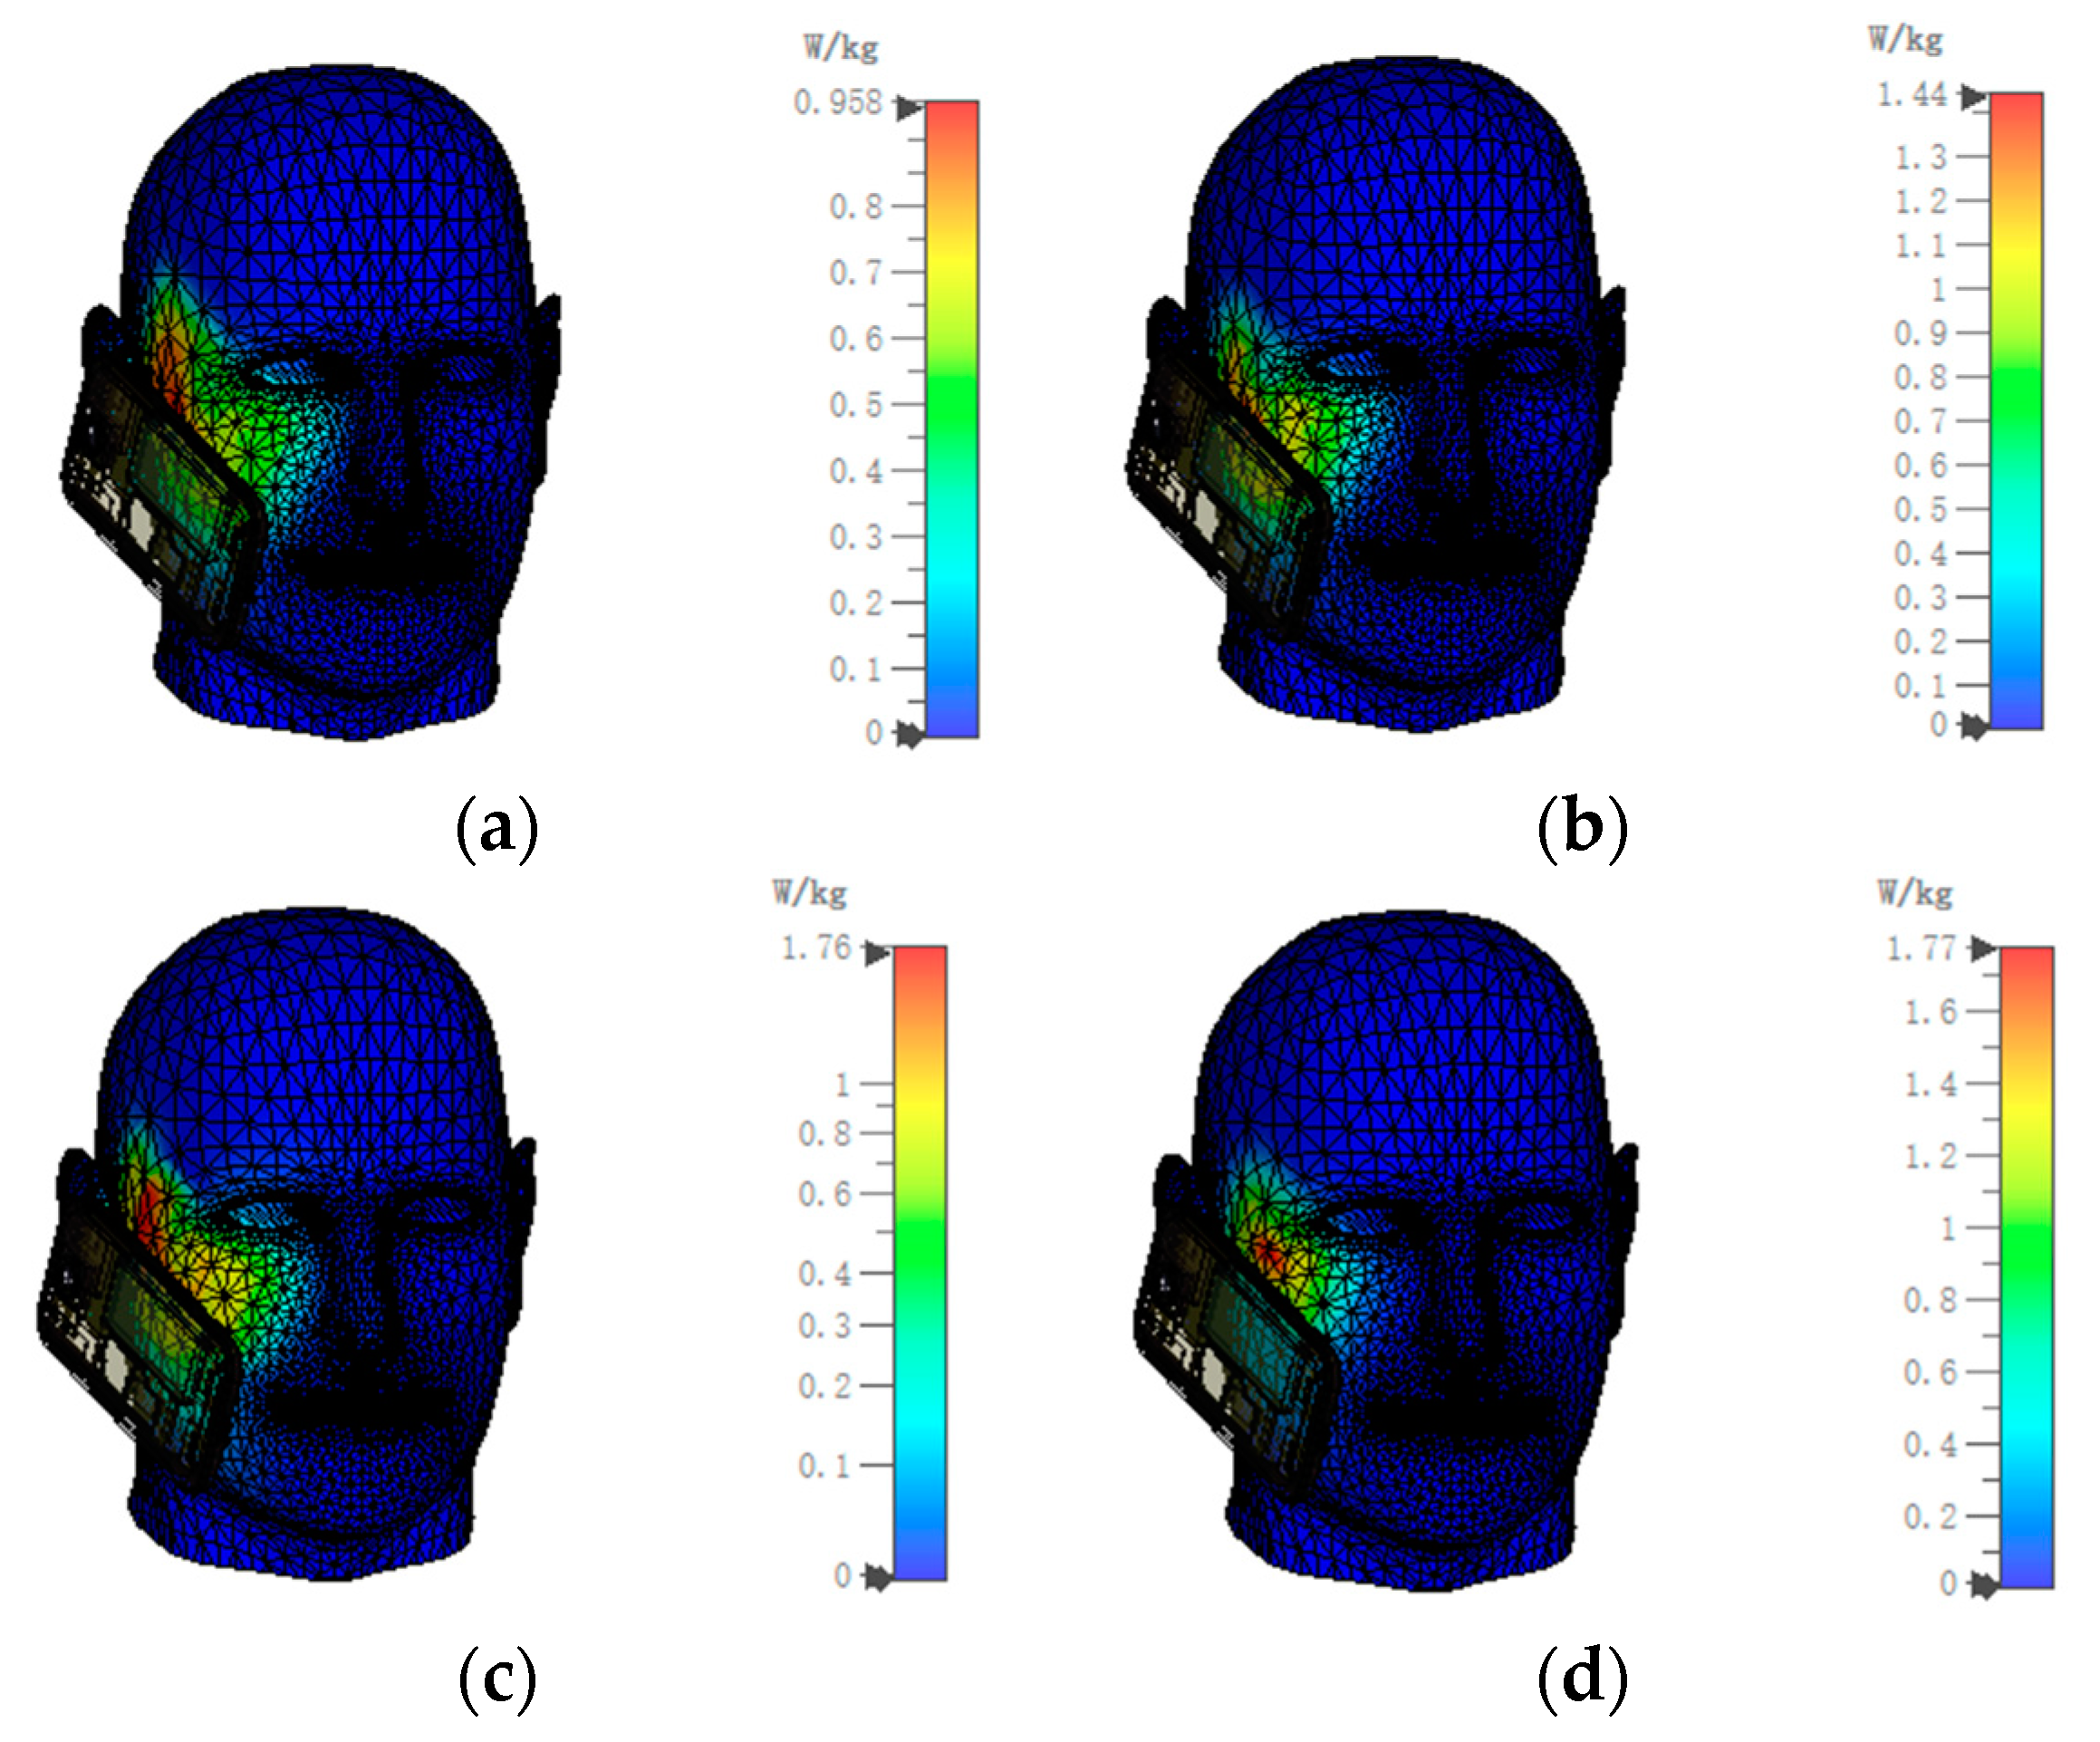
4.1. Safety Assessment

In order to assess the safety of the electromagnetic radiation received by the human head, the SAR calculation was performed based on the constructed electromagnetic simulation model. The selection of the simulation platform was a key task in the current analysis of the electromagnetic radiation. There are studies based on Comsol Multiphysics software to solve the computational problems of bioelectromagnetic models of heat transfer processes [30]. Compared to Comsol, CST has the advantage of balancing high accuracy and high speed when dealing with the electromagnetic problems of mobile phones. Therefore, CST electromagnetic simulation software was used in this paper to calculate the SAR of electromagnetic radiation from mobile phones to the human head. The simulation was simulated by CST and the radiation pattern is shown in Figure 6.
It can be seen in Figure 6 that the radiation direction of the mobile phone antenna close to the human head was not consistent at different frequencies. At 2100 MHz and 2300 MHz, the antenna showed a relatively clear main lobe, and the beam direction was toward the human head; at 3500 MHz and 5200 MHz, the electromagnetic radiation of the mobile phone antenna showed spurious side lobes. The SAR value of the human head is related to the radiation area of different frequencies. Therefore, in the quantitative analysis of the electromagnetic radiation to the human head from mobile phones, this paper considered the SAR values of the human head at 2100 MHz, 2300 MHz, 3500 MHz, and 5200 MHz. The results obtained are shown in Figure 7.
From the simulation results, the SAR value at 2100 MHz was 0.9580 W/kg, that at 2300 MHz was 1.4431 W/kg, that at 3500 MHz was 1.7621 W/kg, and that at 5200 MHz was 1.7737 W/kg. After comparing with the ICNIRP standard limit, we found that the SAR value of the mobile phone’s electromagnetic radiation to the human body obtained in this paper was below the safety limit of the human body’s electromagnetic environment. The safety of the human head exposure to electromagnetic radiation from mobile phones was assessed.

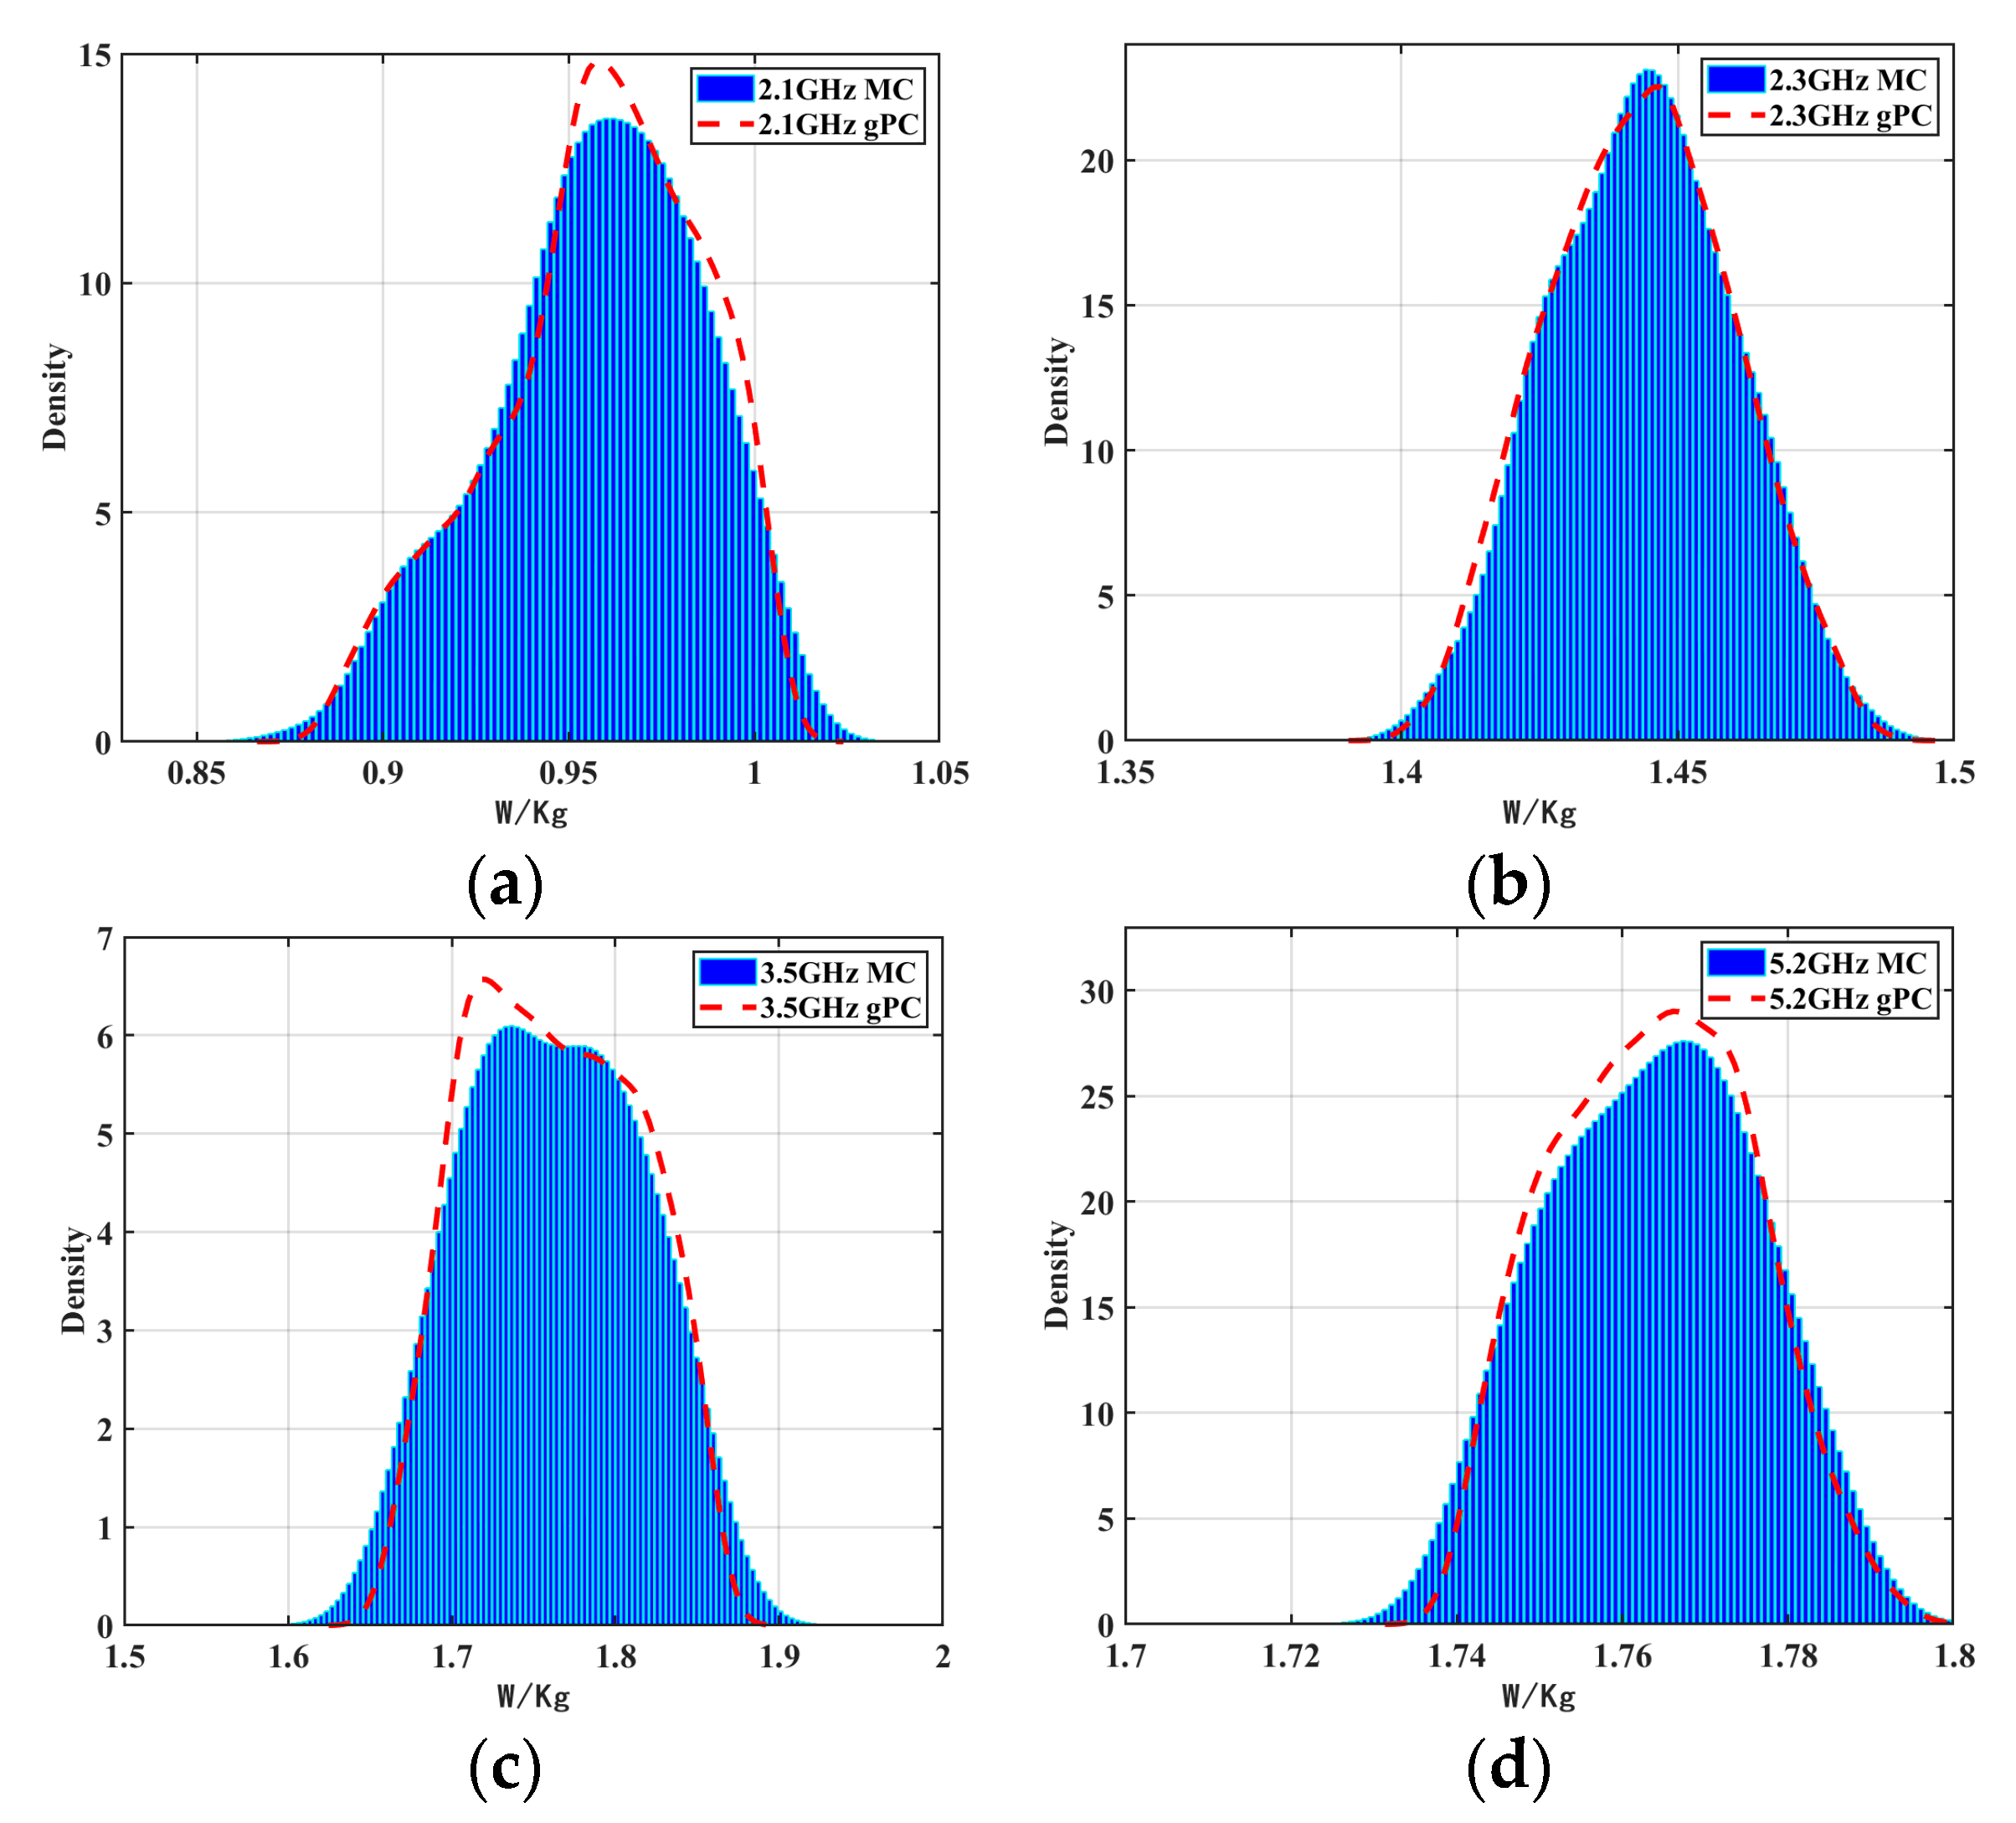
4.2. Uncertainty Quantification

In order to quantify the uncertainty of the electromagnetic radiation from mobile phones to the human head, this paper mainly studied the SAR value of the human head when the human body was exposed to the electromagnetic radiation from a mobile phone. Considering the lack of an accurate understanding of the electromagnetic material parameters of the modeled mobile phone, random variables usually exist to generate uncertainty. The distribution type, specific distribution interval, and some parameters are shown in Table 3:
The Latin hypercube sampling (LHS) is a method to provide a sample of random variables for the MC method, and it is commonly believed that LHS and its modifications can reduce the sample size of the MC method and thus greatly improve its efficiency [31]. The simulation results were obtained by sampling the 1000 runs of the MC method with the LHS. After the construction of the generalized chaotic polynomial was completed, the coefficient matrix was obtained by the random response surface method, and the response value matrix of the system was obtained by multiplying the sample matrix by the coefficient matrix. Then, the statistical characteristics of the system were drawn; the mean and standard deviation are shown in Table 4:
As can be seen from the comparison results shown in Table 4, the analysis results of the gPC method and the MC method showed good consistency in the overall trend and order of magnitude; so, it was proved that the gPC method is effective for the evaluation of the electromagnetic radiation to the human head caused by mobile phones. The probability density function (PDF) curve obtained by the gPC method was combined with the reference PDF curve drawn by the MC method. Figure 8 shows the results of the gPC calculations and the comparative analysis with the MC method. As shown, the correctness and accuracy of the gPC method was further verified.
From the comparison results shown in Figure 8, it can be seen that the PDF of the SAR value analysis results of the gPC and the MC methods were consistent at different frequencies. It was demonstrated that the gPC method was highly accurate in quantifying the uncertainty of the electromagnetic radiation from mobile phones to the human head. The confidence interval is also a statistical quantity. It refers to the use of a sample statistic to estimate an overall parameter given a range such that the probability of the overall parameter falling within that range is at a pre-determined confidence level. In this paper, the mean of the sample was used to estimate the overall mean, but due to the random nature of the sample, we could not guarantee that the estimate would be exactly the same as the true overall mean. Therefore, we considered a possible range of the overall mean by calculating a confidence interval. Table 5 shows the confidence intervals at different frequencies.
The results of the confidence intervals were used to analyze the range of the mean and standard deviation. The results of maximum and minimum values, lower 90%, 95%, 99%, and upper 90%, 95%, 99% were obtained. The intervals of the SAR distribution were quantified, and the quantitative results of the SAR calculation were analyzed more accurately.
The computer CPU used in this article was i9-13900K, the main frequency was 3 GHz, and the running memory was 64 GB. After obtaining the results reported in Table 6, under the premise of ensuring calculation accuracy, we found that compared with the calculation results of the 1000 runs of the MC method, the calculation time of the gPC method was greatly reduced. In terms of radiation uncertainty analysis, the gPC method not only ensured the accuracy of the calculation results, but also significantly improved the calculation efficiency compared with the Monte Carlo method.
We then quantified the effect of mobile phones on the model by random input variables of the electromagnetic radiation to the human head. The global sensitivity indices for the different input parameters were calculated by combining the relevant theories of the Sobol global sensitivity method and the gPC method. By combining the calculated coefficients of the gPC, taking the SAR value generated by the electromagnetic simulation model subjected to mobile phone radiation as the index, the total sensitivity index and first-order sensitivity index of each input variable were obtained, as shown in Figure 9:
At different frequencies, the results of combining the gPC method and the Sobol method to calculate the first-order sensitivity index and the global sensitivity index of each variable were basically consistent with the results of the MC method, and the dielectric constant of the shell had the greatest influence on the overall model. The dielectric constant of the battery jar had a relatively large effect on the overall model. Therefore, the dielectric constant of the shell and battery jar should be kept within reasonable limits when designing electromagnetic materials for mobile phones. In this way, the effect of mobile phones on the SAR of the electromagnetic radiation to the human head is diminished as much as possible.

5. Conclusions

This paper innovatively evaluated the safety of human head exposure to different frequencies by simulations and used the UQ method to analyze the electromagnetic safety issue regarding the human head exposure to the mobile phones. Firstly, the safety of the electromagnetic radiation was evaluated by obtaining quantitative analysis results from an established electromagnetic simulation model of mobile phone and human head. Then, considering the uncertainty of the electromagnetic parameters of each component of a cell phone, the SAR uncertainty problem of the human head exposed to a mobile phone electromagnetic radiation was quantified by using the gPC method. Comparing the SAR calculation results of the gPC method with those of the MC method at different frequencies, it was proved that the SAR calculation based on the gPC method is a solution that can efficiently solve the uncertainty problem of electromagnetic radiation from mobile phones to human head. Finally, the sensitivity analysis method combining gPC and Sobol was used to calculate the sensitivity indices of different input variables, which intuitively showed the degree of influence of mobile phone electromagnetic materials on human head electromagnetic safety. In summary, this study puts forward scientific guidance for EMC design and the optimization of cell phones with respect to issues related to the exposure of the human head to electromagnetic radiation from mobile phones.

Author Contributions

Conceptualization, M.Y. and B.W.; methodology, M.Y. and Y.Z.; software, M.Y.; validation, B.W., Y.Z. and T.S.; formal analysis, M.Y.; investigation, B.W.; resources, Y.C.; data curation, Y.Z.; writing—original draft preparation, M.Y.; writing—review and editing, M.Y. and Y.C.; visualization, T.S.; supervision, Y.Z.; project administration, Y.C.; funding acquisition, Y.C. All authors have read and agreed to the published version of the manuscript.

Funding

This research was funded by the Key Laboratory for Comprehensive Energy Saving of Cold Regions Architecture of the Ministry of Education, Jilin Jianzhu University, under grant number JLJZHDKF202203, and the Jilin Scientific and Technological Development Program, under grant number 20210509048RQ.

Institutional Review Board Statement

Not applicable.

Informed Consent Statement

Not applicable.

Data Availability Statement

Not applicable.

Acknowledgments

The authors would like to thank the technical staff of the Key Laboratory for Comprehensive Energy Saving of Cold Regions Architecture of the Ministry of Education, Jilin Jianzhu University and the College of Instrument Science and Electrical Engineering, Jilin University for their technical support.

Conflicts of Interest

The authors declare no conflict of interest.

References

  1. van Rongen, E.; Croft, R.; Juutilainen, J.; Lagroye, I.; Miyakoshi, J.; Saunders, R.; de Seze, R.; Tenforde, T.; Verschaeve, L.; Veyret, B.; et al. Effects of radiofrequency electromagnetic fields on the human nervous system. J. Toxicol. Environ. Health Part B 2009, 12, 572–597. [Google Scholar] [CrossRef] [PubMed]
  2. Kesari, K.K.; Siddiqui, M.; Meena, R.; Verma, H.N.; Kumar, S. Cell phone radiation exposure on brain and associated biological systems. Indian J. Exp. Biol. 2013, 51, 187–200. [Google Scholar] [PubMed]
  3. Mumtaz, S.; Rana, J.N.; Choi, E.H.; Han, I. Microwave Radiation and the Brain: Mechanisms, Current Status, and Future Prospects. Int. J. Mol. Sci. 2022, 23, 9288. [Google Scholar] [CrossRef] [PubMed]
  4. Gartshore, A.; Kidd, M.; Joshi, L.T. Applications of Microwave Energy in Medicine. Biosensors 2021, 11, 96. [Google Scholar] [CrossRef]
  5. IEEE Standard 1528-2013; IEEE Recommended Practice for Determining the Peak Spatial-Average Specific Absorption Rate (SAR) in the Human Head from Wireless Communications Devices: Measurement Techniques. IEEE: Piscataway, NY, USA, 2013.
  6. International Commission on Non-Ionizing Radiation Protection. Guidelines for limiting exposure to time-varying electric, magnetic and electromagnetic fields (up to 300 GHz). Health Phys. 1998, 75, 494–522. [Google Scholar]
  7. Zhou, W.; Lu, M. Safety evaluation of radio frequency electromagnetic exposure from wireless communication system of subway. J. Radiat. Res. Radiat. Process. 2018, 36, 040401. [Google Scholar]
  8. IS/IEC 62209-1; Human Exposure to Radio Frequency Fields from Hand-Held and Body-Mounted Wireless Communication Devices—Human Models, Instrumentation, and Procedures—Part 1: Procedure to Determine the Specific Absorption Rate (SAR) for Hand-Held Devices Used in Close Proximity to the Ear (Frequency Range of 300 MHz to 3 GHz). IEC: Geneva, Switzerland, 2005.
  9. Singh, M. Biological heat and mass transport mechanisms behind nanoparticles migration revealed under microCT image guidance. Int. J. Therm. Sci. 2023, 184, 107996. [Google Scholar] [CrossRef]
  10. Singh, M.; Ma, R.; Zhu, L. Quantitative evaluation of effects of coupled temperature elevation, thermal damage, and enlarged porosity on nanoparticle migration in tumors during magnetic nanoparticle hyperthermia. Int. Commun. Heat Mass Transf. 2021, 126, 105393. [Google Scholar] [CrossRef]
  11. Cheng, X.; Monebhurrun, V. Application of different methods to quantify uncertainty in specific absorption rate calculation using a CAD-based mobile phone model. IEEE Trans. Electromagn. Compat. 2016, 59, 14–23. [Google Scholar] [CrossRef]
  12. Xiu, D. The wiener-asky polynomial chaos for stochastic differential equations. SIAM J. Sci. Comput. 2005, 27, 1118–1139. [Google Scholar] [CrossRef]
  13. Xiu, D.; Karniadakis, G.E. Modeling uncertainty in flow simulations via generalized polynomial chaos. J. Comput. Phys. 2003, 187, 137–167. [Google Scholar] [CrossRef]
  14. Rubinstein, R.Y.; Kroese, D.P. (Eds.) Simulation and Monte Carlo Method; Front Matter; John Wiley & Sons: Hoboken, NJ, USA, 2008. [Google Scholar]
  15. Blatman, R.; Sudret, B. Adaptive sparse polynomial chaos expansion based on least angle regression. J. Comput. Phys. 2011, 230, 2345–2367. [Google Scholar] [CrossRef]
  16. Marelli, S.; Sudret, B. An active-learning algorithm that combines sparse polynomial chaos expansions and bootstrap for structural reliability analysis. Struct. Saf. 2018, 75, 67–74. [Google Scholar] [CrossRef] [Green Version]
  17. Kersaudy, P.; Sudret, B.; Varsier, N.; Picon, O.; Wiart, J. A new surrogate modeling technique combining Kriging and polynomial chaos expansions—Application to uncertainty analysis in computational dosimetry. J. Comput. Phys. 2015, 286, 103–117. [Google Scholar] [CrossRef] [Green Version]
  18. Jakeman, J.D.; Eldred, M.S.; Sargsyan, K. Enhancing l(1)-minimization estimates of polynomial chaos expansions using basis selection. J. Comput. Phys. 2015, 289, 18–34. [Google Scholar] [CrossRef] [Green Version]
  19. Homma, T.; Saltelli, A. Importance measures in global sensitivity analysis of nonlinear models. Reliab. Eng. Syst. Saf. 1996, 52, 1–17. [Google Scholar] [CrossRef]
  20. Isukapalli, S.S. Uncertainty Analysis of Transport-Transformation Models. Ph.D. Thesis, The State University of New Jersey, New Brunswick, NJ, USA, 1999. [Google Scholar]
  21. IEEE P62704-3; Determining the Peak Spatial-Average Specific Absorption Rate (SAR) in the Human Body from Wireless Communications Devices, 30 MHz–6 GHz. Part 3: Specific Requirements for Using the Finite-Difference Time-Domain (FDTD) Method for SAR Calculations of Mobile Phones. IEEE: Piscataway, NY, USA, 2020.
  22. Monebhurrun, V.; Wong, M.F.; Wiart, J. Numerical and experimental investigations of a commercial mobile handset for SAR calculations. In Proceedings of the 2nd International Conference on Bioinformatics and Biomedical Engineering, Shanghai, China, 16–18 May 2008; pp. 784–787. [Google Scholar]
  23. CST Studio Suite. Electromagnetic Field Simulation Software. Available online: https://www.3ds.com/products-services/simulia/products/cst-studio-suite (accessed on 14 May 2021).
  24. IEC/IEEE 62704-1; IEC/IEEE International Standard—Determining the Peak Spatial-Average Specific Absorption Rate (SAR) in the Human Body from Wireless Communications Devices, 30 MHz to 6 GHz—Part 1: General Requirements for Using the Finite-Difference Time-Domain (FDTD) Method for SAR Calculations. IEEE: Piscataway, NY, USA, 2017; pp. 1–86.
  25. Gabriel, C. Compilation of the Dielectric Properties of Body Tissues at RF and Microwave Frequencies; Report AL/OE-TR-1996-0037; Armstrong Laboratory (AFMC), Radiofrequency Radiation Division, Brooks AFB: San Antonio, TX, USA, 1996. [Google Scholar]
  26. Gabriel, C.; Gabriel, S.; Corthout, E. The dielectric properties of biological tissues: I. Literature survey. Phys. Med. Biol. 1996, 41, 2231–2249. [Google Scholar] [CrossRef] [PubMed] [Green Version]
  27. Gabriel, S.; Lau, R.W.; Gabriel, C. The dielectric properties of biological tissues: II. Measurements in the frequency range 10 Hz to 20 GHz. Phys. Med. Biol. 1996, 41, 2251–2269. [Google Scholar] [CrossRef] [Green Version]
  28. Gabriel, S.; Lau, R.W.; Gabriel, C. The dielectric properties of biological tissues: III. Parametric models for the frequency spectrum of tissues. Phys. Med. Biol. 1996, 41, 2271–2293. [Google Scholar] [CrossRef] [Green Version]
  29. Duck, F.A. Physical Properties of Tissue—A Comprehensive Reference Book; Academic Press Ltd.: Cambridge, MA, USA, 1990. [Google Scholar]
  30. Singh, M.; Gu, Q.; Ma, R.; Zhu, L. Heating Protocol Design Affected by Nanoparticle Redistribution and Thermal Damage Model in Magnetic Nanoparticle Hyperthermia for Cancer Treatment. J. Heat Transf. 2020, 142, 072501. [Google Scholar] [CrossRef]
  31. Stein, M. Large Sample Properties of Simulations Using Latin Hypercube Sampling. Technometrics 1987, 29, 143–151. [Google Scholar] [CrossRef]
Figure 1. Mobile phone electromagnetic simulation model.
Applsci 13 08107 g001
Figure 2. Mobile phone antenna electromagnetic simulation model.
Applsci 13 08107 g002
Figure 3. Mobile phone antenna return loss S-parameters. (a) S11, (b) S22, (c) S33, (d) S44, (e) S55 (f) S66.
Applsci 13 08107 g003
Figure 4. The electromagnetic simulation model of the human head. (a) Front view, (b) section view.
Applsci 13 08107 g004
Figure 5. Electromagnetic radiation scenario. (a) Simulation model diagram, (b) mesh diagram.
Applsci 13 08107 g005
Figure 6. Radiation pattern at four frequencies. Shown are (a) 2100 MHz, (b) 2300 MHz, (c) 3500 MHz, (d) 5200 MHz.
Applsci 13 08107 g006
Figure 7. SAR results at four frequencies. The chosen frequencies were (a) 2100 MHz, (b) 2300 MHz, (c) 3500 MHz, (d) 5200 MHz.
Applsci 13 08107 g007
Figure 8. Comparison of the probability density function of the SAR at four frequencies, i.e., (a) 2100 MHz, (b) 2300 MHz, (c) 3500 MHz, (d) 5200 MHz.
Applsci 13 08107 g008
Figure 9. Comparison of the global sensitivity indices. Show are the (a) 2100 MHz first-order sensitivity index, (b) 2100 MHz total sensitivity index, (c) 2300 MHz first-order sensitivity index, (d) 2300 MHz total sensitivity index, (e) 3500 MHz first-order sensitivity index, (f) 3500 MHz total sensitivity index, (g) 5200 MHz first-order sensitivity index, (h) 5200 MHz total sensitivity index.
Applsci 13 08107 g009
Table 1. Orthogonal polynomial bases corresponding to the different distribution types.
Distribution PatternPDFOrthogonal Polynomial BasisWeight Function Variable Range
normal 1 2 π e x 2 / 2 Hermite H n x e x 2 / 2 , +
uniform1/2Legendre P n x 1 1 , 1
exponential e x Legendre L n x e x 0 , +
γ x α e x Γ α + 1 generalized Legendre L n α , β x x α e x 0 , +
Table 2. Electromagnetic parameters corresponding to different components of mobile phones.
ComponentRelative PermittivityConductivity
antenna1.00PEC
battery1.00PEC
battery jar5.00PEC
display screen4.800.01
PCB1.00PEC
phone receiver1.00PEC
loudspeaker1.00PEC
speaker connector1.00PEC
inner shell2.30PEC
shell2.20PEC
camera1.90PEC
casing pipe3.000.01
vibrator1.00PEC
PEC: Perfect Conductor.
Table 3. Variables of the mobile phone electromagnetic radiation safety assessment for the human head.
Dielectric ConstantDistribution PatternDistribution Interval
camerauniform[1.8,2.0]
battery jaruniform[4.8,5.2]
inner shellnormal[2.3,0.52]
shelluniform[2.0,2.4]
Table 4. The comparison between the output mean and the standard deviation of the SAR.
FrequencyOutput MeanStandard Deviation
MCgPCMCgPC
2.1 GHz0.95760.95800.02740.0277
2.3 GHz1.44361.44310.01590.0165
3.5 GHz1.76211.76220.05110.0501
5.2 GHz1.77371.77310.01190.0117
Table 5. Computed statistics at different frequencies.
Frequency2.1 GHz2.3 GHz3.5 GHz5.2 GHz
mean0.95801.44311.76221.7731
STD0.02770.01650.05010.0117
minimum0.88041.39931.65571.7380
maximum1.00981.48851.86621.8078
lower 90%0.90511.41591.68461.7548
upper 90%0.99851.47061.84431.7928
lower 95%0.89781.41221.67561.7529
upper 95%1.00191.47491.85131.7962
lower 99%0.88851.40561.66331.7502
upper 99%1.00621.48071.86071.8016
Table 6. Comparison of the SAR calculation time.
Computational MethodComputation Time
gPC35 min 20 s
MC16 h 36 min
Disclaimer/Publisher’s Note: The statements, opinions and data contained in all publications are solely those of the individual author(s) and contributor(s) and not of MDPI and/or the editor(s). MDPI and/or the editor(s) disclaim responsibility for any injury to people or property resulting from any ideas, methods, instructions or products referred to in the content.

