Abstract
Visceral Leishmaniasis (VL) is a neglected disease that affects between 50,000 and 90,000 new cases annually worldwide. In Brazil, VL causes about 3500 cases/per year. This chronic disease can lead to death in 90% of untreated cases. Thus, it is necessary to study safe technologies for diagnosing, treating, and controlling VL. Specialized laboratories carry out the VL diagnosis, and this step has a significant automation power through methods based on computational tools. The gold standard for detecting VL is the microscopy of material aspirated from the bone marrow to search for amastigotes. This work aims to assist in detecting amastigotes from microscopy images using deep learning techniques. The proposed methodology consists of segmenting the Leishmania parasites in the images, precisely indicating the location of the amastigotes in the image. In the detection of VL parasites, in this methodology, a Dice of 80.4% was obtained, Intersection over Union (IoU) of 75.2%, Accuracy of 99.1%, Precision of 81.5%, Sensitivity of 72.2%, Specificity of 99.6%, and Area under the Receiver Operating Characteristics Curve (AUC) of 86.5%. The results are promising and demonstrate that deep learning models trained with images of microscopy slides of biological material can precisely help the specialist detect VL in humans.
1. Introduction
Leishmaniasis is a major health problem in the Americas, East Africa, North Africa, West Asia, and Southeast Asia [1]. Leishmaniasis accounts for 700,000 to 1 million cases/year and causes between 26,000 and 65,000 deaths annually worldwide [1]. In Brazil, there are two forms of the disease: Visceral Leishmaniasis (VL), also known as kala-azar, and Tegumentary Leishmaniasis (TL), which encompasses a spectrum of clinical manifestations, including localized cutaneous, diffuse cutaneous, disseminated, and mucocutaneous leishmaniasis [2]. LT is the most frequent form of the disease with about 21,000 cases/year [3], while VL has about 3500 cases/year [4]; however, it is the most lethal and can lead to death in 90% of untreated cases [5]. Control methods for reducing cases are primarily linked to implementing health surveillance measures and basic sanitation.
In America, VL is a disease caused by protozoa of the Leishmania infantum species (called Leishmania chagasi in the Americas), transmitted to humans through an infected female insect vector, called sandflies [6]. In Brazil, the main species responsible for transmission is the Lutzomyia longipalpis, which through its hematophagous habit (group of animals or parasites that feed on blood) infects vertebrate hosts, such as rodents, dogs, and humans [7].
In humans, Leishmania can infect different types of cells, mainly macrophages, in which the replication and differentiation of the agent from promastigote to amastigote occur [8]. The main symptoms of VL in humans are long-lasting fever, weakness, weight loss, anemia, hepatosplenomegaly, and a marked drop in the patient’s blood platelet count [9].
VL detection can be performed by an immunological test, which aims to detect anti-Leishmania antibodies; however, this modality presents an uncertain diagnosis due to different stages of the infection and the low reproducibility between different serological tests [10]. On the other hand, the gold standard for detecting VL is microscopy of material aspirated from the bone marrow to search for amastigotes of the parasite in all slide fields [11].
The microscopy examinations generate a significant volume of images, which requires considerable time for proper detection and annotation. Specialists carry out this process and it is subject to errors, depending on the operator’s skill and the quality of the collected sample [12]. Despite the established conventions in the annotation process, many images are complex, resulting in miscount. Therefore, it is crucial to have an efficient diagnostic method to assist specialists in disease management [13].
The use of computational methods for analyzing medical images has several advantages over the traditional method of manual analysis performed by health professionals [14]. These advantages include faster analysis, reduced variability between results obtained by different specialists, the possibility of automated processing of large volumes of data, and the detection of subtle patterns that may go unnoticed by the human eye [14]. In addition, computational methods can allow more accurate decision-making and help health professionals in the early detection and treatment of diseases [15].
In order to alleviate repetitive work, it is pertinent to use machine learning techniques for processing medical images capable of diagnosing diseases [16]. Among these techniques, those of Computer Vision (VC) and Deep Learning (DL) stand out, widely used in the detection of diseases, including VL in humans, achieving high precision when analyzing the microscopy images of the biological material of the bone marrow [17].
The general objective of this work is to assist in diagnosing visceral leishmaniasis using Computer Vision and Deep Learning techniques to automatically detect amastigotes and identify the parasites in images of slides from the parasitological examination (microscopy) of the bone marrow.
The proposed method presents the following main contributions: a complete methodology for detecting the presence of VL in images of slide fields and segmentation of Leishmania parasites; and pre-processing methodology with dynamic clipping of images with the presence of amastigotes.
2. Related Works
This section presents the main works related to studying VL in images: introducing the objective of each work, some techniques used, image databases, and results achieved.
Nogueira (2011) [18] proposes a method to automatically determine the infection levels in microscopy images infected with the parasite Leishmania. For this purpose, the authors used computer vision and pattern recognition techniques. The images are subjected to a pre-processing step to normalize the lighting conditions. Then, the method performs the detection of Leishmania macrophages and parasites using Otsu [19] threshold techniques. Due to the overlapping of segmented regions, the authors used a rule-based statistical classifier [20] to divide these segmented regions. Finally, the sub-regions were classified using a Support Vector Machine (SVM) [21], defining the infection levels.
In the work of Nogueira and Teófilo (2012) [22,23], the authors developed automated methods to identify cells and parasites in microscopic images, allowing for more precise annotations. These authors used segmentation through the Otsu threshold, and then the segmented regions were divided into sub-regions using a rule-based classifier. The authors used a trained SVM with data extracted from several Gaussian Mixture Models (GMM) [24] of the segmented sub-regions. The accuracy of the methods was above 90%, with an approximate 85% accuracy in the individual detection of parasites in regions with multiple cores.
Neves (2013) [25] developed an automatic method for annotating Leishmania infections, using the K-means [26] grouper. The strategy primarily relied on detecting blobs, which are shapes that differ from other regions in the image, such as clear or dark circular forms [27]. Additionally, the authors performed cytoplasm segmentation, clustering, and separation by utilizing concave regions of the cell contours. This method was compared with the method by Leal (2012) [28] and obtained an F1-Score 8% higher in the detection of parasites.
In the work by Neves (2014) [12], the authors developed a method to determine the positions of infected macrophages and parasites. In addition to detection, the authors separated overlapping cells based on contour concavity. This method is also based on detecting, grouping, and separating blobs using concave regions of cell contours, as in Neves (2013) [25]. In comparison with the works by Nogueira (2011) [18] and Leal (2012) [28], the authors conclude that the proposed method achieves an F1-Score up to 6% better in the annotation of infections by Leishmania.
In Ouertani (2014) [29], the authors presented an automatic method for segmenting parasites. Due to the high contrast in images of this nature, it was possible to use a color-based segmentation to remove the background of the images using the K-means grouper. The proposed method was evaluated in 40 images, proving reliable and robust in terms of results. As a continuation of the research, Ouertani (2016) [30] added a pre-processing step to correct lighting non-uniformities, a primary segmentation step based on the Watershed [31] edge-detection algorithm, and a region-merging step using combined criteria of region homogeneity and edge integrity as a solution to the over-segmentation produced by the initial processing step.
In work by Gomes-Alves et al. (2018) [32], the authors presented an automatic image analysis method for counting Leishmania parasites. The work applied classical algorithms to segment and outline the image to identify parasites. The authors used 382 private images in this process, resulting in an infection rate of approximately 80%.
In work by Górriz et al. (2018) [17], the authors presented an unsupervised analysis method for detecting leishmaniasis parasites in microscopic images. They implemented Deep Learning techniques and trained a U-Net [33] model to segment Leishmania parasites and classify them into amastigotes, promastigotes, and adherent parasites.
In Moraes et al. (2019) [34], the authors presented a protocol to quantify the parasite load by high-content analysis based on the infection of macrophages with Leishmania promastigotes. The method can detect and quantify intracellular amastigotes, in addition to the total number of parasites and the number of parasites per infected cell.
Salazar et al. (2019) [35] proposed a semi-automatic segmentation strategy for the evolutionary parasites of VL, specifically the amastigote and promastigote types. Optical microscopy images are generated from the blood smear and subjected to transforming the color intensity space into an intensity space in gray levels. In the pre-processing step, smoothing filters and edge detectors were used to enhance the images. In the segmentation, the technique of region growth [36] was applied to group the pixels corresponding to each parasite. Finally, the segmentations obtained allow the calculation of the areas and perimeters associated with the segmented parasites. It is worth noting that the authors used an open dataset consisting of 45 microscopic images of bone marrow aspirate from patients with VL, made available by Farahi et al. (2014) [37].
In work by Coelho et al. (2020) [38], the authors developed an automatic method for determining the infection rate of amastigotes. For this, the segmentation method is based on mathematical morphology [39] and reached an Accuracy of 95% compared to the manual method. Therefore, this method contributes to a faster determination of the infection rate.
The works related to the state of the art presented difficulties in acquiring images of blade fields. Most datasets are private and analyze few images in their studies. Thus, a data acquisition problem was faced. Also, it was observed that most of the studies had not investigated the use of DL for image segmentation. These gaps led to the proposal of this work.
3. Materials and Methods
This work’s objective is to detect amastigotes in slide field images. This process has as output the identification of amastigotes, which directly reflects the degree of infection of the patient. The detection of amastigotes allows for estimating the severity of the infection since the parasite load is directly related to the intensity of symptoms and the prognosis of the disease. In other words, the greater the number of identified amastigotes, the greater the patient’s degree of infection. Figure 1 illustrates the methodology of this detection process.
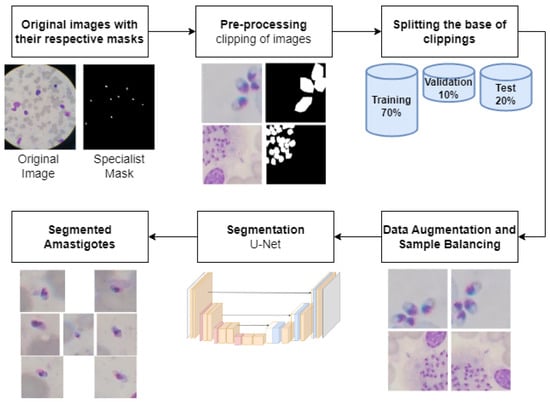
Figure 1.
Overview of amastigote detection methodology.
3.1. Image Acquisition
The set of microscopic images was acquired in collaboration with the Center for Intelligence in Emerging and Neglected Tropical Diseases (CIENTD) and the Natan Portella Institute of Tropical Diseases. These images are registered with the UFPI Research Ethics Committee under CEP/Conep 0116/2005. The images were acquired using slides from the parasitological examination of the material aspirated from the bone marrow.
The dataset consists of 150 images classified into positive and negative classes. Out of these images, 78 indicate the presence of amastigotes, while the remaining 72 indicate their absence. Experts from the mentioned institutions labeled all the images in positive or negative for VL. A single image was captured for each slide field, and there were no unlabeled images. Figure 2 shows examples of images labeled as positive or negative for VL.

Figure 2.
Images of parasitological examination slides of bone marrow. (a,b) are positive for VL. (c,d) are negative for VL. Parasites were marked with red circles for better visualization.
In addition to associating the label with the class to which the image belongs, the specialists also performed manual annotations on each positive image (annotation made with the help of the LabelMe tool, available at http://labelme.csail.mit.edu/Release3.0/, accessed on 6 July 2023), providing binary masks that indicate the region occupied by each amastigote in the images. Binary masks are representations of digital images that consist exclusively of black and white pixels. In this type of representation, white pixels are assigned to regions of interest, while black pixels represent the background.
In the dataset, for each Leishmania annotated, an individual mask was generated containing the location of a single parasite per image, totaling 559 identified Leishmania. This approach was necessary due to the overlapping of amastigotes in the images. The Leishmania cluster has overlapping areas, leading to identifying this cluster as a single region in the image. Figure 3 shows an example of a positive image containing a cluster of individually annotated parasites.
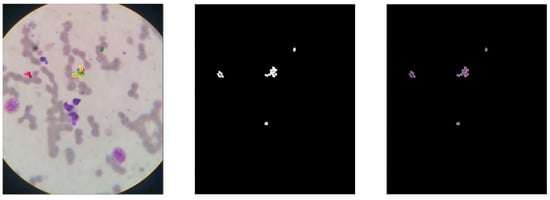
Figure 3.
Positive image with Leishmania parasite region annotated. The annotated image on the (left), the binary (center) mask, and the intersection of the original image with the mask on the (right).
In the acquisition process the specialist used a digital camera attached to the ocular structure of the Olympus Cba Microscope to capture images of the slides with biological material and stained with Panoptic, a staining technique used to highlight different cellular structures in a sample, applying an increase of 100×. Each image represents a single blade field in the dataset. The images have irregular dimensions that vary between 768 × 949 and 3000 × 4000 pixels.
3.2. Pre-Processing
Pre-processing refers to the initial steps of image treatment before they are analyzed by the detection model. This step is performed on images of fields with the presence of amastigotes in order to perform the segmentation. The Leishmania parasite represents a small dot on the image and disproportionately affects the size of the blade field images (images captured from a microscope slide containing a biological sample). Leishmanias have a proportion of 3% to 5% of the image size. Thus, using images with real dimensions in the segmentation model implies the problem of losing information about the amastigotes’ pixels due to the reduction of the dimensionality of the images to be entered into the network. Thus, pre-processing was performed on the images to avoid this problem. Figure 4 shows the steps of this cutting algorithm.
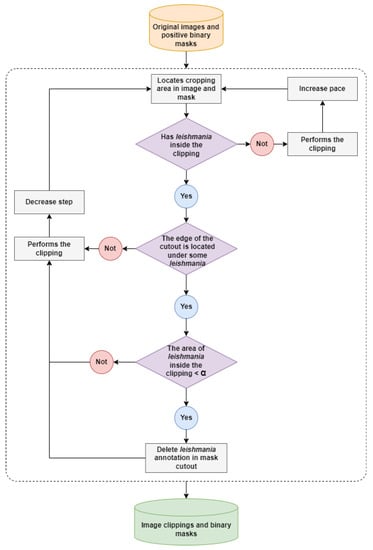
Figure 4.
Illustration of steps for clipping images and positive binary masks. The area delimited by the dotted line corresponds to the iterations of the clipping algorithm on the original images and positive binary masks.
The images were divided into clippings to use the segmentation methodology. This approach sequentially steps through the entire image based on the window size and the step between clippings. Thus, clippings are performed on the original images and the corresponding binary masks to generate new images with reduced dimensions. With the application of this technique, there is no loss of information from the parasites when loading the clippings in the model since the clippings have the same dimension as the network input. Based on the average size of the Leishmania in the images, clippings of size 96 × 96 pixels presented a better framing of the parasite. Additionally, smaller clippings do not accommodate certain parasites with large areas.
Based on the expert’s annotations, Leishmania parasites can have different area sizes within the same image, and there may be overlapping amastigotes, resulting in intersections of parasite areas. Thus, when generating each clipping in the images, it is analyzed whether the edge of the clipping window is cutting any Leishmania. If this occurs, it is checked whether the amastigote area inside the clipping is smaller than the minimum area () for removing the parasite. After analyzing the generated clippings, removing the Leishmania annotations in the binary masks, which have an area smaller than 50% inside the clipping, is acceptable.
Applying a fixed step size generates many negative class clippings and few positive class clippings, in a ratio of 1 positive clipping to 96 negative clippings. Therefore, a dynamic step size was adjusted based on the presence or absence of Leishmania within the clipping. If any amastigotes are found, the step is reduced by 8× to generate more positive clippings. Otherwise, steps of 96 pixels are used to generate fewer negative clippings. It is worth noting that the algorithm traverses the entire original image, and there are no regions without generated clippings. The orientation of the clippings is parallel to the image, which allows complete coverage of the field of view.
All hyper-parameters of the clipping function are predefined, such as clipping dimensions, steps between clippings, and minimum area for Leishmania removal. In addition, tests were performed with some color models, including RGB, LAB, and LUV. After several tests, Table 1 summarizes the hyper-parameters used to generate the clippings.

Table 1.
Hyper-parameters used for cropping the images and masks.
After running the clipping algorithm on the positive dataset, using the parameters from Table 1, 54,481 clippings were generated, 47,633 from the negative class, and 6848 from the positive class. These clippings show greater emphasis on the Leishmania parasites compared to the original image’s analysis. Figure 5 illustrates an example of a clipping generated by this approach.

Figure 5.
Example of a clipping with the presence of amastigote. Clipping of the image on the (left); clipping of the mask in the (center); intersection of the images on the (right).
3.3. Division of Clippings into Training, Validation and Testing
When training a deep learning network, using different datasets such as training, validation, and testing is essential. The training set trains the detection model, allowing it to learn from labeled examples and adjust its internal parameters. The validation set evaluates performance during training, adjusting hyperparameters and preventing overfitting. The test set, in turn, is reserved for evaluating the final model after training, providing an objective measure of its generalizability and readiness for use in a production environment. This split between the training, validation, and testing sets is key to correctly assessing the model’s performance and reliability against new data.
When there is the presence of amastigotes inside the clipping, the step between the clippings is reduced to 12 pixels to create more images of the same region. This displacement is considered small, and samples of the same image in the training and testing set can influence the accuracy of the segmentation model.
For this, the generated clippings were grouped according to the original image to prevent clippings from the same image from being present in the training dataset and in the test set. This work used 70% of the data for training, 10% for validation, and 20% for testing. Table 2 presents the division of clippings in the datasets. The accuracy of the split image percentage is not exact, as some images generate more clipping than others.

Table 2.
Division of clippings in the training, validation and testing databases.
3.4. Data Augmentation and Sample Balancing
After dividing the clippings, the classes are unbalanced, with the majority negative class. The imbalance of classes can hinder the learning of deep learning models. A strategy to overcome this problem is using data augmentation, which consists of creating synthetic images, or modified copies, based on real samples [40].
A challenge in adopting data augmentation is the definition of which techniques to employ among the variety of existing possibilities. A strategy to follow is to define which techniques best fit the problem and which hyper-parameter ranges are acceptable to avoid unwanted distortions in the images [40].
An alternative for the problem in question is randomly reducing the number of negative class images (undersample). However, in order to avoid losing samples of the negative class and to balance the data, an increase was applied to the data of the positive class (oversampling), using random operations of mirroring and rotations in addition to variations in brightness and contrast in the images.
In this work, data augmentation was performed on the positive class of training data, and validation samples were balanced. No technique was applied to the test set to obtain a realistic evaluation of the model. Data augmentation was implemented with the help of the Albumentations library, proposed by Buslaev et al. (2020) [41].
In order not to interfere with the synthetic samples of the positive class, a probability of 10% was used to perform variations in brightness and/or contrast in the images. Thus, in only 10% of data enhancement operations, there is an increase or decrease in brightness and/or contrast, with variations of up to 20%. In addition, other data enhancement techniques that modify the values of the pixels in the image, such as saturation, noise, and equalization, among others, were not applied due to the creation of synthetic images of the positive class of the disease. Table 3 presents the new division of clippings in the balanced datasets.

Table 3.
Balancing clippings in training, validation, and testing databases.
3.5. Model for Segmentation of Amastigotes
The proposed segmentation model performs the segmentation of amastigotes in blade field images. The U-Net [33] architecture was applied for the segmentation of parasites, as it is widely used in medical image segmentation [17,42,43]. This architecture seeks to automatically identify the pixels of interest in the image based on the binary masks containing the specialist’s notes. In this case, the pixels of interest contain Leishmania parasites.
This architecture was used to perform training with images and their corresponding binary masks. The balanced dataset was used to train the segmentation model, as described in Table 3. Table 4 presents the hyper-parameters used by the model.

Table 4.
Hyper-parameters used by the segmentation model of U-Net.
Within the scope of this study, the U-Net network is used to predict the presence of parasites, particularly in identifying the area of amastigotes in an image. This network can locate and distinguish edges and classify each pixel of the image, allowing precise segmentation of amastigotes. The U-Net is composed of two main parts: the contraction path, also known as the encoder, which captures the general characteristics of the original image, and the symmetrical expansion path, also called the decoder, which allows the precise location of the amastigotes by through the use of transposed convolutions [33].
Based on the U-Net architecture, our segmentation model uses four blocks of convolutional layers and maximum pooling in the paths of contraction and expansion of the image. Each block applies two consecutive 3 × 3 convolutions and the ReLU activation function between each convolution, followed by a 2 × 2 maximum pooling operation. At the end of each block of reduction or increase in the dimensionality of the images, a 10% dropout is applied to avoid overfitting the model. In total, the network has 23 convolutional layers.
Our segmentation methodology, model training, uses an initial learning rate 0.0001. This rate can be reduced based on the loss assessment in the validation dataset. During training, if the model does not show a decrease in the loss of validation for five consecutive epochs, the learning rate is reduced based on a decay factor. Additionally, even after this interference, if there is no reduction in the loss of validation for ten consecutive epochs, the model stops learning. It is worth noting that the model with the lowest loss on the validation set is saved to disk for further evaluation on the test set.
4. Results and Discussions
As previously explained, the available image base has amastigote markings. In this way, it was possible to carry out the segmentation experiments. The clippings generated from the 78 positive images for VL were used in this experiment. These clippings were divided into 70% for training, 10% for validation, and 20% for testing, as described in Table 3.
Due to the size of the amastigotes about the original size of the slide field images, the images were divided into clippings to use the U-Net methodology. Cutouts of size 96 × 96 were performed, with a dynamic step that varied based on the presence or absence of the amastigote. The segmentation evaluation stage uses metrics from the literature, such as the Jaccard index (IoU), Dice, Accuracy, Precision, Sensitivity, Specificity, and area under the ROC curve (AUC) [44]. Table 5 presents the results of the main segmentation experiments.

Table 5.
Main results of segmentation experiments.
The experiments were carried out based on the U-Net architecture. The results obtained for the best segmentation model were a Dice of 0.804, IoU of 0.752, and AUC of 0.859. Also, False Positive Rate (FPR) = 0.004 and False Negative Rate (FNR) = 0.278. Dice, IoU, and AUC targeting metrics assess targeting quality. The Dice coefficient measures the overlap between the targeted and true regions, with higher values indicating more accurate segmentation. The IoU calculates the proportion of the intersection over the union between the segmented and true regions, being a measure of similarity between them. The AUC is a metric used in classification tasks and represents the area under the ROC curve, assessing the ability to discriminate between classes in segmentation. The FPR metric indicates the background regions incorrectly segmented as amastigotes, and the FNR measure indicates the regions containing amastigotes and incorrectly identified as image backgrounds.
Among the experiments carried out, it was noticeable that some hyperparameters are more sensitive than others. They are the size of input clippings; the number of initial filters of the U-Net architecture; and the variation of brightness and/or contrast in the increase of data; the color spaces of images.
Figure 6 illustrates learning the U-Net model. Model training was stopped at the 27th epoch of learning, as there was no reduction in validation loss for ten consecutive epochs.
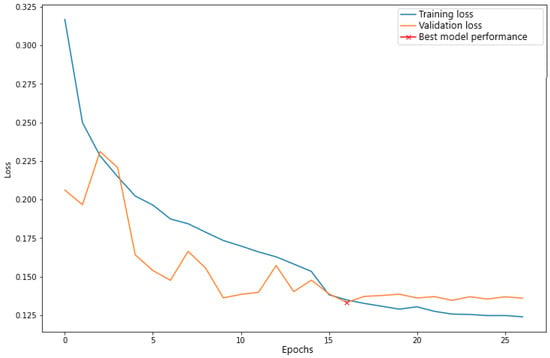
Figure 6.
Learning Curves of the U-Net Architecture. The marking (x) in red highlights the time when the model obtained the lowest validation error.
4.1. Comparison of Segmentation Results with State-of-the-Art Works
Table 6 compares the results of the proposed segmentation method with state-of-the-art works. The proposed method presented relevant results in all scenarios. It is worth noting that the state of the art provides a limited set of metrics for comparing results.

Table 6.
Performance of the proposed detection method compared to the state of the art.
4.2. Visual Results of the Segmentation
Despite the segmentation model presenting encouraging results, some images in the test set were segmented incorrectly. Figure 7 illustrates some images verified by the U-Net network. In Figure 7, the first column presents clippings of the original images, the second column the segmentation masks made by the specialists, and the third column is the result of the segmentation carried out with the U-Net network. The red line highlights the expert notes.
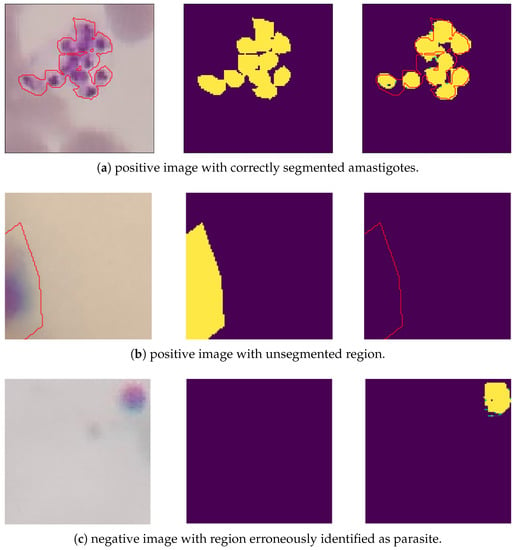
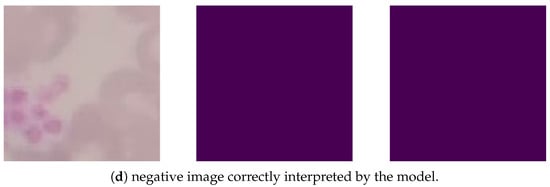
Figure 7.
Results for amastigotes segmentation. Original clipping on the (left); Ground truth in the (center); Predicted label on the (right).
Based on Figure 7, the image Figure 7a was correctly segmented, identifying the cluster of amastigotes in the image. The image Figure 7b shows a Leishmania annotated by the expert and located under the edge of the clipping, but the segmentation model did not recognize its region. Image Figure 7c has no parasites noted in the clipping, but a region was erroneously segmented. The image Figure 7d was correctly interpreted by the segmentation model, as it did not detect amastigotes in the image.
During the generation of clippings in a 96 × 96 pixel window, there were some situations in which the amastigote was located under the edge of the clipping and had an area smaller than 50% inside the clipping. For these cases, the Leishmania annotation was excluded from the clipping mask. This exclusion was necessary to prevent small “pieces” of Leishmania from being read by U-Net, and with that, the false positives generated by the segmentation model were reduced. Due to this pre-processing, the segmentation model recognized some amastigotes with large area sizes, as illustrated in Figure 8.
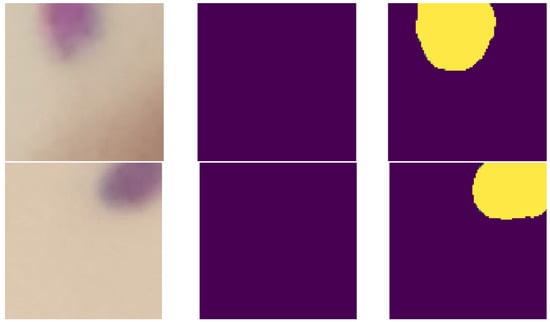
Figure 8.
Examples of false positives recognized by the model. Original clipping on the (left); Ground truth in the (center); Predicted label on the (right).
After empirical analysis of the segmentation results, the amastigotes recognized by U-Net present a better outline of the parasite region when compared to the specialist’s manual marking. This is because the U-Net has texture and edge markers with higher precision. The parasites were marked in the images using the LabelMe tool, proposed by Russel et al. (2008) [45]. This tool has polygon-based markings, making it difficult to annotate the regions of the parasites. Figure 9 illustrates some examples of imprecise annotations by the tool.
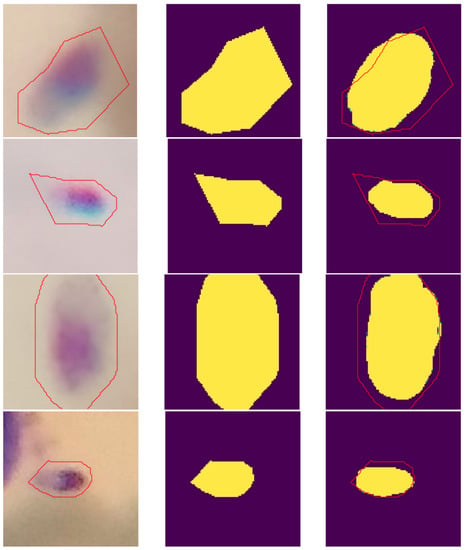
Figure 9.
Example of images with imprecise annotations of the parasites region. Original clipping on the (left); Ground truth in the (center); Predicted label on the (right).
Analyzing the results obtained by the proposed methodology, it is possible to list the following main limitations of this work: (1) It detects only human visceral leishmaniasis parasites; (2) The noise in the images can cause an erroneous detection; (3) The used dataset contains few VL image samples.
5. Conclusions
The proposed segmentation method demonstrated its efficiency in identifying image parasites, presenting a series of significant advantages. Firstly, the results obtained were promising, allowing a precise segmentation of parasites in medical images. This enables a rapid diagnosis of the disease, facilitating adequate treatment and reducing patient risks.
This research shows that the detection method can screen patients with VL using image analysis, especially considering that manual annotation of medical images is laborious and error-prone. The proposed method can automate this process.
This detection method based on image segmentation can help healthcare professionals diagnose patients and identify VL parasites, as it reduces manual workload and minimizes errors associated with manual annotation. However, it is important to emphasize that a challenge faced by this method is the need for more human VL images available for training and validation. Obtaining a broader and more diverse dataset is essential to improve and validate the method, ensuring its viability in real environments and providing a solid foundation for successful clinical implementation.
Implementing this technique has the potential to optimize technicians’ time and significantly expedite the diagnostic process. By relying on the machine’s findings, laboratory personnel can confirm the diagnosis more efficiently, eliminating most of the time-consuming manual inspection of slides to identify parasites. This streamlined approach would result in faster diagnoses, ultimately saving valuable time for laboratory personnel and improving overall efficiency in the diagnostic workflow.
Our approach was tailored based on the unique image dataset of confirmed visceral leishmaniasis cases, allowing us to optimize the methodology for this particular disease. However, we acknowledge that there is potential for future testing of the methodology with other diseases.
Finally, as future work, we intend to add a post-processing task in parasite segmentation to remove false positives; create a minimum viable product to present to clinical analysis laboratories. Furthermore, we intend to use a larger dataset to verify the efficiency of DL in detecting VL parasites in humans.
Author Contributions
Conceptualization: C.G., B.A. and R.S.; Methodology: C.G., A.B., V.D., J.M. and R.S.; Writing: C.G., A.B., V.D., J.M. and R.S.; Formal analysis and investigation: C.G. and R.S.; Funding acquisition: R.S.; Resources: B.A. and C.C.; Supervision: R.S. All authors have read and agreed to the submited version of the manuscript.
Funding
Foundation for Research Support of Piauí (FAPEPI-Notice 02/2021). The National Council for Scientific and Technological Development (CNPq).
Institutional Review Board Statement
Ethical approval CEP/CONEP 0116/2005.
Informed Consent Statement
Not applicable.
Data Availability Statement
All source codes used in this work are available in https://github.com/pavic-ufpi/Leishmania_Segmentation, accessed on 6 July 2023.
Acknowledgments
We thank the laboratory LABLEISH where we obtained the samples.
Conflicts of Interest
The authors declare no conflict of interest.
References
- World Health Organization. Leishmaniasis. Available online: https://www.who.int/news-room/fact-sheets/detail/leishmaniasis (accessed on 30 April 2023).
- Pan American Helth Organization. Visceral Leishmaniasis. Available online: https://www.paho.org/en/topics/leishmaniasis/visceral-leishmaniasis (accessed on 2 July 2023).
- World Health Organization. Number of Cases of Cutaneous Leishmaniasis Reported. Available online: https://www.who.int/data/gho/data/indicators/indicator-details/GHO/number-of-cases-of-cutaneous-leishmaniasis-reported (accessed on 30 April 2023).
- World Health Organization. Number of Cases of Visceral Leishmaniasis Reported. Available online: https://www.who.int/data/gho/data/indicators/indicator-details/GHO/number-of-cases-of-visceral-leishmaniasis-reported (accessed on 30 April 2023).
- Pan American Helth Organization. Leishmaniasis. Available online: https://www.paho.org/en/topics/leishmaniasis (accessed on 19 June 2023).
- Kumar, A.; Pandey, S.C.; Samant, M. DNA-based microarray studies in visceral leishmaniasis: Identification of biomarkers for diagnostic, prognostic and drug target for treatment. Acta Trop. 2020, 208, 105512. [Google Scholar] [CrossRef] [PubMed]
- Cunha, R.C.; Andreotti, R.; Cominetti, M.C.; Silva, E.A. Detection of Leishmania infantum in Lutzomyia longipalpis captured in Campo Grande, MS. SciELO Brasil 2014, 23, 269–273. [Google Scholar] [CrossRef]
- Antoine, J.C.; Prina, E.; Courret, N.; Lang, T. Leishmania spp.: On the interactions they establish with antigen-presenting cells of their mammalian hosts. Adv. Parasitol. 2004, 58, 1–68. [Google Scholar] [PubMed]
- Kumar, R.; Nylén, S. Immunobiology of visceral leishmaniasis. Front. Immunol. 2012, 3, 251. [Google Scholar] [CrossRef]
- Silva, L.A.; Romero, H.D.; Nascentes, G.A.N.; Costa, R.T.; Rodrigues, V.; Prata, A. Antileishmania immunological tests for asymptomatic subjects living in a visceral leishmaniasis-endemic area in Brazil. Am. J. Trop. Med. Hyg. 2011, 84, 261. [Google Scholar] [CrossRef] [PubMed]
- Silva, J.M.; Zacarias, D.A.; Figueirêdo, L.C.D.; Soares, M.R.A.; Ishikawa, E.A.; Costa, D.L.; Costa, C.H. BOne marrow parasite burden among patients with new world kala-azar is associated with disease severity. Am. J. Trop. Med. Hyg. 2014, 90, 621–626. [Google Scholar] [CrossRef]
- Neves, J.; Castro, H.; Tomás, A.; Coimbra, M.; Proença, H. Detection and separation of overlapping cells based on contour concavity for Leishmania images. Cytom. Part A 2014, 85, 491–500. [Google Scholar] [CrossRef]
- e Silva, R.R.V.; de Araujo, F.H.D.; dos Santos, L.M.R.; Veras, R.M.S.; de Medeiros, F.N.S. Optic disc detection in retinal images using algorithms committee with weighted voting. IEEE Lat. Am. Trans. 2016, 14, 2446–2454. [Google Scholar] [CrossRef]
- Silva, R.R.; Araujo, F.H.; Ushizima, D.M.; Bianchi, A.G.; Carneiro, C.M.; Medeiros, F.N. Radial feature descriptors for cell classification and recommendation. J. Vis. Commun. Image Represent. 2019, 62, 105–116. [Google Scholar] [CrossRef]
- Carvalho, E.D.; Filho, A.O.; Silva, R.R.; Araújo, F.H.; Diniz, J.O.; Silva, A.C.; Paiva, A.C.; Gattass, M. Breast cancer diagnosis from histopathological images using textural features and CBIR. Artif. Intell. Med. 2020, 105, 101845. [Google Scholar] [CrossRef]
- Gonçalves, C.; Andrade, N.; Borges, A.; Rodrigues, A.; Veras, R.; Aguiar, B.; Silva, R. Automatic detection of Visceral Leishmaniasis in humans using Deep Learning. Signal Image Video Process. 2023, 2023, 1–7. [Google Scholar] [CrossRef]
- Górriz, M.; Aparicio, A.; Raventós, B.; Vilaplana, V.; Sayrol, E.; López-Codina, D. Leishmaniasis Parasite Segmentation and Classification Using Deep Learning. In Proceedings of the Articulated Motion and Deformable Objects, Palma de Mallorca, Spain, 12–13 July 2018; Perales, F.J., Kittler, J., Eds.; Springer International Publishing: Cham, Switzerland, 2018; pp. 53–62. [Google Scholar]
- Nogueira, P.A. Determining Leishmania Infection Levels by Automatic Analysis of Microscopy Images. Master’s Thesis, Department of Computer Science, University of Porto, Porto, Portugal, 2011. [Google Scholar]
- Otsu, N. A threshold selection method from gray-level histograms. IEEE Trans. Syst. Man Cybern. 1979, 9, 62–66. [Google Scholar] [CrossRef]
- Tien, D.; Nickolls, P. A combined statistical and rule-based classifier. In Images of the Twenty-First Century. Proceedings of the Annual International Engineering in Medicine and Biology Society, Seattle, WA, USA , 9–12 November 1989; IEEE: Piscataway, NJ, USA, 1989; Volume 6, p. 1829. [Google Scholar]
- Hearst, M.; Dumais, S.; Osuna, E.; Platt, J.; Scholkopf, B. Support vector machines. IEEE Intell. Syst. Their Appl. 1998, 13, 18–28. [Google Scholar] [CrossRef]
- Nogueira, P.A.; Teófilo, L.F. Automatic Analysis of Leishmania Infected Microscopy Images via Gaussian Mixture Models. In Proceedings of the Advances in Artificial Intelligence—SBIA 2012, Curitiba, Brazil, 20–25 October 2012; Barros, L.N., Finger, M., Pozo, A.T., Gimenénez-Lugo, G.A., Castilho, M., Eds.; Springer: Berlin/Heidelberg, Germany, 2012; pp. 82–91. [Google Scholar]
- Nogueira, P.A.; Teófilo, L.F. A Probabilistic Approach to Organic Component Detection in Leishmania Infected Microscopy Images. In Proceedings of the Artificial Intelligence Applications and Innovations, Halkidiki, Greece, 27–30 September 2012; Iliadis, L., Maglogiannis, I., Papadopoulos, H., Eds.; Springer: Berlin/Heidelberg, Germany, 2012; pp. 1–10. [Google Scholar]
- Reynolds, D.A. Gaussian mixture models. Encycl. Biom. 2009, 741, 659–663. [Google Scholar]
- Neves, J.C.; Castro, H.; Proença, H.; Coimbra, M. Automatic Annotation of Leishmania Infections in Fluorescence Microscopy Images. In Proceedings of the Image Analysis and Recognition, Aveiro, Portugal, 26–28 June 2013; Kamel, M., Campilho, A., Eds.; Springer: Berlin/Heidelberg, Germany, 2013; pp. 613–620. [Google Scholar]
- Jipkate, B.R.; Gohokar, V. A comparative analysis of fuzzy c-means clustering and k means clustering algorithms. Int. J. Comput. Eng. Res. 2012, 2, 737–739. [Google Scholar]
- Lindeberg, T. Scale-Space Theory in Computer Vision; Kluwer Academic Publishers: Dordrecht, The Netherlands, 1994. [Google Scholar]
- Leal, P.; Ferro, L.; Marques, M.; Romão, S.; Cruz, T.; Tomá, A.M.; Castro, H.; Quelhas, P. Automatic Assessment of Leishmania Infection Indexes on In Vitro Macrophage Cell Cultures. In Proceedings of the Image Analysis and Recognition, Aveiro, Portugal, 25–27 June 2012; Campilho, A., Kamel, M., Eds.; Springer: Berlin/Heidelberg, Germany, 2012; pp. 432–439. [Google Scholar]
- Ouertani, F.; Amiri, H.; Bettaib, J.; Yazidi, R.; Ben Salah, A. Adaptive automatic segmentation of leishmaniasis parasite in indirect immunofluorescence images. In Proceedings of the 2014 36th Annual International Conference of the IEEE Engineering in Medicine and Biology Society, Chicago, IL, USA, 26–30 August 2014; pp. 4731–4734. [Google Scholar]
- Ouertani, F.; Amiri, H.; Bettaib, J.; Yazidi, R.; Ben Salah, A. Hybrid segmentation of fluorescent leschmania-infected images using a watersched and combined region merging based method. In Proceedings of the 2016 38th Annual International Conference of the IEEE Engineering in Medicine and Biology Society (EMBC), Orlando, FL, USA, 16–20 August 2016; pp. 3910–3913. [Google Scholar]
- Haris, K.; Efstratiadis, S.; Maglaveras, N.; Katsaggelos, A. Hybrid image segmentation using watersheds and fast region merging. IEEE Trans. Image Process. 1998, 7, 1684–1699. [Google Scholar] [CrossRef] [PubMed]
- Gomes-Alves, A.G.; Maia, A.F.; Cruz, T.; Castro, H.; Tomás, A.M. Development of an automated image analysis protocol for quantification of intracellular forms of Leishmania spp. PLoS ONE 2018, 13, e0201747. [Google Scholar] [CrossRef]
- Ronneberger, O.; Fischer, P.; Brox, T. U-Net: Convolutional Networks for Biomedical Image Segmentation. In Proceedings of the Medical Image Computing and Computer-Assisted Intervention—MICCAI 2015, Munich, Germany, 5–9 October 2015; Navab, N., Hornegger, J., Wells, W.M., Frangi, A.F., Eds.; Springer International Publishing: Cham, Switzerland, 2015; pp. 234–241. [Google Scholar]
- Moraes, C.B.; Alcântara, L.M. Quantification of Parasite Loads by Automated Microscopic Image Analysis. In Leishmania; Humana Press: New York, NY, USA, 2019; pp. 279–288. [Google Scholar]
- Salazar, J.; Vera, M.; Huérfano, Y.; Vera, M.I.; Gelvez-Almeida, E.; Valbuena, O. Semi-automatic detection of the evolutionary forms of visceral leishmaniasis in microscopic blood smears. J. Phys. Conf. Ser. 2019, 1386, 012135. [Google Scholar] [CrossRef]
- Adams, R.; Bischof, L. Seeded region growing. IEEE Trans. Pattern Anal. Mach. Intell. 1994, 16, 641–647. [Google Scholar] [CrossRef]
- Farahi, M.; Rabbani, H.; Talebi, A. Automatic boundary extraction of leishman bodies in bone marrow samples from patients with visceral leishmaniasis. J. Isfahan Med. Sch. 2014, 32, 726–739. [Google Scholar]
- Coelho, G.; Galvão Filho, A.R.; Viana-de Carvalho, R.; Teodoro-Laureano, G.; Almeida-da Silveira, S.; Eleutério-da Silva, C.; Pereira, R.M.P.; Soares, A.d.S.; Soares, T.W.d.L.; Gomes-da Silva, A.; et al. Microscopic Image Segmentation to Quantification of Leishmania Infection in Macrophages. Front. J. Soc. Technol. Environ. Sci. 2020, 9, 488–498. [Google Scholar] [CrossRef]
- Haralick, R.M.; Sternberg, S.R.; Zhuang, X. Image Analysis Using Mathematical Morphology. IEEE Trans. Pattern Anal. Mach. Intell. 1987, PAMI-9, 532–550. [Google Scholar] [CrossRef] [PubMed]
- Vieira, P.; Sousa, O.; Magalhães, D.; Rabêlo, R.; Silva, R. Detecting pulmonary diseases using deep features in X-ray images. Pattern Recognit. 2021, 119, 108081. [Google Scholar] [CrossRef]
- Buslaev, A.; Iglovikov, V.I.; Khvedchenya, E.; Parinov, A.; Druzhinin, M.; Kalinin, A.A. Albumentations: Fast and Flexible Image Augmentations. Information 2020, 11, 125. [Google Scholar] [CrossRef]
- Ojeda-Pat, A.; Martin-Gonzalez, A.; Soberanis-Mukul, R. Convolutional neural network U-Net for Trypanosoma cruzi segmentation. In Proceedings of the International Symposium on Intelligent Computing Systems, Sharjah, United Arab Emirates, 18–19 March 2020; Springer: Berlin/Heidelberg, Germany, 2020; pp. 118–131. [Google Scholar]
- Alharbi, A.H.; Aravinda, C.; Lin, M.; Venugopala, P.; Reddicherla, P.; Shah, M.A. Segmentation and classification of white blood cells using the unet. Contrast Media Mol. Imaging 2022, 2022, 5913905. [Google Scholar] [CrossRef] [PubMed]
- Müller, D.; Soto-Rey, I.; Kramer, F. Towards a guideline for evaluation metrics in medical image segmentation. BMC Res. Notes 2022, 15, 210. [Google Scholar] [CrossRef]
- Russell, B.C.; Torralba, A.; Murphy, K.P.; Freeman, W.T. LabelMe: A database and web-based tool for image annotation. Int. J. Comput. Vis. 2008, 77, 157–173. [Google Scholar] [CrossRef]
Disclaimer/Publisher’s Note: The statements, opinions and data contained in all publications are solely those of the individual author(s) and contributor(s) and not of MDPI and/or the editor(s). MDPI and/or the editor(s) disclaim responsibility for any injury to people or property resulting from any ideas, methods, instructions or products referred to in the content. |
© 2023 by the authors. Licensee MDPI, Basel, Switzerland. This article is an open access article distributed under the terms and conditions of the Creative Commons Attribution (CC BY) license (https://creativecommons.org/licenses/by/4.0/).