Article

Field Measurement Study on Dynamic Characteristics of the Shanghai World Financial Center

1
State Key Laboratory of Mountain Bridge and Tunnel Engineering, Chongqing Jiaotong University, Chongqing 400074, China
2
School of Civil Engineering, Chongqing Jiaotong University, Chongqing 400041, China
3
Earthquake Disaster Prevention Center, Shanghai Earthquake Administration, Shanghai 200062, China
*
Author to whom correspondence should be addressed.
Appl. Sci. 2023, 13(13), 7973; https://doi.org/10.3390/app13137973
Submission received: 18 April 2023 / Revised: 28 June 2023 / Accepted: 30 June 2023 / Published: 7 July 2023
(This article belongs to the Special Issue Advance of Structural Health Monitoring in Civil Engineering)

Abstract

:
It is of great practical importance to study the vibration response characteristics of super high-rise buildings under an earthquake action to provide a basis for seismic design and later maintenance of structures in coastal areas. During this study, the Shanghai World Financial Center (SWFC)’s health monitoring system was utilized to monitor earthquakes of magnitude 6.4 in Taiwan, 6.0 in Japan, 7.2 in the East China Sea, and 4.4 in Jiangsu, in real-time. Through the improved Envelope Random Decrement Technique (E-RDT), the dynamic properties of super high-rise buildings were examined under different earthquake effects in terms of the acceleration power spectrum, natural frequency, damping ratio, and mode shape. The results demonstrated that (1) the vibration responses of the structure in X (East–West) and Y (North–South) directions under four earthquakes were consistent, and with increasing floor height, the discreteness of the amplitude and acceleration signals of vibration responses increased. (2) The first two natural frequencies of the structure in X and Y directions decreased with the increase in amplitude, but the damping ratio increased with the increase in amplitude. The minimum values of the first two natural frequencies are 0.1498 Hz and 0.4312 Hz, respectively, and the maximum values of the first two damping ratios are 0.0086 and 0.0068, respectively. (3) Under different earthquake excitations, the SWFC’s mode shape’s estimates were similar, and their change trends in the X and Y directions were nonlinear as the number of floors increased. The structure was not seriously damaged by the four earthquakes. This study can provide helpful information for the seismic design of super high-rise buildings based on its findings.

1. Introduction

As economic levels and living conditions continue to improve, people have put forward new requirements for construction space and functional facilities. Due to their lightweight, high-strength, and low-damping properties, super high-rise buildings are becoming a hot spot in current construction. In 2020, China had 99 super-tall buildings with a height of more than 300 m, accounting for 61.5% of all super-tall buildings worldwide [1], such as the Shanghai Tower (632 m in height), Canton Tower (600 m in height), and Ping An International Finance Centre (592 m in height). During periods of operating load, strong winds, or earthquakes, these super high-rise buildings are subject to vibration deformation with a specific frequency and slow static deformation. The performance of these structures under dynamic loads depends on their structural characteristics, such as their mass, stiffness, damping ratio, and natural frequency [2,3]. Thus, to validate the structural design parameters of super high-rise buildings and to assess their operational safety, it is necessary to analyze their dynamic characteristics.
With the rapid development of sensors and data acquisition and processing systems, it has become easier to monitor and evaluate the dynamic characteristics of large-scale structures [4,5,6,7,8,9]. Field measurement is the most accurate and intuitive method to identify structural modal parameters. Numerous studies have been conducted on the response characteristics of high-rise building structures since the 1980s. For example, Kijewski et al. [10,11,12] developed a system for monitoring and analyzing the wind response of three high-rise buildings in Chicago for an extended period. Using the monitoring data, they analyzed the structural wind vibration response law and proposed improvements to the traditional method of estimating wind vibrations in wind tunnel tests. By using the modal parameter identification method under ambient excitation, Brownjohn et al. [13] obtained frequency and modal information from a high-rise building in Singapore and compared the results with finite element analysis results for different modeling schemes. Based on a large number of measured data, Jerry [14] investigated the nonlinear characteristics of structural damping varying with vibration amplitude and proposed a new damping model. Li et al. [15] installed 30 accelerometers on the 6 floors of the Taipei 101 tower (508 m in height) to form a health monitoring system, and they investigated the effects of wind and earthquakes on the dynamic properties of buildings. Although many scholars have conducted extensive research on the monitoring of dynamic characteristics of large structures, most of the existing research has been conducted at a specific height of medium and high-rise buildings, where there are few measurement points, and there is a lack of full-scale monitoring of the dynamic characteristics of super high-rise buildings based on the floor height.
Moreover, in recent years, dynamic parameter identification techniques based on on-site measurement data have been developed significantly, including Peak-picking (PP) methods [16,17], Frequency Domain Decomposition (FDD) methods [18], Random Decrement Techniques (RDT) [19], and Bayesian statistics [20]. Yi et al. [21] measured the wind field and structural wind-induced response of a 420 m super high-rise building in Hong Kong during 12 typhoons. They then calculated the damping ratio based on the RDT. The damping ratio was found to be discrete in the low-vibration region and stable in the high-vibration region. Chen et al. [22] used the enhanced FDD method to analyze the modal parameters of the measured data of the new TV tower in Guangzhou based on the environmental vibration measurements at different construction stages and under other excitation conditions. Their results were in good agreement with those of the finite element model. Zhang et al. [23] employed the Bayesian statistical method to examine the dynamic characteristics of different construction stages of Shanghai Tower (632 m in height) and studied the influence of ambient temperature, building quality and other excitation conditions on modal parameters. Zhou et al. [24] investigated the development of meta-based structural vibration control techniques by manipulating the propagation patterns of acoustic/elastic waves.
Despite extensive investigation, the existing modal identification methods are not well studied to solve the amplitude correlation of nonlinear structural dynamic parameters, and the traditional random decrement technique has low accuracy for parameter identification. Besides, the monitoring system installed on the high-rise building provides limited information regarding the seismic response, and the characteristics of the super high-rise building under an earthquake remain unclear. This study utilized the health monitoring system of the Shanghai World Financial Center (SWFC) to collect real-time structural vibration response data under the effects of four earthquakes, namely “Yilan, Taiwan” (E1, magnitude 6.4), “Kyushu Island, Japan” (E2, magnitude 6.0), “East China Sea” (E3, magnitude 7.2), and “Sheyang, Jiangsu” (E4, magnitude 4.4). We analyzed the effects of different seismic parameters on the dynamic characteristics of the super tall building by using the improved envelope RDT (E-RDT), Half Power Bandwidth (HPBW), PP, and FDD methods. The study results can provide references for damage detection, model updating, and seismic design of the building.

2. Structure and Monitoring System

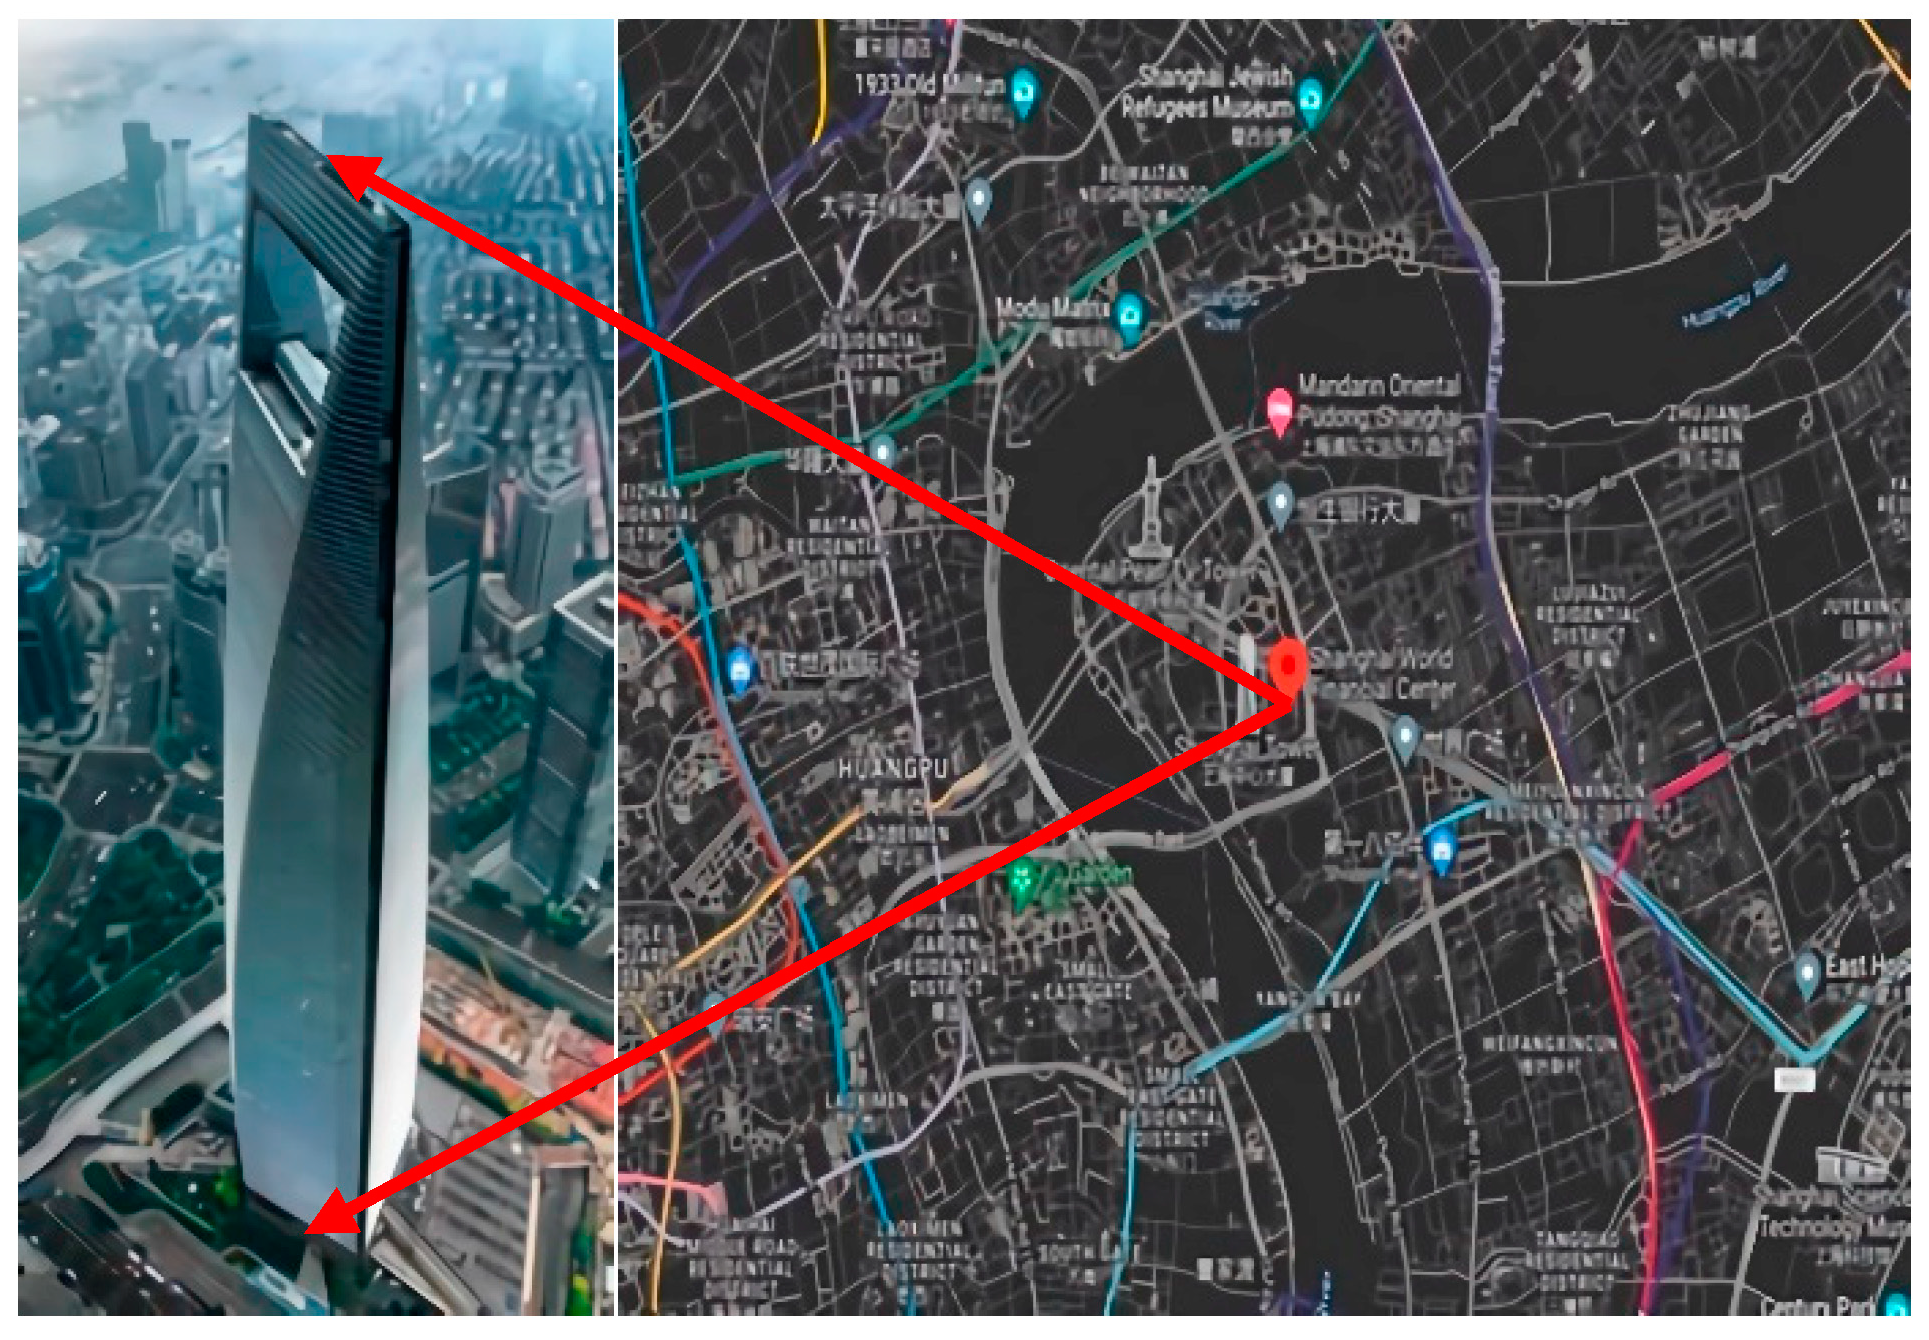
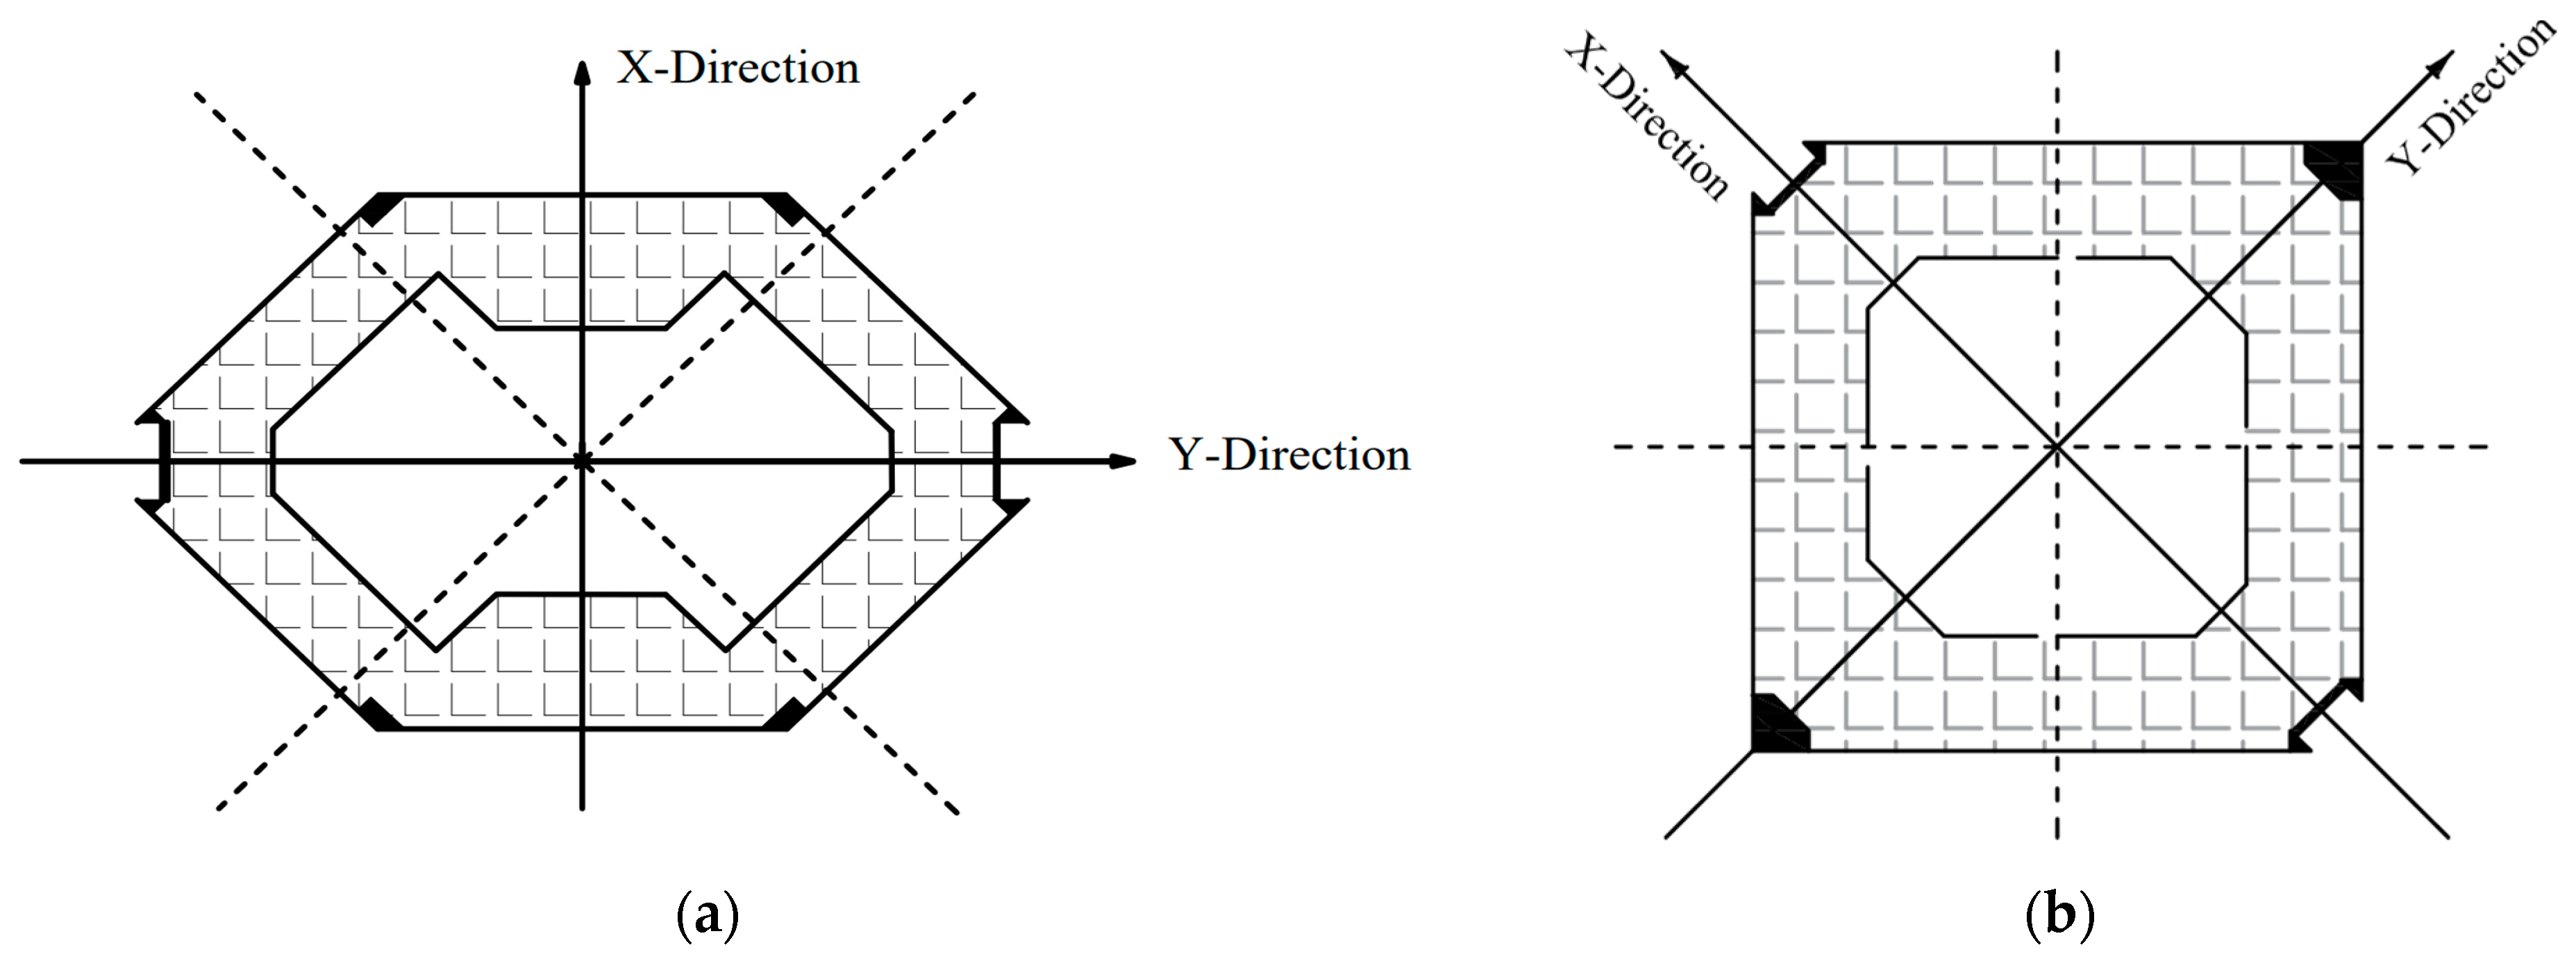
2.1. Structural Overview

The SWFC is located in Pudong New Area, Shanghai (Figure 1). The structure consists of 101 floors above ground and 3 floors underground, with a total height of 492 m and a diagonal arrangement of 57.95 m × 57.95 m in the floor plan (Figure 2), with a total construction area of approximately 350,000 m2 square meters. The main structure adopts a triple-force resisting system, which is a giant frame structure that bears the overturning moments caused by wind and earthquake and includes (1) a giant frame structure composed of giant columns, giant diagonal braces and perimeter band trusses, (2) a reinforced concrete core, (3) outreach arm trusses connecting the core and the giant structural columns. Furthermore, two active mass tuning dampers were installed on the 90th floor of the SWFC to suppress the vibration of the structure under strong wind and seismic loads [25].

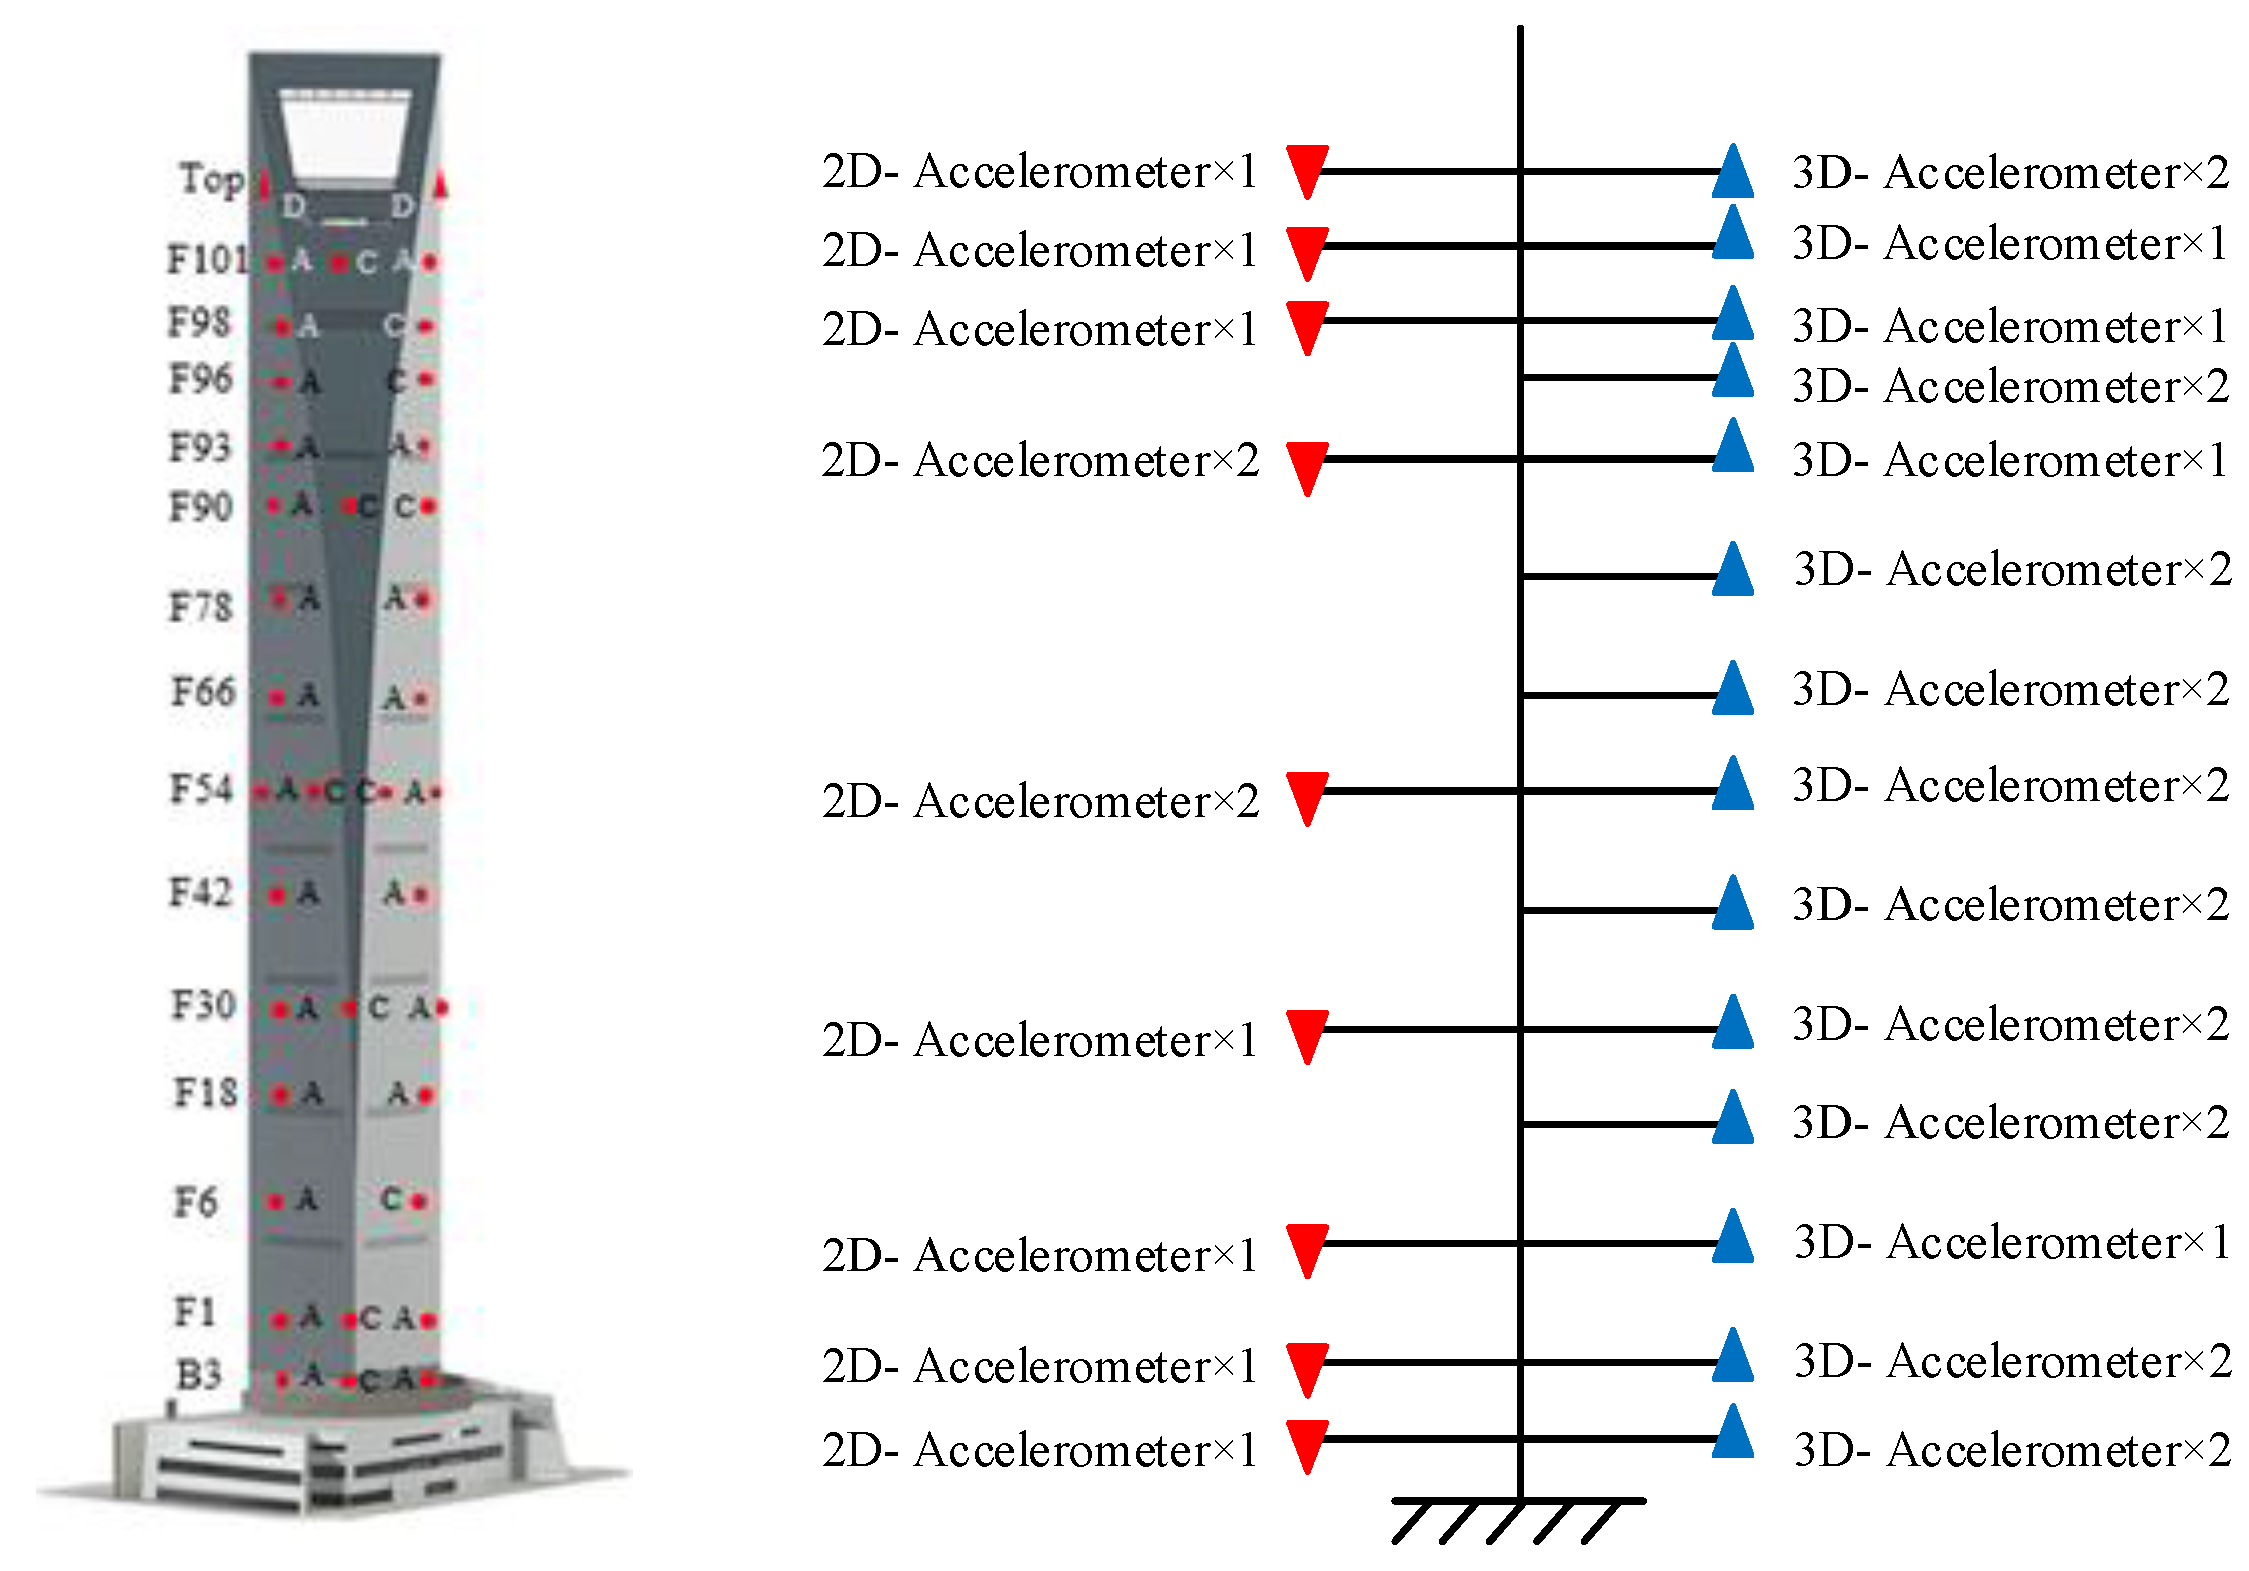
2.2. Sensor and Measuring Point Arrangement

To obtain the spatial dynamic response characteristics under the natural excitation of the structure, 35 measurement points, including 24 3-component accelerometers and 11 2-component accelerometers, with a total of 94 channels, were deployed in the free field, inside and outside the core near the SWFC. Acceleration sensors are located on floors B3, 1F, 6F, 18F, 30F, 42F, 54F, 66F, 66F, 78F, 90F, 93F, 96F, 98F, and 101F (Figure 3). Cables connect them to the TDE-324QI data acquisition instrument in observation rooms of F18 and F90, which digitizes the data at a frequency of 100 Hz. The parameters of the acquisition instrument and sensor are shown in Table 1. Among them, “A” is the three-component accelerometer, “C” is the two-component speedometer, and B and F represent the basement and the floor, respectively.

2.3. Dynamic Response Monitoring

The present study focuses on monitoring seismic response, and the health monitoring system has been exposed to several seismic events and has successfully recorded the dynamic response of buildings during seismic events. For example, there was a 4.4 magnitude earthquake of E1 in 2016, a 6.0 magnitude earthquake of E2 in 2016, a 7.2 magnitude earthquake of E3 in 2015, and a 6.4 magnitude earthquake of E4 in 2019. Using the monitoring data collected from the four seismic events, which were presented above, the vibration response of the SWFC building structure was analyzed using a sampling frequency of 100 Hz and durations of 300 s, 660 s, 660 s and 420 s. The seismic-related parameters are presented in Table 2.

2.4. Modal Identification Method

Recently, modal parameter identification technology based on real measurement data has received significant attention from the civil engineering and mechanical engineering communities [26,27,28,29], among which RDT has gained widespread popularity in the area of high-rise building modal parameter identification because of its superiority. However, the traditional RDT cannot obtain satisfactory free decay curves for the amplitude dependence of nonlinear structural dynamic parameters, thereby negatively affecting parameter identification. To address the above problems, we adopted the E-RDT and added an interception threshold to maximize the use of response data and to improve identification accuracy. Using this method, as well as the PP, HPBW, and FDD methods, the SWFC vibration response was successfully identified under the influence of earthquakes.

2.4.1. PP Method

The PP method is an operational modal analysis method proposed by Bendat [16] and Andersen [17], whose main steps are to convert the time domain signal of the characteristic spectrum into the frequency domain signal by fast Fourier transform (FFT) transformation and then to process the frequency domain signal to obtain the frequency response function. Under the conditions of low damping and good separation of the characteristic frequency, the natural frequency of the structure can be determined by the peak value of the response spectrum. Because of its simplicity and ease of operation, this method has been applied extensively in engineering.

2.4.2. HPBW

The HPBW method [30] solves the viscous damping ratio (i.e., the resonant peak of the power spectrum of the structural response is used to find the intrinsic frequency of the system). Then the system damping is obtained from its spectral line as follows:
ξ r = ω b ω a 2 ω r ,
where ω a and ω b are the frequency values corresponding to the amplitude of the power spectral density function before and after the intrinsic frequency A r / 2 , respectively, and A r is the amplitude of the peak power spectrum at the inherent frequency ω r .

2.4.3. FDD Method

The FDD method is a working modal analysis method proposed by Brincker et al. [18] to identify the dynamic properties of buildings. The basic idea is to perform singular value decomposition (SVD) on the power spectral density (PSD) matrix of the multi-output measurement signal, where each distinct value corresponds to each modal order under certain conditions, and then to analyze this single-degree-of-freedom power to obtain the modal parameters. The FDD method is theoretically straightforward, simple, and practical. The FDD method has been popular in mechanical and civil engineering fields because of its clear theory, simple practicality, ability to calculate the modal vibration patterns of structures, intense noise immunity, and similar modal resolution.

2.4.4. E-RDT

The E-RDT method [31] is a time-domain data preprocessing method for extracting the free attenuation vibration signal of the structure from its random vibration response signal of the structure. To determine the change in the building with amplitude, these steps should be performed:
(1) Modal decomposition of the original acceleration response time equation to obtain the first-order modal acceleration response time equation a1 and the second-order modal acceleration response time equation a 2 .
(2) The envelope A ( t ) is found for the measured response times of the structure according to the Hilbert transform [32].
A ( t ) = y 2 ( t ) + 1 π + y ( τ ) t τ d τ 2 ,
(3) Select multiple thresholds m j , j = 1 ,   2 ,   3 , ,     n ; use m j as the trigger condition to intercept the amplitude curve A ( t ) , find the points A j ( t i ) on the amplitude curve A ( t ) that intersect m j and the corresponding moment’s t i , i = 1 ,   2 ,   3 , ,     n , and also find the points y j ( t i ) on the response time course y ( t ) corresponding to these moments, i = 1 ,   2 ,   3 , ,     n ;
(4) Take the response time course of length τ backward from each y j ( t i ) as a response segment y j ( t i + τ ) . If y j t i < 0 , then y j t i + τ = y j t i + τ .
(5) To find the random decrement function D j ( τ ) , which corresponds to the amplitude m j , all data response segments corresponding to ( y j t i + τ | y j t i = m j ) with initial values smaller than m j corresponding to m j 1 , m j + 1 ( y j 1 t i + τ | y j 1 t i < m j ) , and ( y j + 1 t i + τ | y j + 1 t i < m j ) are also added to the summation average of D j ( τ ) , which corresponds to the sought amplitude m j . Then, the stochastic decrement function is obtained as follows:
D j ( τ ) = 1 N 1 i = 1 N y j 1 t i + τ y j 1 t i < m j + 1 N i = 1 N [ y j t i + τ A j t i = m j + 1 N 2 i = 1 N y j + 1 t i + τ y j + 1 t i < m j ] ,
(6) The random decay function is fitted to the theoretical free decay curve with three splines, and the structure’s self-oscillation frequency and damping ratio corresponding to the threshold m j are calculated.
(7) The amplitude correlation of the power characteristic parameters is obtained by corresponding each of the received power characteristic parameters to the threshold m j .

3. Dynamic Response of the SWFC

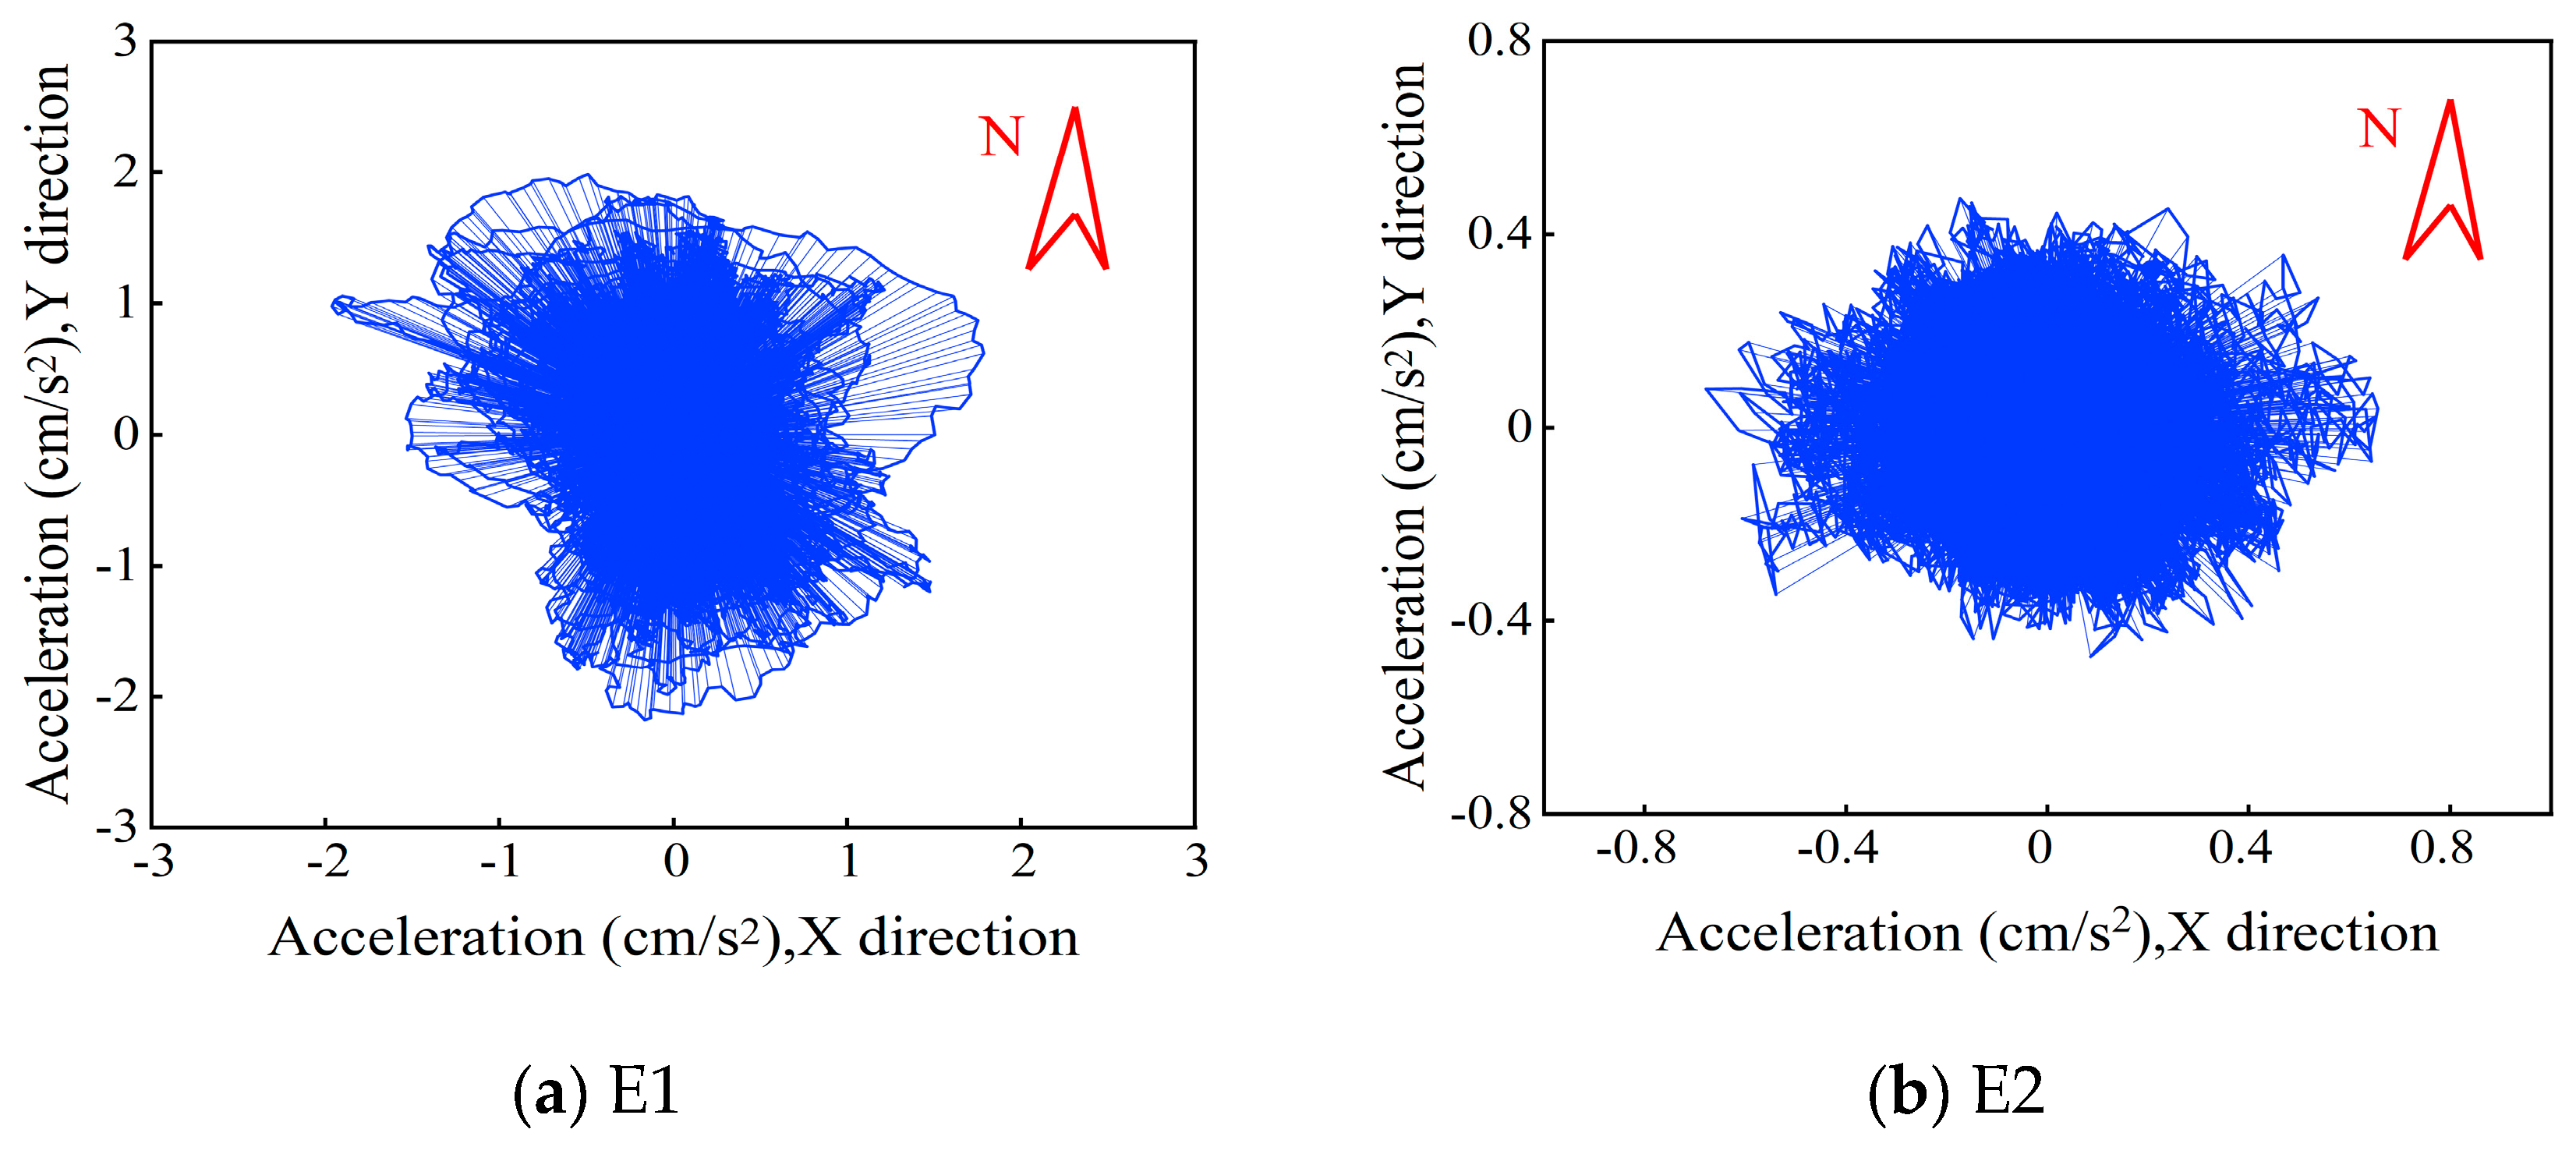
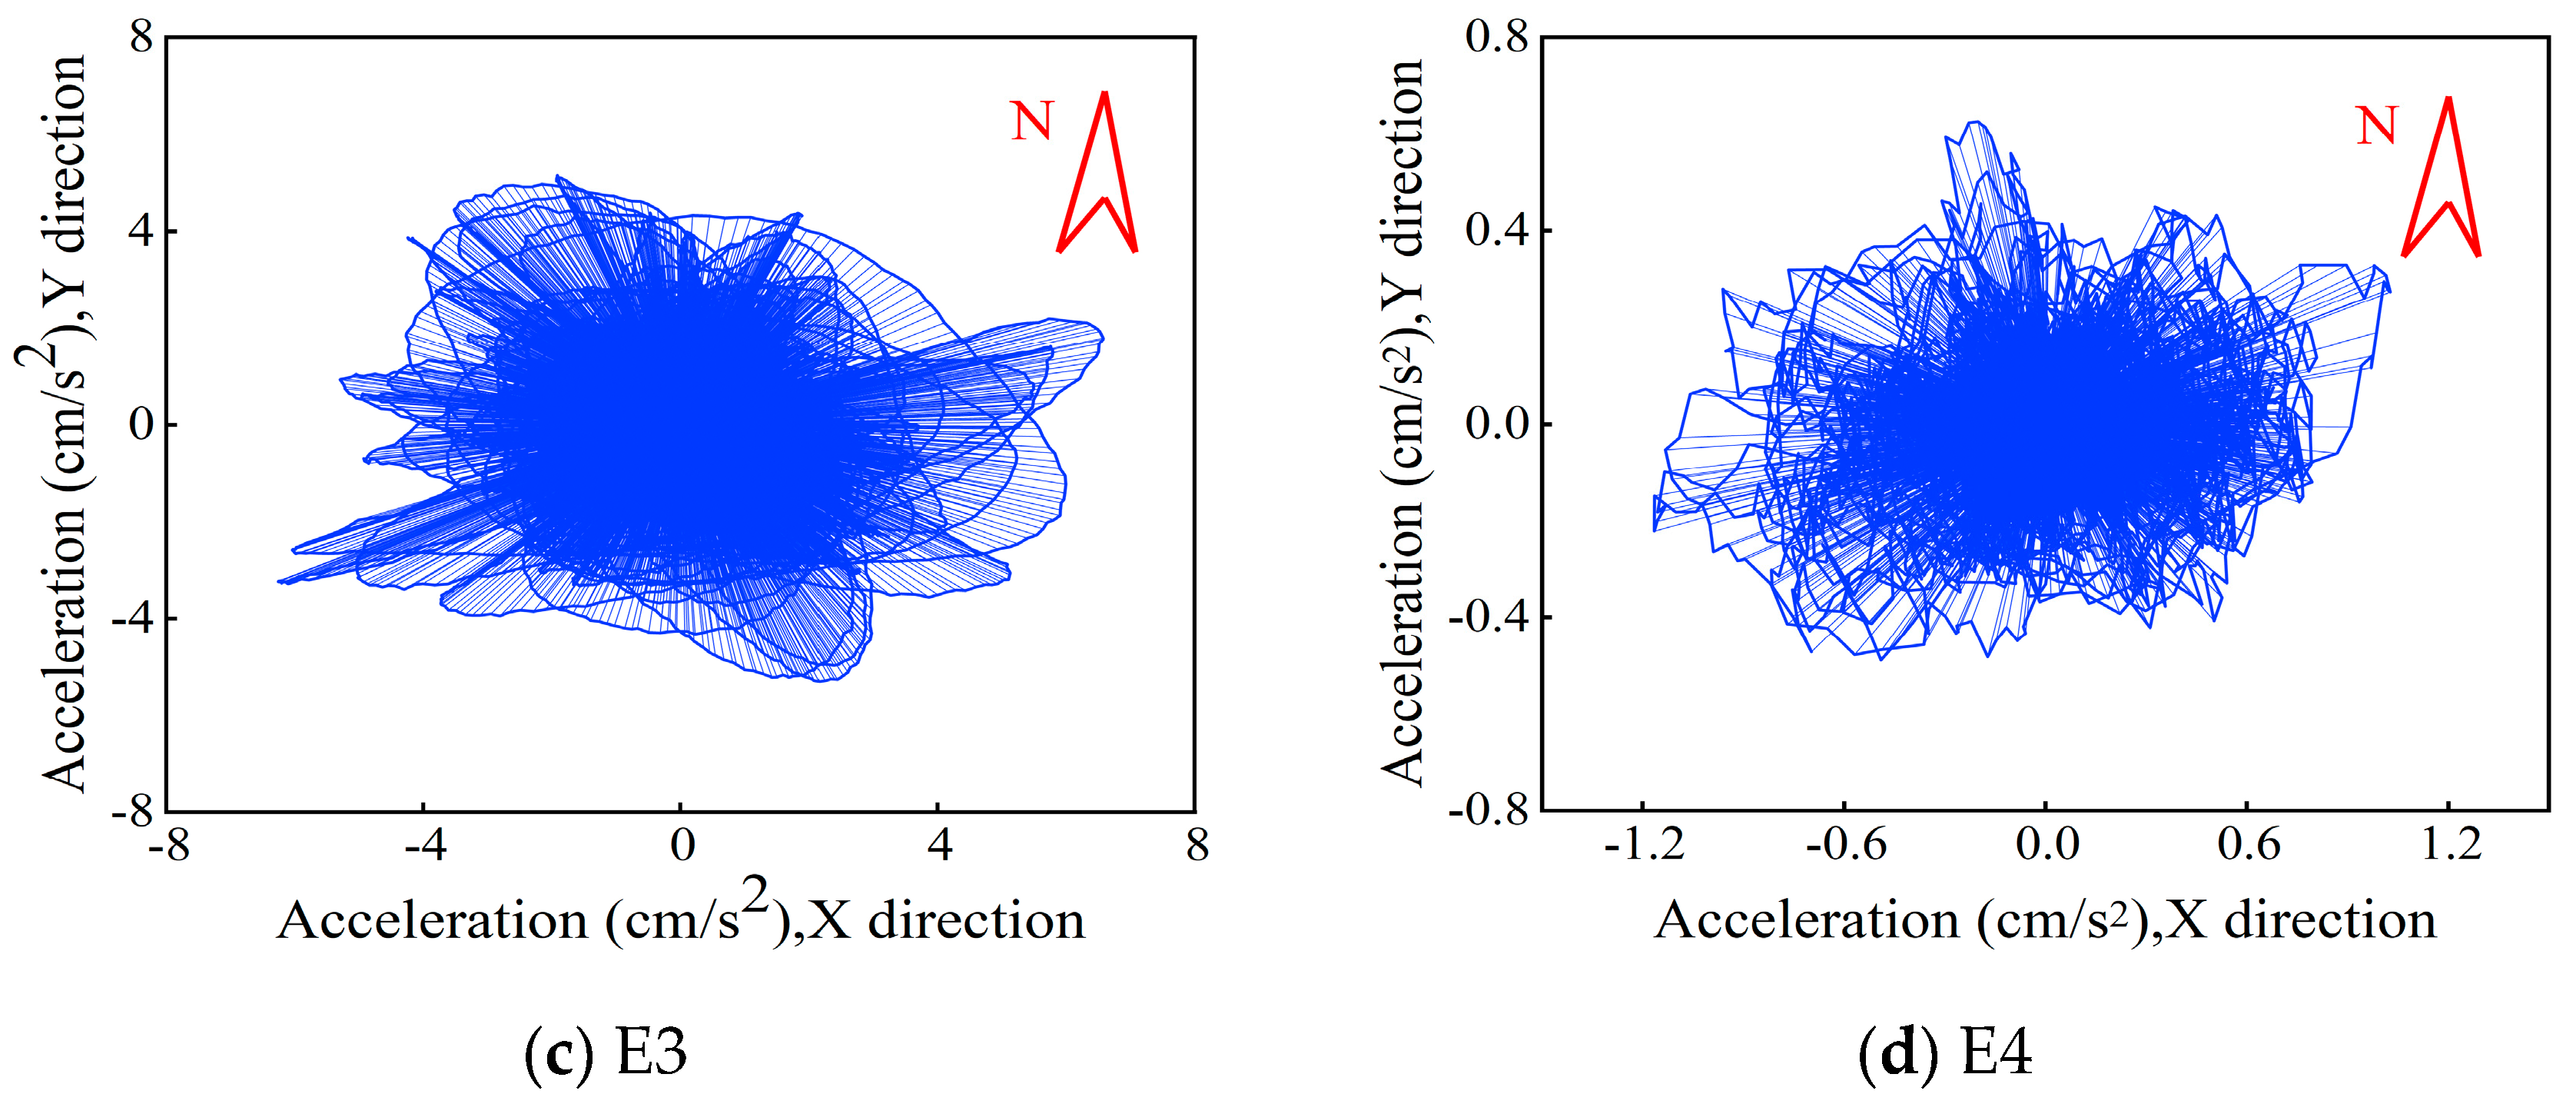
3.1. Earthquake-Induced Response

The measured sensor data on the top 101 floors of the structure were selected for analysis, and the acceleration response time history and motion trajectories in the X and Y directions of the 101 floors of the building are depicted in Figure 4 and Figure 5. From these figures, the east-west (X-direction) and north-south (Y-direction) vibrations of the SWFC are approximately the same under the four earthquakes, indicating that the stiffness of the SWFC is similar in the X-direction and Y-direction. Besides, the vibration amplitude changes abruptly in the first part of the vibration, and the acceleration response increases suddenly and then decays gradually until it flattens out, which may be caused by the fact that the observation site is located within a medium-strong seismic zone within the North China tectonic block, and seismic intensity and peak acceleration decay according to a law [33,34].
From Figure 4a–d, the maximum acceleration response amplitudes of all 4 earthquakes occur in the X-direction with 1.984, 0.656, 6.573, and 1.027 cm/s2, respectively, and in the Y-direction, the maximum instantaneous accelerations of the structure are 1.784, 0.474, 5.149, and 0.626 cm/s2, respectively. Among them, the acceleration amplitude is the largest under the earthquake of E3. The seismic intensity level, measurement distance, and propagation medium are the main reasons affecting the size of the seismic reaction.
To further investigate the variation law between acceleration amplitude and floor height, based on the measured results, the relationship curves of the peak acceleration response in X and Y directions with floor height under different seismic effects are shown in Figure 6. Figure 6 shows that the change trends under the four earthquakes are essentially the same. That is, with the increase of the floor height, the peak acceleration response in the X and Y directions of the structure first increases to 40F, then decreases to 80, and the growth rate becomes faster above 80F. The test system’s maximum acceleration amplitude appears on the 101st floor. The result indicates that a super-tall building’s superstructure is susceptible to vibration excitation, the amplitude of vibration response increases, and the dispersion of acceleration signal increases gradually with the rise in floor height. It is noteworthy that there is no apparent decreasing trend of acceleration peak near 40F of the structure under the earthquake of E4. This may originate from the low seismic intensity level and the close distance of the source from the SWFC (only 299.7 km), and may also come from the fact that the giant frame and core concrete of the SWFC do not contribute to structural nonlinearity.

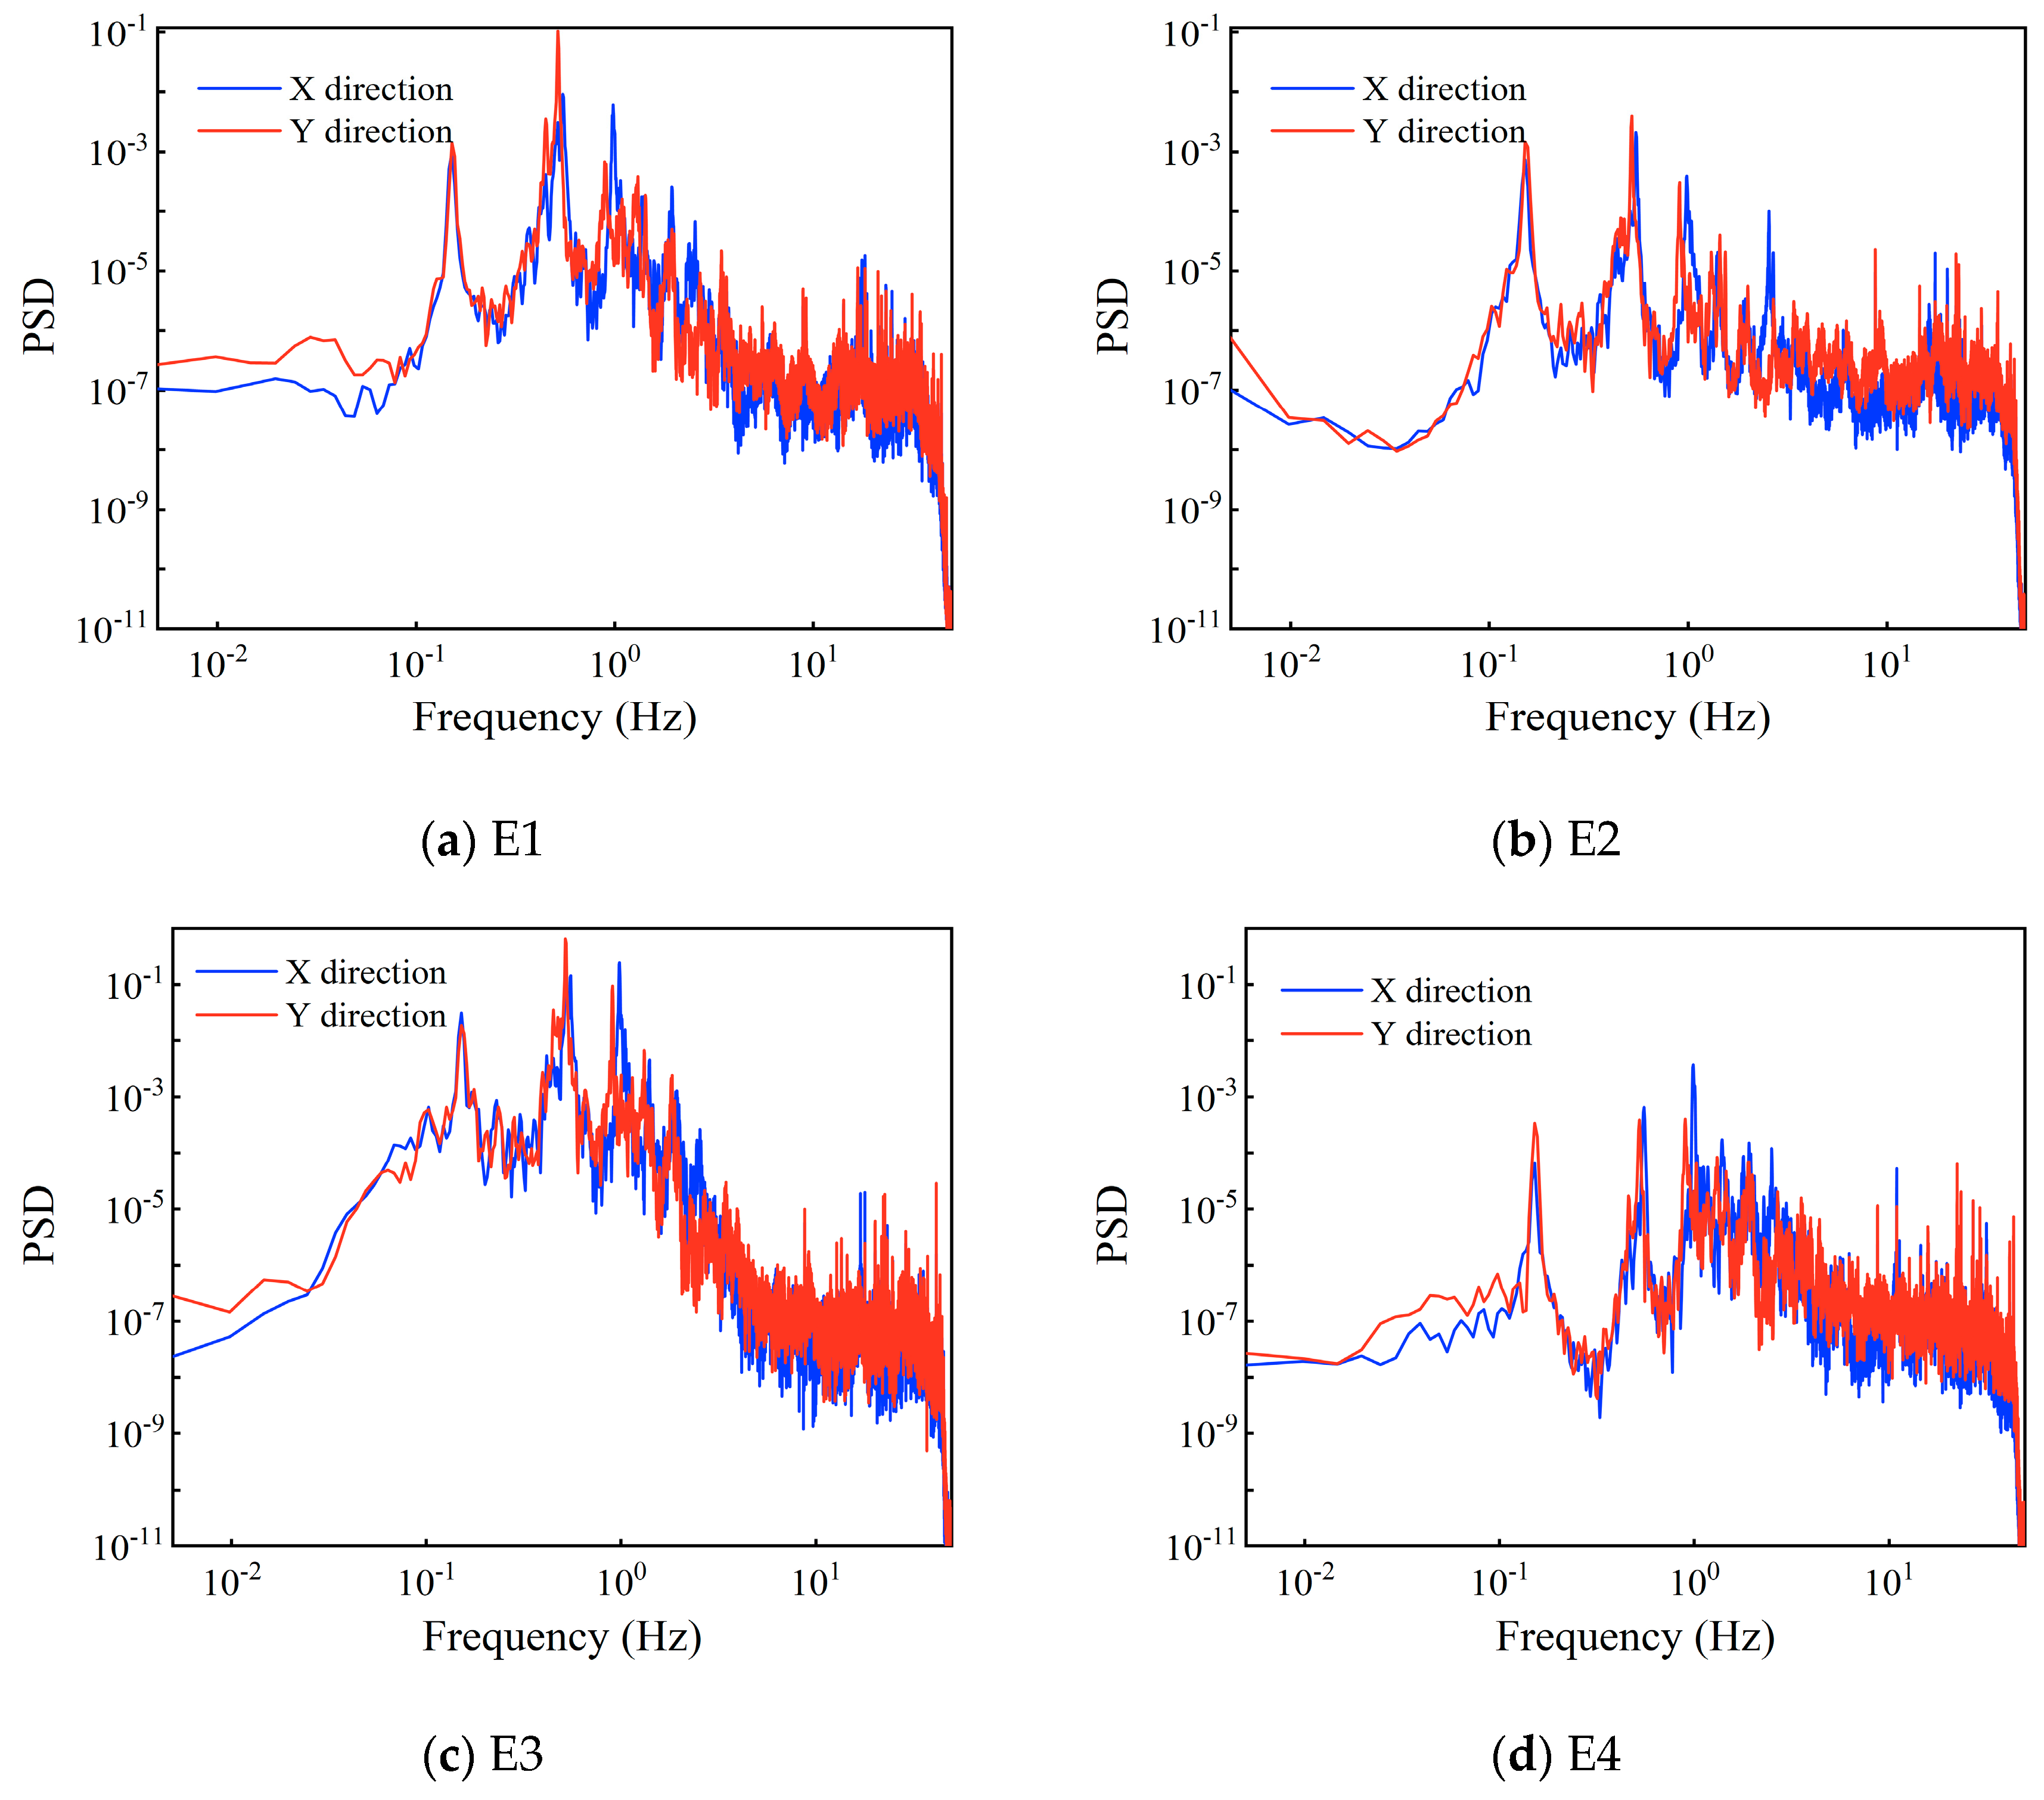
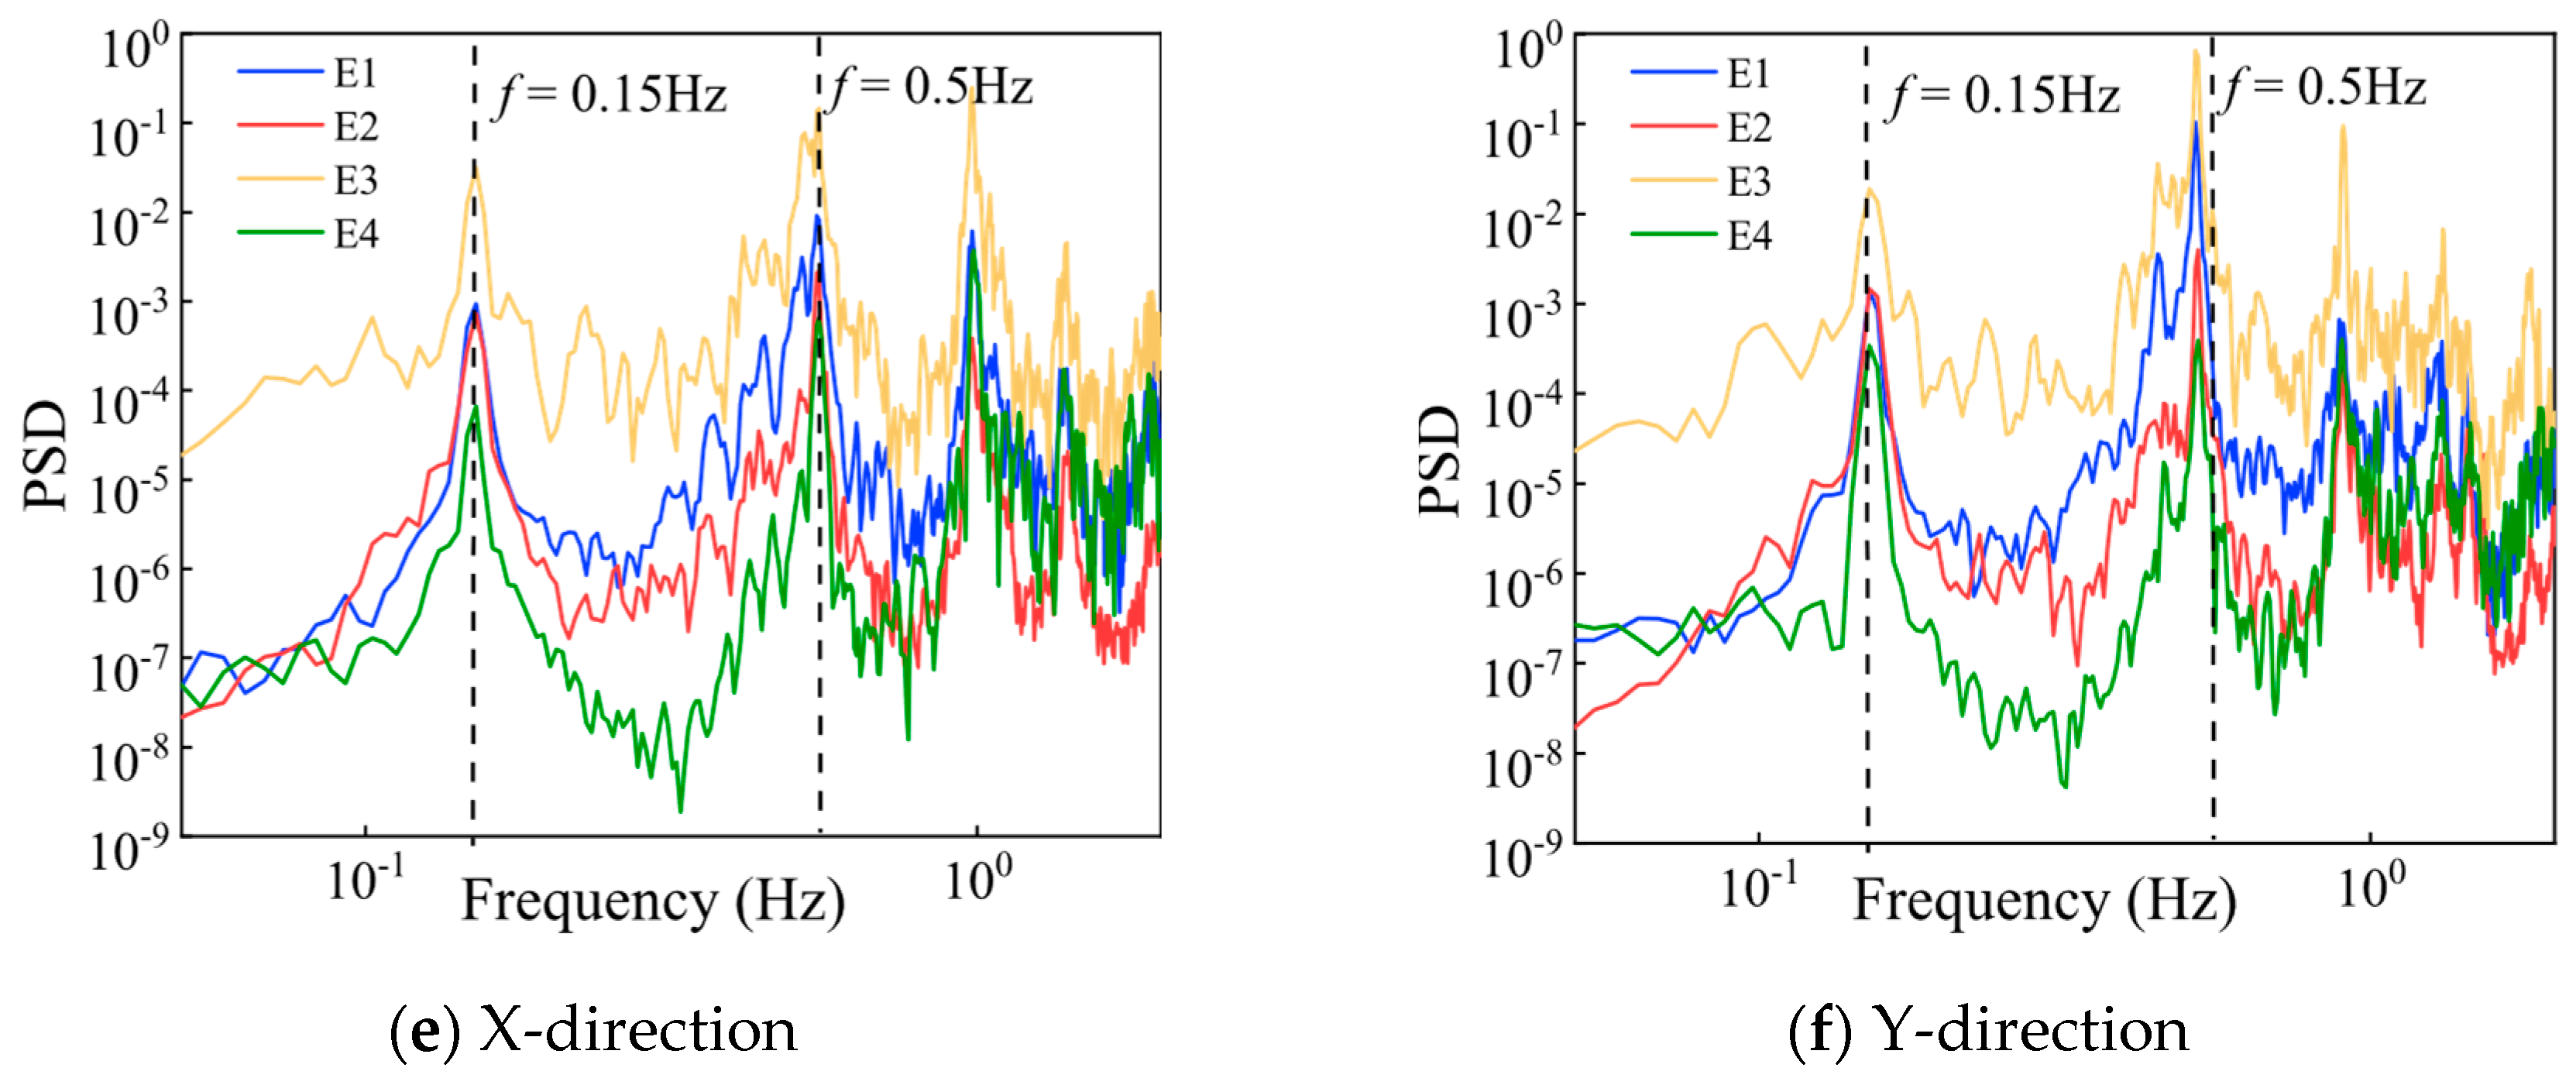
3.2. Acceleration Power Spectrum

The acceleration power spectrum is an essential statistical parameter to examine the frequency domain characteristics of random vibration, which can reflect the statistical average characteristics of vibration signal data [35]. According to the acceleration response signal in Figure 4, fast Fourier transform (FFT) is employed to acquire the 101F power spectral density under the action of four earthquakes (Figure 7). Figure 7 exhibits that power spectrum curves in the X and Y directions have similar trends, and the peaks are arranged regularly. The power spectrum value under the earthquake of E3 is the largest, and its peak value increases as seismic intensity increases. A preliminary analysis of the acceleration power spectra under four seismic effects was performed using the PP method to obtain the natural frequencies in two orthogonal directional sway modes, and a comparison of the natural frequencies identified using this method as well as the E-RDT method is given in Table 3.
Table 3 displays that the PP method and E-RDT method have a smaller error at the first-order natural frequency, and the results are similar. Under the earthquake of E4, only the first-order natural frequency error is larger, which is 3.56%. In contrast, the error of the second-order natural frequency identified by the two methods is large, ranging from 5.88% to 17.9%. Due to the subjective selection of the peak in the PP method, there is a lower level of recognition accuracy, with certain limitations related to the recognition of heavy frequency modes. As shown in Figure 7, the power spectrum overlaps at the second-order natural frequency, which causes interference with identifying the natural frequency. Furthermore, Figure 7e,f illustrate that under different modes, the natural vibration frequencies of the structure in the X and Y directions are similar under the four earthquakes, which further demonstrates the similarity between the structure’s stiffness in the X and Y directions.

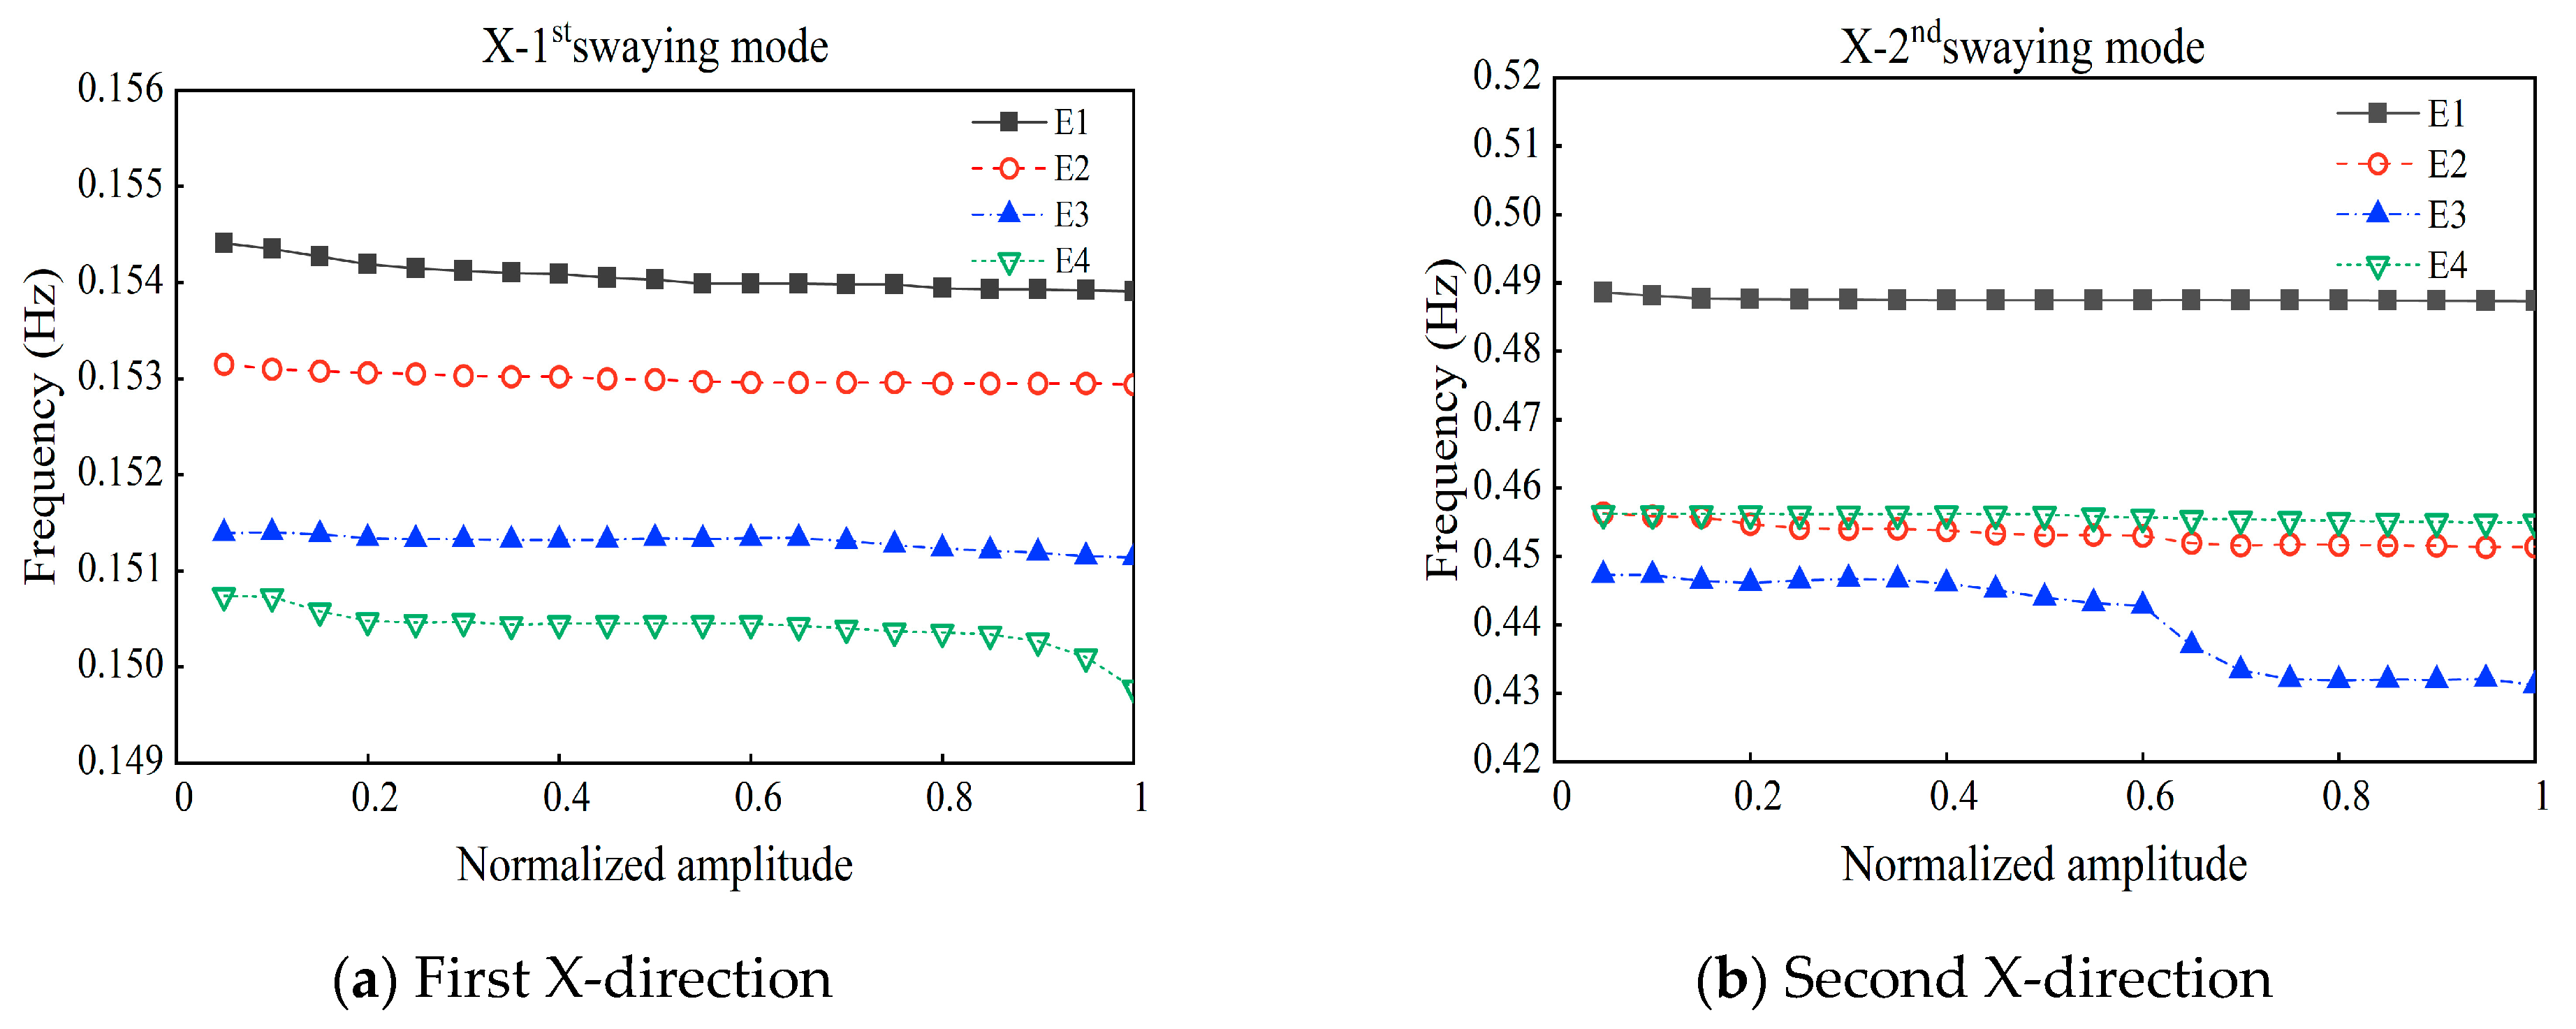
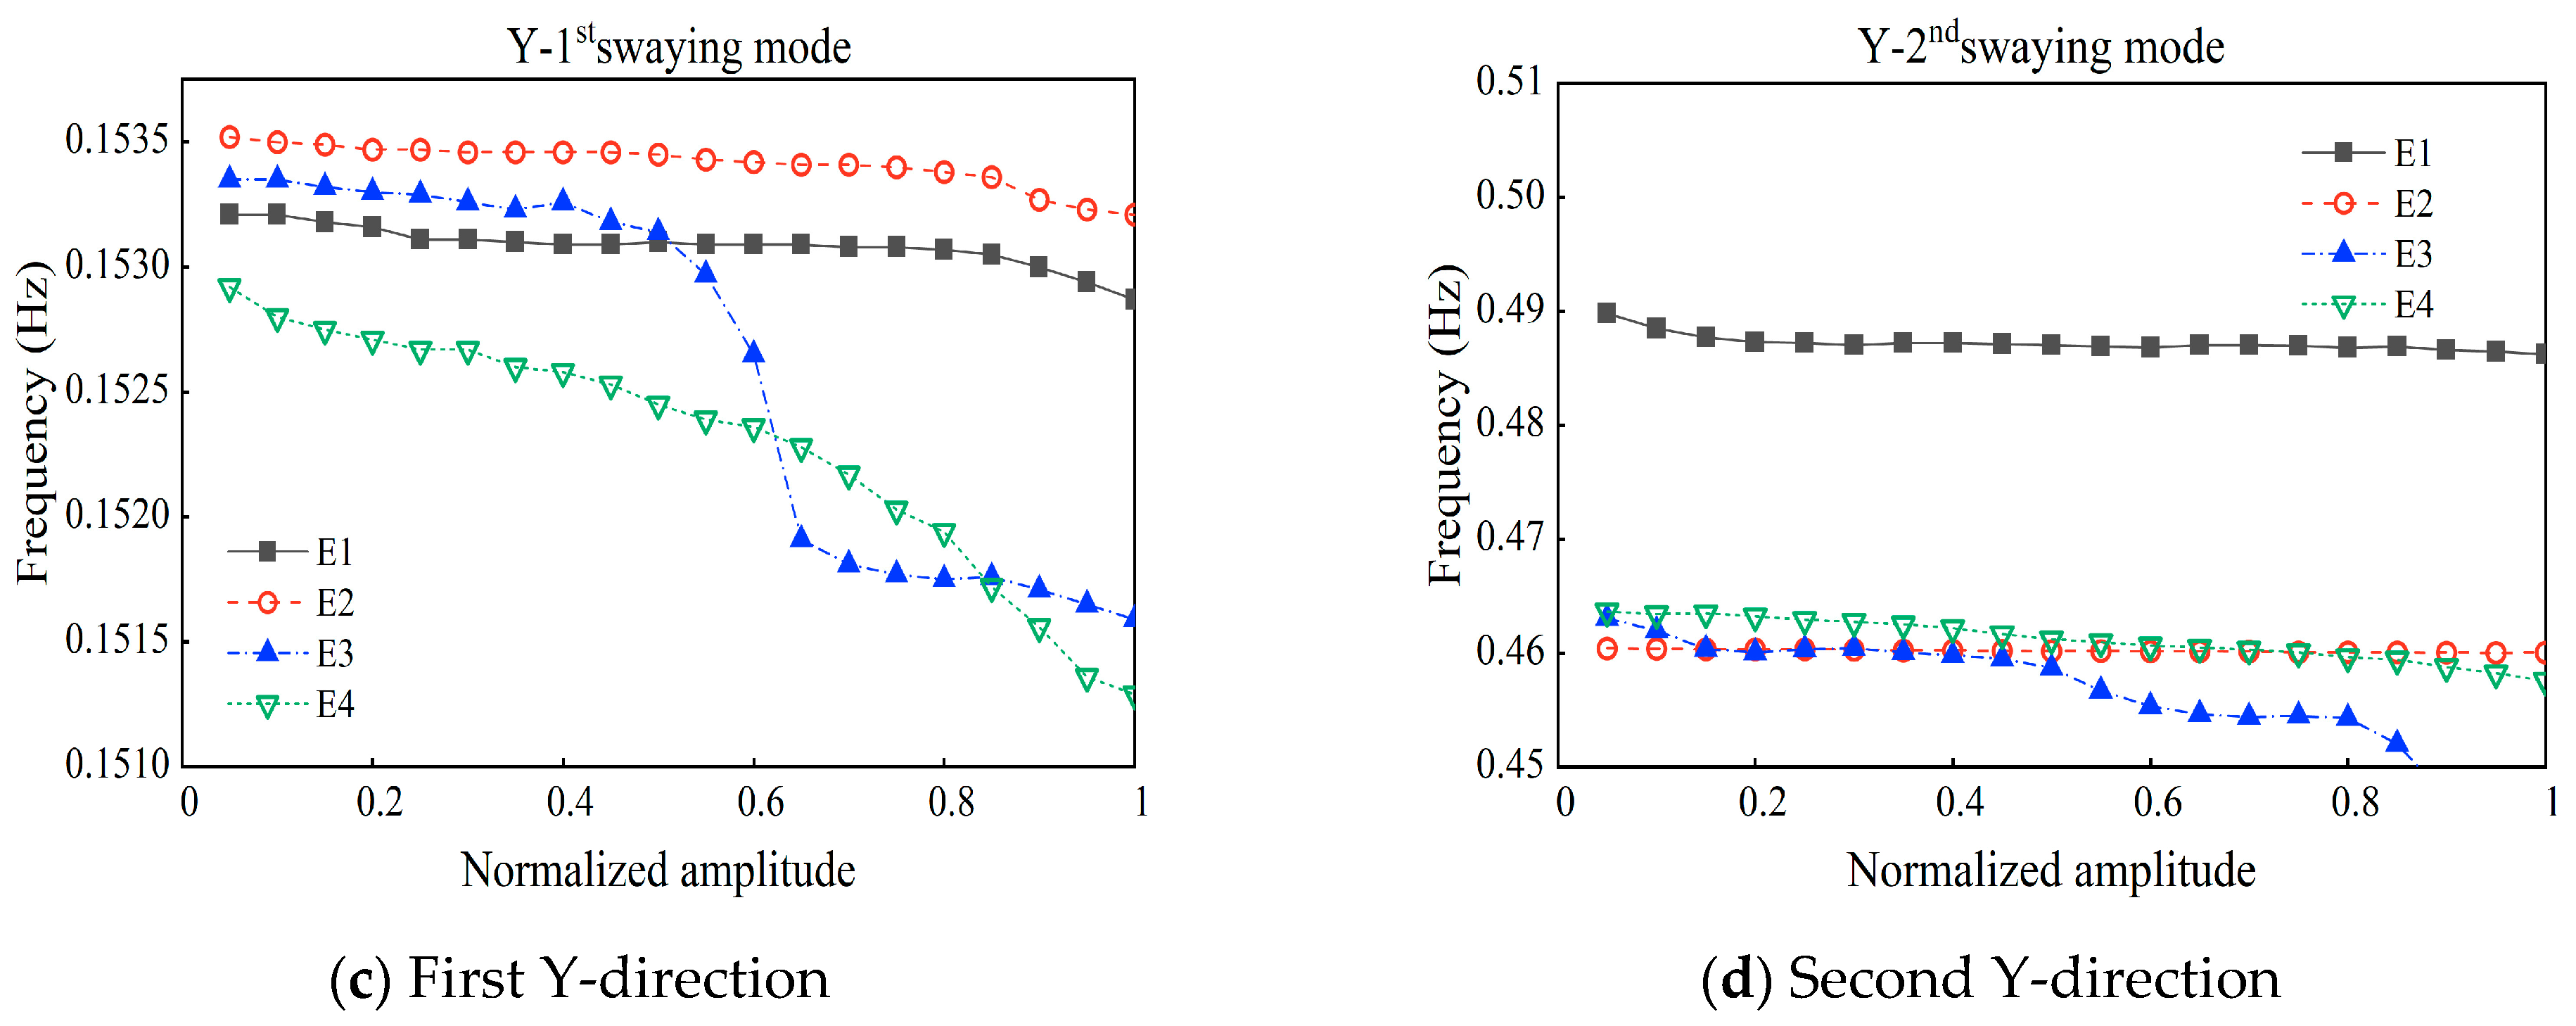
3.3. Natural Frequency Amplitude Dependency

Natural frequency is one of the important parameters used to describe the dynamic characteristics of high-rise buildings, and it is very important to accurately determine the size of the natural frequency in the structural design to evaluate the safety of the structure [36]. To improve the data utilization, the correlation curves of the first two orders of the natural frequency with amplitude in the X and Y directions of the SWFC under four earthquakes were determined. This was achieved by using the E-RDT method based on time-range data of the 101F acceleration response obtained in Figure 4, and by setting 20 intercepts from 0.1 times the standard deviation to 2.5 times the standard deviation (see Figure 8).
Figure 8 shows that the first two orders of natural frequencies of the building decrease with an increase in structural amplitude under each of the four earthquakes, among which the decreasing trend of natural frequencies is most apparent under the earthquake of E3. This is in agreement with Zhou et al. [37] and Li et al. [9]. This phenomenon can be explained by the stick-slip model proposed by Davenport and Hill-Carroll [38]. When the amplitude of the structural response is at a low level, the contact surfaces between the structural members do not move, but when the amplitude of the structural response increases to a specific value, a nonlinear response is generated and the contact surface steel nodes begin to slip, thus resulting in weakened structural stiffness. With an increase in structural amplitude, the number of sliding contact surfaces increases, leading to a decrease in the natural frequency of the structure.
To compare the related characteristics of structural natural frequency amplitudes under different earthquakes, the acceleration amplitudes under four earthquakes were normalized by modal shapes, and the normalized amplitude-related natural frequencies are shown in Figure 9. It can be observed that the differences in the magnitudes of the structural natural frequencies during different earthquakes are minor. Except for the earthquake of E3, the normalized curves of the natural frequencies of each order in other directions have a gentle trend, and the maximum decrease rate is smaller than 0.9%, indicating that the structure remains safe and stable under earthquake impact. There is a notable decrease of 1.14% in the first-order natural frequency in the Y-direction under the influence of the earthquake of E3, which may be because of the large amplitude of E3 with an intensity class of 7.2, resulting in a greater fluctuation in natural frequency.

3.4. Damping Ratio Amplitude Dependency
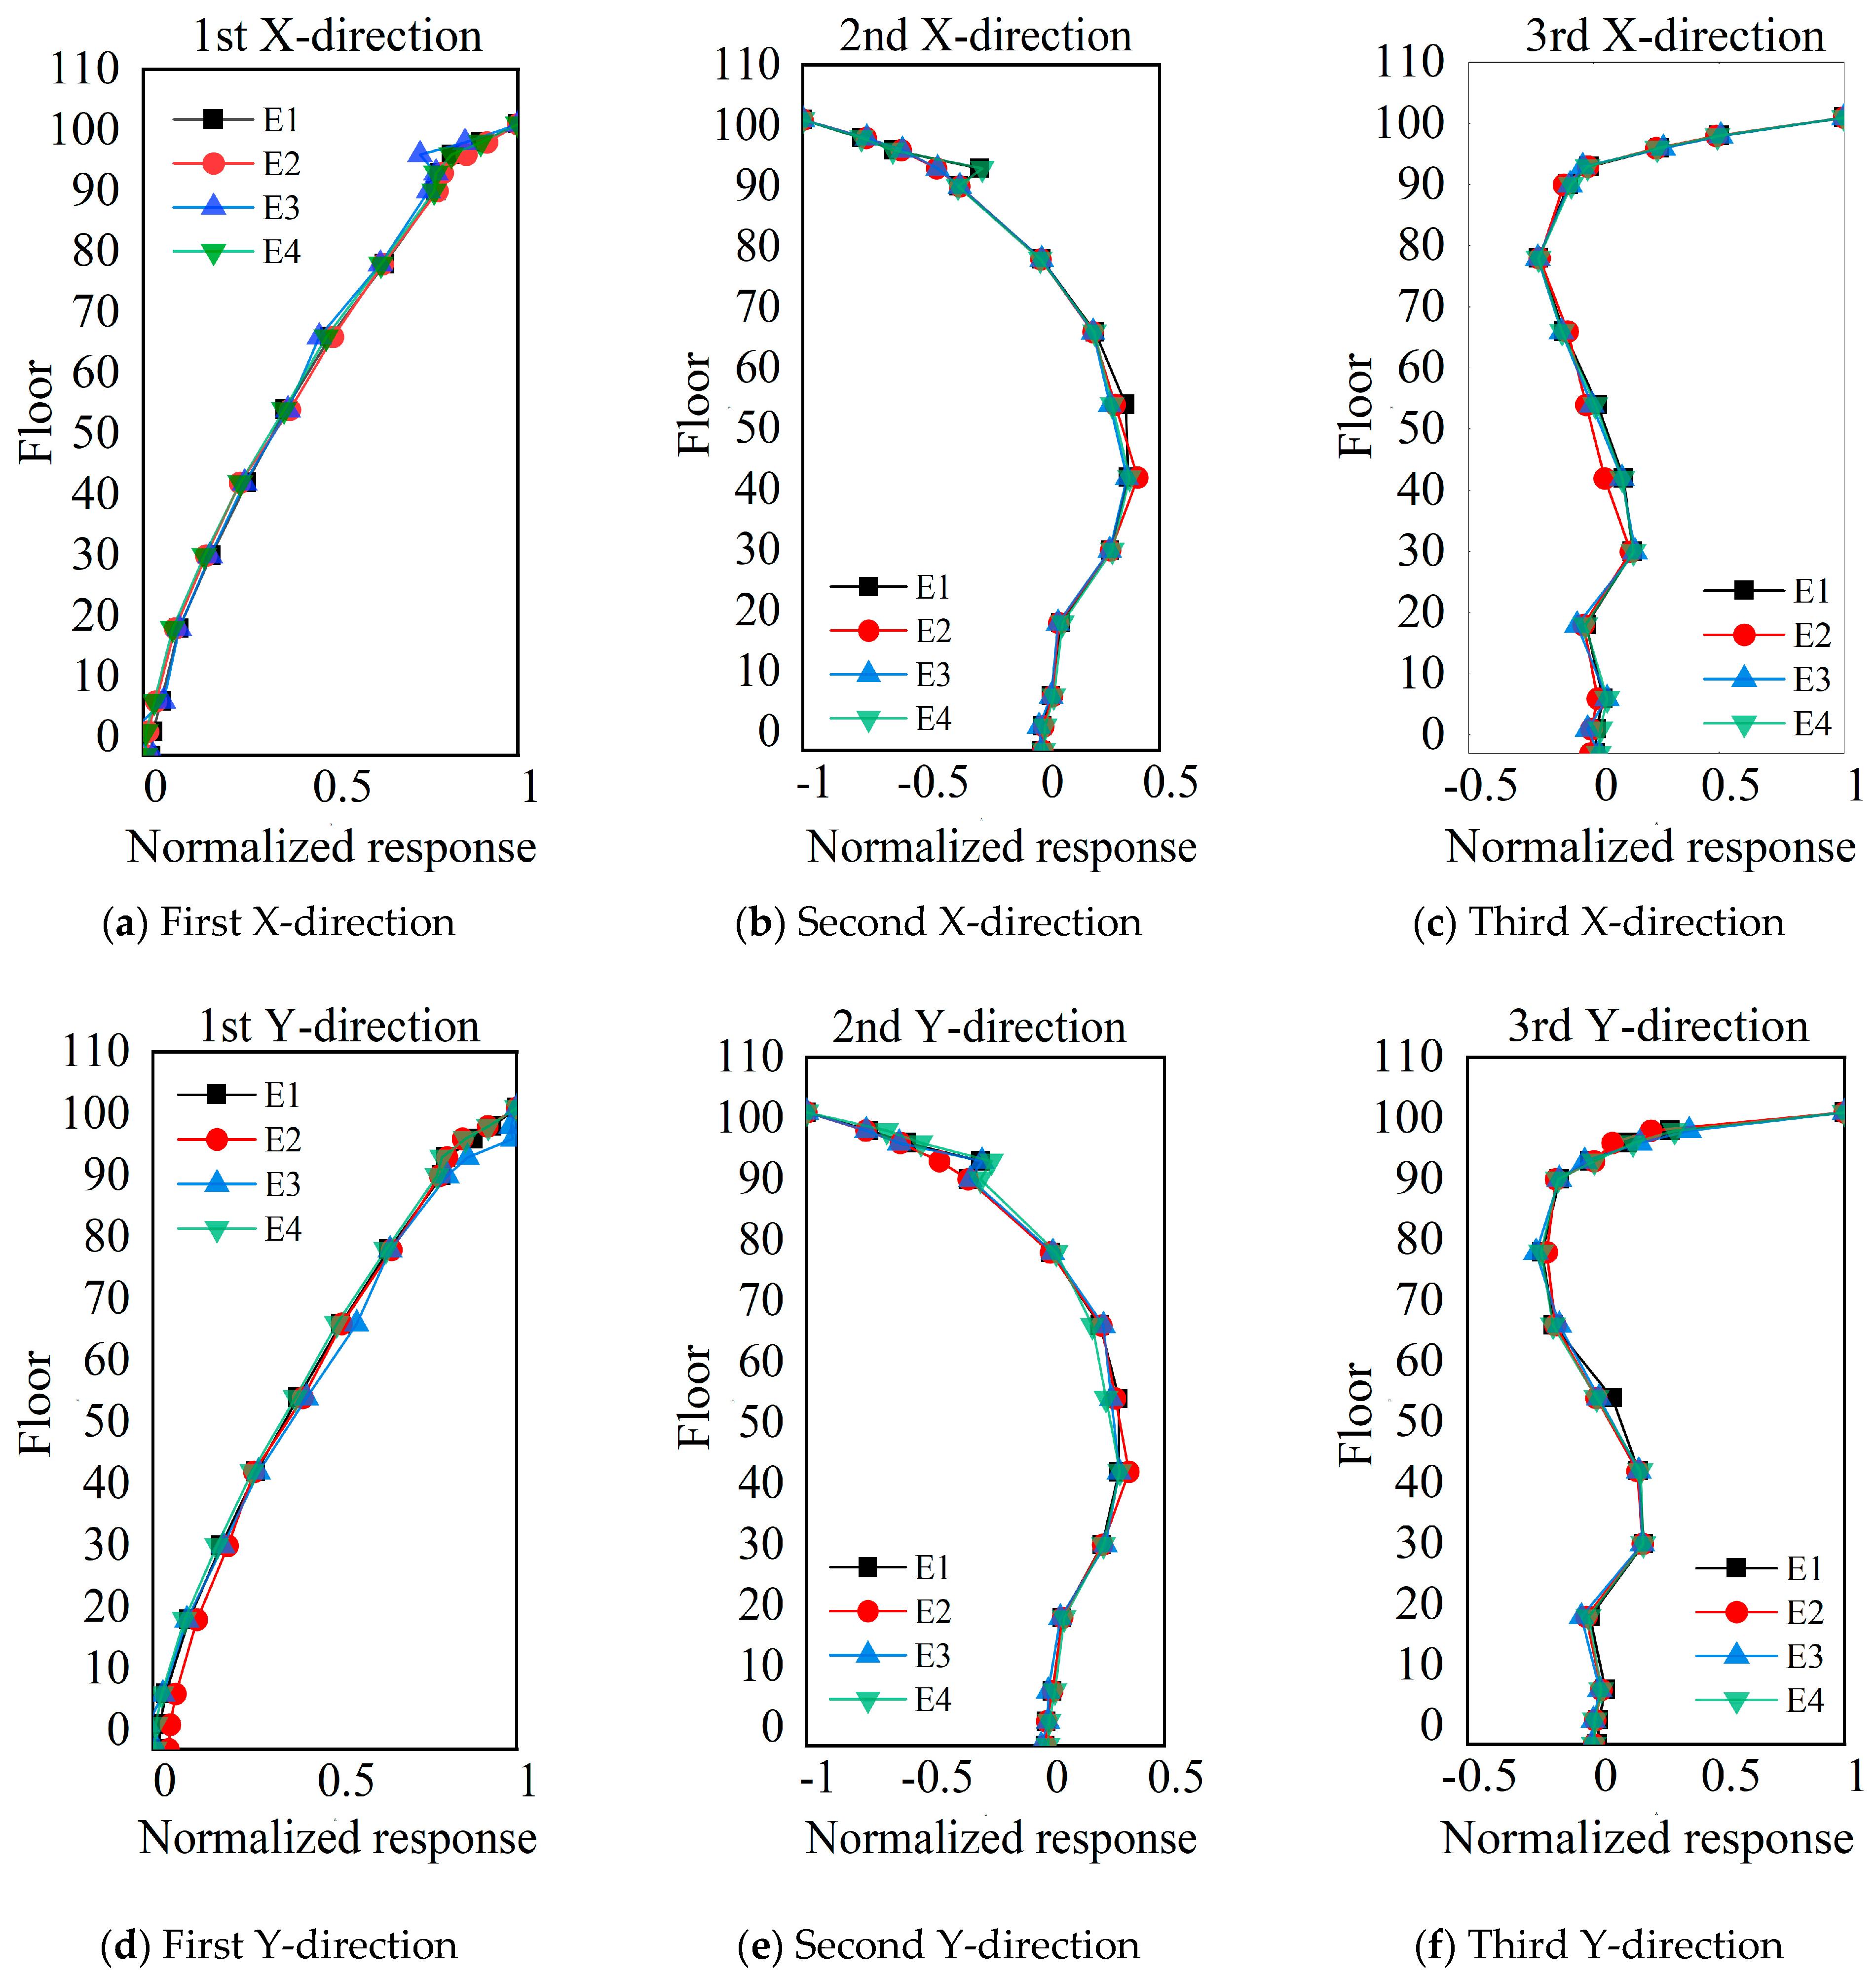
Estimation of the structural damping ratio is essential for the selection of dynamic parameters and the detection of structural damage in the design stage. Similar to identifying natural frequency, the same E-RDT method was employed to attain the correlation and normalization curves of the first two orders of damping ratio with amplitude variation of the top structure of the SWFC under four earthquakes (Figure 10 and Figure 11, respectively). It can be seen that the damping ratios of the first two orders in the X and Y directions of the SWFC under the four earthquakes increase to varying degrees with the increase of the structural amplitude. However, with a further increase of the amplitude, the increase rate of the damping ratio gradually slows down, and the damping ratio is discrete at low amplitudes. This stems from the increased amplitude of the structure, which causes more cracks in the structure, thereby increasing its energy dissipation due to a larger dampening ratio. When comparing the four earthquakes, it is worth mentioning that the damping ratio magnitudes in the X and Y directions are substantially different, and the normalized curves fluctuate considerably. In particular, the first-order damping ratio in the X-direction is 0.77% (E3) and the second-order damping ratio is 0.68% (E1). In the Y-direction, the first-order damping ratio is 0.86% (E1), and the second-order damping ratio is 0.65% (E2). This indicates a difference in the energy dissipation of super-tall buildings in response to earthquakes.
Table 4 shows the comparison between the HPBW method and E-RDT method to identify the damping ratio. As shown, the recognition results of the two methods are close, but there are some differences between the individual results, with X-1st (E4) having a maximum error value of 9.7% and Y-2nd (E2) having a minimum error value of only 0.9%. This discrepancy may be caused by noise, which causes the HPBW method to pick up the feature frequency, and thus, can blur the recognition of frequency differences, resulting in some recognition errors.

3.5. Mode Shape

The FFD method was utilized to identify the overall mode shape of the measured acceleration response signals under the four earthquakes, and the amplitude of the vibration modes on the 101st floor of the structure was normalized to obtain the first three sway mode shapes of the structure (Figure 12).
According to Figure 12, the SWFC exhibits the same shape under different earthquake effects. The first-order mode shape has one point with zero amplitude, the second-order mode shape has two points with zero amplitude, and the third-order mode shape has three points with zero amplitude; the first-order mode shape in X and Y directions shows an obvious non-linear increasing trend with the increase of floor height, and the non-linear changing trend of the second-and third-order mode shape is more significant, but it does not always increase; the sway mode shape in two orthogonal directions is the same, so it can be seen that the difference between the stiffness of SWFC in the X direction and Y direction is not large, which is consistent with the results of natural frequency analysis.

4. Conclusions

The dynamic characteristic parameters of the SWFC and their amplitude correlation variation laws were investigated based on the measured data of the vibration response of the SWFC under four earthquakes in Yilan, Taiwan (E1); Kyushu Island, Japan (E2); East China Sea (E3); and Sheyang, Jiangsu (E4). The main conclusions were as follows:
(1)
During the four earthquakes, there was a high level of consistency in the vibration responses of the SWFC in the X and Y directions, and the maximum acceleration response amplitudes all occurred in the X direction, which were 1.984, 0.656, 6.573, and 1.027 cm/s2, respectively.
(2)
In super tall buildings, the superstructure is highly sensitive to vibration excitation, and the dispersion of vibration response amplitudes and acceleration signals increases with the increase in floor height.
(3)
The improved E-RDT method was verified and used to identify the dynamic characteristics of the SWFC. The natural frequencies identified in the X-direction of the SWFC were the same as those in the Y-direction, and the first-order natural frequencies were about 0.151 Hz in the X-direction and 0.153 Hz in the Y-direction under four earthquakes; the second-order natural frequencies in the X and Y directions were about 0.46, except for the parts affected by the installation of sensor. Except for the influence of the dampers installed in the SWFC, the first- and second-order damping ratios in the X and Y directions of the SWFC were smaller than 1%, indicating that the stiffnesses of the two directions were similar.
(4)
As the amplitude increased, the first two natural frequencies of the SWFC decreased in the X and Y directions, and the damping ratios also increased to varying degrees. In contrast to damping ratios, natural frequencies were less sensitive to changes in amplitude.
(5)
The mode shape of the SWFC under different seismic excitations was essentially the same. The first-order mode shape in X and Y directions increased with the increase of floors and exhibited a non-linear trend, while the non-linear trend of the second-order and third-order modes was more significant but did not always increase.

Author Contributions

Methodology, H.K.; Validation, G.Z.; Formal analysis, H.K.; Investigation, P.Z.; Resources, P.Z.; Writing—original draft, H.K.; Writing—review & editing, X.W. and G.Z.; Supervision, X.W.; Project administration, P.Z. All authors have read and agreed to the published version of the manuscript.

Funding

This paper was partially supported by the Natural Science Foundation of Chongqing (Project number: CSTB2022NSCQ-MSX1655), the State Key Laboratory of Structural Dynamics of Bridge Engineering and Key Laboratory of Bridge Structure Seismic Technology for Transportation Industry Open Fund (Grant No. 202205) and the National Natural Science Foundation of China (Grant No. 12002069).

Institutional Review Board Statement

Not applicable.

Informed Consent Statement

Not applicable.

Data Availability Statement

All data generated or analyzed during this study are included in this article. All data included in this study are available upon request by contact with the corresponding author.

Conflicts of Interest

On behalf of all authors, the corresponding author states that there is no conflict of interest.

References

  1. Al-Kodmany, K. Tall Building Construction Boom: A Global Snapshot. In Tall Buildings and the City; Springer: Singapore, 2020. [Google Scholar]
  2. Shi, W.; Shan, J.; Lu, X. Modal identification of Shanghai World Financial Center both from free and ambient vibration response. Eng. Struct. 2012, 36, 14–26. [Google Scholar] [CrossRef]
  3. Górski, P. Dynamic characteristic of tall industrial chimney estimated from GPS measurement and frequency domain decomposition. Eng. Struct. 2017, 148, 277–292. [Google Scholar] [CrossRef]
  4. Li, S.; Chen, S. Structural health monitoring of maglev guideway PC girders with distributed long-gauge FBG sensors. Struct. Control Health Monit. 2018, 25, 20–46. [Google Scholar] [CrossRef]
  5. Chen, Z.; Zhou, X.; Wang, X.; Dong, L.; Qian, Y. Deployment of a smart structural health monitoring system for long-span arch bridges: A review and a case study. Sensors 2017, 17, 2151. [Google Scholar] [CrossRef] [Green Version]
  6. Jeary, A.P. Damping in tall buildings a mechanism and a predictor. Earthq. Eng. Struct. Dyn. 1986, 14, 733–750. [Google Scholar] [CrossRef]
  7. Li, Q.S.; Fang, J.Q.; Jeary, A.P.; Wong, C.K. Full scale measurements of wind effects on tall buildings. J. Wind Eng. Ind. Aerodyn. 1998, 74, 741–750. [Google Scholar] [CrossRef]
  8. Pan, T.C.; Brownjohn, J.M.W.; You, X.T. Correlating measured and simulated dynamic responses of a tall building to long-distance earthquakes. Earthq. Eng. Struct. Dyn. 2004, 33, 611–632. [Google Scholar] [CrossRef]
  9. Li, Q.S.; He, J.Y.; Zhou, K.; Li, X.; Chan, P.W.; Li, L. City-Scale Typhoon Hazard Analysis and Field Monitoring of Wind Effects on Skyscrapers during Super Typhoon Mangkhut. J. Struct. Eng. 2022, 148, 04022008. [Google Scholar] [CrossRef]
  10. Kijewski-Correa, T.; Kilpatrick, J.; Kareem, A.; Kwon, D.K.; Bashor, R.; Kochly, M.; Young, B.S.; Abdelrazaq, A.; Galsworthy, J.; Isyumov, N.; et al. Validating wind-induced response of tall buildings: Synopsis of the Chicago full-scale monitoring program. J. Struct. Eng. 2006, 132, 1509–1523. [Google Scholar] [CrossRef] [Green Version]
  11. Kijewski-Correa, T.; Kochly, M. Monitoring the wind-induced response of tall buildings: GPS performance and the issue of multipath effects. J. Wind Eng. Ind. Aerodyn. 2007, 95, 1176–1198. [Google Scholar] [CrossRef]
  12. Kijewski-Correa, T.; Kwon, D.K.; Kareem, A.; Bentz, A.; Guo, Y.; Bobby, S.; Abdelrazaq, A. SmartSync: An integrated real-time structural health monitoring and structural identification system for tall buildings. J. Struct. Eng. 2013, 139, 1675–1687. [Google Scholar] [CrossRef] [Green Version]
  13. Brownjohn JM, W.; Pan, T.C.; Deng, X.Y. Correlating dynamic characteristics from field measurements and numerical analysis of a high-rise building. Earthq. Eng. Struct. Dyn. 2000, 29, 523–543. [Google Scholar] [CrossRef]
  14. Jeary, A.P. The description and measurement of nonlinear damping in structures. J. Wind Eng. Ind. Aerodyn. 1996, 59, 103–114. [Google Scholar] [CrossRef]
  15. Li, Q.S.; Zhi, L.H.; Tuan, A.Y.; Kao, C.S.; Su, S.C.; Wu, C.F. Dynamic behavior of Taipei 101 Tower: Field measurement and numerical analysis. J. Struct. Eng. 2011, 137, 143–155. [Google Scholar] [CrossRef] [Green Version]
  16. Bendat, J.S.; Piersol, A.G. Engineering Applications of Correlation and Spectral Analysis; Wiley: New York, NY, USA, 1980. [Google Scholar]
  17. Andersen, P.; Brincker, R.; Peeters, B.; De Roeck, G.; Hermans, L.; Krämer, C. Comparison of system identification methods using ambient bridge test data. In Proceedings of the 17th International Modal Analysis Conference (IMAC), Kissimmee, FL, USA, 8–11 February 1999; Society for Experimental Mechanics: Fairfield County, CT, USA, 1999; pp. 1035–1041. [Google Scholar]
  18. Brincker, R.; Zhang, L.; Andersen, P. Modal identification of output-only systems using frequency domain decomposition. Smart Mater. Struct. 2001, 10, 441. [Google Scholar] [CrossRef] [Green Version]
  19. Jeary, A.P. Establishing non-linear damping characteristics of structures from non-stationary response time-histories. Struct. Eng. 1992, 70, 4–18. [Google Scholar]
  20. Beck, J.L. System identification methods applied to measured seismic response. In Proceedings of the 11th World Conference on Earthquake Engineering, Acapulco, Mexico, 23–28 June 1996. Elsevier Paper No. 2004. [Google Scholar]
  21. Yi, J.; Li, Q.S. Wind tunnel and full-scale study of wind effects on a super-tall building. J. Fluids Struct. 2015, 58, 236–253. [Google Scholar] [CrossRef]
  22. Chen, W.H.; Lu, Z.R.; Lin, W.; Chen, S.H.; Ni, Y.Q.; Xia, Y.; Liao, W.Y. Theoretical and experimental modal analysis of the Guangzhou New TV Tower. Eng. Struct. 2011, 33, 3628–3646. [Google Scholar] [CrossRef]
  23. Zhang, F.L.; Xiong, H.B.; Shi, W.X.; Ou, X. Structural health monitoring of Shanghai Tower during different stages using a Bayesian approach. Struct. Control Health Monit. 2016, 23, 1366–1384. [Google Scholar] [CrossRef]
  24. Zhou, W.; Bi, K.; Hao, H.; Pham, T.M.; Chen, W. Development of locally resonant meta-basement for seismic induced vibration control of high-rise buildings. Eng. Struct. 2023, 275, 115229. [Google Scholar] [CrossRef]
  25. Quan, Y.; Wang, S.; Gu, M.; Kuang, J. Field measurement of wind speeds and wind-induced responses atop the shanghai world financial center under normal climate conditions. Math. Probl. Eng. 2013, 2013, 902643. [Google Scholar] [CrossRef] [Green Version]
  26. Ivanovic, S.S.; Trifunac, M.D.; Todorovska, M.I. Ambient vibration tests of structures—A review. ISET J. Earthq. Technol. 2000, 37, 165–197. [Google Scholar]
  27. Brownjohn, J.M.W. Ambient vibration studies for system identification of tall buildings. Earthq. Eng. Struct. Dyn. 2003, 32, 71–95. [Google Scholar] [CrossRef] [Green Version]
  28. Kim, B.H.; Stubbs, N.; Park, T. A new method to extract modal parameters using output-only responses. J. Sound Vib. 2005, 282, 215–230. [Google Scholar] [CrossRef]
  29. Nasser, F.; Li, Z.; Martin, N.; Gueguen, P. An automatic approach towards modal parameter estimation for high-rise buildings of multicomponent signals under ambient excitations via filter-free Random Decrement Technique. Mech. Syst. Signal Process. 2016, 70, 821–831. [Google Scholar] [CrossRef] [Green Version]
  30. Wang, J.; Lü, D.; Jin, F.; Zhang, C. Accuracy of the half-power bandwidth method with a third-order correction for estimating damping in multi-DOF systems. Earthq. Eng. Eng. Vib. 2013, 12, 33–38. [Google Scholar] [CrossRef]
  31. Huang, Z.; Gu, M. Envelope random decrement technique for identification of nonlinear damping of tall buildings. J. Struct. Eng. 2016, 142, 40–61. [Google Scholar] [CrossRef]
  32. Bendat, J.S.; Piersol, A.G. Random Data: Analysis and Measurement Procedures; John Wiley & Son: Hoboken, NJ, USA, 2011. [Google Scholar]
  33. Waseem, M.; Khan, M.A.; Khan, S. Seismic sources for southern Pakistan and seismic hazard assessment of Karachi. Nat. Hazards 2019, 99, 511–536. [Google Scholar] [CrossRef]
  34. Pu, X.; Wang, L.; Wang, P.; Tian, X.; Xu, S.; Chai, S.; Guo, H. The response law of far-field seismic ground motion of the Wenchuan earthquake and its damaging mechanism in the Loess Plateau. Earthq. Res. Adv. 2022, 2, 100–114. [Google Scholar] [CrossRef]
  35. Kanai, K. Semi-empirical formula for the seismic characteristics of the ground motion. Bull. Earthq. Res. Inst. 1957, 35, 309–325. [Google Scholar] [CrossRef]
  36. Hu, J.; Li, Z.; Zhao, Z. Full-Scale Measurements of Translational and Torsional Dynamics Characteristics of a High-Rise Building during Typhoon Sarika. Materials 2022, 15, 493. [Google Scholar] [CrossRef] [PubMed]
  37. Zhou, K.; Li, Q.S.; Li, X. Dynamic behavior of supertall building with active control system during Super Typhoon Mangkhut. J. Struct. Eng. 2020, 146, 42–77. [Google Scholar] [CrossRef]
  38. Davenport, A.G.; Hill-Carroll, P. Damping in tall buildings: Its variability and treatment in design. In Building Motion in Wind; ASCE: Reston, VA, USA, 1986; pp. 42–57. [Google Scholar]
Figure 1. Elevation view of the SWFC (Map Data © 2022 Google; image by Xu Wang).
Applsci 13 07973 g001
Figure 2. Floor plan of the SWFC: (a) upper floor plan (b) lower floor plan.
Applsci 13 07973 g002
Figure 3. Accelerometer layout on the SWFC.
Applsci 13 07973 g003
Figure 4. Time−history response on F101 of the SWFC.
Applsci 13 07973 g004
Figure 5. Acceleration trajectory on F101 of the SWFC.
Applsci 13 07973 g005aApplsci 13 07973 g005b
Figure 6. The peak value of the SWFC acceleration response varies with the floor.
Applsci 13 07973 g006
Figure 7. Power spectra of the time−history responses of the SWFC.
Applsci 13 07973 g007aApplsci 13 07973 g007b
Figure 8. SWFC natural frequency under earthquake.
Applsci 13 07973 g008aApplsci 13 07973 g008b
Figure 9. Normalized natural frequency.
Applsci 13 07973 g009aApplsci 13 07973 g009b
Figure 10. SWFC damping ratio under earthquake.
Applsci 13 07973 g010aApplsci 13 07973 g010b
Figure 11. Normalized damping ratio.
Applsci 13 07973 g011
Figure 12. SWFC mode shapes under four earthquakes.
Applsci 13 07973 g012
Table 1. Data acquisition instrument and sensor parameters.
Device NameProduct IDDynamic RangeNoise LevelSensitivityWorking Temperature
Seismic data acquisition and transmissionTDE-324QI≥139 dB@50 sps/chn,
≥135 dB@100 sps/chn,
≥131 dB@200 sps/chn
<1 LSB-−40 °C~+65 °C
Short-period seismographTDV-33S>130 dB<1%2000 V × s/m−20 °C~+65 °C
Acceleration transducerSLJ100>135 dB<10–6.75 g±1.25 V/g−25 °C~+65 °C
Acceleration transducerTDA-33M>145 dB<1%Double ended 2.5 V/g, single ended 1.25 V/g−40 °C~+65 °C
Table 2. Specific seismic parameters.
EarthquakeDistance (km)SiteMangnitude (M)Measuring TimeDuration (s)ax-max (cm/s2)ay-max (cm/s2)
E1 (Yilan, Taiwan)738.96121.96° E, 24.52° N6.48 August 2019 05:286601.7841.984
E2 (Kyushu, Japan)909130.84° E, 32.07° N6.014 April 2016 23:036600.6560.474
E3 (East China Sea)704.9128.7° E, 31° N7.214 November 2015 04:514206.5735.149
E4 (Sheyang, Jiangsu)299.76120.3° E, 33.7° N4.420 October 2016 04:513001.0270.626
Table 3. Natural frequency of sway modes.
EarthquakeDirectionModeFrequency (Hz)
PPE-RDTDifference (%)
E1X−directionMode 10.14940.15403.0
Mode 20.54970.487911.2
Y−directionMode 10.15310.15320.07
Mode 20.51860.48835.88
E2X−directionMode 10.15170.15300.85
Mode 20.55080.455917.20
Y−directionMode 10.15330.15350.13
Mode 20.52170.460411.75
E3X−directionMode 10.15240.15140.66
Mode 20.55000.451317.90
Y−directionMode 10.15240.15260.13
Mode 20.51900.464610.48
E4X−directionMode 10.15000.15040.27
Mode 20.55000.455617.16
Y−directionMode 10.15190.15240.33
Mode 20.52220.464411.07
Table 4. Damping ratio of sway modes.
EarthquakeDirectionModeRatio (%)
HPBWE-RDTDifference (%)
E1X-directionMode 10.65140.60417.30
Mode 20.60910.63664.51
Y-directionMode 10.69420.70411.42
Mode 20.56790.55122.94
E2X-directionMode 10.69950.70751.14
Mode 20.61030.56307.75
Y-directionMode 10.71650.65228.97
Mode 20.63840.64420.90
E3X-directionMode 10.62930.67626.93
Mode 20.57750.54735.23
Y-directionMode 10.68670.66742.81
Mode 20.54740.56843.84
E4X-directionMode 10.63390.60294.89
Mode 20. 52170.57789.70
Y-directionMode 10.65650.62005.56
Mode 20.53700.50186.55
Disclaimer/Publisher’s Note: The statements, opinions and data contained in all publications are solely those of the individual author(s) and contributor(s) and not of MDPI and/or the editor(s). MDPI and/or the editor(s) disclaim responsibility for any injury to people or property resulting from any ideas, methods, instructions or products referred to in the content.

