
A Lifetime Prediction Method of Pressured Gas Polyethylene Pipes by Strain-Hardening Modulus and Tensile Test

1
Pressure Pipe Department, China Special Equipment Inspection and Research Institute, Beijing 100029, China
2
School of Mechanical Engineering, Xinjiang University, Urumqi 830046, China
3
Laboratory of Vehicle Advanced Manufacturing, Measuring and Control Technology (Ministry of Education), Beijing 100044, China
*
Authors to whom correspondence should be addressed.
Appl. Sci. 2023, 13(13), 7965; https://doi.org/10.3390/app13137965
Submission received: 4 June 2023
/
Revised: 4 July 2023
/
Accepted: 5 July 2023
/
Published: 7 July 2023
Abstract
:In recent years, polyethylene (PE) pipes have been widely utilized for urban natural gas transmission. However, as the use of high-density polyethylene (HDPE) pipes increases, their service life and long-term performance assessment have become one of the most significant issues to be addressed. There has been a ton of studies on PE pipe life prediction techniques both domestically and internationally, but very little has been carried out on PE pipe life prediction in actual gas working environments with varying acid and alkaline levels. This experiment accelerates the aging of PE pipes using acid and alkaline corrosion immersion experiments to determine the lifespan of PE pipes. This study aims to investigate the performance changes of HDPE under strong, weak, and neutral corrosion conditions using corrosion solutions with PH values of 1, 5, and 8, to propose the impact of corrosion caused by various acids and alkalies on the HDPE aging life for natural gas, and to develop a mathematical model between the aging life of polyethylene and the PH values of acid and alkali corrosion solutions. The studies involved soaking and corroding HDPE pipes with various acidity and alkalinity chemicals to speed up the aging process, and then the tensile test was used to determine the mechanical characteristics of the aged PE pipes. Based on our findings, the empirical equation between acidity and service life of PE pipes is obtained by the mathematical fitting method, and a life prediction model of buried city gas HDPE pipes is proposed. The actual life of the aged pipes is determined by the relationship between strain-hardening (SH) modulus and aging time. The findings demonstrate that the service life of PE pipes changes with different levels of acidity and alkalinity: 1.872 days, 1060.507 days, and 1128.58 days following corrosive solution-accelerated aging with solution acidities of PH1, PH5, and PH8, respectively. The life prediction method applies to various plastic pipes in comparable environments as well as HDPE city gas pipes that are subject to acid and alkali corrosion forces.
1. Introduction
HDPE pipes are widely used in numerous national projects, including the transmission of natural gas, due to their constructability, maintainability, impact resistance, chemical resistance, flexibility, lightweight, and long service life [1,2,3]. Polyethylene gas pipes must also have a service life of at least 50 years, according to standard 4437. Given the diversity of the local natural surroundings, different factors can affect corrosion to which HDPE gas pipes are susceptible [4]. For instance, different acidic and alkaline corrosive elements in the soil, such as NaOH, H2SO4, HCl, HClO, CH3COOH, H2O, etc., would have varied degrees of corrosive effects on underground gas pipes, so the pipes cannot avoid deformation, or even failure and damage [5]. During transportation, natural gas also comes into contact with polyethylene piping materials. Natural gas may contain acidic components like hydrogen sulfide (H2S), carbon dioxide (CO2), and some organic acids (such as acetic and propionic acid), which may lead to the corrosion of polyethylene piping materials. Gas leaks, flames, and explosions will result from the corroded underground gas pipeline, which will also disrupt the regular, uninterrupted flow of gas into the city, affecting output and user safety. This not only causes the country to suffer enormous financial losses, but it also seriously jeopardizes public safety. Therefore, it is essential to conduct research on the lifespan of buried natural gas polyethylene pipes for both academic and pipeline construction objectives, as well as for technical assistance in the study of HDPE pipeline life prediction methodologies under alkaline and acidic conditions.
In the investigation of PE pipe failure, one of the research issues of considerable interest has been the aging life prediction of PE materials. First, the aging of PE pipes must be sped up using the proper techniques. Presently, corrosion immersion experiments and saline spray testers are frequently used in corrosion-accelerated pipe aging experiments. This experiment accelerates the aging of polyethylene pipe by applying an acid and alkali corrosion immersion experiment because the saline spray tester cannot replicate the intense acid corrosion in a real working environment. It is also necessary to measure several physical characteristics of old polyethylene pipes. Using differential scanning calorimetry, Anna [6] investigated the aging of HDPE caused by several variables under accelerated aging circumstances. Adams and Lan used tensile and fatigue studies to study the fluctuation of HDPE characteristics in the circumferential and axial orientations [7,8]. The tensile test was utilized to evaluate the mechanical characteristics of the aged polyethylene pipe because the strain-hardening modulus algorithm used in this experiment is dependent on its outcomes. Third, suitable algorithms are also required to forecast the lifespan of PE pipes. A strain-hardening method is employed in this experiment to forecast the lifespan of aging PE pipes. Under the effect of complex environmental and external factors, HDPE pipes are prone to failure modes such as quick crack development, delayed crack expansion, and material aging [9,10]. The strain-hardening test (SH) can more accurately describe the slow crack extension resistance of polyethylene, although slow crack extension (SCG) has been employed as one of the crucial technical indicators to assess the failure resistance of PE materials [1,2,3,4]. By using the correlation between the strain-hardening modulus and failure time, Nezbedova et al. determined the failure time of natural gas PE pipes [11,12]. In this study, the service life of municipal gas polyethylene pipes was predicted using immersion corrosion accelerated aging tests and tensile testing.
2. Materials and Methods
2.1. Polyethylene Material
A high-density PE80 pipe for natural gas transmission was tested. The density of the polyethylene material (pellets) was 0.95 g/cm3, the melt volume flow rate (190 °C/5 kg) was 0.090 g/10 min, and the PE pipes had an exterior diameter of 40 mm and a wall thickness of 4 mm (Figure 1). The minimum value of circumferential tensile strength (TS) was 8 MPa (MRS) at 20 °C and 50 years of long-term pressure.
2.2. Experimental Principle
The acid and alkali corrosion immersion test consists of the following: a material is made into a certain shape, the specimen is immersed in a corrosive medium analogous to the natural conditions, removed after a certain period, and dried by cold air [13]. The acid and alkali immersion test is the most relevant to the actual conditions required for this experiment, and the results are real and reliable. There are numerous methods to investigate the mechanical properties of materials, the tensile test is one of them; the tensile test is one of the most common and important test methods to measure mechanical properties. The mechanics of materials will change throughout the corrosion process, particularly polymeric materials whose mechanical properties will decrease after corrosion. The tensile test can be used to more accurately examine the degree of corrosion of materials and to obtain many tensile parameters of the specimens after corrosion, such as elastic limit, yield strength, and elongation at fracture, among others [14,15,16]. The specimen of polymer material soaked by corrosive media is placed on the tensile machine and stretched along the longitudinal spindle of the specimen until the specimen breaks or the stress and strain reach a predetermined value, and the stress and strain sustained by the specimen during the tensile process are measured.
2.3. The Research Methodology
In this experiment, the experimental data of aged PE were obtained by acid and alkali corrosion impedance spectroscopy. As science and technology advance in society, polyethylene materials with better SCG resistance are widely used in gas pipelines. Domestic and international experts and other related experts demonstrated this by uniaxial tensile tests for commonly used PE pipes of various grades, finding that the strain-hardening modulus measured by the test correlates well with the SCG resistance characterized by other test methods. The strain–stress curve of polyethylene can be calculated and plotted using experimental data. The strain-hardening modulus of each polyethylene can then be calculated based on the slope of the curve, and finally, the failure time of polyethylene material can be determined by the relationship between the strain-hardening modulus of polyethylene and the failure time. Strain-hardening modulus describes the material’s hardening behavior when strain increases. The formula for determining the failure time by strain-hardening modulus is based on the relationship between the failure time (tf) and strain-hardening modulus (Gp). It is used to determine the failure life of an aging polyethylene pipe, similar to Equation (1).
2.4. Experimental Setup
It should be noted that in acid and alkali corrosion immersion experiments to accelerate the aging of polyethylene pipes, the immersion specimen cannot be exposed to the surface of the corrosion solution, and in the process of immersion it is necessary to detect whether bubbles appear on the surface of the specimen; it should also be noted that the specimen is not permitted to touch the wall of the container [17]. After seven days of immersion in the corrosion solution, the specimen is rinsed with water, then filter paper is used to absorb the corrosion solution on the specimen’s surface. Then, there is a check to see if the specimen’s appearance has changed. During the process of soaking the specimen, the container needs to be shaken once a day. In the tensile test, the specimens are made to satisfy the size and geometry requirements specified by ISO 1872 [18], and they are fastened using fixed fixtures and moving fixtures to prevent them from releasing during the tensile process.
2.5. Specimen Preparation
(1) Before experimenting, the PE80 PE pipes are required to be cut into rectangular samples strips by a punching machine, with at least 3 specimens in each group, and at least 3 groups of specimens are prepared. The cut samples need to be carefully rinsed with water to ensure that the surface is free of any impurities and then blotted dry with filter paper with good absorbency. After the water is drained, the appearance of the sample strip needs to be carefully inspected to ensure that there is no damage or deformation. If any problems are found, the specimen needs to be replaced in time to ensure the accuracy of the experimental results. The treated PE80 rectangular samples were then submerged in corrosion solutions containing, respectively, PH1, PH5, and PH8. During the seven days of specimen immersion, the container needed to be shaken once a day to ensure that the specimen is fully exposed to the corrosion solution. After seven days of immersion, the specimen needed to be removed from the corrosion solution, its surface rinsed with water, followed by filter paper to absorb the corrosion solution on the surface of the specimen, and then checked to see whether there was any change in the appearance of the specimen.
(2) Using a Shimadzu AGS-X electronic universal testing equipment, a rectangular sample strip of sopped polyethylene material was cut into a dumbbell form following the ISO 1167-1:2006 [19] standard based on the thickness of the pipe and the standard of the specimen required for the experiment (Figure 2). The dumbbell-shaped specimen was completed by applying the cutter uniformly on the inner surface of the sample at room temperature [20]. During the punching process, the cutter needed to be kept perpendicular to the specimen to ensure that the size of the cutout specimen is accurate. The selection of the cutting tool is based on the thickness of the pipe to ensure the accuracy and reliability of the specimen. The shape and dimensions of the specimen are shown in Figure 3.
The standard specimen size of each part is employed in this experiment for tensile tests and immersion acid and alkali corrosion investigations, as stated in Table 1. One of the crucial aspects of the experimental design that directly influences the validity and precision of the results is the size of the experimental sample. To replicate the potentially corrosive environment seen in actual use, the sample must be fully immersed in acid and alkali solutions during the experimental process. To minimize the sample’s non-uniform deformation during stretching, uniform forces must be applied. We can guarantee the validity of the data collected under the experimental settings by precisely controlling the dimensions of the experimental samples. Understanding the mechanical characteristics of polyethylene materials after acid and alkaline corrosion and aging requires this.
2.6. Experimental Conditions
In this trial, the immersion reagent for polyethylene tubes was divided into three different PH values and the experiments were conducted at room temperature. To ensure the reliability and accuracy of the experiment, the three PH values need to be divided into three groups of three specimens each, for a total of nine aging samples. This enables a thorough evaluation and study of the corrosion of polyethylene pipes at various PH values, as well as an improvement in the actual dependability of the experimental data. During the experimental procedure, the experimental conditions need to be strictly controlled to ensure the reliability and accuracy of the experimental results.
2.7. Mechanical Performance Testing
According to the ISO/TR 2005 [21] standard for mechanical properties testing of aging PE pipes (tensile test), the dumbbell-shaped specimen required for the experiment is fastened on the tensile test machine (Figure 4) using a fixture by the standard, and the tensile test machine is used for tensile test, the width and thickness of the required specimen should be 6 mm and 4 mm, respectively, and the original standard distance should be 25 mm. When conducting the tensile test, the loading rate of the tensile machine should be kept constant at 100 mm/min. During the tensile test, the dumbbell-type standard specimen should be placed in the tensile test machine and stretched at a transverse rate using a constant driving fixture or pulley. Force and elongation readings are taken during uninterrupted stretching of the test piece and when it breaks, as required. The above is the test method for the mechanical properties of aged polyethylene pipes according to ISO/TR 2005. When conducting the test, it is necessary to follow the standard operating procedures to assure the accuracy and repeatability of the test results.
A schematic diagram (Figure 5) of the experimental procedure and setup includes the sample preparation process for corrosion immersion (1) (2), tensile strength and characterization, and the tensile testing process. Specifically, (3) (4) the prepared samples are standard test pieces (dumbbells) and are placed in a tensile test machine and stretched at a constant transverse rate driving a fixture or pulley. During the uninterrupted stretching of the test piece, its force and elongation readings need to be recorded, and the same recordings are made when the test piece breaks. These data can be used to evaluate the tensile strength and other relevant properties of the material.
3. Results and Discussion
3.1. Lifetime Prediction Methods
This experiment utilizes a strain-hardening algorithm to forecast the life of polyethylene aging pipes. The advantages of using this algorithm to predict pipe life are the small measurement variation (no specimen notch and surfactant required) and the short time-consuming test time. The principle of the strain-hardening test is that at room temperature, the polyethylene material is prone to intermolecular slippage and untangling during the stretching process, forming the so-called tethering phenomenon. Slow crack growth (SCG) is one of the most important failure mechanisms of polyethylene gas and water pipes. Slow crack expansion is the main determinant of the service life of polyethylene pipes, and to resist the tendency of crack expansion, strain-hardening effects are produced by the microfibers in the silver grain. There is a clear relationship between the resistance of PE materials to slow crack extension and the inherent characteristics of the material, and Kurelec et al. proposed that the SCG resistance of PE materials is mainly controlled by the inherent strain-hardening response of microfibers, verifying a positive correlation between the inherent characteristics of the material and its SCG resistance at the microscopic level [22]. The strain-hardening (SH) test developed by Kurelec et al. has been used for the performance evaluation of various PE and resin materials, and the test results have shown that the SH test is very promising for assessing the resistance to slow crack expansion of various PE pipes in short-term tests and reproducible experiments [23]. The inherent characteristics of PE materials can therefore be characterized by measuring the strain-hardening modulus of the PE material, which can be used to predict the time to failure of the pipes. The strain-hardening algorithm requires that the specimen be stretched above its natural tensile ratio, at which point strain-hardening will occur. The strain-hardening modulus Gp is based on the relationship between the number of measurement points N in the strain-hardening interval (usually stretching ratios 8 to 12) [24], the stretching ratio λ of the specimen (i.e., the ratio of the stretching length between specimen moments to the initial specimen distance recorded at a certain point in the test), and the true stress σ to which the specimen is subjected during the stretching process. Nezbedova et al. applied, the Pennsylvania Notch Test (PENT) [25], Cyclic load notched round bar (CRB) test, and SHT to one single-peaked polyethylene (PE80), four bimodal polyethylenes (three PE100 and one PE100-RC), and one PE-BF (for blow molding) to obtain a comparison of the strain-hardening modulus with the failure time results of the PENT test and the full notch creep (FNCT) [26] test, plotted failure time versus strain-hardening modulus with the data obtained, and then fitted the data to obtain the relationship between failure time and strain-hardening modulus [27]. Due to the relationship between failure time and strain-hardening modulus discovered by Kurelec, Nezbedova, and colleagues [23,24,25,26,27], the failure time of PE pipes can be determined. After fitting the data, a graph of failure time versus acidity of the corrosive solution was obtained. This enabled us to further propose a mathematical model for life prediction of buried natural gas PE pipes under acid and alkaline corrosion conditions, with the following prediction algorithm:
Strain-hardening modulus is the strain-hardening interval where the stress–strain curve will begin to show a sharp increase in stress when the specimen is stretched to its natural tensile ratio in a tensile test. The slope of this part of the curve is defined as the strain-hardening modulus. The strain-hardening modulus is a measure of a material’s ability to resist strain-hardening. The modulus can be used to assess the strain-hardening behavior of material after being subjected to deformation, as well as its ability to deform under complex loading. The strain-hardening modulus is expressed by the individual strain-hardening coefficient Gp [28], as shown in the Equation (2).
where N is the number of measurement points in the strain-hardening interval (usually stretching ratio 8 to 12); λ is the stretching ratio of the specimen, i.e., the ratio of the stretching length between the specimen’s standard moments recorded at a certain moment in the test to the specimen’s initial pitch; σ is the true stress that the specimen undergoes during the stretching process.
The tensile ratio λ is calculated from the specimen breaking length l (mm) and the specification length l0 (mm), as shown in Equation (3).
where Δl is the increase of the specimen length between the gauge marks (mm).
The true stress σtrue (MPa) is calculated according to Equation (4), assuming volume conservation between the gauge marks.
where F is the measured force (N) and A is the product of the initial width and thickness (mm2).
The relationship between failure time and strain-hardening modulus obtained by Nezbedova et al. is shown in Equation (5).
Before calculating the specimen stretching ratio, the length l of the specimen at break needs to be known. The elongation at break of the specimen is known during the tensile test, and then the length l of the specimen at break can be obtained according to the calculation of elongation at break, as in Equation (6).
where e is the elongation at break, l0 (mm) is the original length of the specimen, and l (mm) is the length of the specimen when it is pulled off.
3.2. Data Analysis
The data obtained during the tensile experiments are substituted into the above equations, and according to Equations (3)–(6) can be calculated for specimens immersed in corrosive solutions with the acidity of PH1, PH5, and PH8, respectively, and then by the length la, tensile ratio λ, true stress σture, strain-hardening modulus Gp, and failure time tf at fracture of the three groups of specimens after stretching. Each condition the results of the data obtained under each condition are shown in Table 2, Table 3 and Table 4:
It is known from the above tables that the strain-hardening modulus of PE pipes are −39.75, 9.905, and 5.6469 after immersion in corrosive solutions at PH1, PH5, and PH8, respectively.
The strain-hardening modulus, which depicts the pattern of change in the material’s hardness and strength as the strain grows, is the slope of the strain-hardening interval when a material is stretched and there is an abrupt increase in its stress [29]. Based on the calculations above, a curve was built between the tensile ratio and the real stress, the slope of which is the strain-hardening modulus. The graphs of the tensile ratio versus true stress for the three samples are shown in Figure 6 to illustrate how significant it is to measure the true stress–strain curve.
Figure 6 shows the trend of strain-hardening modulus of PE pipe when stretched at PH1, PH5, and PH8, respectively, from the figure it is obvious that the strain-hardening modulus of PE pipe is positive at PH1, PH5, and PH8, which means that the strength of PE pipe increases with the increase of strain-hardening modulus [30,31,32]. The strain-hardening curve of the tube at PH5 hardly changes when the tube is first stretched. In contrast, the strain-hardening curve of the tube at PH8 gradually becomes flat in the later stages of stretching [30,32]. This indicates that at PH8, PE pipe has high deformability in the initial phase, but its subsequent stress growth rate is slower. Thus, the stress performance may be relatively weak over a wide range of strains, while the opposite is true for materials with a higher slope of strain-hardening modulus. In summary, it is known that the specimens soaked in the PH8 corrosion soak solution possess the best SCG resistance and the specimens soaked in the PH1 solution have the worst SCG resistance.
The strain-hardening modulus of the three specimens is substituted into Equation (4) in accordance with the relationship between strain-hardening modulus and failure time, Table 5 shows the order in which the three specimens failed in PE-S-PH1, PE-S-PH5, and PE-S-PH8:
The service duration of PE pipes following immersion in PH1 corrosion solution is the shortest, and the service time of PE pipes following immersion in PH8 corrosion solution is the longest, as shown in Table 5. By using a data fitting approach, the failure time of the PE pipes was fitted to the PH of the corrosion solution. Figure 7 shows the fitted curves between PH and failure time for the three solutions.
3.3. Predicting Lifetime
Table 6 provides a mathematical model based on the graphs fitted in Figure 7. The PE pipes failure time was used as the dependent variable y and the solution PH as the independent variable x in the development of this model. In other words, for a specific pH value of the solution, we may use this mathematical model to forecast the value of the time till failure. It is crucial to remember that this mathematical model is based on a fit to the data presented in Figure 7; as a result, care must be taken to ensure that the data are accurate before using the model.
As seen in Table 6, the quadratic regression curve algorithm has an R-squared of 1, which indicates that the model fit by serial number 5’s quadratic regression curve Equation (7).
fits the data very well and the independent variable fully accounts for all variation in the dependent variable. This outcome is highly encouraging and demonstrates that the generated lifespan prediction equation’s quadratic regression curve may adequately reflect the relationship between the data.
4. Conclusions
In this experiment, the maximum tensile strain at fracture was determined for three specimens submerged in various corrosive solutions, the true stress in tension was calculated using the maximum tensile stress of the specimens, the ratio of the tensile length between the specimen moments recorded at one point in the test to the initial specimen distance, and the maximum tensile stress of the specimens was calculated. The failure periods of the three specimens at various PH values were then determined by the relationship between the failure time and the strain-hardening modulus. The strain-hardening modulus of the specimens was calculated following Equation (1).
The results reveal that: (1) Tensile fracture strain of the specimen after immersion in PH1 solution is smallest at a specific time (17.4268 N/mm2, 21.1221 N/mm2, 17.9097 N/mm2), and highest at PH8 solution immersion (21.2630 N/mm2, 21.3598 N/mm2, 20.7667 N/mm2). (2) The failure time for PE specimens after soaking in PH1 solution was 1.872 days, while the failure time for PE specimens after soaking in PH8 solution was 1128.58 days. (3) A relationship between corrosion solution PH value and three different types of specimen failure time was established. A life prediction curve for the specimen after immersion corrosion accelerated aging was proposed, and the best life prediction equation was obtained by mathematical curve fitting. This equation is y = −1.19352 + 1.29333 × x − 0.094 × x2. (4) Since the aging mechanism and physical properties of many thermoplastic materials are similar and this experiment is based on the aging mechanism and physical properties of polyethylene materials, the prediction method of this experiment is also applicable to other thermoplastic materials. However, it should be emphasized that the procedure might not be appropriate for pipelines running under other unique circumstances; thus, it must be carefully considered before usage. Even if the knowledge acquired from macroscopic tests is crucial for understanding the behavior and properties of materials, it is still restricted when it comes to microscopic description. Future research will therefore continue to use micro-level analyses to confirm the validity of macro-level investigations.
Author Contributions
Conceptualization, W.-S.R.; writing—original draft, L.N.; funding acquisition, Y.W.; investigation, G.-W.F.; writing—review and editing, L.N. and W.-S.R.; resources, Y.W. and N.L.; supervision, Y.W. and H.-Q.L.; validation, W.-S.R. All authors have read and agreed to the published version of the manuscript.
Funding
This work was supported by the Sponsored by Natural Science Foundation of Xinjiang Uygur Autonomous Region (no. 2022D01C389), the Xinjiang University Doctoral Start-up Foundation (no. 620321029), and the Science and technology planning project of State Administration for Market Regulation (no. 2022MK201).
Institutional Review Board Statement
Not applicable.
Informed Consent Statement
Not applicable.
Data Availability Statement
Not applicable.
Conflicts of Interest
The authors declare no conflict of interest.
References
- Wang, Y.; Lan, H.Q.; Meng, T.; Chen, S.; Zuo, J.D.; Lin, N. A Lifetime Prediction Method of Pressured Gas Polyethylene Pipes by Thermal-Oxidative Aging Test and Tensile Test. J. Press. Vessel. Technol. 2017, 140, 011404. [Google Scholar] [CrossRef]
- Robledo, N.; Domínguez, C.; García-Muñoz, R.A. Alternative accelerated and short-term methods for evaluating slow crack growth in polyethylene resins with high crack resistance. Polym. Test. 2017, 62, 366–372. [Google Scholar] [CrossRef]
- Zha, S.; Lan, H.Q.; Lin, N.; Meng, T. Degradation and characterization methods for polyethylene gas pipes after natural and accelerated aging. Polym. Degrad. Stab. 2023, 208, 110247. [Google Scholar] [CrossRef]
- Wang, Y.; Lan, H.Q.; Meng, T.; Wang, B.; Guo, D.D.; Zhuang, L.J. Pressure Effects on the Lifetime of Gas High Density Polyethylene Pipes. J. Press. Vessel. Technol. 2022, 144, 154–163. [Google Scholar] [CrossRef]
- Zhang, Y.; Weng, W.G. Bayesian network model for buried gas pipeline failure analysis caused by corrosion and external interference. Reliab. Eng. Syst. Saf. 2020, 203, 107089. [Google Scholar] [CrossRef]
- Anna, P.; Bertalan, G.; Marosi, G.; Ravadits, I.; Maatoug, M.A. Effect of interface modification on the photo-stability of pigmented polyethylene films. Polym. Degrad. Stab. 2001, 73, 463–466. [Google Scholar] [CrossRef]
- Adams, T.M.; Hall, S.; Scavuzzo, R.J.; Munson, D.; Andrasik, J.W.; Findlan, S. Tensile testing and material property development of high density polyethylene pipe materials. In Proceedings of the ASME Pressure Vessels and Piping Conference, Chicago, IL, USA, 27–31 July 2008; Volume 48241, pp. 267–274. [Google Scholar]
- Lan, H.; Sha, D.; Meng, T.; Fang, X.; Zuo, J.; Li, X. Thermal Oxidative Aging Laws of PE Gas Pressure Pipes. Nat. Gas Ind. 2016, 36, 78–83. [Google Scholar] [CrossRef]
- Li, P.; Wang, F.; Gao, J.; Lin, D.; Gao, J.; Lu, J.; Qiu, E.; Liu, C. Failure Mode and the Prevention and Control Technology of Buried PE Pipeline in Service: State of the Art and Perspectives. Adv. Civ. Eng. 2022, 2022, 2228690. [Google Scholar] [CrossRef]
- Zha, S.; Lan, H.-Q.; Huang, H. Review on lifetime predictions of polyethylene pipes: Limitations and trends. Int. J. Press. Vessel. Pip. 2022, 198, 104663. [Google Scholar] [CrossRef]
- Haward, R. The derivation of a strain hardening modulus from true stress-strain curves for thermoplastics. Polymer 1994, 35, 3858–3862. [Google Scholar] [CrossRef]
- Nezbedová, E.; Pinter, G.; Frank, A.; Hutař, P.; Poduška, J.; Hodan, J. Accelerated Tests for Lifetime Prediction of PE-HD Pipe Grades. Macromol. Symp. 2017, 373, 1600096. [Google Scholar] [CrossRef]
- Gerets, B.; Wenzel, M.; Engelsing, K.; Bastian, M. Slow crack growth of polyethylene—Accelerated and alternative test methods. In Deformation and Fracture Behaviour of Polymer Materials; Grellmann, W., Langer, B., Eds.; Springer Series in Materials Science; Springer: Berlin/Heidelberg, Germany, 2017; Volume 247, pp. 177–187. [Google Scholar] [CrossRef]
- Huang, Y.-Q.; Zhang, Q.-L.; Lu, X.-Y.; Gong, Y.-B.; Zhou, H.; Feng, J.-C. Comparative Investigation on Step-cycle Tensile Behaviors of Two Bimodal Pipe-grade Polyethylene with Different Slow Crack Growth Resistance. Chin. J. Polym. Sci. 2019, 38, 611–619. [Google Scholar] [CrossRef]
- Amjadi, M.; Fatemi, A. Creep and fatigue behaviors of High-Density Polyethylene (HDPE): Effects of temperature, mean stress, frequency, and processing technique. Int. J. Fatigue 2020, 141, 105871. [Google Scholar] [CrossRef]
- Mao, Q.; Su, B.; Ma, R.; Li, Z. Investigation of Tensile Creep Behavior for High-Density Polyethylene (HDPE) via Experiments and Mathematical Model. Materials 2021, 14, 6188. [Google Scholar] [CrossRef]
- Van Dinh, C.; Kubouchi, M.; Sakai, T.; Tsuda, K.; Kobayashi, R. Degradation of Different Types of Polyethylene Using for Lining System Exposed to Hydrochloric Acid Solution. J. Jpn. Soc. Colour Mater. 2009, 82, 105–111. [Google Scholar] [CrossRef] [Green Version]
- ISO 1872-2:2007; Plastics—Polyethylene (PE) Moulding and Extrusion Materials—Part 2: Preparation of Test Specimens and Determination of Properties. ISO: Geneva, Switzerland, 2007.
- ISO 1167-1:2006; Thermoplastics Pipes, Fittings and Assemblies for the Conveyance of Fluids—Determination of the Resistance to Internal Pressure—Part 1: General Method. ISO: Geneva, Switzerland, 2006.
- Choi, B.H.; Chudnovsky, A.; Paradkar, R.; Michie, W.; Zhou, Z.; Cham, P.M. Experimental and theoretical investigation of stress corrosion crack (SCC) growth of polyethylene pipes. Polym. Degrad. Stab. 2009, 94, 859–867. [Google Scholar] [CrossRef]
- ISO/TR 9272:2005; Rubber and Rubber Products—Determination of Precision for Test Method Standards. ISO: Geneva, Switzerland, 2005.
- Kurelec, L.; Teeuwen, M.; Schoffeleers, H.; Deblieck, R. Strain hardening modulus as a measure of environmental stress crack resistance of high density polyethylene. Polymer 2005, 46, 6369–6379. [Google Scholar] [CrossRef]
- Deblieck, R.; Gerets, B.; Boerakker, M.; Caelers, H.; Wilbers, A.; Boonen, T. Relation between life time, failure stress and craze microstructure in polyethylene as evidenced by fracture surface texture analysis after an accelerated Full-Notch Creep Test. Polymer 2019, 176, 264–273. [Google Scholar] [CrossRef]
- Pinter, G.; Haager, M.; Lang, R.W. Influence of nonylphenol–polyglycol–ether environments on the results of the full notch creep test. Polym. Test. 2007, 26, 700–710. [Google Scholar] [CrossRef]
- ISO 16241:2005; Notch Tensile Test to Measure the Resistance to Slow Crack Growth of Polyethylene Materials for Pipe and Fitting Products (PENT). ISO: Geneva, Switzerland, 2005.
- ISO 16770:2004; Plastics—Determination of Environmental Stress Cracking (ESC) of Polyethylene—Full-Notch Creep Test (FNCT). ISO: Geneva, Switzerland, 2004.
- Nezbedová, E.; Hodan, J.; Kotek, J.; Krulis, Z.; Hutař, P.; Lach, R. Lifetime of Polyethylene (PE) Pipe Material—Prediction Using Strain Hardening Test. Deform. Fract. Behav. Polym. Mater. 2017, 247, 203–210. [Google Scholar] [CrossRef]
- Zhang, Y.; Xiang, A.; Lu, X.; Zhou, H.; Yin, D.; Tian, H. Research on slow crack growth resistance of polyethylene pipe based on strain hardening modulus. J. Vinyl Addit. Technol. 2022, 28, 226–234. [Google Scholar] [CrossRef]
- Fawaz, J.; Deveci, S.; Mittal, V. Molecular and morphological studies to understand slow crack growth (SCG) of polyethylene. Colloid Polym. Sci. 2016, 294, 1269–1280. [Google Scholar] [CrossRef]
- Kovar, M.; Nezbedova, E.; Hodan, J.; Stary, Z. Strain Hardening Test: Short Term Test for Estimating Service Life of High-Density Polyethylene. Macromol. Symp. 2022, 403, 2200056. [Google Scholar] [CrossRef]
- Gorghiu, L.M.; Jipa, S.; Zaharescu, T.; Setnescu, R.; Mihalcea, I. The effect of metals on thermal degradation of polyethylenes. Polym. Degrad. Stab. 2004, 84, 7–11. [Google Scholar] [CrossRef]
- Haward, R.N. Strain hardening of high density polyethylene. J. Polym. Sci. Part B Polym. Phys. 2010, 45, 1090–1099. [Google Scholar] [CrossRef]
Figure 1.
Long strip specimens.
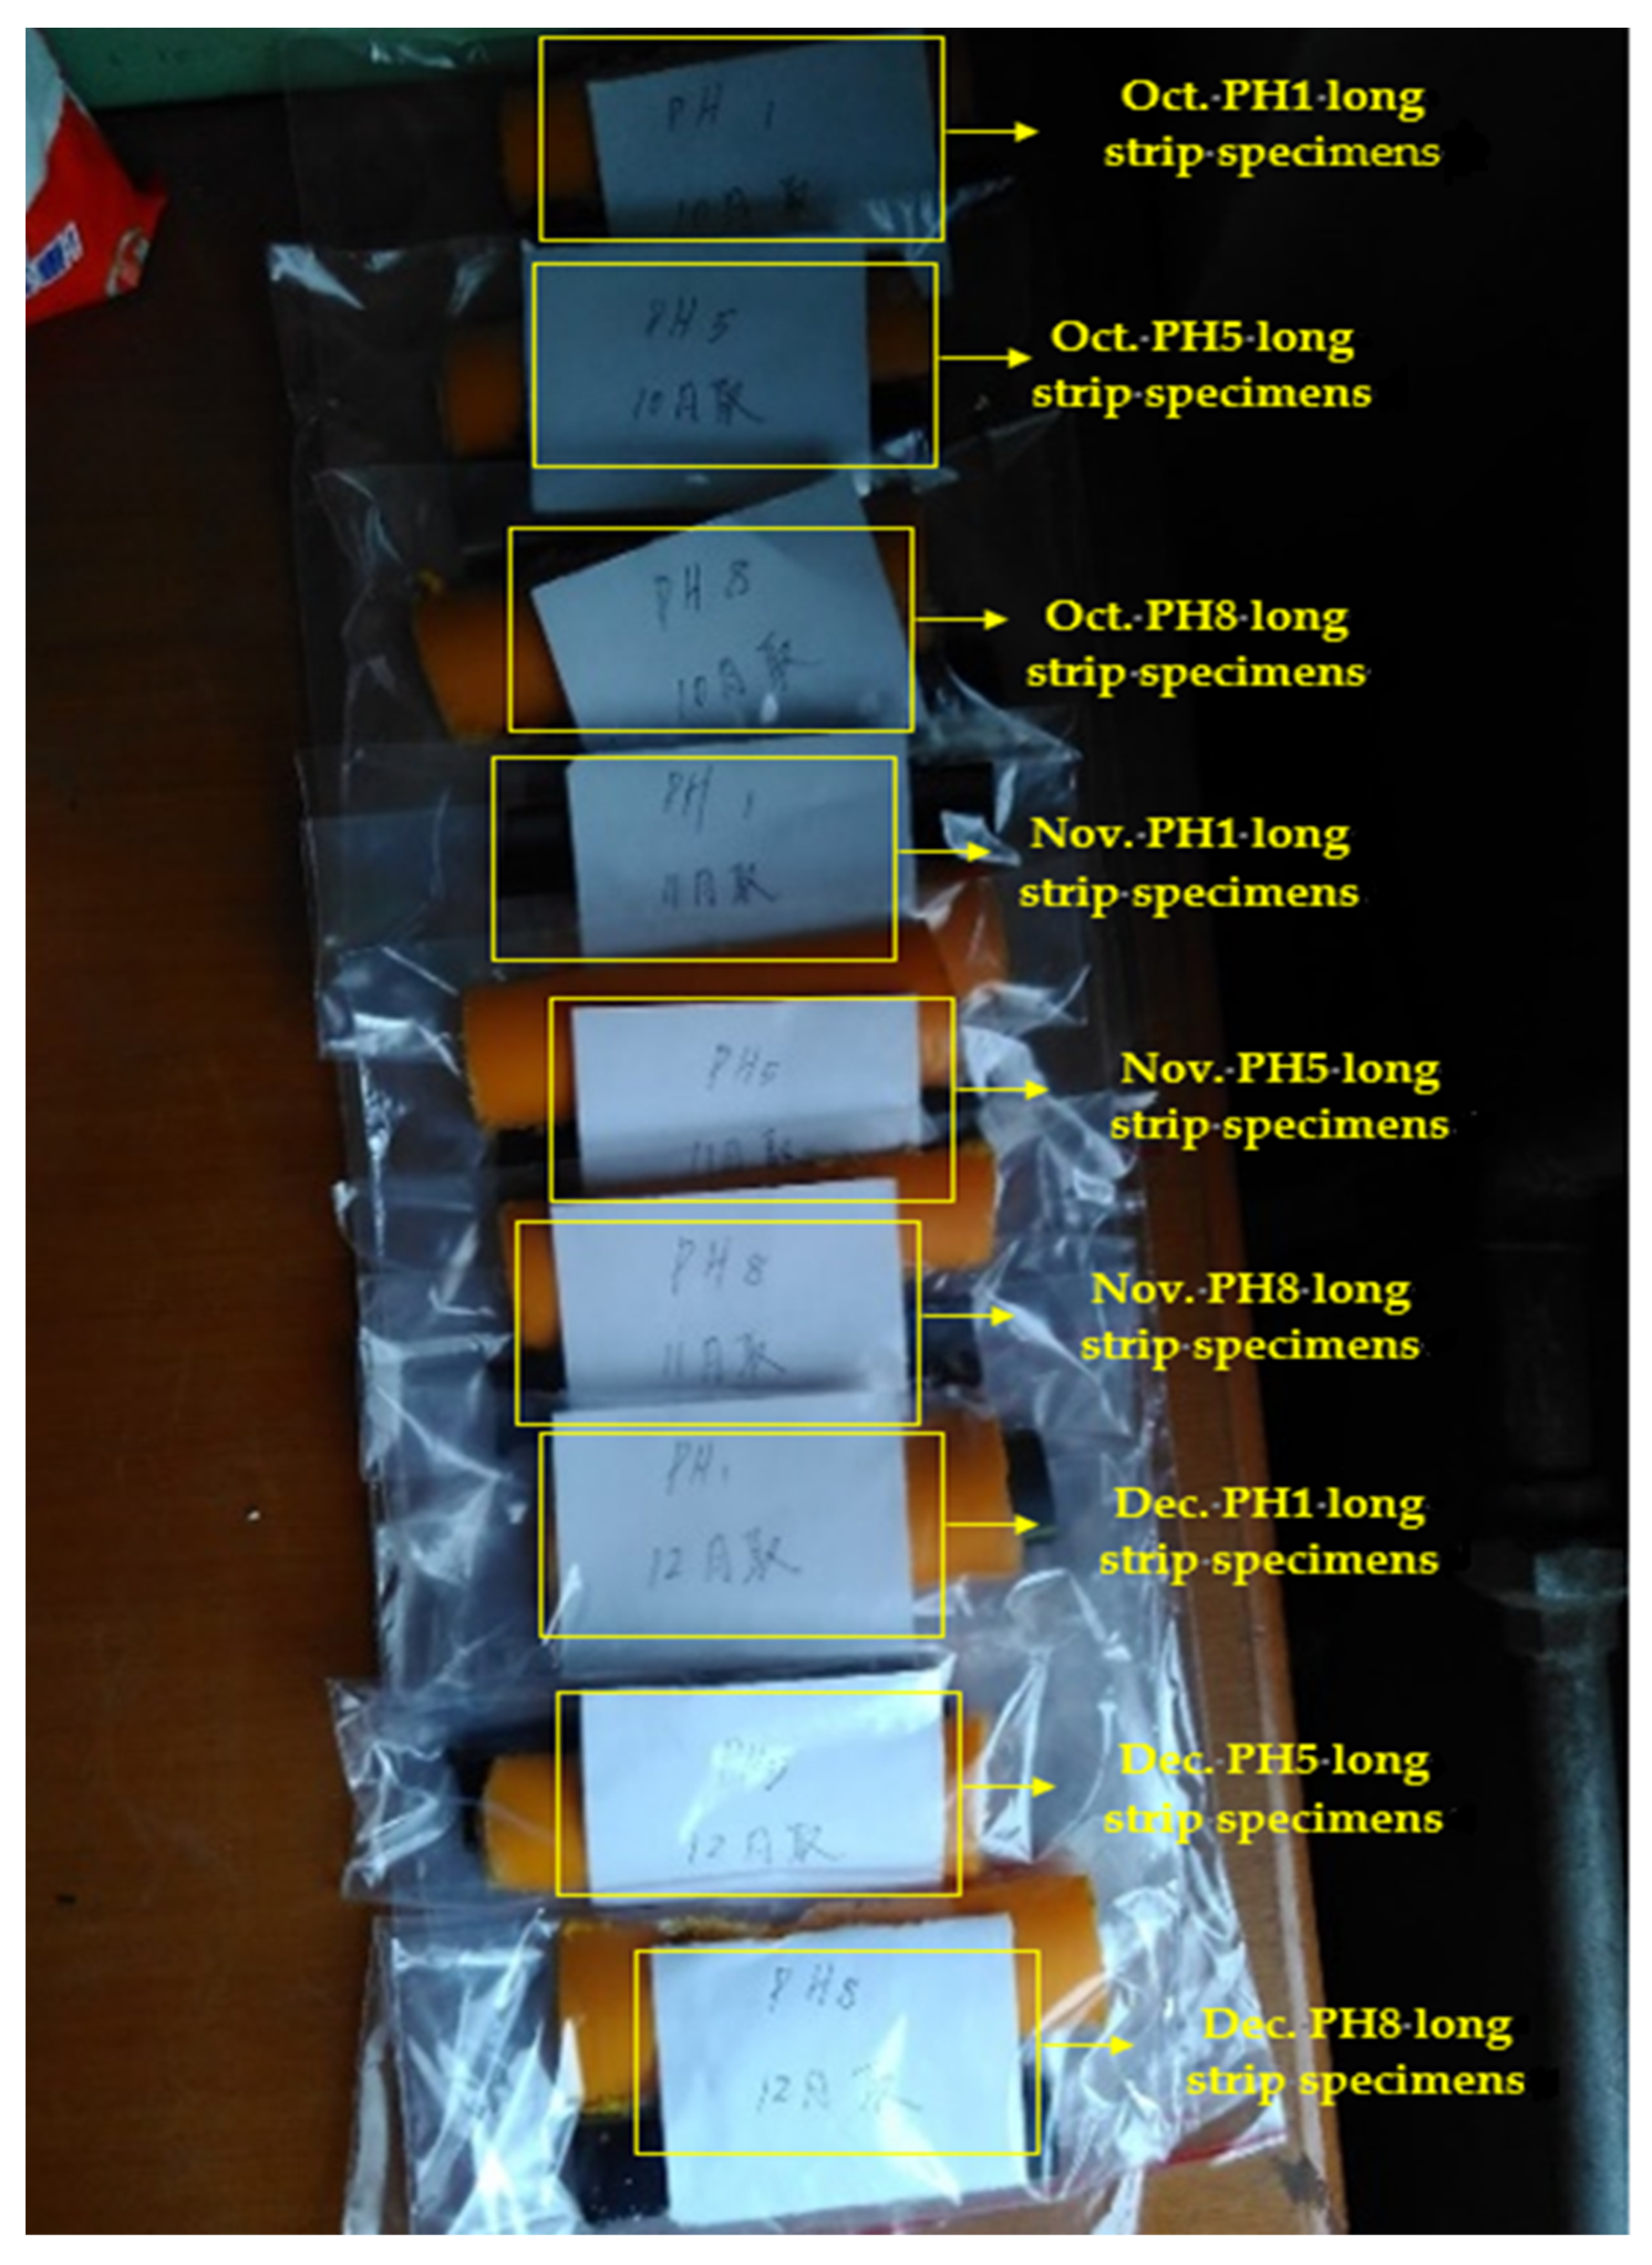
Figure 2.
Shimadzu AGS-X type electronic.

Figure 3.
Standard specimen size chart.
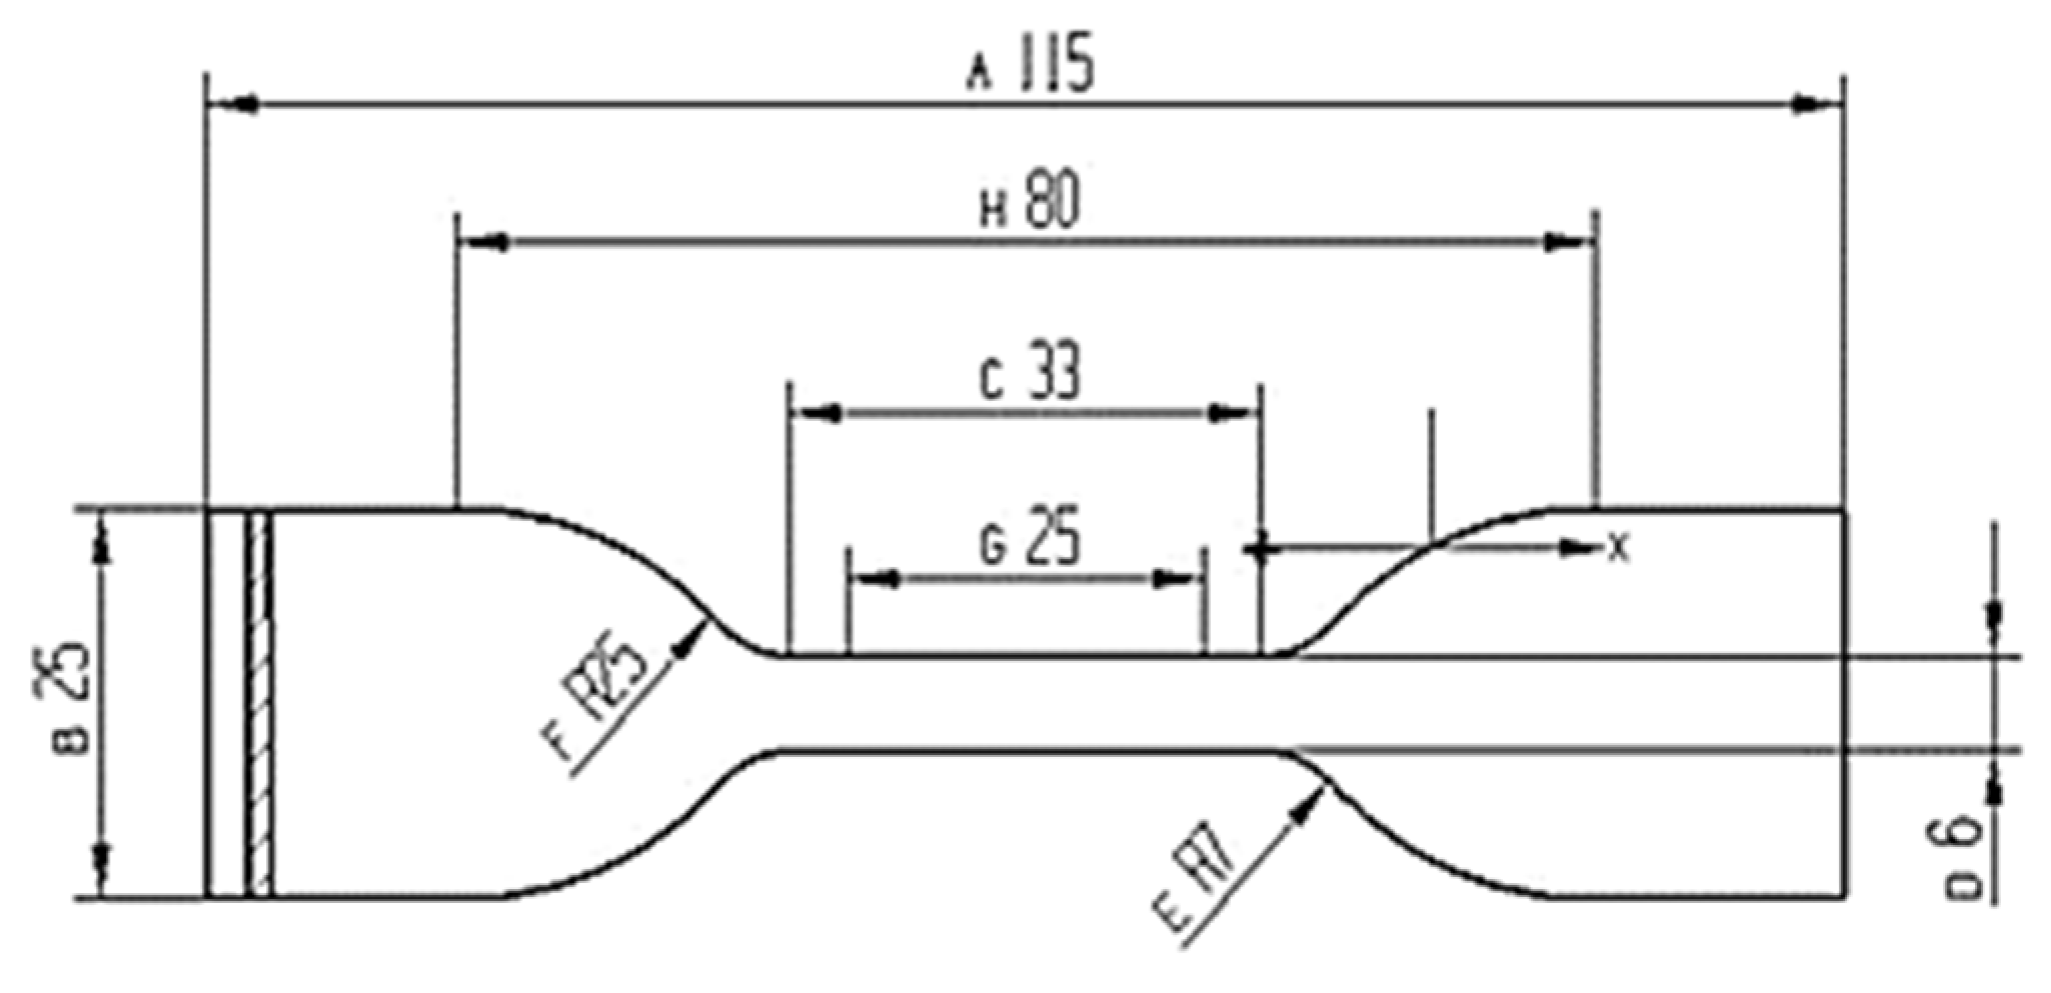
Figure 4.
Tensile test machine.
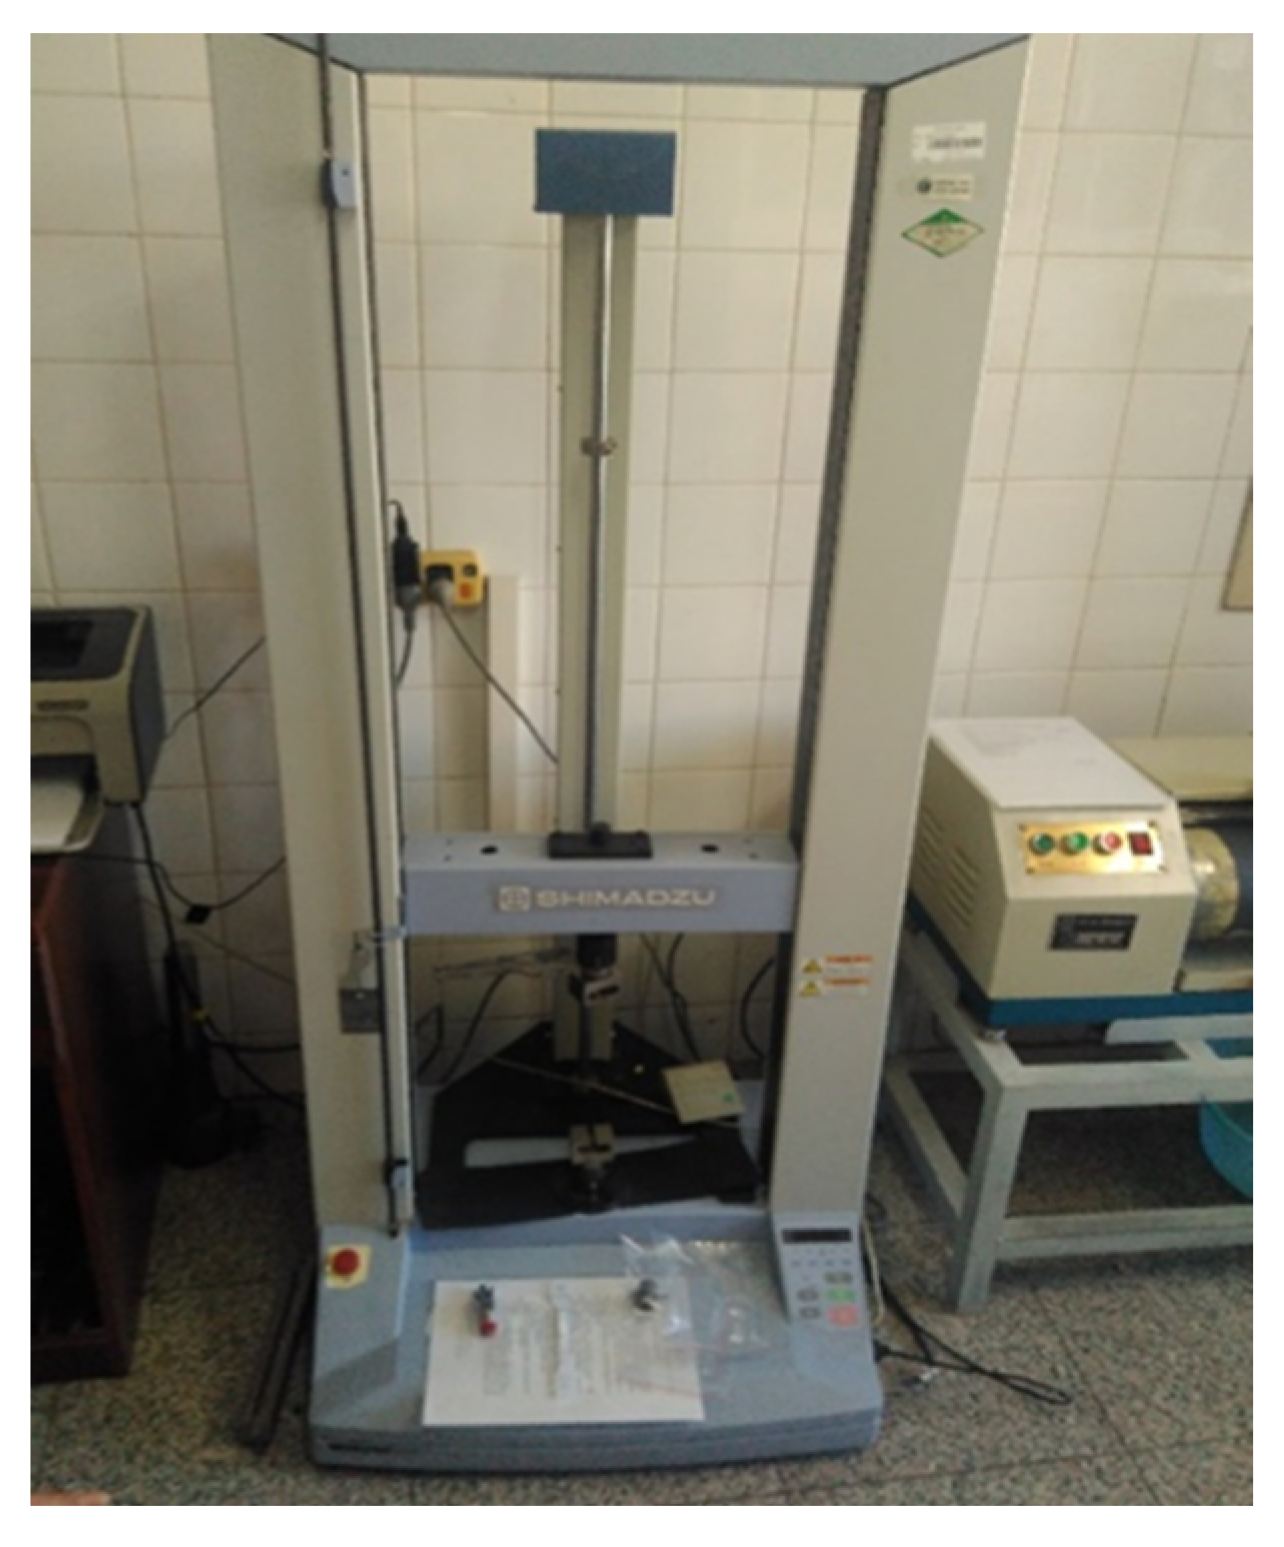
Figure 5.
Experimental flow chart.
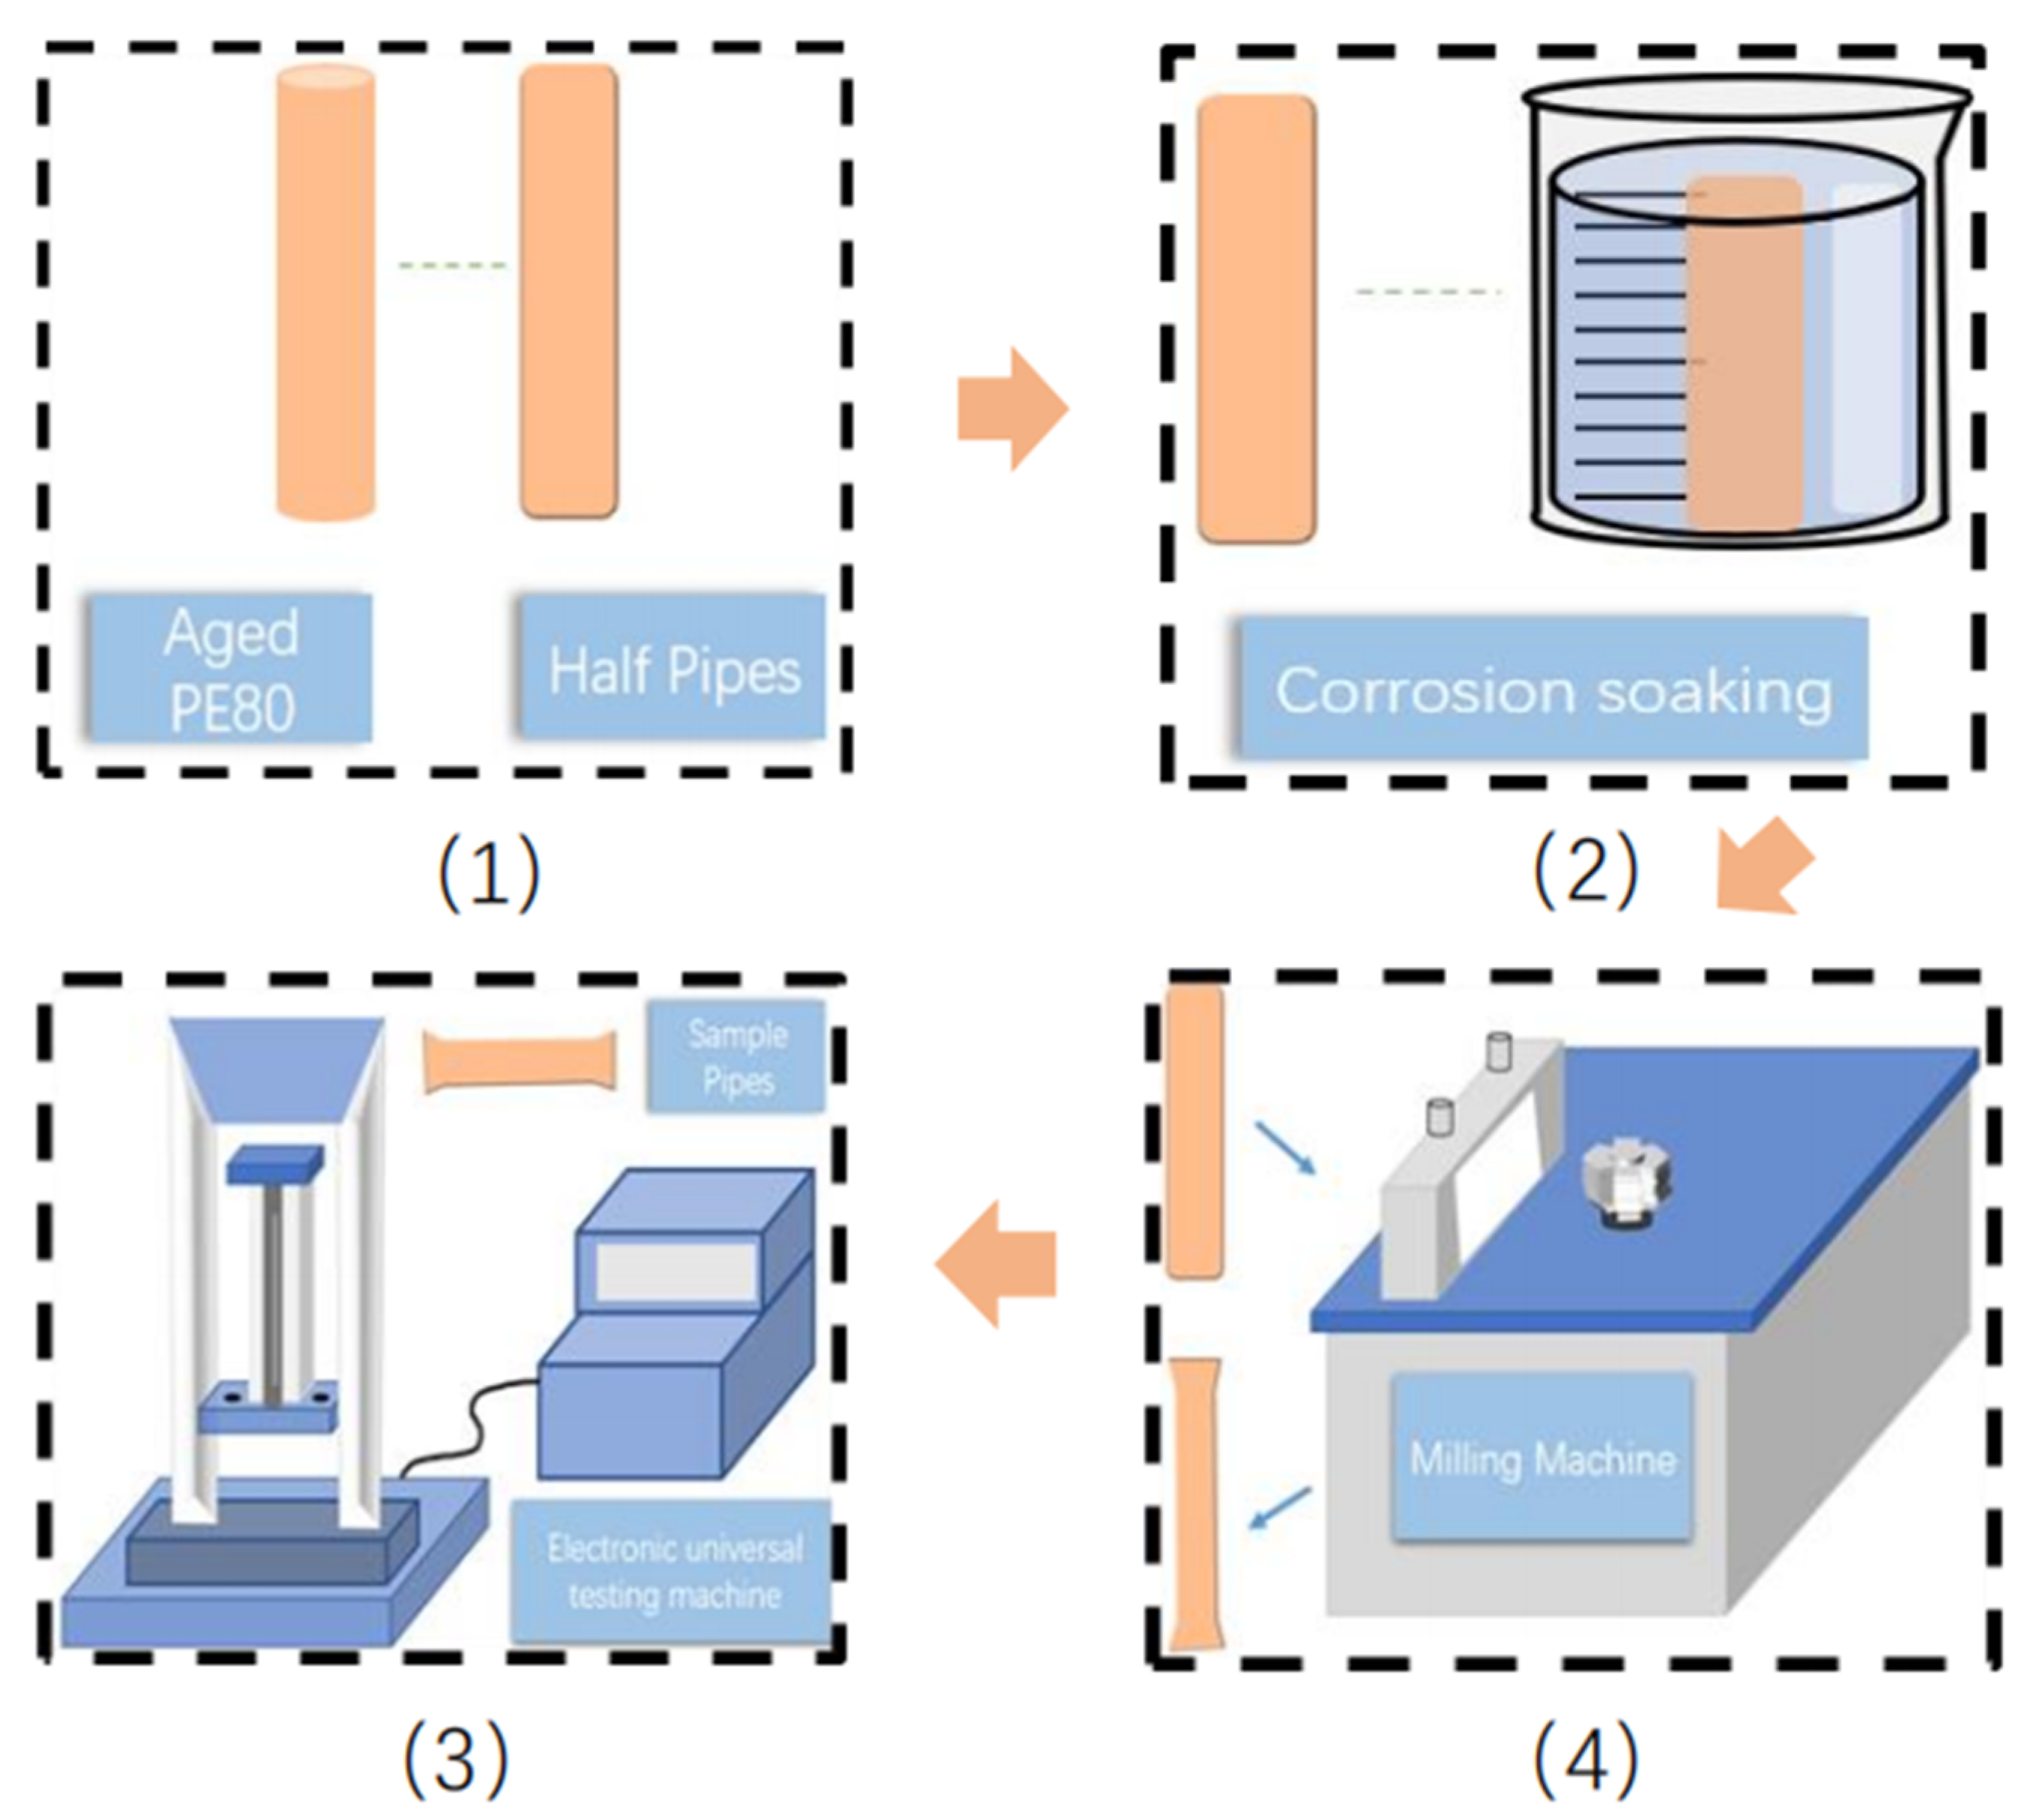
Figure 6.
Tensile ratio–true stress curve.

Figure 7.
PH–failure time curves of three solutions.


Table 1.
Name and size of each part of the standard specimen.
| Symbols | Description | Size |
|---|---|---|
| A | Minimum total length | 115 mm |
| B | End width | 25 mm |
| C | Parallel section length | 33 mm |
| D | Parallel section width | 6 mm |
| E | Small radius | 14 mm |
| F | Large radius | 25 mm |
| G | Distance between markers | 25 mm |
| H | Distance between wall thickness clamps | 80 mm |
Table 2.
PH1 corrosion immersion solution.
| Serial Number | Length at Fracture l/mm | Tensile Ratio λ | True Stress σture/MPa | Strain-Hardening Modulus Gp | |
|---|---|---|---|---|---|
| PH1 | 1 | 49.0631 | 1.9625 | 34.2 | −39.75 |
| 2 | 180.2725 | 7.2109 | 152.3092 | ||
| 3 | 48.9328 | 1.9573 | 35.0546 |
Table 3.
PH5 corrosion immersion solution.
| Serial Number | Length at Fracture l/mm | Tensile Ratio λ | True Stress σture/MPa | Strain-Hardening Modulus Gp | |
|---|---|---|---|---|---|
| PH5 | 1 | 60.4675 | 2.4187 | 52.4370 | 9.905 |
| 2 | 80.8125 | 3.2325 | 53.5489 | ||
| 3 | 201.4075 | 8.0563 | 169.0365 |
Table 4.
PH8 corrosion immersion solution.
| Serial Number | Length at Fracture l/mm | Tensile Ratio λ | True Stress σture/MPa | Strain-Hardening Modulus Gp | |
|---|---|---|---|---|---|
| PH8 | 1 | 176.805 | 7.0722 | 150.3760 | 5.6469 |
| 2 | 183.66 | 7.3464 | 156.9173 | ||
| 3 | 199.7375 | 7.9895 | 165.9158 |
Table 5.
Failure time of the three specimens.
| Number | PE-S-PH1 | PE-S-PH5 | PE-S-PH8 |
|---|---|---|---|
| Expiration time (Days) | 1.872 | 1060.507 | 1128.58 |
Table 6.
Mathematical Models.
| Serial Number | Algorithms | Formulas | Parameters a/b/c | R-Squared |
|---|---|---|---|---|
| 1 | Exp2PMod2 | y = e(a + b × x) | a = −2.45627, b = 0.61248 | 0.631 |
| 2 | Allometric1 | y = a × xb | a = 0.8158, b = 1.3052 | 0.672 |
| 3 | Asymptotic1 | y = a − b × cx | a = −16.426, b = 11.03702, c = 0.3153 | 0.728 |
| 4 | Log2P1 | y = b × ln(x − a) | a = 2.93547, b = 3.12234 | 0.898 |
| 5 | Secondary regression curve | y = a + b × x + c × x2 | a = −1.19352, b = 1.29333, c = −0.0947 | 1 |
Disclaimer/Publisher’s Note: The statements, opinions and data contained in all publications are solely those of the individual author(s) and contributor(s) and not of MDPI and/or the editor(s). MDPI and/or the editor(s) disclaim responsibility for any injury to people or property resulting from any ideas, methods, instructions or products referred to in the content. |
© 2023 by the authors. Licensee MDPI, Basel, Switzerland. This article is an open access article distributed under the terms and conditions of the Creative Commons Attribution (CC BY) license (https://creativecommons.org/licenses/by/4.0/).
Share and Cite
MDPI and ACS Style
Ran, W.-S.; Niu, L.; Wang, Y.; Lin, N.; Feng, G.-W.; Lan, H.-Q. A Lifetime Prediction Method of Pressured Gas Polyethylene Pipes by Strain-Hardening Modulus and Tensile Test. Appl. Sci. 2023, 13, 7965. https://doi.org/10.3390/app13137965
AMA Style
Ran W-S, Niu L, Wang Y, Lin N, Feng G-W, Lan H-Q. A Lifetime Prediction Method of Pressured Gas Polyethylene Pipes by Strain-Hardening Modulus and Tensile Test. Applied Sciences. 2023; 13(13):7965. https://doi.org/10.3390/app13137965
Chicago/Turabian StyleRan, Wen-Shen, Li Niu, Yang Wang, Nan Lin, Guo-Wei Feng, and Hui-Qing Lan. 2023. "A Lifetime Prediction Method of Pressured Gas Polyethylene Pipes by Strain-Hardening Modulus and Tensile Test" Applied Sciences 13, no. 13: 7965. https://doi.org/10.3390/app13137965
Note that from the first issue of 2016, this journal uses article numbers instead of page numbers. See further details here.