Article

Climate Change Impacts on Frost and Thaw Considerations: Case Study of Airport Pavement Design in Canada

by
Paula Sutherland Rolim Barbi
1,
Pejoohan Tavassoti
2,* and
Susan L. Tighe
3
1
Department of Civil and Environmental Engineering, University of Waterloo, Waterloo, ON N2L 3G1, Canada
2
Faculty of Engineering, Department of Civil and Environmental Engineering, Centre for Pavement and Transportation Technology (CPATT), University of Waterloo, Waterloo, ON N2L 3G1, Canada
3
Faculty of Engineering, Department of Civil Engineering, McMaster University, Hamilton, ON L8S 4L7, Canada
*
Author to whom correspondence should be addressed.
Appl. Sci. 2023, 13(13), 7801; https://doi.org/10.3390/app13137801
Submission received: 5 May 2023 / Revised: 16 June 2023 / Accepted: 18 June 2023 / Published: 1 July 2023

Abstract

:
Rising temperatures due to climate change can significantly impact the freeze–thaw condition of airport pavements in cold regions. This case study investigates the implications of warming temperatures on the freeze–thaw penetration and frost heave of pavements in critical airports across Canada. To this end, different methods were used in the quantification process through climate change simulations considering emission scenario RCP8.5 in 20 and 40 year time horizons. The results show that climate change would have different design implications for airport pavements, depending on their location. The predictions suggest a shallower frost penetration depth, and possibly less frost heave, for the airports not underlain by permafrost, while airports over permafrost areas might experience an increase in thickness of the active layer, ranging from 41 to 57 percent, by 2061. Among the different methods used in this study, it was observed that some methods performed better in predicting the frost depth of fine soils, while others worked better in the frost depth prediction of coarse soils. The results indicate the need for more mechanistic models to provide a more realistic prediction of freeze–thaw penetration, as compared to existing empirical models.

1. Introduction

Canada’s Changing Climate Report, published in 2019, presents several crucial facts that can affect the life cycle of airport and road pavements. According to the report, the annual average temperature in Canada increased by 1.7 °C between 1948 to 2019; however, the most drastic change can be noticed over the winter seasons, found to be warmer by 3.3 °C [1]. Further to the average temperature changes, an increase in temperature can lead to changes in the timing and duration of winter freezing and spring thawing in cold regions, directly impacting frost and thaw penetration depths [2].
Sias et al. used an ensemble of climate models to forecast how climate change might affect freezing and thawing processes beneath roadways in New Hampshire and Maine in the United States [2]. The results of the study showed that the duration for which the pavement cross section remains frozen will be significantly shortened over the next 30 years, and that shallower frost depths are projected for the end of the century. Figure 1 shows the predicted frost depth in different sites in New Hampshire and Maine, demonstrating that projected frost depths under emission scenario RCP 8.5 will become shallower at a greater rate than emission scenario RCP 4.5 after 2040. The results also suggested larger changes over time, and larger differences between the low- and high-emission scenarios at the end of the century for the sites with deeper frost penetration.
Similarly, Canadian pavement conditions will also be impacted by the warming climate. With shorter freezing season lengths in Canada, not only will frost penetration depth decrease, but also the minimum pavement-thickness requirements to cope with frost penetration. While the latter may possibly lower the initial cost of construction, areas underlain by permafrost may suffer from pavement bearing capacity reduction due to melting of the frozen layers.
Permafrost temperature in Canada has increased over the past three to four decades. Regional observations have shown warming rates of about 0.1 °C per decade in the central Mackenzie Valley, and 0.3 °C to 0.5 °C per decade in the high Arctic [1]. Such increments might seem modest; however, permafrost layers can be highly vulnerable to thawing, since the soil temperature in these regions is already close to zero [1]. Melting of the permafrost soil will increase the seasonal active layer thickness; that is, the upper part of the ground that freezes and thaws each year. For instance, the seasonal active layer thickness in the Mackenzie Valley has increased by approximately 10% since 2000 [1], making these areas more prone to deformations and distresses caused by freeze–thaw cycling.
Knowing how climate change can impact airport pavement freeze–thaw conditions is essential for better planning future transportation infrastructure projects in Canada. However, there are few, if any, available studies in the existing literature to inform decision making in this area. To this end, the aim of this study was to analyze how climate change will affect freeze–thaw penetration and frost heave in several locations across Canada. First, frost depth calculations from three methods were compared to the field data with the goal of evaluating the accuracy of the methodologies. Then, freeze–thaw depths and frost heave predictions for the high emission scenario RCP8.5, in 20 and 40 year time horizons, were made.

2. Background

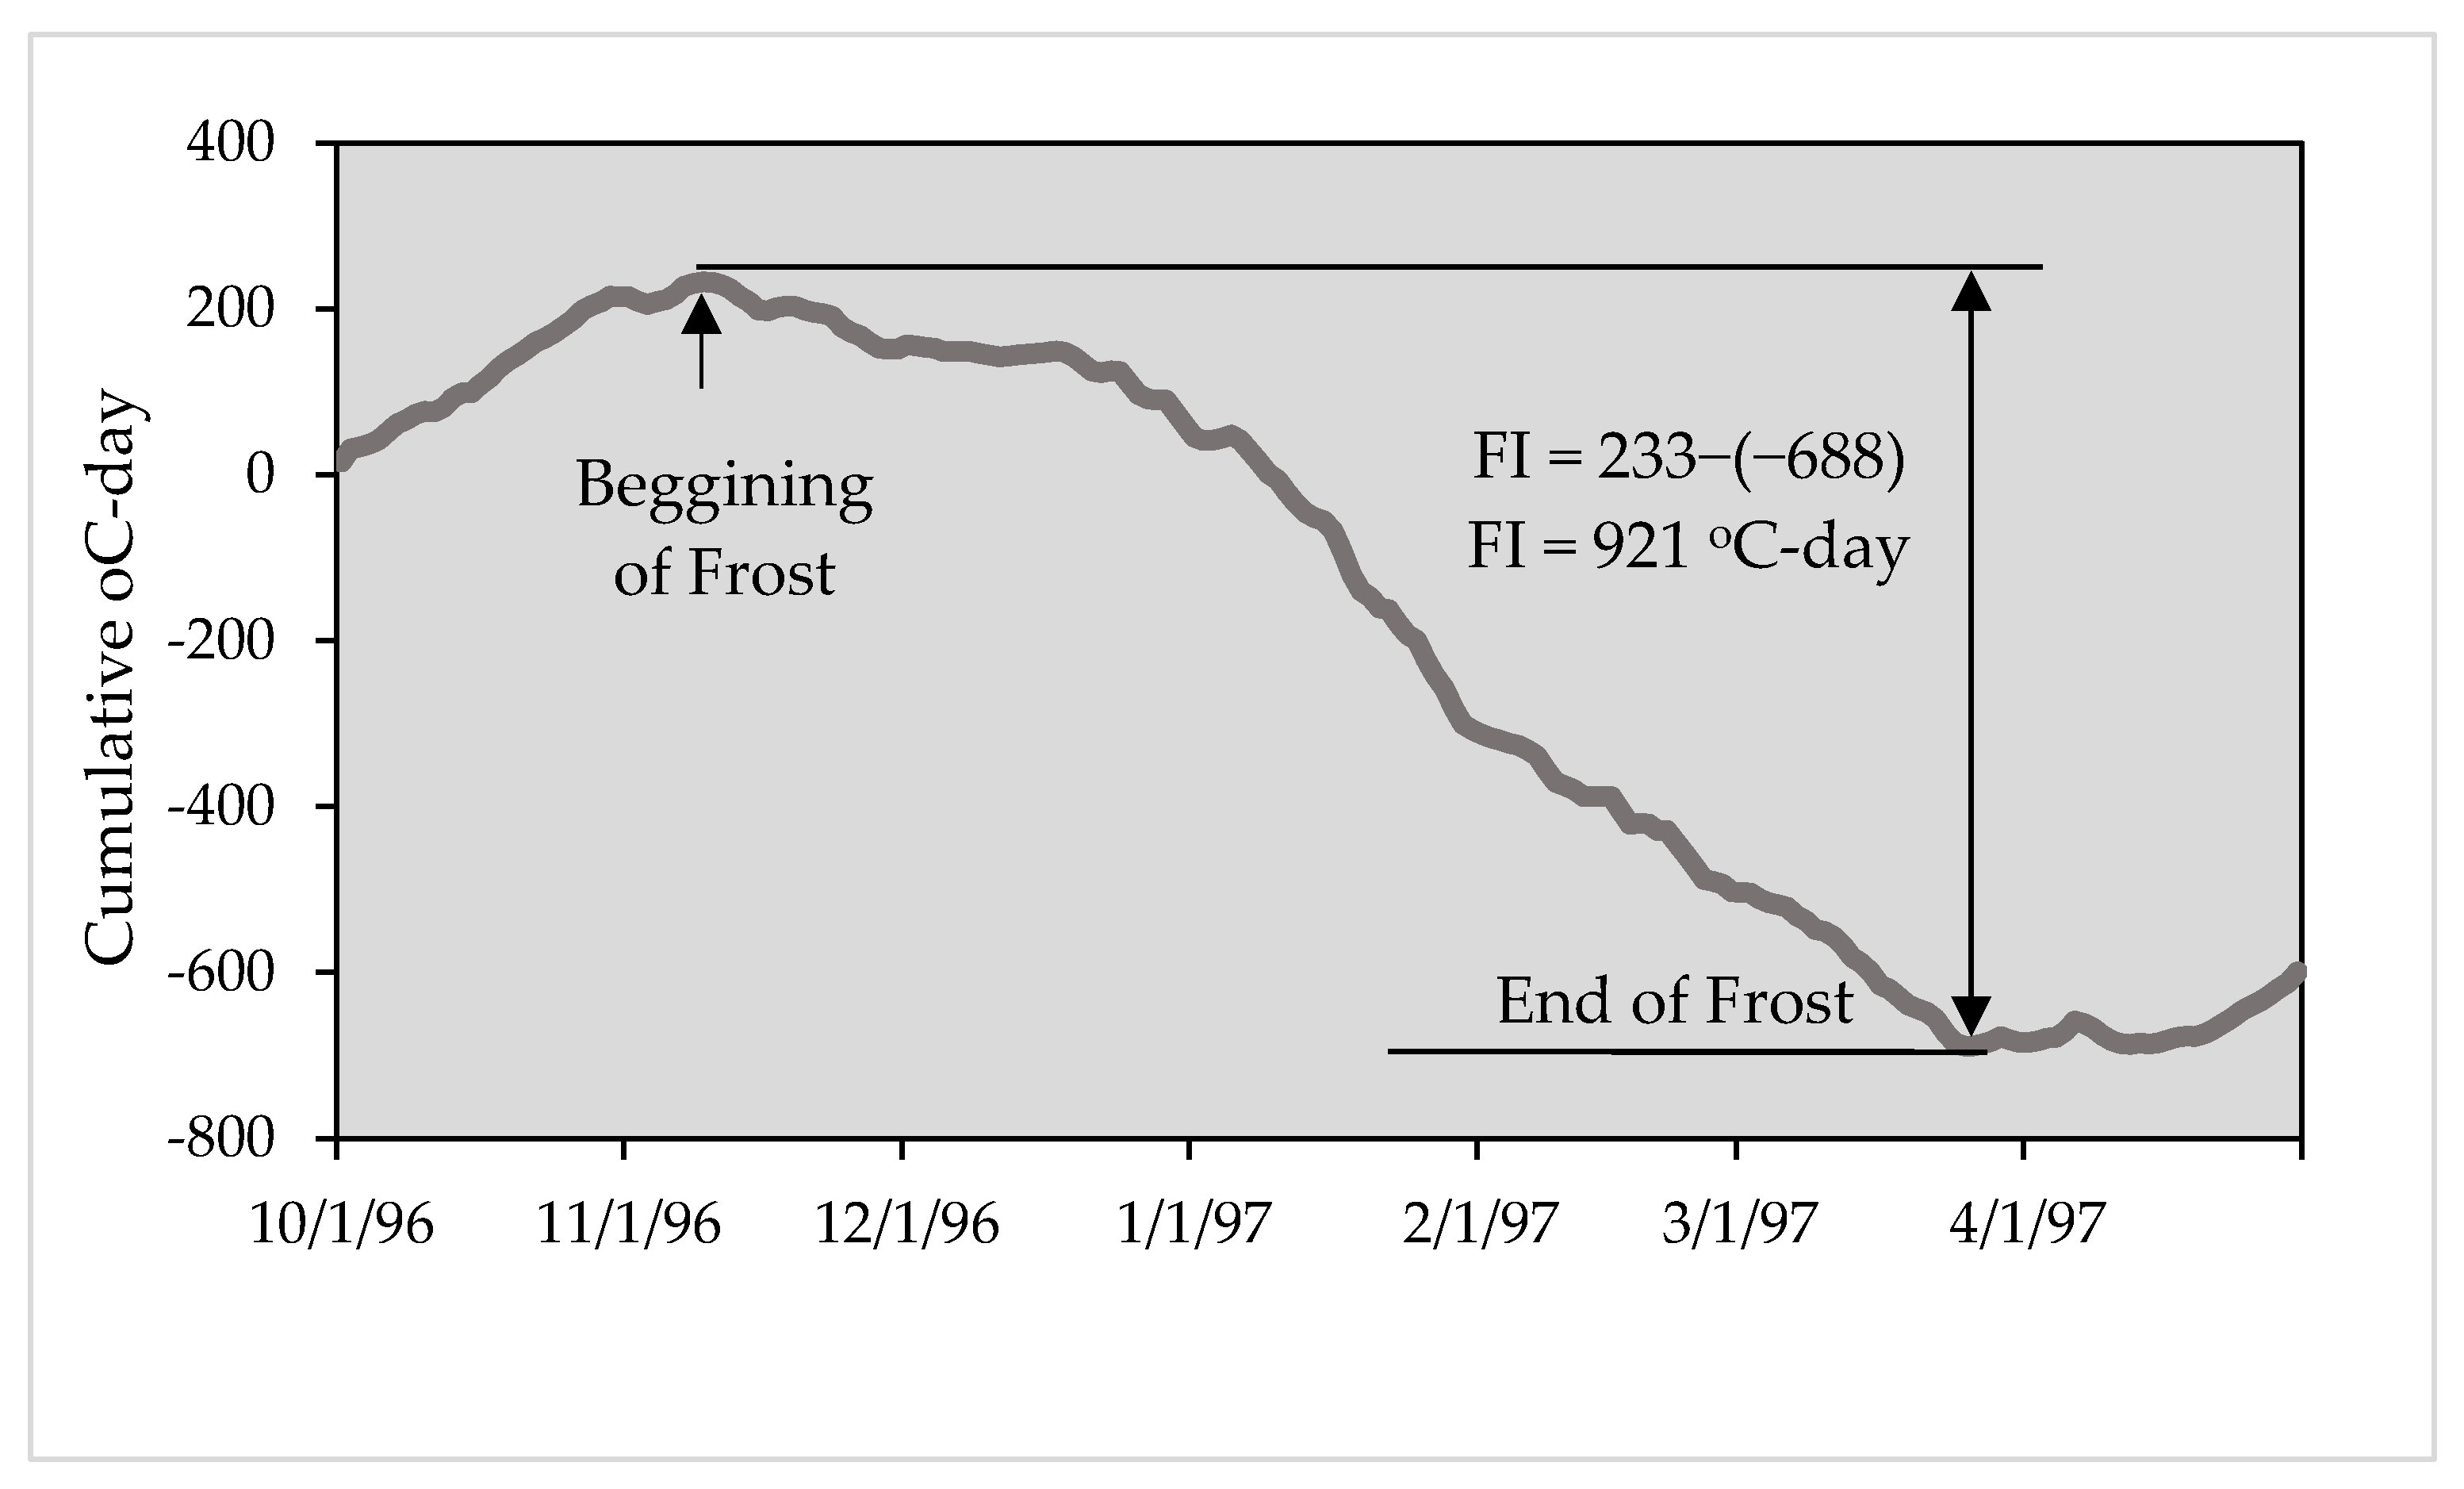
2.1. Frost Penetration and Heave

There are several methods to calculate frost penetration depth; almost all these methods are related to the freezing index (FI), which is a measure of the severity of freezing condition during the winter season. FI is calculated as the summation of daily average air temperatures over the freezing period [3]. Figure 2 shows an example of the calculation of the FI over the winter of 1996/1997 in Beatrice, ON.
According to the Transport Canada Civil Aviation (TCCA) manual of pavement structural design ASG-19, the frost protection depth should be calculated using a minimum 10-year average freezing index [3]. Site air freezing index measures should be available from airfield data records, based on meteorological observations. If not available, Transport Canada allows an estimation to be made from a map of freezing indexes provided at the ASG-19 manual.
Limiting the depth of frost action into the subgrade soils can limit the potential for frost heave and thaw weakening. This is achieved by defining a minimum pavement thickness and excavating the soil susceptible to frost penetration, preferably to the full depth. However, when the latter approach is not possible, ASG-19 advises that at least 1 m should be excavated [3]. To identify whether a soil is frost susceptible or not, TCCA relies on soil gradation, where the subgrade soil is non-frost-susceptible if it has less than 10 percent passing the 0.075 mm sieve. TCCA uses an empirical equation to calculate frost penetration depth. The method is based on the results published by Argue and Denyes [4], who evaluated 39 sites and 93 observations to predict frost depth in asphalt-surfaced pavements. The calculation of frost penetration depth in asphalt-surfaced pavements, according to the Pavement Structural Design Manual ATR-021 proposed by TCCA, is presented in Equation (1) [5].
T m i n = 61 + 6.8 F
where T m i n is the minimum thickness of the pavement structure (cm) and F is the average annual air freezing index (°C-days).
Another available method to classify the soil frost susceptibility is the Chamberlain method, used by the Ministry of Transportation of Ontario (MTO) [6]. This method defines the soil, according to the material proportions of sand, silt, and clay, as acceptable, borderline, or unacceptable material. To calculate the frost penetration depth, the MTO uses the empirical curve presented in Equation (2).
P = 32.8 + 5.78 F
where P is the frost penetration depth (cm) and F is the freezing index (°C-days).
On the other hand, Ministère des Transports du Québec (MTQ) proposes a mechanistic approach to predict frost depth and frost heave as a function of climate, subgrade soil properties, and pavement thickness. This analysis method requires more detailed site investigation than other methods, but it has been shown, through validation procedures, to yield good results in predicting frost penetration depth [7].
The MTQ approach is based on the SSR model developed in Finland [8], in which the calculation of the frost depth is based on the heat balance at the frost front. This method accounts for the segregation potential, which is a measure of the susceptibility of a soil to frost action, that can be measured in the laboratory or estimated through empirical equations. Material properties variables, such as dry density, particle mineralogy, water content, and specific surface area, are some of the inputs, providing the basis for calculation of thermal conductivities, latent heat, and other important material-dependent parameters. This model is utilized in i3C-me, a mechanistic software for pavement design and performance prediction, where a specific module is available to predict frost penetration and frost heave as a function of climate, subgrade soil properties, and pavement design [7,9].
In order to calculate frost depth and frost heave, the air–surface transfer coefficient (n-factor) also needs to be defined. The n-factor is defined as the ratio between the surface temperature and the air temperature in freezing conditions. This value depends on the atmospheric conditions (hours of sunshine, cloud cover, wind, humidity, pollution, etc.), the absorption capacity of the surface layer (e.g., albedo, colour, texture, sun exposure, inclination, orientation, etc.), and the thermal regime below the surface. Andersland and Ladanyi proposed typical values for the n-factor according to the surface conditions. The authors suggested that, for asphalt pavements, the n-value probably ranges from 0.9 to 0.95, while for concrete pavements this range would be between 0.7 and 0.9 [10].
Lastly, when predicting the frost penetration through the MTQ methodology, the rigorous frost index (FIr) needs to be defined. FIr represents an incremented frost index that accounts for colder-than-average winters. The i3c-me v1.0 software offers two options for determining this value. The first option uses an estimate that represents a winter that would correspond to the average of the three coldest winters over a 30-year period, according to Equation (3). The second option follows a probabilistic approach that considers the history of winters for a given period, over which the standard deviation and average of the freezing index distribution need to be calculated.
F I r = 1.143 F I n + 220
where F I r is the rigorous freezing index (°C-days) and F I n is the normal freezing index (°C-days), or just freezing index, as previously defined.
In the first analysis presented in the current study, the MTQ prediction was compared with field data from a specific year, where the rigorous freezing index was considered to be the same as the normal freezing index. In the second analysis, in which the MTQ prediction model was used to evaluate climate change scenarios, the rigorous freezing index was used, and its value was determined through Equation (3).

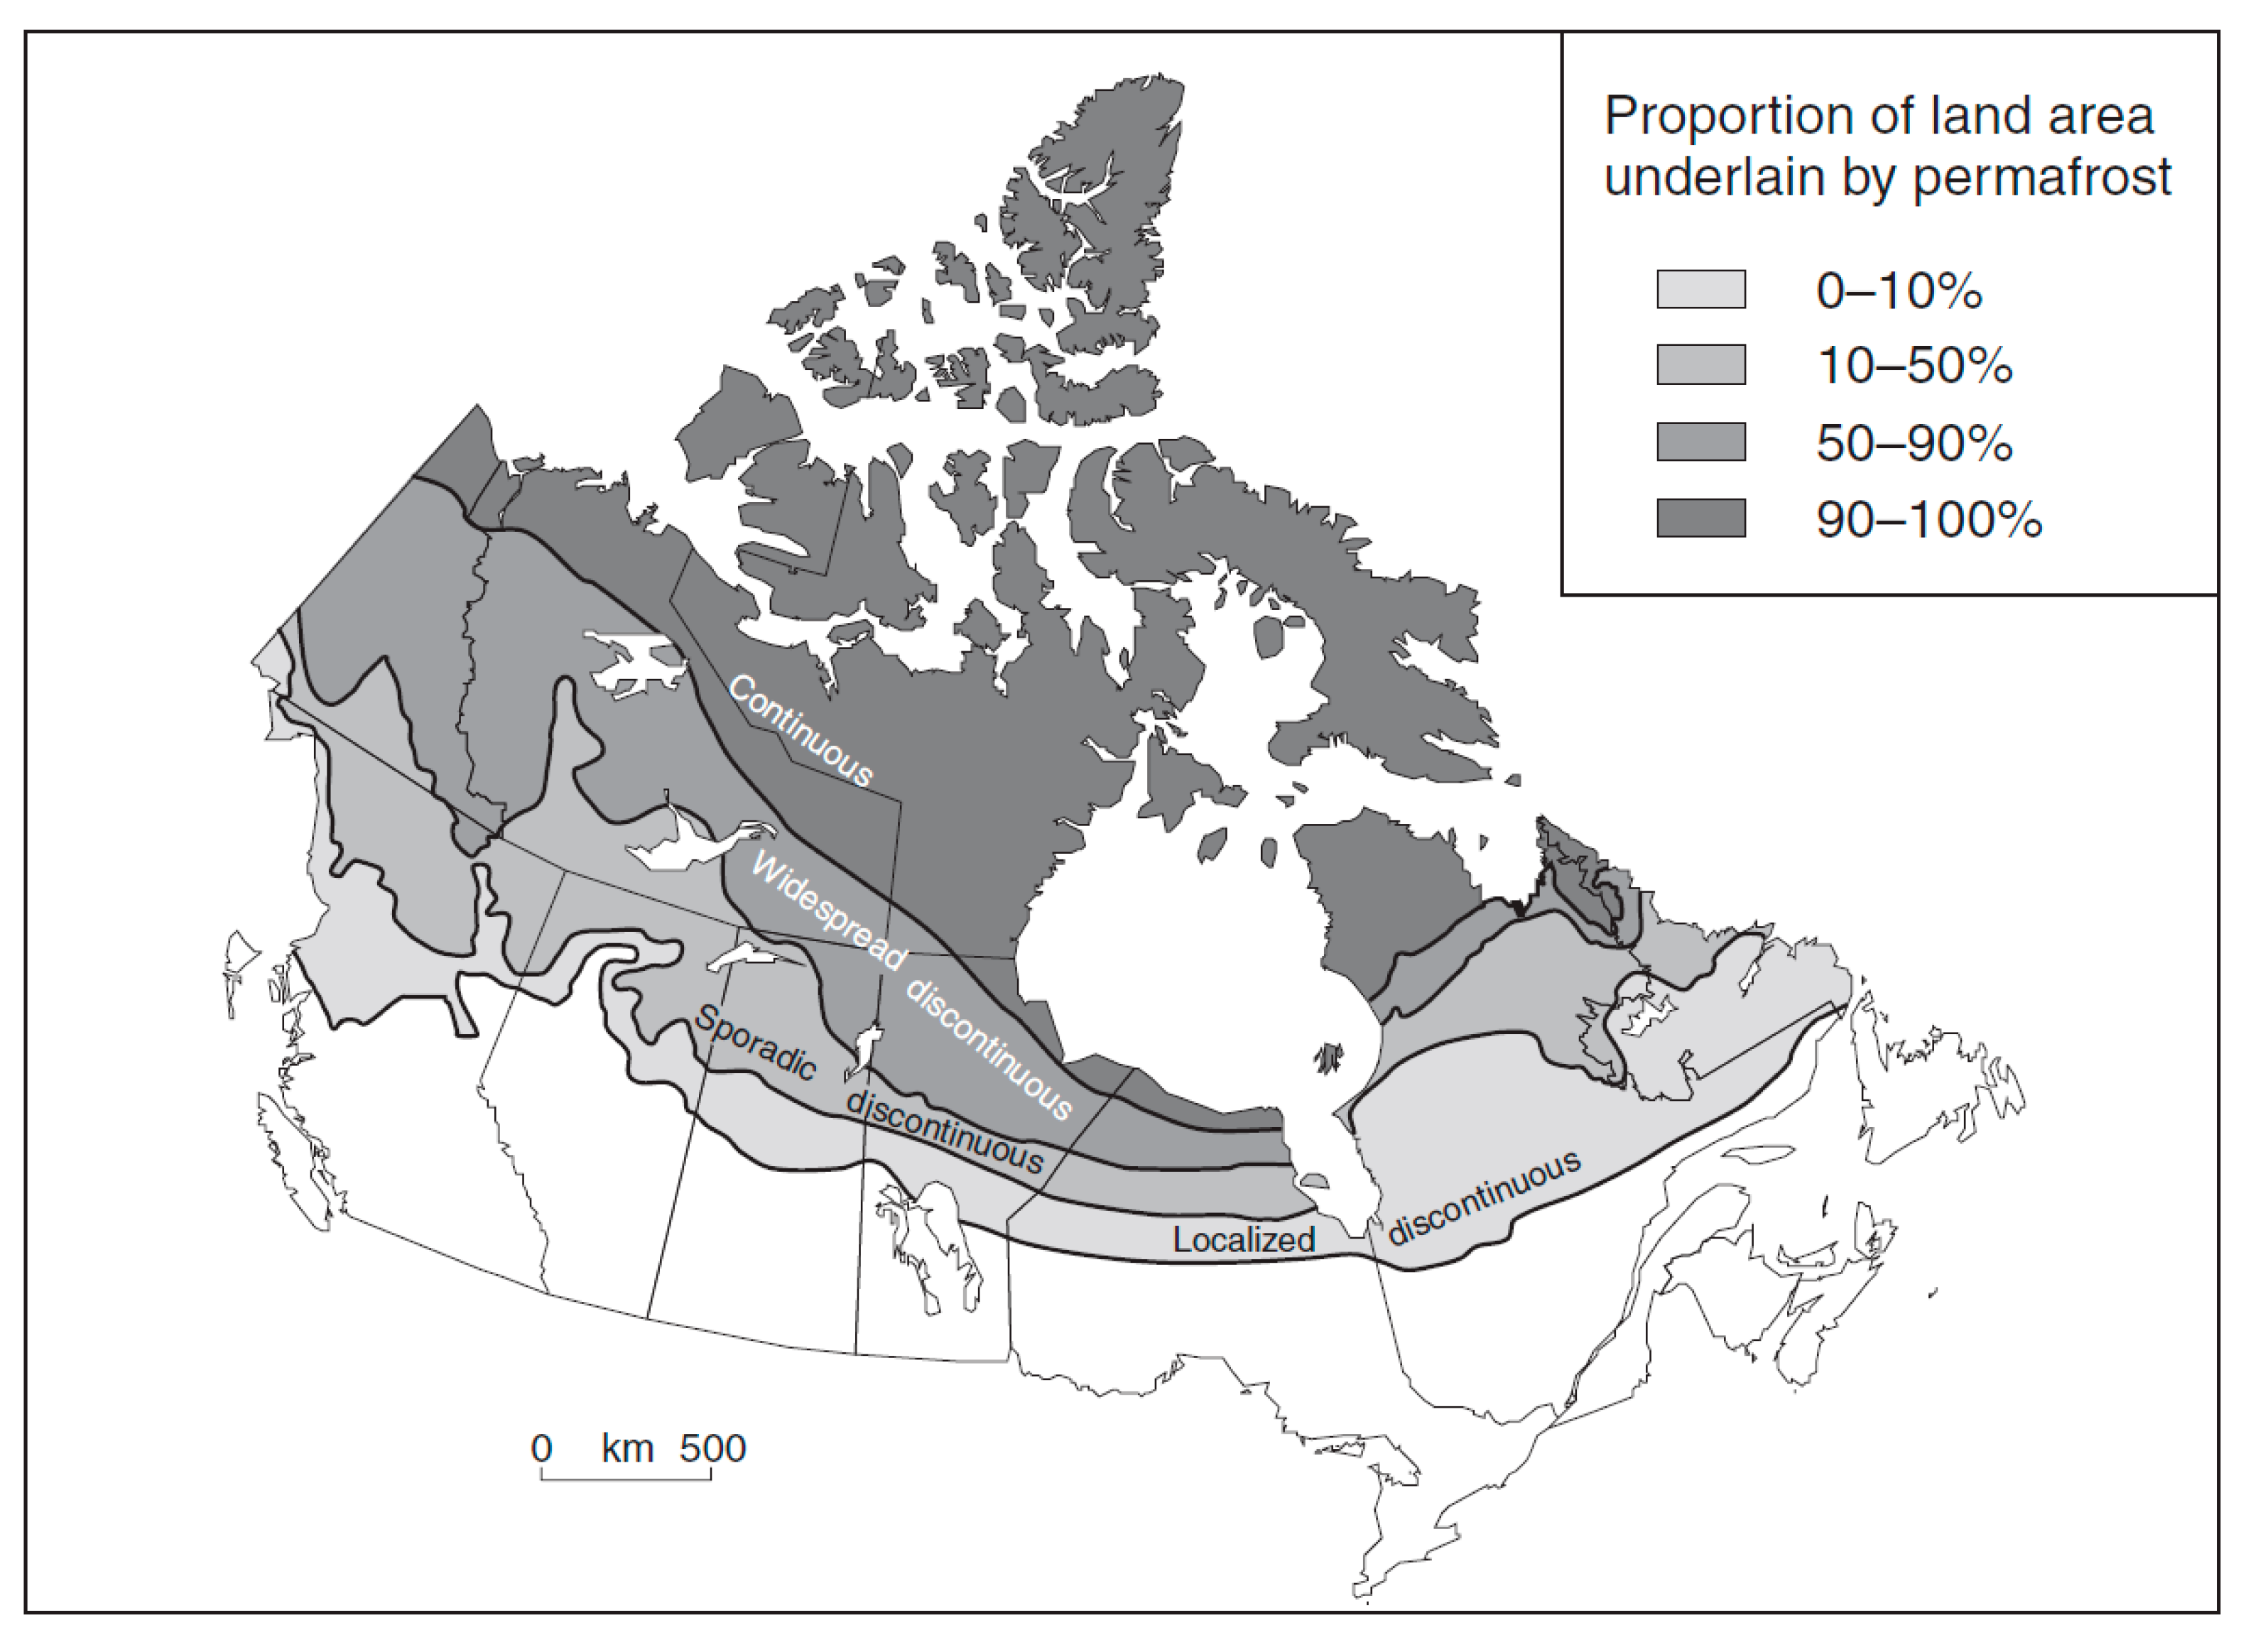
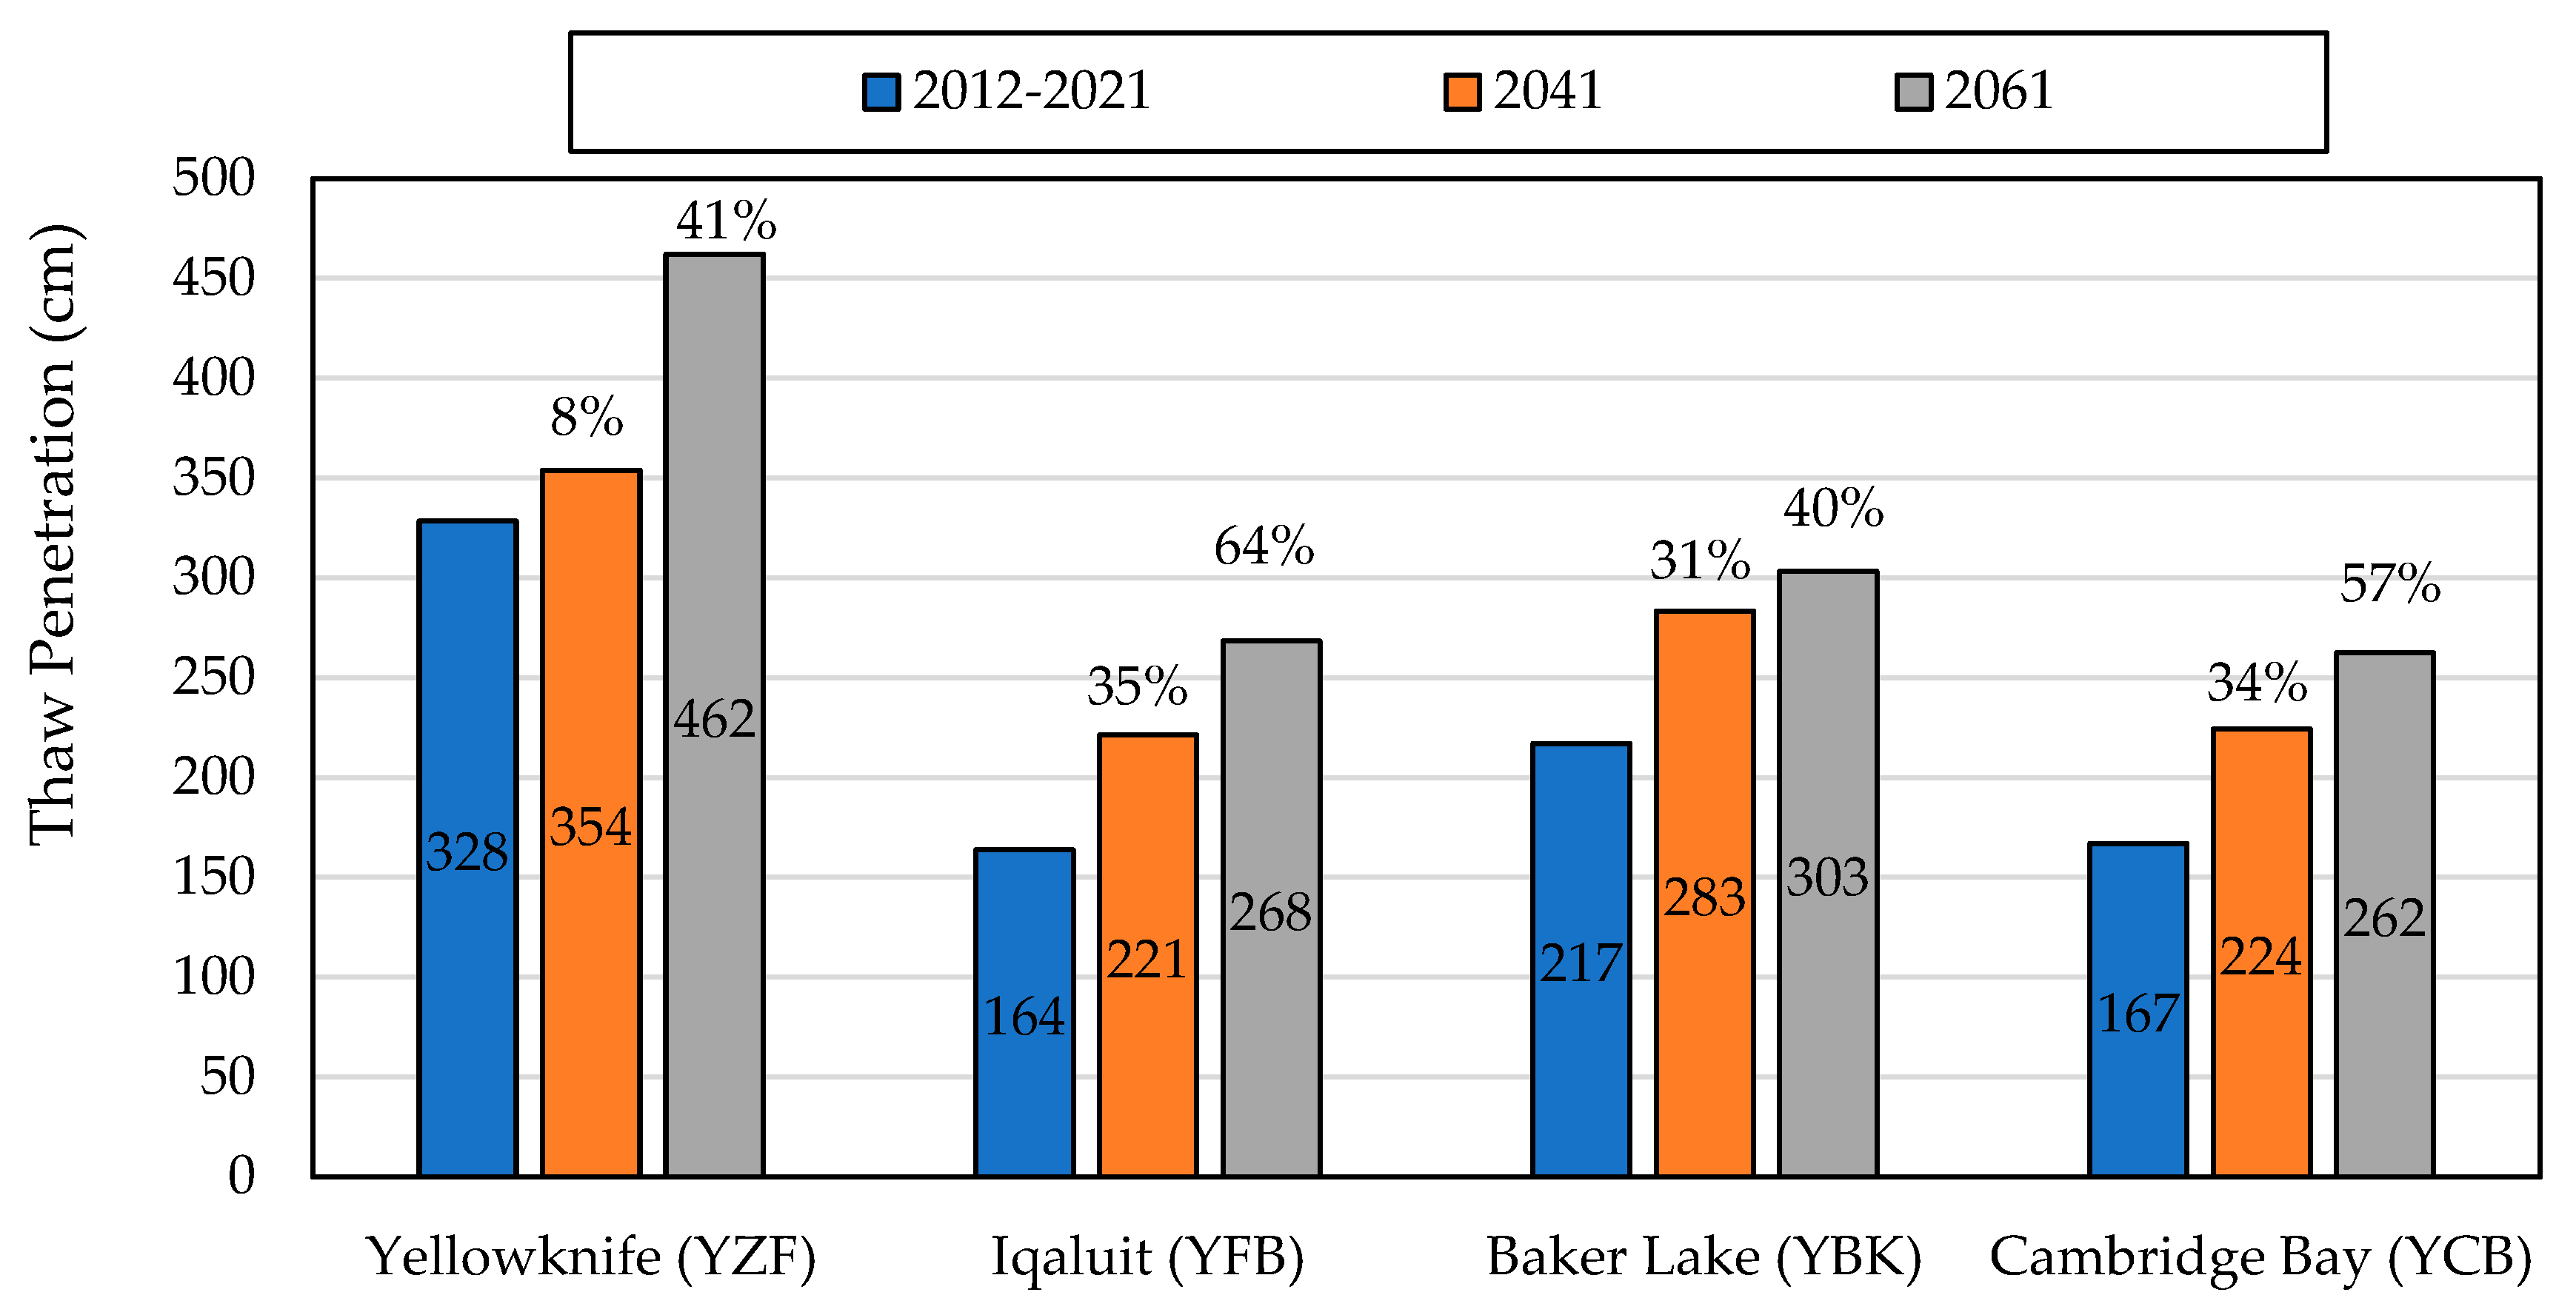
2.2. Permafrost Thawing

While southern areas of Canada may benefit from the shortening of the winter season, northern provinces will likely suffer with increased differential thaw settlement, frost heave, and a decrease in overall pavement strength due to permafrost thawing and a higher number of freeze–thaw cycles. Figure 3 shows a Canadian map that provides the classification of permafrost based on the proportion of land that is underlain by frozen layers within a given area. The southern areas in Canada are not underlain by permafrost, while northern areas are underlain by discontinuous or continuous permafrost layers. It should be noted that Figure 3 includes the most recent reliable map that could be retrieved at the time of this study, which dates back to about two decades ago. This is acknowledged as one of the limitations of the current research and underlines the need for an up-to-date map to inform future research in this area.
The thawing of previously-permanent frozen layers can cause serious damage to pavement structures due to settlement. Soil strength from ice bonding will be reduced as the ground water thaws, and this will lead to ground instability and higher incidence of slope failure in pavements [11]. The effects of a rise in the number of freeze–thaw cycles, on the other hand, include accelerated degradation of asphalt concrete materials [12], a decrease in asphalt concrete structural capacity, such as Marshall Stability [13], and a decrease in the tensile strength ratio of the asphalt mixture as a result of moisture-induced damages [14].
TCCA affirms that an optimum approach for designing pavements over permafrost areas is to provide a pavement and embankment thickness such that thawing does not reach the existing in-situ subgrade material. Whenever this alternative becomes uneconomical, the airport pavement design should be based on the bearing strength of the thawed subgrade soil. Therefore, thaw depth plays an important role in the design and performance of pavements located over permafrost areas. A study published by Argue and Denyes recorded observations of thaw penetration depth in gravel runways in Canada [4]. Based on the observations, a relationship between the depth of thaw and the thawing index in gravel runways was established according to Equation (4) [5].
X = 81.3 + 9.5 I
where X is the depth of thaw penetration (cm) and I is the thawing index (°C-days), calculated as the summation of daily average air temperatures over the thawing period [3]. This equation was used in the current study to predict thaw penetration depths in several airports over the northern regions of Canada.

3. Methodology

Two main analyses were performed in this research. First, the freeze–thaw depths were predicted by applying the MTO, MTQ, and TCCA methods, and the results were compared with the actual recorded frost depths measured from the field. In the next step, the analysis was used to evaluate the implications of these climate change projections in terms of frost penetration, frost heave, and thaw depth for several airports in Canada, as well as the U.S.A. The field data were obtained mainly from the Long-Term Pavement Performance (LTPP) database and includes nine cities located in Canada and the United States. Among the evaluated cases under the first analysis, only one case (St. Célestin, QC) was not obtained from the LTPP database, but rather through published data from Boutonnet and St-Laurent, 2003 [15]. The field data were then compared to the frost penetration depths calculated according to each site’s freezing index, in the case of the MTO and TCCA, and soil characteristics, in the case of the MTQ. The locations investigated under Analysis I were mainly chosen according to data availability, with the aim of representing different climate scenarios across Canada and the U.S.A. It can be recognized that each of the selected cities are located in a different province.
In the second analysis, a total of ten Canadian airports, which play key roles in the Canadian air transportation, were evaluated. The selected locations represent different climate scenarios within the country and compare how differently climate change will impact freeze–thaw penetration depth in those cities. Table 1 shows the locations evaluated in each analysis. It should be noted that all the airports within this analysis are of high importance to their corresponding provinces; therefore, it was deemed necessary to evaluate the implications of climate change for them. These airports are also well spread across the Canadian territories, representing different climate scenarios.
Table 2 shows the field data, including the section ID according to the LTPP database, the year in which the frost depth data were collected, the closest city to the data collection point, and the maximum frost penetration depth recorded in the referred year. The last two columns of the table include the Annual Mean Temperature (AMT, °C) and the Air Freezing Index (FI, °C-days), for which the raw data were obtained through Environment Canada [16] for the cases in Canada and the National Solar Radiation Database (NSRDB) [17] for the cases in the U.S.A. The AMT values were calculated considering the annual mean temperature from the two years, referenced in column two of Table 2.

4. Results

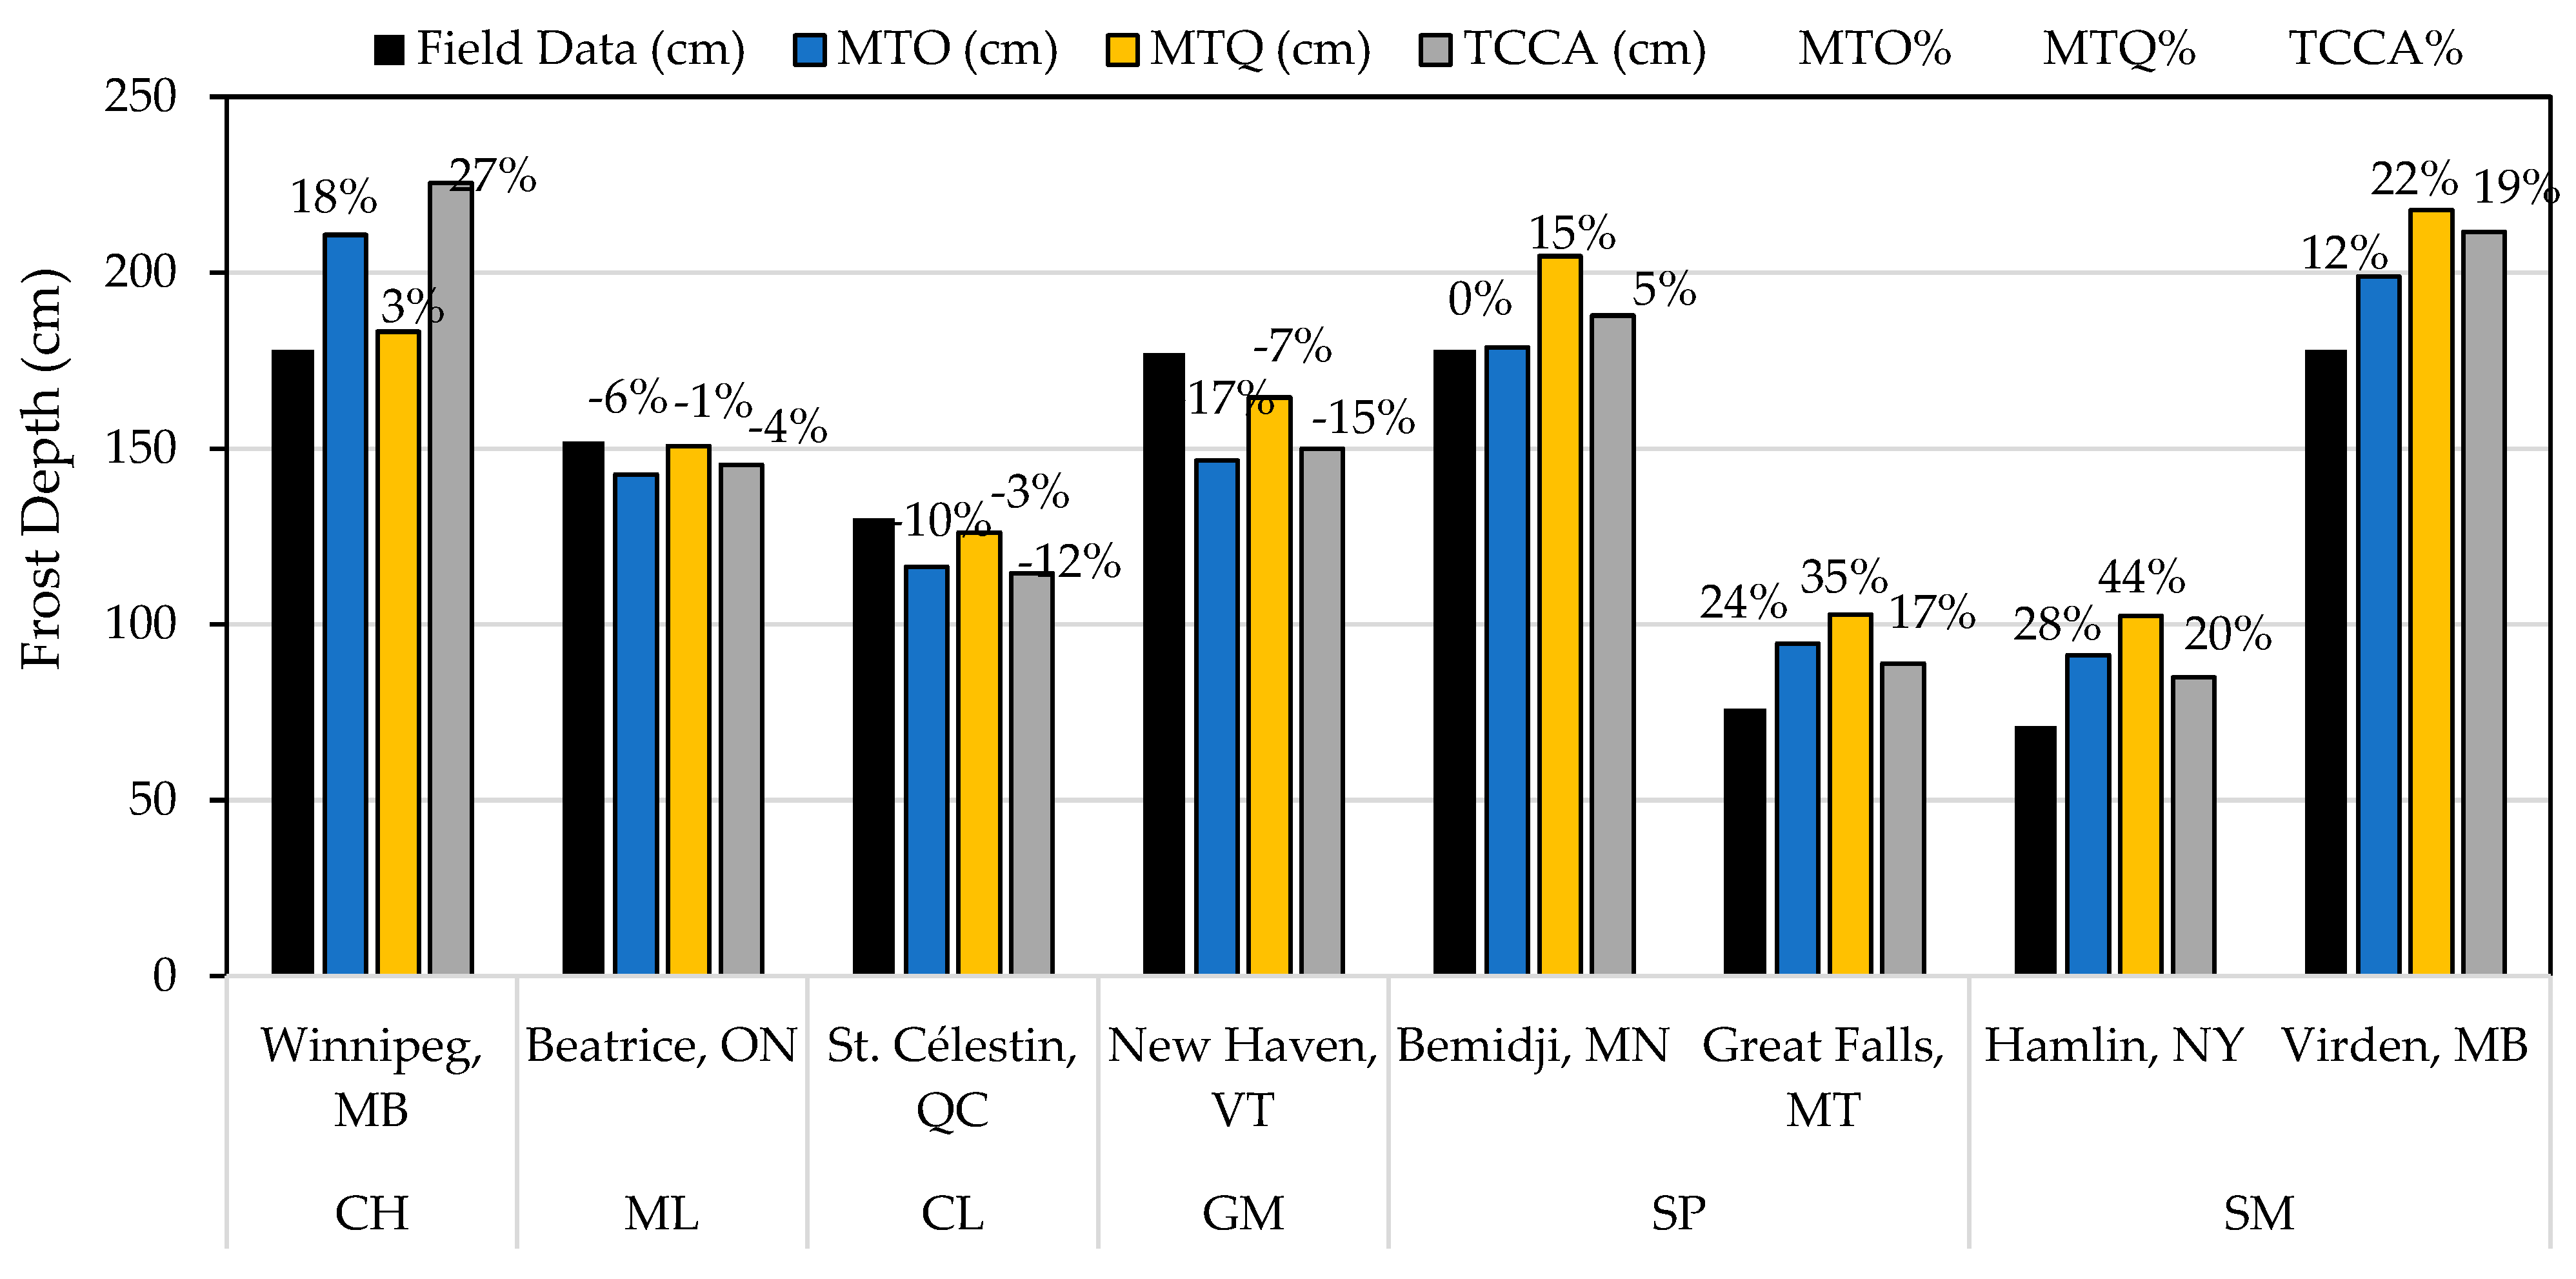
4.1. Analysis I: Comparison of Different Methods

All the locations shown in Table 2 are asphalt concrete-surfaced pavements, and the n-factor was assumed to be 0.9 for all pavements. The frost penetration varies from 71 to 178 cm, Hamlin having the smallest, while Winnipeg had the highest frost penetration depth. Hamlin also showed the smallest Freezing Index among all the cities, while the highest FI was attributed to Viscount. As discussed earlier, the maximum penetration depth data were collected from the LTPP database, while the AMT and FI raw data were obtained through Environment Canada. As a result, it was challenging to find years in which complete yearly records could be retrieved on both platforms, in order to match and use them for research purposes. The years presented in Table 2 are, therefore, the ones that could yield the most complete data in both databases. The availability of satisfactory relevant data, therefore, should be mentioned as one of the existing hurdles to performing more comprehensive analysis in this area of research. Table 3 presents the pavement structures for each site, subgrade soil description, and soil classification, according to the Unified Soil Classification System (USCS).
The complete dataset used for frost depth calculation for St. Célestin site can be found in Boutonnet and St-Laurent, 2003 [15], and hence is not repeated in the current paper. Figure 4 compares the frost depths obtained from field data with those predicted using the MTO, MTQ, and TCCA methods. The subgrade soil classification is indicated under each city’s name in this bar chart. The difference between the predicted frost depths from each method and those measured from the field data is shown above each bar in percentage, indicating the accuracy of these models in predicting the frost depth for different regions and soil types.
Looking at the fine-grained soils, the results indicate that the MTO method overestimated the frost depth penetration by 18% for the fat clay (CH) soil type, while it resulted in about 6% and 10% underestimation in the sandy silt (ML) and silty clay (CL) cases, respectively. This method also underestimated frost depth by 17% in the case of poorly graded gravel (GM), and overestimated by 28%, 12%, and 37% in the cases of silty sands (SP and SM) in different regions, respectively. For the poorly graded sandy soil type, the MTO method overestimated frost depth prediction by 24% in the Great Falls site but could almost perfectly predict the value for the case of Bemidji in Minnesota.
Comparing the results obtained from the TCCA and MTO methods, it can be concluded that, regardless of soil type, these two methods consistently provided either an overestimation or underestimation of the frost penetration depth, which can be considered relatively similar to each other. More specifically, the TCAA method overestimated the frost depth penetration by 27% for CL soil and underestimated it by 4% and 12% in ML and CL soils, respectively. In the case of the poorly graded sands available in the Bemidji and Great Falls sites, TCCA overestimated frost depth by 5% and 17%, respectively, while for the poorly graded gravel in the New Haven site, it underestimated this value by 15%. Furthermore, the TCCA results exhibited overestimation in predicting frost depth in the range of 19% to 48% in the cases of the silty sands in Hamlin and Virden, respectively. Although both underestimation and overestimation of frost penetration depths can affect pavement design to some extent, an underestimation can be especially critical in the case of frost-susceptible soil types that are prone to the frost action and can lead to premature pavement failures.
Finally, the MTQ method showed either close-to-field data or more conservative protection depths, in most cases. The only case among those evaluated where the method underestimated frost depth was GM soil from New Haven, Vermont (−7%). The MTQ method showed the best results within clays, silt, and gravel, with a difference of 3%, −1%, and −3% in cases of fat clay, sandy silt, and silty clay soil types, respectively, which can all be considered relatively very close to the actual measured depths in the field. In terms of the difference in magnitude between the predicted and measured field frost depths, the worst-case scenarios were regarding the sites with silty sands and poorly graded sands, with values being overestimated in the range of 15% to 44% higher than the field measured data. While this is still on the safe side for the purpose of frost protection, such overestimation can lead to overdesigned sections and consequently result in an unnecessary increase in pavement construction costs. Nevertheless, the results indicate that the MTQ method provides better estimation of the required frost protection for the case studies investigated in this research.
Table 4 provides a general comparison between the accuracy of the predictions from the three methods investigated in this research, along with their maximum and minimum differences when compared with the data measured from the field, as well as the average difference and standard deviation, considering all values as positive.
From Table 4, it is evident that all methods provided more accurate results when predicting the frost depth of the fine soils. Under the fine soil scenario, the MTQ method had the smallest average difference (2%), and a small standard deviation (1%). On the other hand, for the coarse-grained soil scenario, the MTO method led to the smallest average difference among the methods (20%); however, the TCCA method was not far behind (21%). Regardless of the magnitude differences, the MTQ method provided the most prudent results in terms of rarely underpredicting the frost depth in all evaluated scenarios.

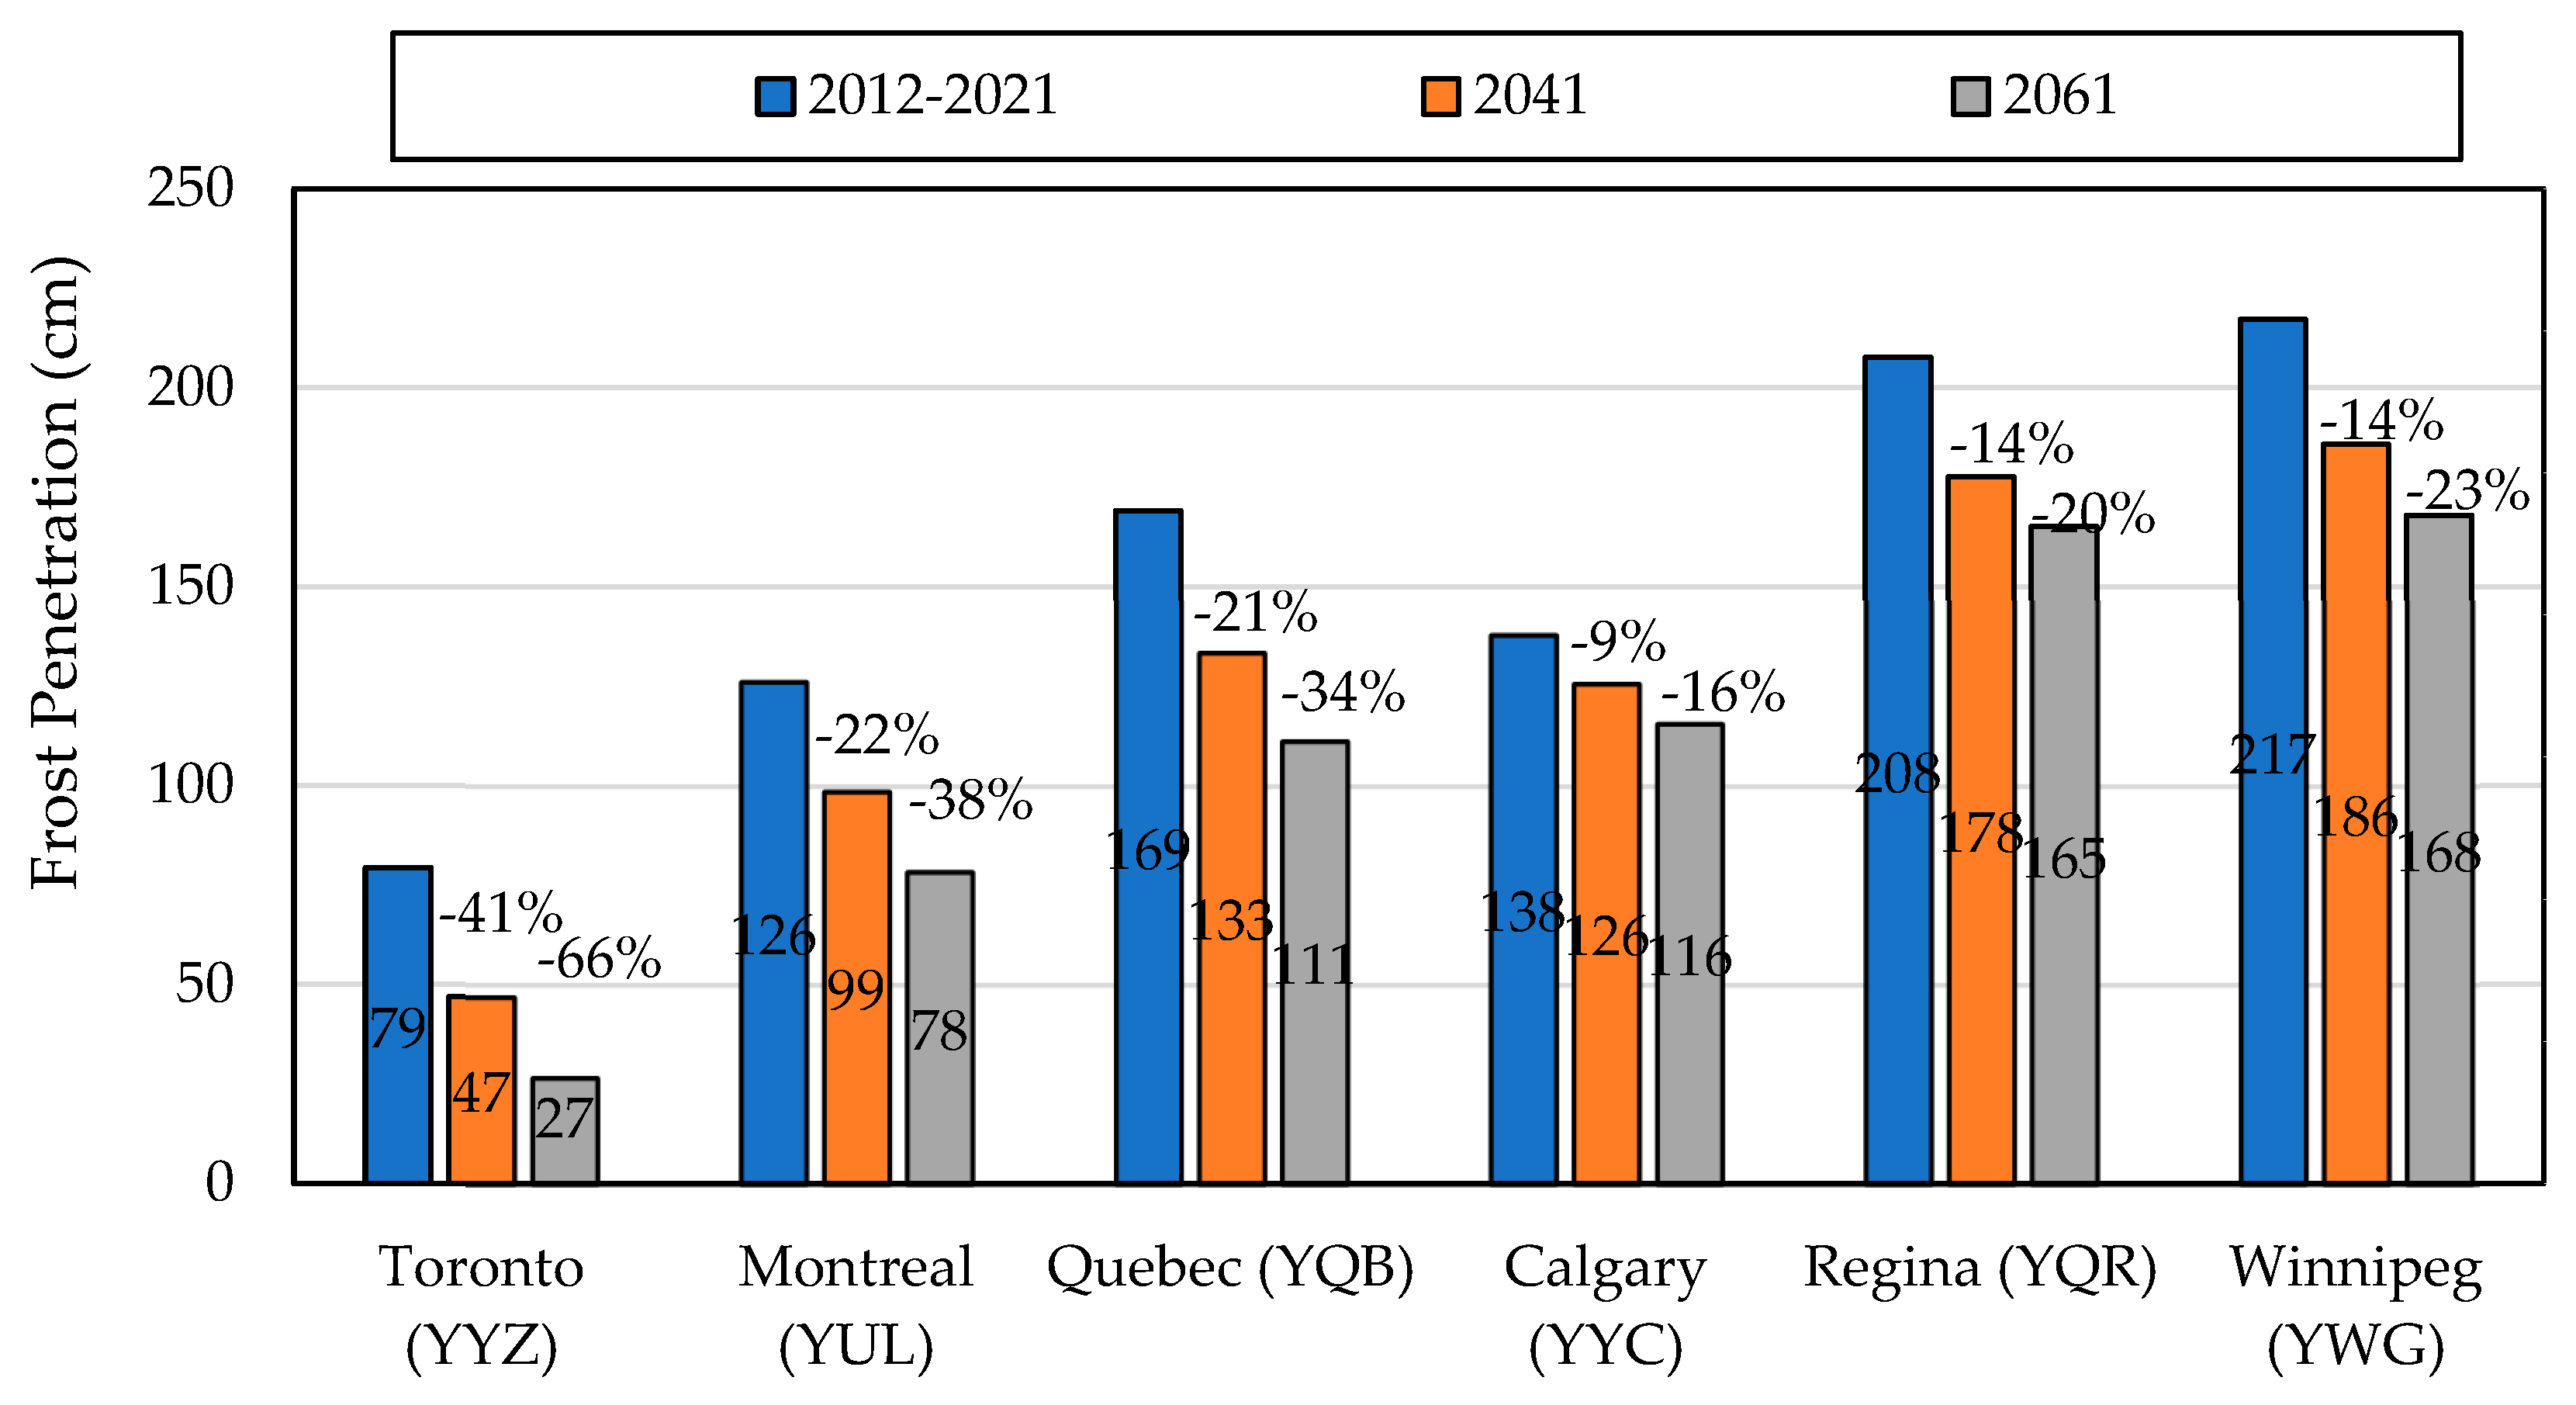
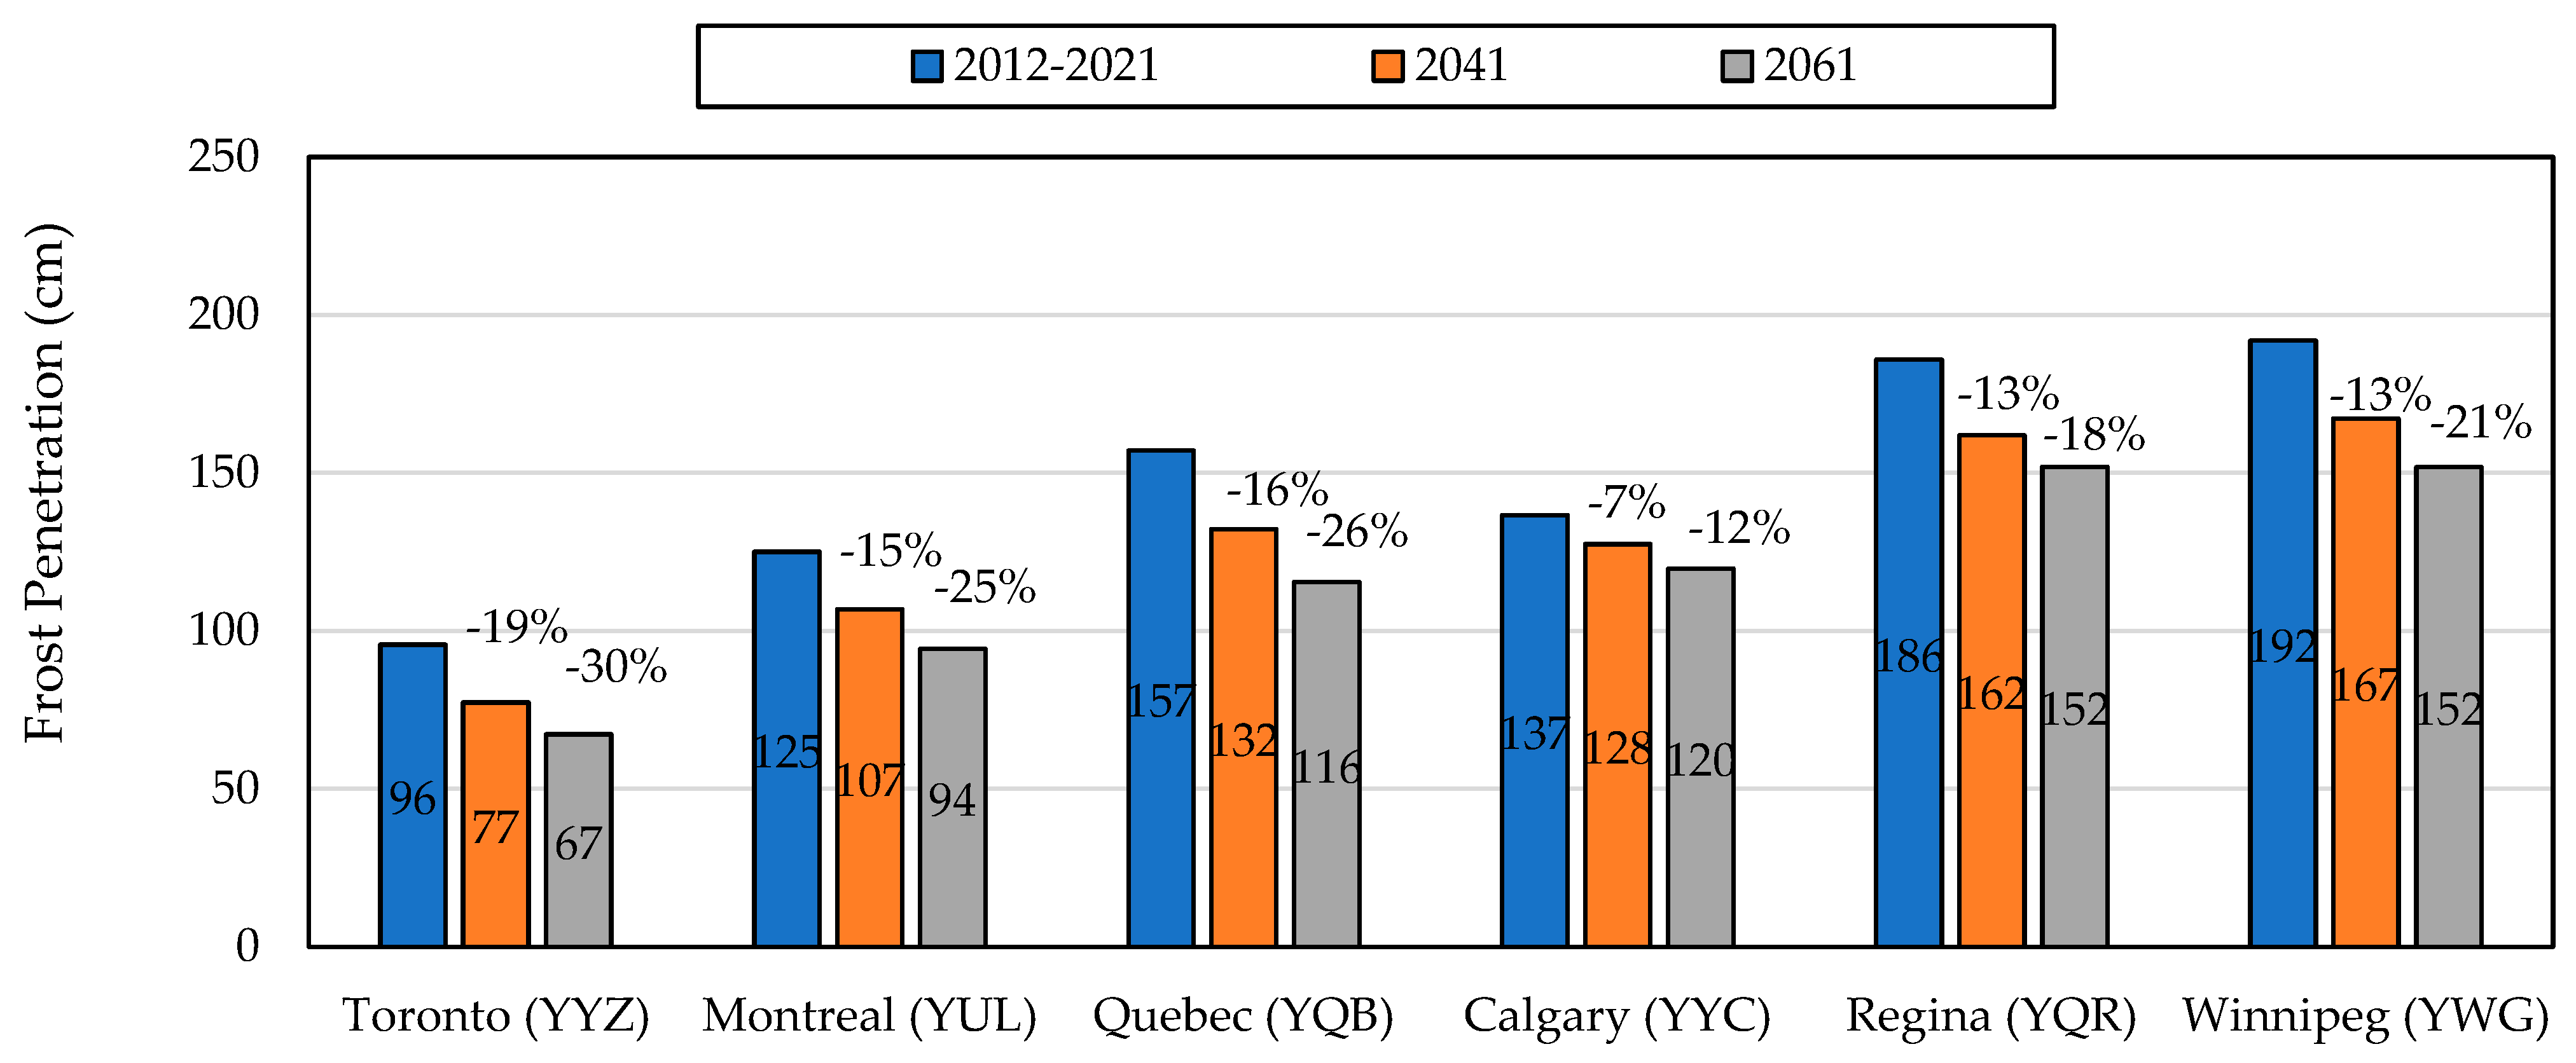
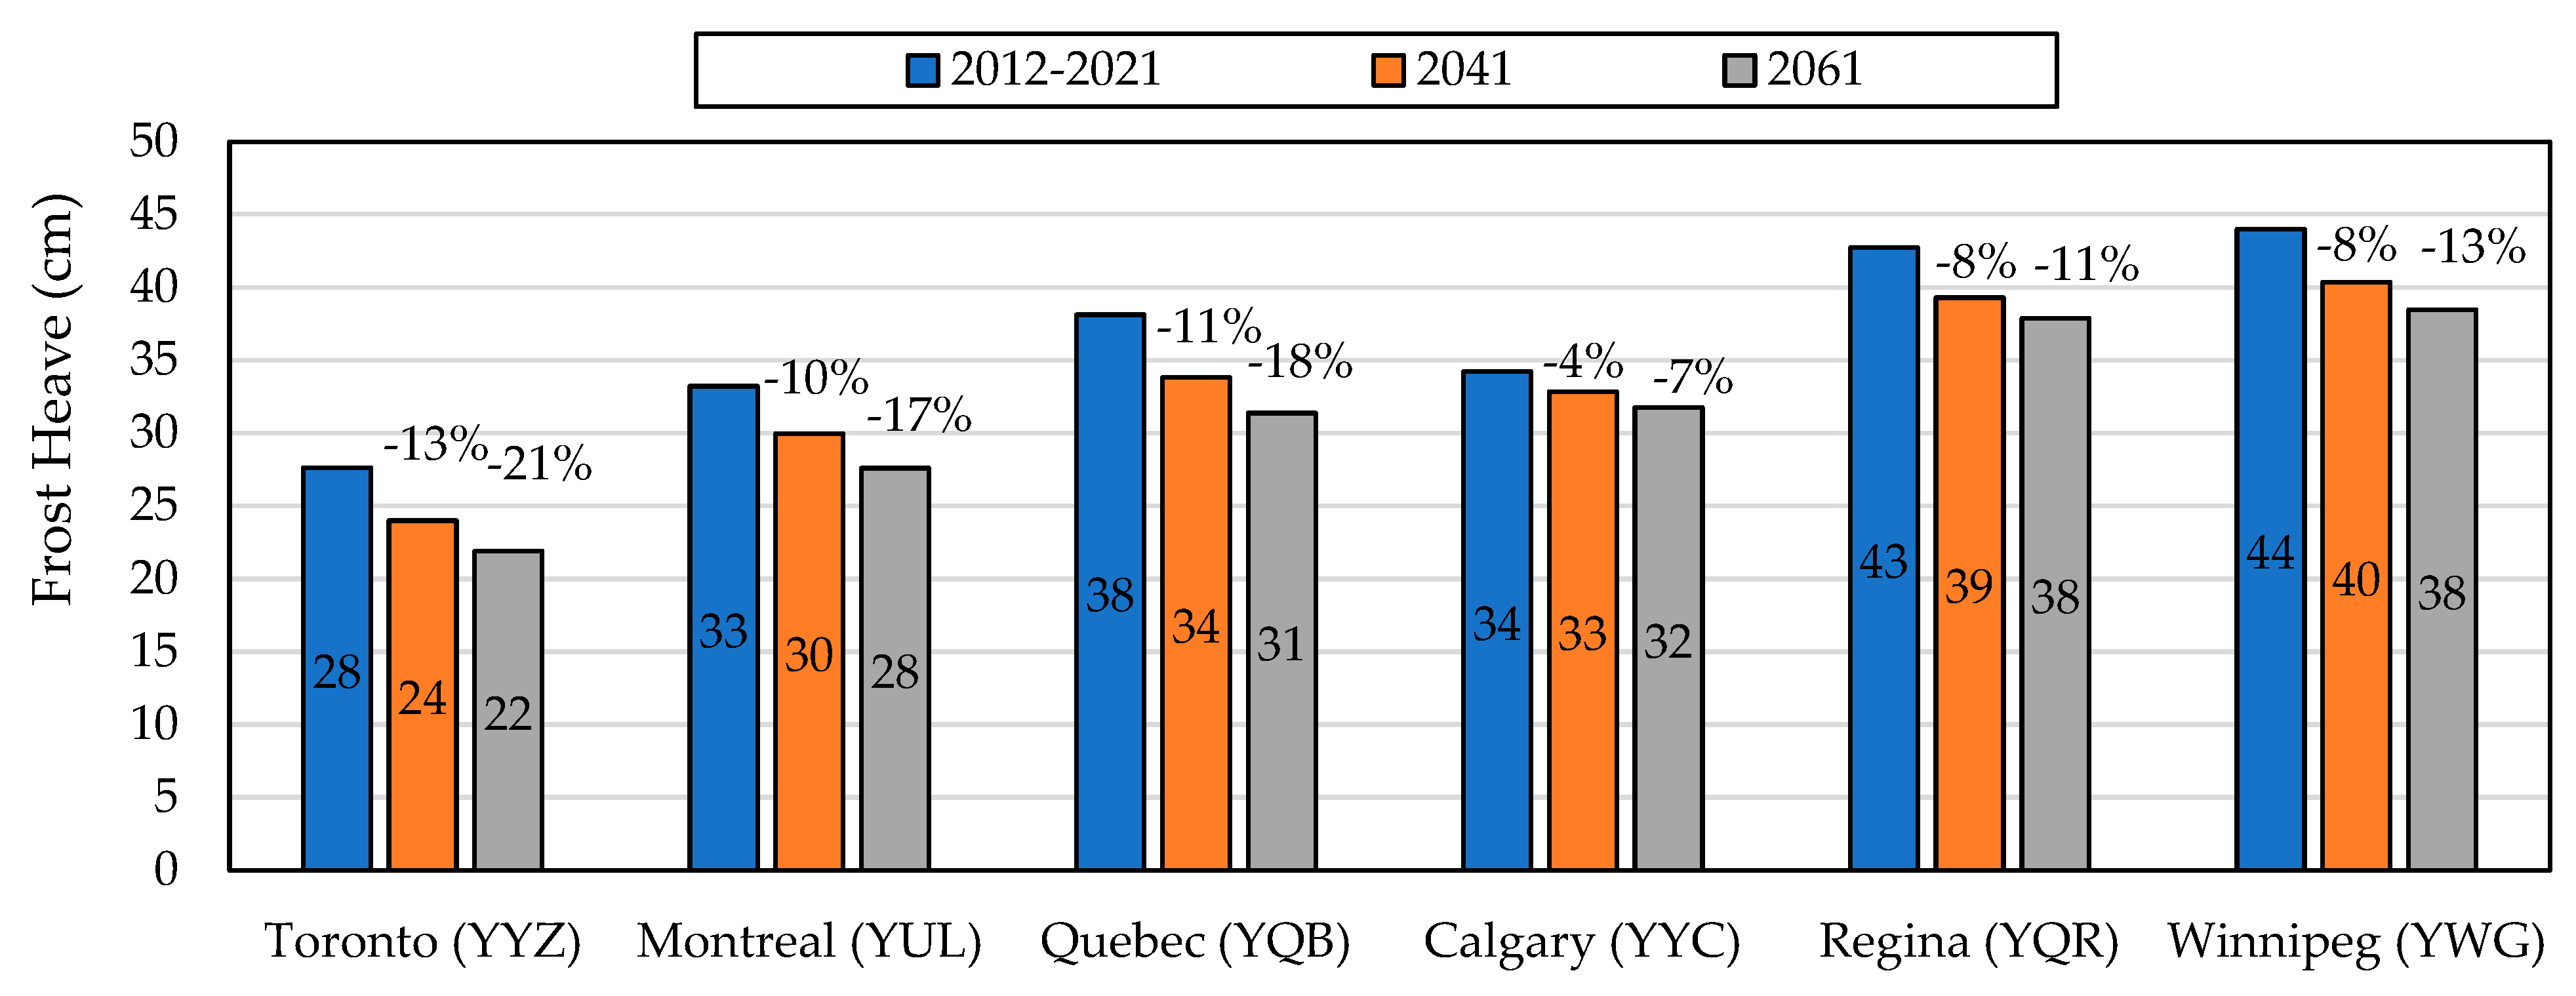
4.2. Climate Change Scenarios (Analysis II)

In order to consider the implications of climate change scenarios on airport runway pavement design, Analysis II focused on 20- and 40-year time horizons. To this end, the required parameters included the average annual air temperature (aka Annual Mean Temperature or AMT), the air Freezing Index (FI) and Thawing Index (TI), soil geotechnical inputs, soil thermal conductivity inputs, and the air–surface transfer coefficient. These parameters were gathered for the sites of interest as summarized by Table 5 and Table 6.
Historical values of the annual mean temperature and air freezing/thawing indexes were calculated from data available at the Government of Canada website, considering the years from 2012 to 2021 (10-year average) [16]. The climate predictions for the years 2041 and 2061 were obtained through the Climate Atlas of Canada website [18]. The primary source of Climate Atlas of Canada models is the Pacific Climate Impacts Consortium (PCIC), which has projections of daily temperature data from an ensemble of 24 climate models using two carbon emission scenarios, a “Low Carbon” (i.e., RCP 4.5) and a “High Carbon” (i.e., RCP 8.5) future scenario. This research considered the ensemble mean of emission scenario RCP 8.5 to perform the climate change simulations.
There is a large amount of uncertainty in climate model projections, because the future concentration of greenhouse gases (GHG) in the atmosphere is not fully known or predictable in a deterministic manner. For this reason, Canada’s Changing Climate Report requires that no likelihoods should be ascribed to the RCP scenarios, as they are all deemed plausible [1]. The historical and predicted temperature records and freezing indices are presented in Table 5.
It is noticeable that northern cities, such as Yellowknife, Iqaluit (YFB), Baker Lake (YBK), and Cambridge Bay, have higher predicted temperature changes, Cambridge Bay presenting the worst-case scenario, with a temperature increase of 5 °C by 2061. To evaluate frost penetration using MTQ methodology, the soil classification and properties need to be known. Therefore, two soils, a clay (CL) and a clayey silt (ML, ML-CL), were chosen to represent the dominant soil types in those regions. Table 6 presents the parameters defined for the clay and clayey silt soils.

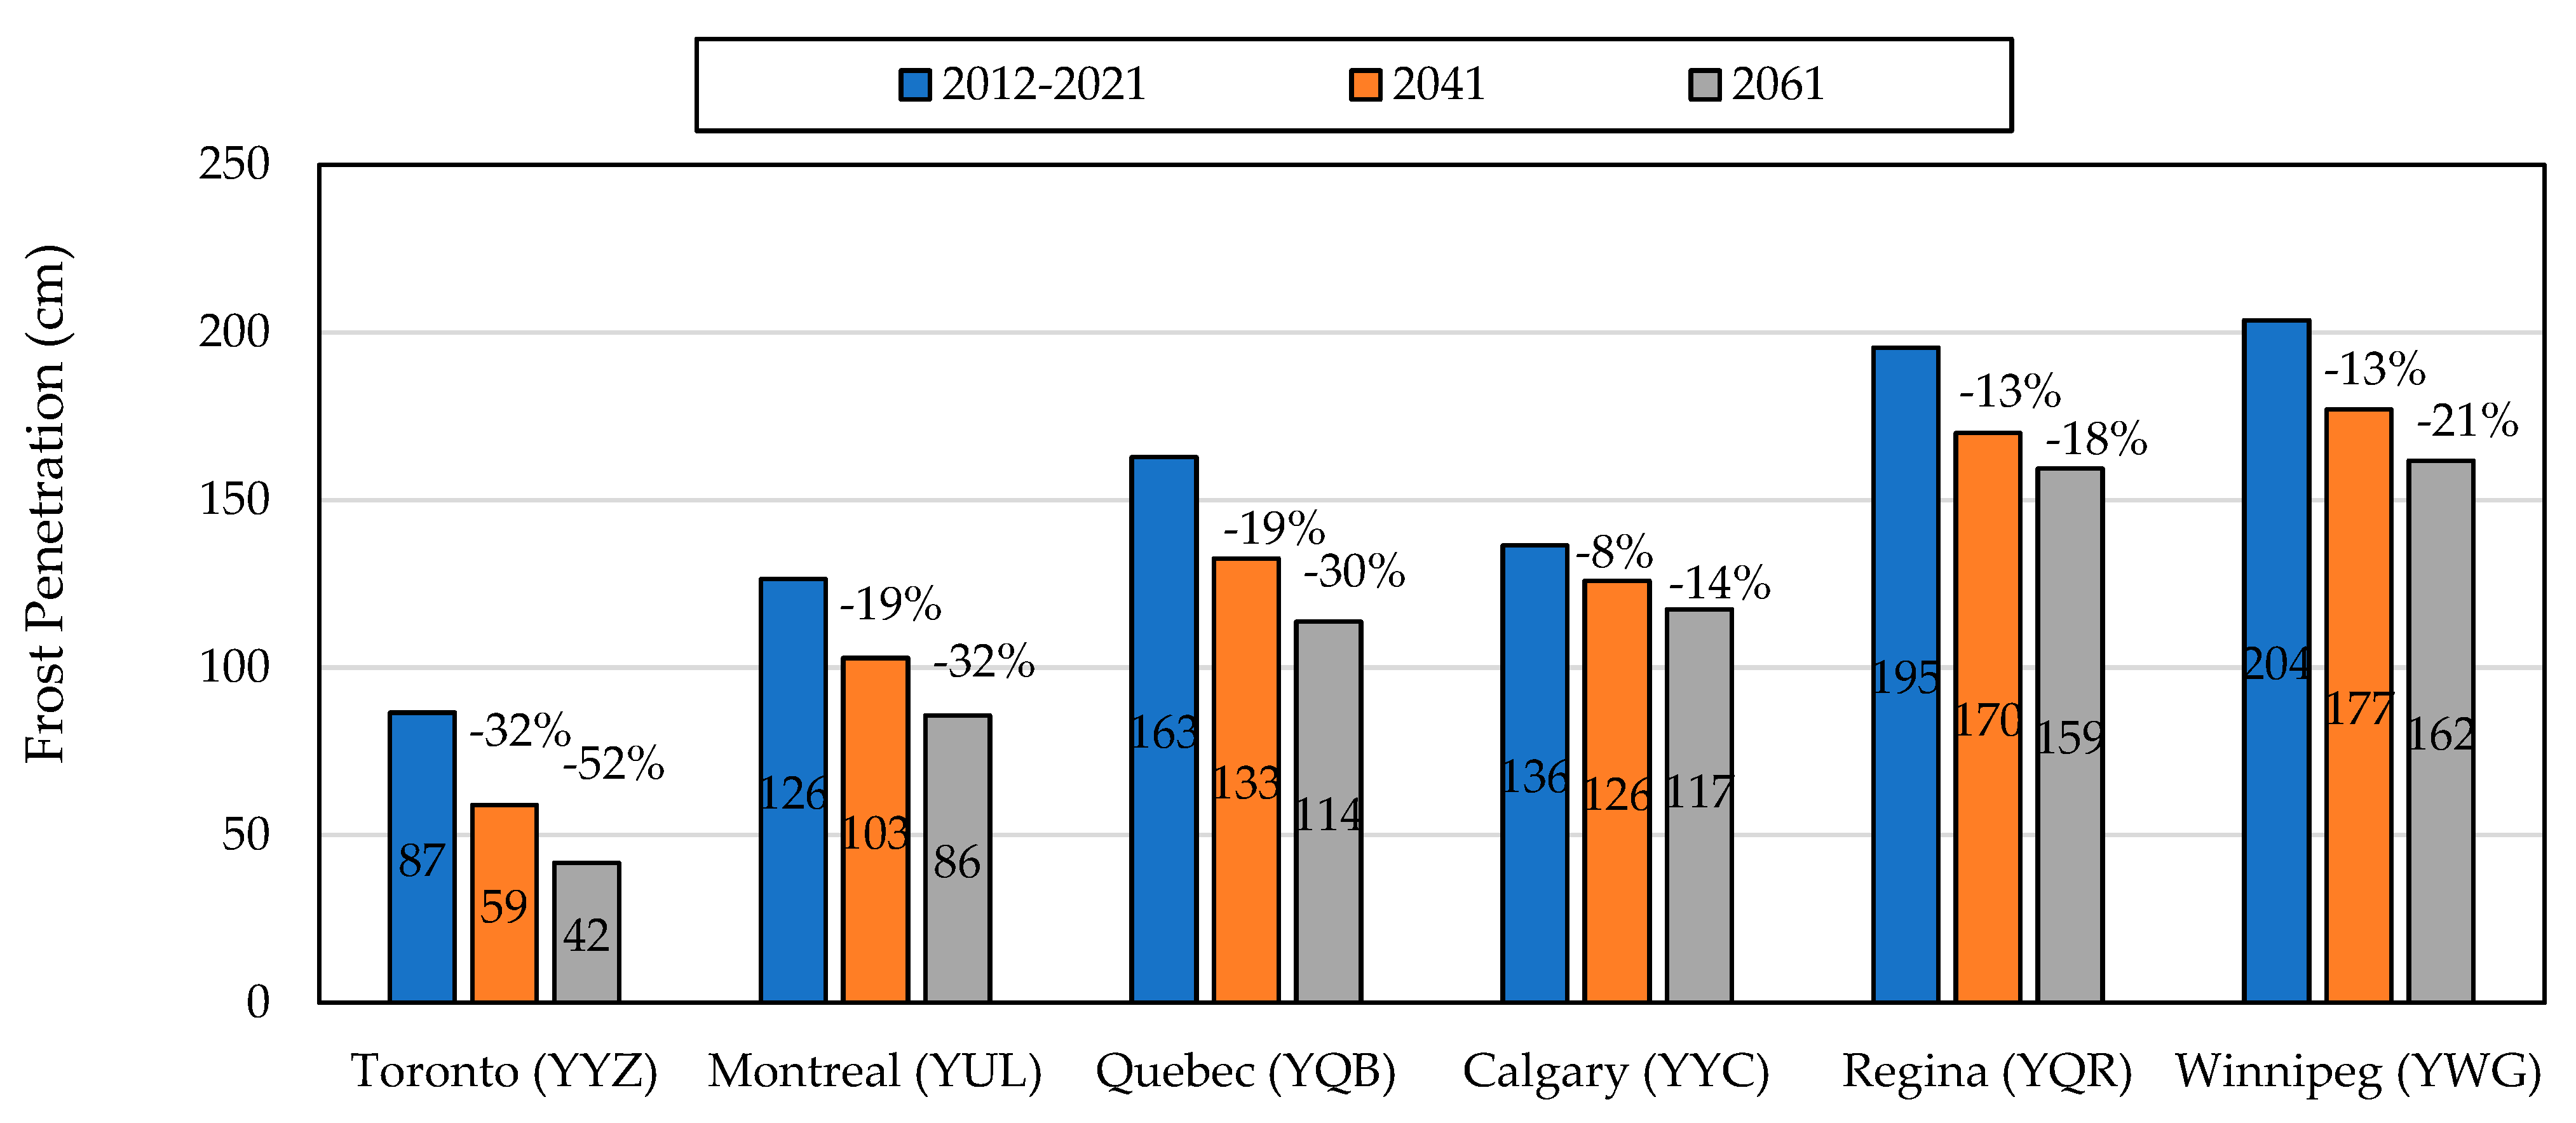
4.2.1. TCCA and MTO Methods
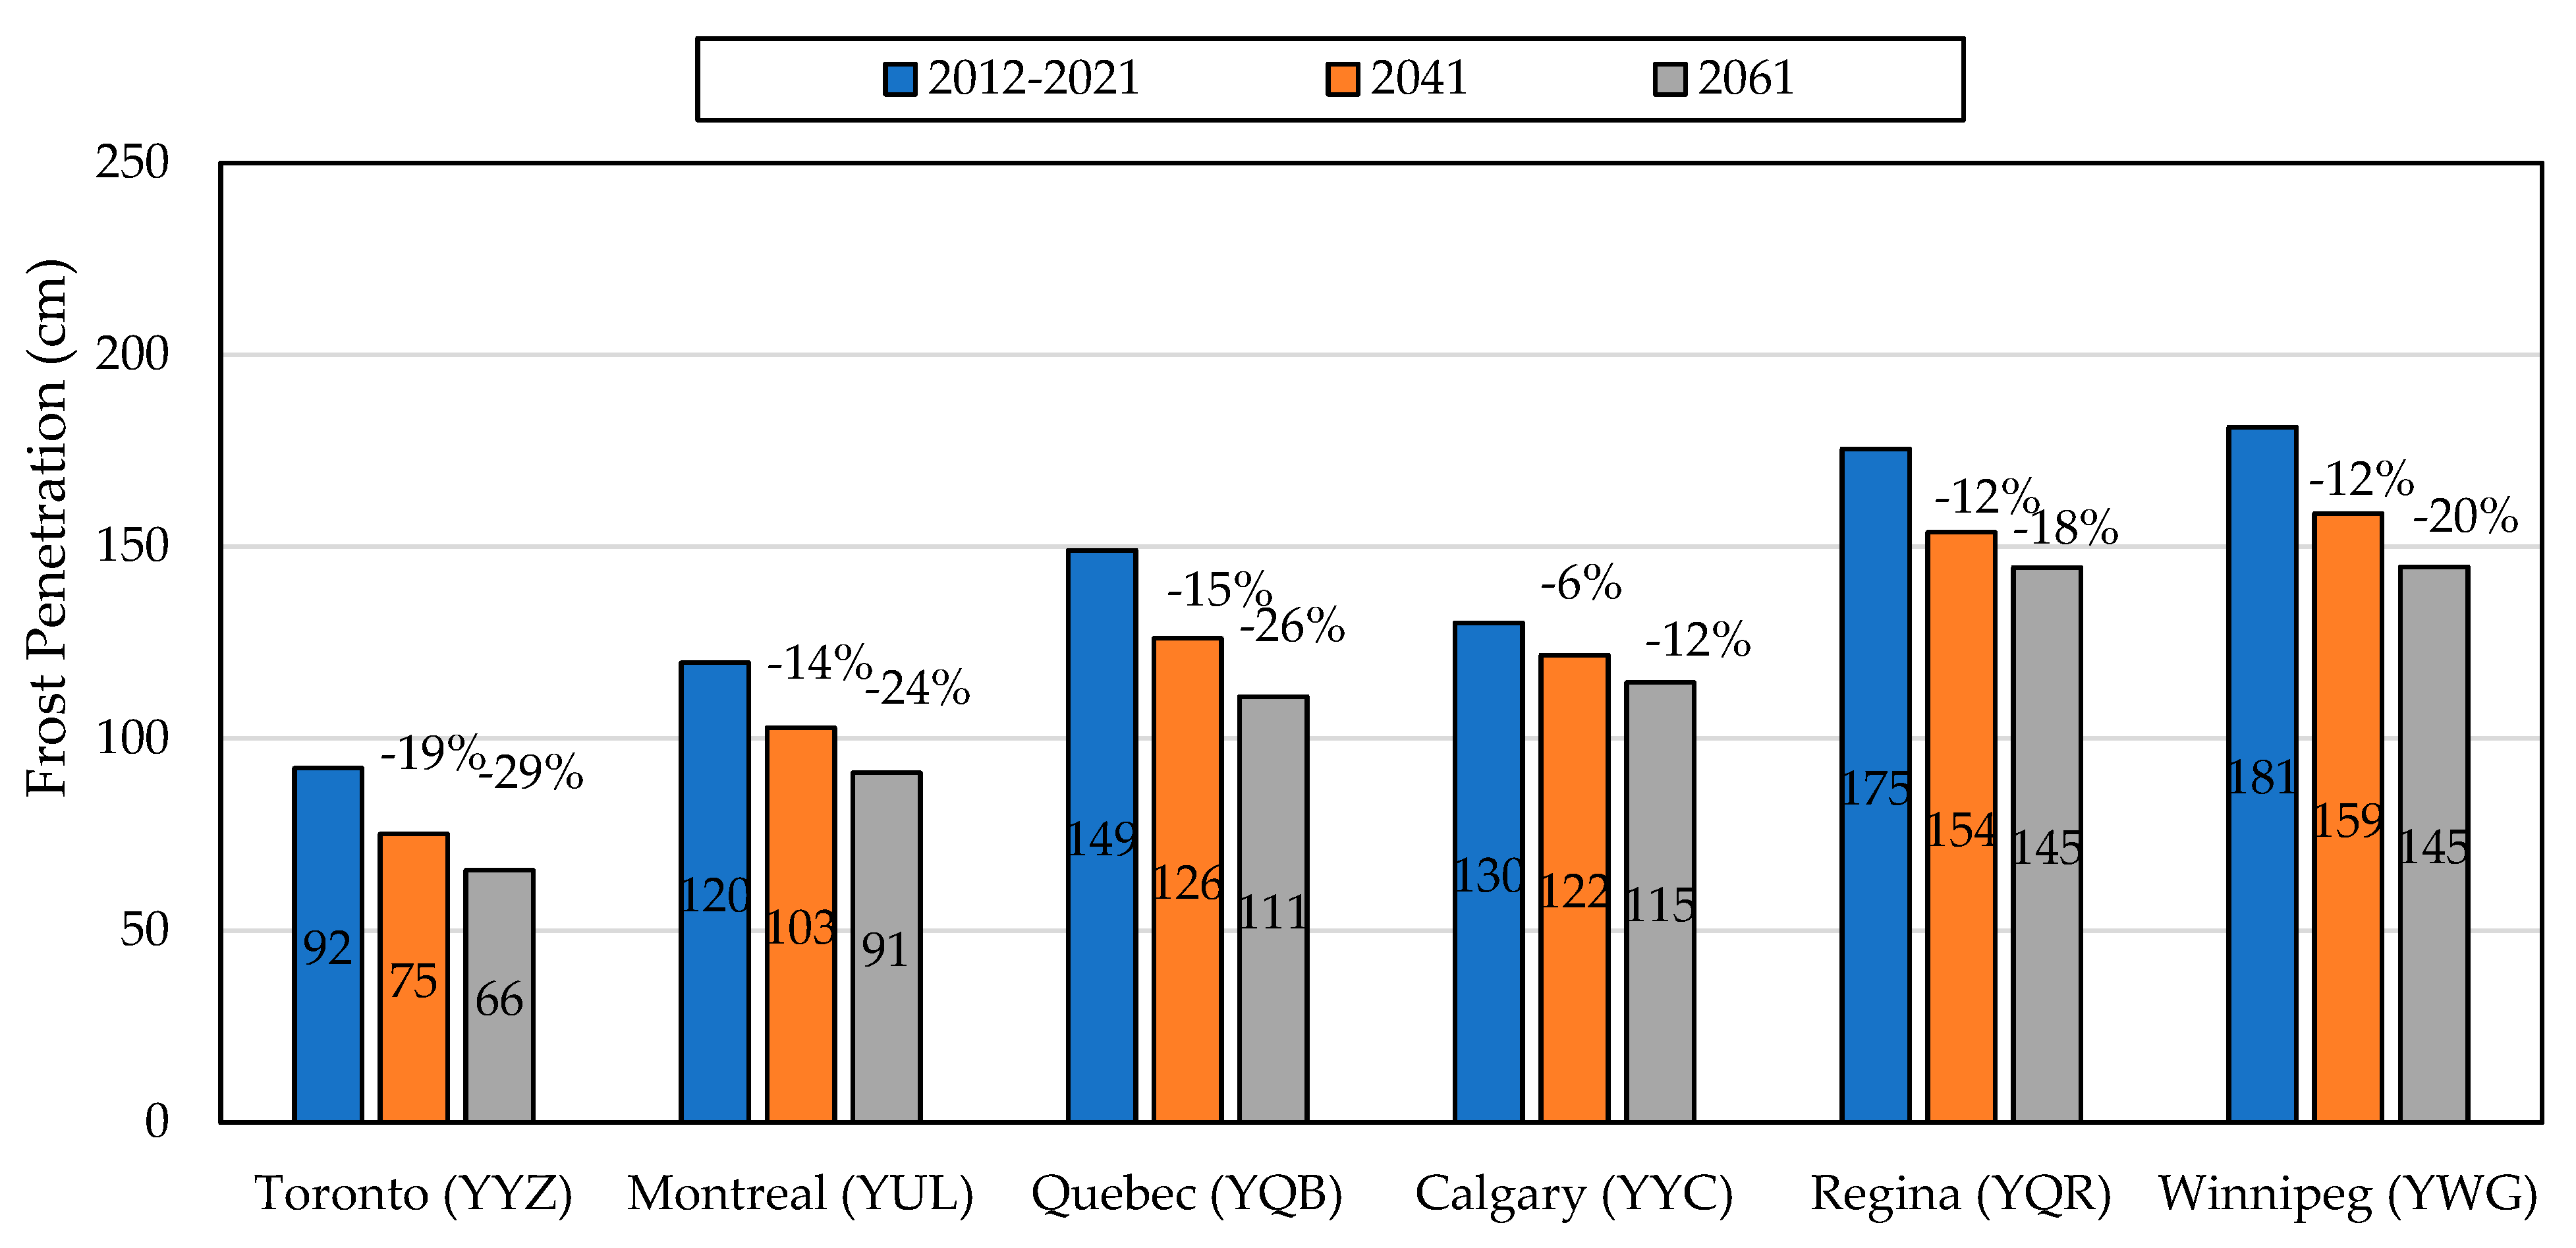
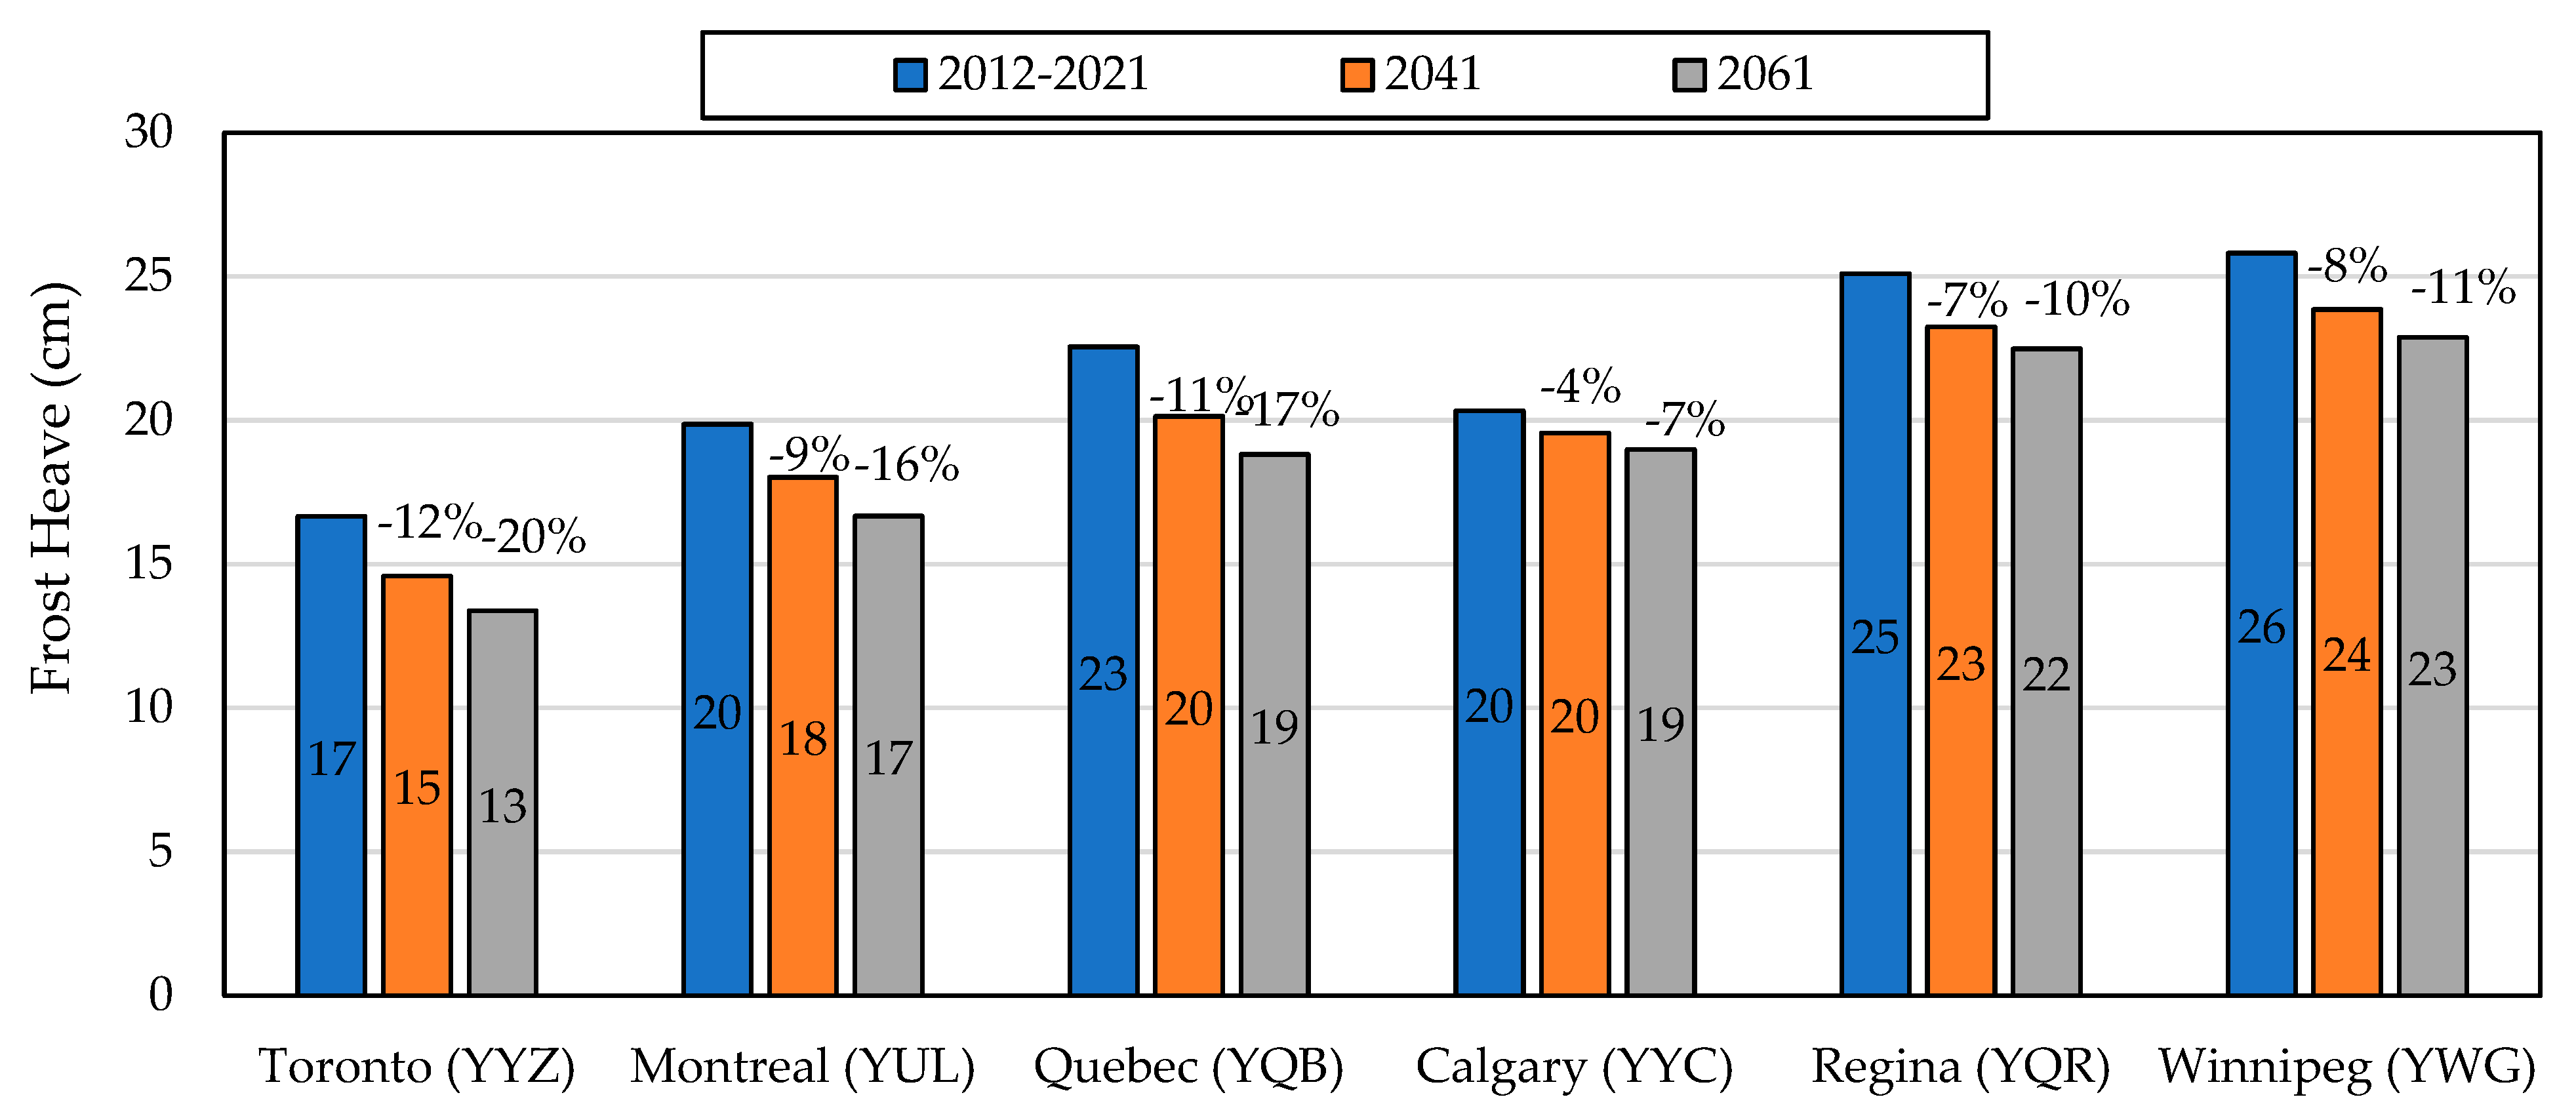
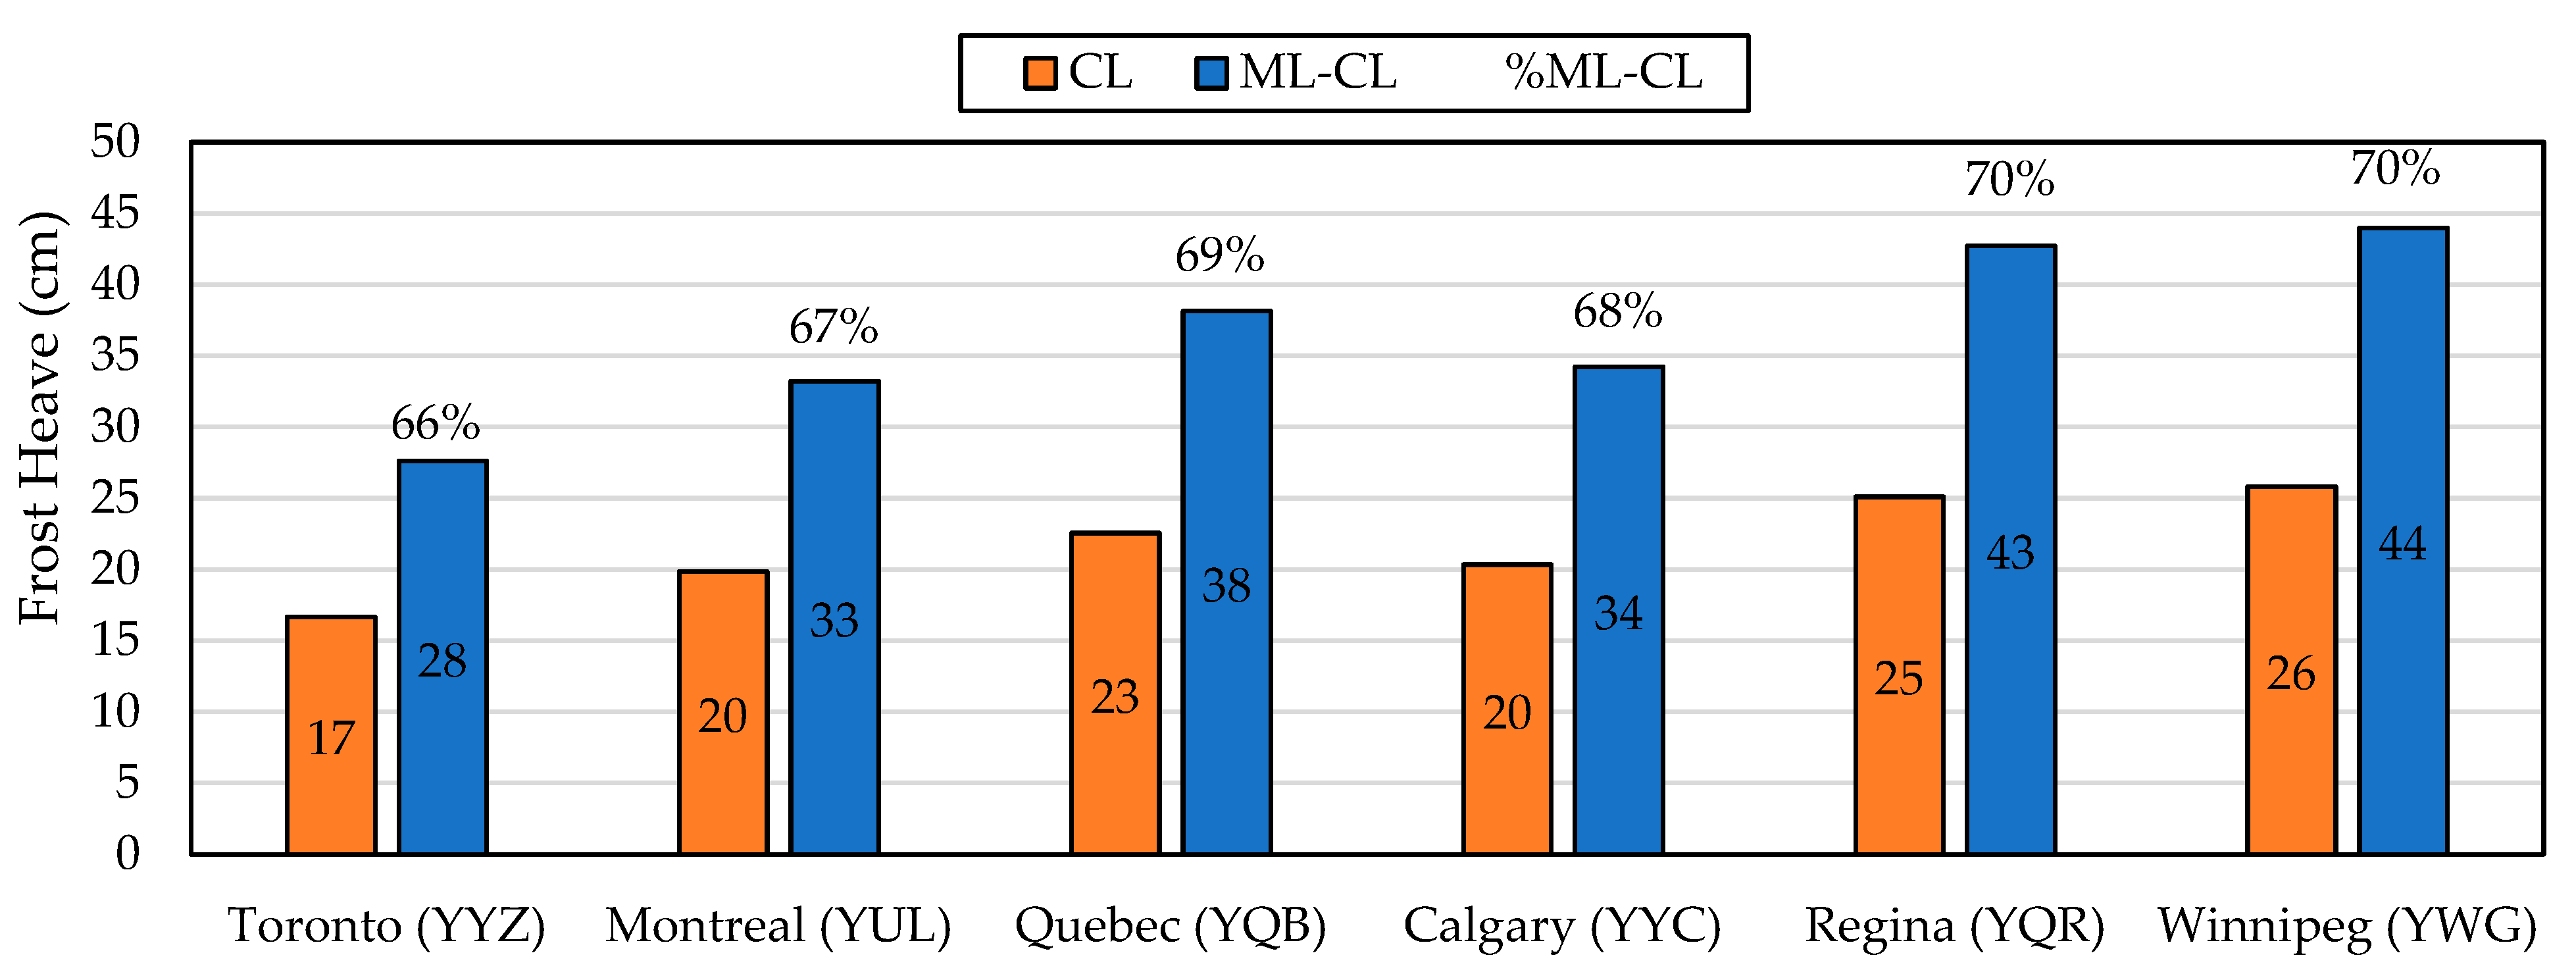
The TCCA manual requires the frost penetration of asphalt-surfaced pavements to be calculated using Equation (1), while the penetration of thaw in permafrost areas should be calculated using Equation (4). A summary of the results of frost depth and thaw penetration predictions using the TCCA model for different Canadian regions in this study can be seen in Figure 5 and Figure 6 for the areas not underlain by permafrost and underlain by permafrost, respectively.
It can be realized that the historical frost penetration depths range from 79 cm to 217 cm, with Toronto having the smallest and Winnipeg exhibiting the deepest frost penetration. In addition to the depth of frost penetration, it is important to evaluate the potential changes in future frost depth penetration over these regions. Therefore, the results from Analysis I indicate that the maximum percentage of expected variation in the climate change scenarios would happen in Toronto (i.e., −41% and −66%), while it is predicted that Calgary would experience the lowest level of changes (i.e., −9% and −16%) over the time horizons of 2041 and 2061, respectively.
Furthermore, the results of historical thaw penetration for the analysed cities were found to range from 164 cm to 328 cm, with Iqaluit having the smallest and Yellowknife experiencing the deepest thaw penetration. Therefore, the results of the climate change scenarios indicate that all the investigated cities would undergo an increase in thawing penetration, where Iqaluit is predicted to be affected the most, with 35% and 64% increases in the thawing depth at the time horizons 2041 and 2061, respectively. For the areas underlain by permafrost, such an increase translates to a thicker active layer, which can strongly affect the load-bearing capacity of the infrastructure (to be) built in those areas.
It is important to note that, among the airports underlain by permafrost, Cambridge Bay and Baker Lake Airports consist of gravel runways, while Iqaluit and Yellowknife airports have asphalt-surfaced runways. The TCCA equation for thawing depth was derived from experiments in gravel runways. While TCCA does not specify the application of its model to a certain type of pavement, the analysis of Iqaluit and Yellowknife can be affected by generalization of a method applicability that was developed based on the gravel surface data.
On the other hand, the MTO methodology can also be used to predict frost and thaw penetration depths in the regions investigated in this study. In terms of frost penetration, the results are presented in Figure 7 using the MTO methodology, where it can be recognized that historical frost penetration for the analysed cities ranged from 87 cm to 204 cm, with Toronto having the smallest, and Winnipeg the highest, frost penetration depth. This is similar to the predictions obtained through the TCCA method. Figure 7 indicates that Calgary exhibited the smallest decrease in frost penetration depth under both climate change scenarios, with a projected reduction of 8% and 14%, while Toronto had the largest projected frost penetration reduction (a reduction of 32% and 52% by 2041 and 2061, respectively).

4.2.2. MTQ Method

Further to the two empirical methods discussed so far, the more mechanistic-based method utilized by MTQ was used to evaluate the climate change scenarios at the two time horizons of 2041 and 2061 for different soil types and locations. The results of the frost penetration depth and frost heave for clayey soil were calculated using the i3Cme tool, and are presented in Figure 8 and Figure 9, respectively.
Figure 8 shows that the historical frost penetration depth calculated through the MTQ method ranges from 92 cm to 181 cm. The rankings of the regions regarding the shallowest (Toronto) and deepest (Winnipeg) frost penetration remains consistent with the MTO and TCCA methods when analysing the results using MTQ, while the magnitude of the predicted frost penetration depths varies from one method to another. Similarly, Calgary was found to have the smallest percentage of decrease in frost penetration depth in both climate change scenarios (−6% and −12%, respectively), while Toronto had the greatest (−19% and −29%, respectively). On the other hand, in terms of frost heave predictions, the historical values calculated for the selected locations in this study range from 17 to 26 cm, as shown in Figure 9. Similar to frost penetration depth calculations, Toronto showed the smallest and Winnipeg showed the largest frost heave values. Furthermore, the climate change scenarios suggest that Calgary may experience the smallest percent decrease in frost heave (−4% and −7%, respectively), while Toronto may undergo the highest rate of changes (−12% and −20%, respectively). The results of frost penetration depth and frost heave for the clayey silt (ML, ML-CL) soils are presented in Figure 10 and Figure 11, respectively.
Once again, Calgary had the smallest percent decrease in frost penetration depth in both climate change scenarios (−4% and −7%, respectively), while Toronto had the greatest (−13% and −21%, respectively). Figure 11 shows that the frost heave that was calculated based on historical data ranged from 28 to 44 cm. The climate change scenarios show that pavement design implications are not consistently negative throughout all regions. To this end, while there might be slight differences for Calgary, which had the smallest percentage of decrease in frost heave (−4% and −7%, respectively), the change may alleviate some frost heave-related issues in the case of Toronto, which had the largest reduction in heave values (−13% and −21%, respectively). Nevertheless, this observation is focused only on the low temperature extreme of pavement performance, while climate change scenarios may have pronounced adverse impacts with respect to high-temperature behaviour, which needs to be further studies and is out of the scope of the current research. Figure 12 compares the frost heave calculations for the clay and clayey silt soils in the historical scenario.
When comparing the frost heave of the clay to the clayey silt soil, it is possible to note a great difference. The frost heave calculated for the clayey silt was on average 69% higher than what was calculated for the CL soil. This can be attributed to the fact that silty soils are considerably more susceptible to frost heave than clays, in general.

5. Discussion

It can be recognized by comparing the different frost depth calculation methods in this study that all of them yield better accuracy when predicting frost depth in fine soil types such as clays and silts. Under the fine-soil scenario, the MTQ method matched the field data the best; however, it resulted in a considerable overestimation of the frost penetration for the case of the coarse-soil scenarios. This can be attributed to the fact that the method’s accuracy strongly depends on material properties as model inputs. The segregation potential of the subgrade is crucial for determining the frost penetration depth, and the results can be highly biased if incorrect values are used. The authors of this research believe that availability of laboratory data regarding the materials could have improved the accuracy of the results for coarse materials.
Both the MTO and TCCA methods are primarily empirical approaches. Comparing the two methods, MTO performed better than the TCCA model. The results from MTO analysis had better accuracy when predicting the frost depth of fine soils. As previously explained, the equation used by MTO to estimate frost penetration depth is based on an empirical method and was established through observations made of several highways across Ontario. Consequently, this model is more representative of the frost penetration through the soils that are present in the region [19]. Nevertheless, due to the empirical nature of both the MTO and TCCA models, the methods’ applicability to various soil types may be limited since they do not account for specific soil properties. However, both are still very practical approaches for estimating frost penetration when no information is available about the soil properties.
The climate change predictions for the next 40 years, considering emission scenario RCP8.5, show an increase of up to 5 °C in the annual mean temperature and a noticeable decrease in the freezing index for the cities evaluated in this research. The results from all the methods indicate that there will be a decrease in frost penetration depth due to climate change that ranges from 12% up to 66%. Frost heave will most likely decrease in all areas not underlain by permafrost, with decline rates that range from 7% to 30%. Therefore, the increase in average planetary temperature defined by global climate change can be positive in areas not underlain by permafrost. The thaw penetration projection results show that the cities underlain by permafrost will suffer from an increase in seasonal active layer depth, since thawing depth will likely increase within a range of 41% to 57% in 2061. It should be emphasized that, although such increments might seem modest, soil temperatures in permafrost layers are already close to zero, and hence are highly vulnerable to thawing. In other words, it is important to note that temperature fluctuations around 0 °C—the typical freezing temperature for water—could increase the frequency of freeze–thaw cycles and potentially pose further issues with respect to bound pavement material durability.

6. Conclusions

The implications of the shortening of winter seasons for frost and thaw penetration depths and frost heave in Canadian airports is presented in this research. Three commonly used methodologies proposed by the Ministry of Transportation of Ontario (MTO), the Ministère des Transports du Québec’s (MTQ), and Transport Canada Civil Aviation (TCCA) were evaluated. The following conclusions can be drawn based on the results of this case study:
From comparing the frost penetration predictions with the actual field measurements, it can be concluded that both the empirical (MTO and TCCA) and mechanistic (MTQ) models performed considerably better in cases of finer grained soil types than coarse subgrade soils. The MTQ model resulted in the highest accuracy, which can attributed to its mechanistic-based approach that accounts for material properties.
The climate change simulation using RCP8.5, for horizon times 2041 and 2061, shows that the warming climate impacts on areas underlain by permafrost should be considered differently than those not underlain by permafrost, since changes to the active layer thickness becomes the main concern, due to the projected thaw penetration, in the former case.
Both the MTO and TCCA methods provide consistent trends of frost penetration prediction for the airport sites investigated in this study when compared with the measured field data. However, due to climate change impacts and the empirical nature of these methods, moving towards more mechanistic approaches that can account for actual soil properties would be a necessity to avoid overdesigning pavements in non-permafrost areas, or under-designing in the case of airports underlain by permafrost.
It is suggested that future research on this matter broaden the number of sites evaluated to include more divers soil types and climate regimes outside North America, as well as simulate more climate change scenarios. The results of this study also indicate the need for including more specific soil properties, and ideally the utilization of measured values to enhance the reliability of climate change impact projections through the use of mechanistic models.

Author Contributions

Conceptualization, P.S.R.B., P.T. and S.L.T.; methodology, P.S.R.B. and P.T.; software, P.S.R.B.; validation, P.T. and P.S.R.B.; formal analysis, P.S.R.B.; investigation, P.S.R.B. and P.T.; data curation, P.S.R.B. and P.T.; writing—original draft preparation, P.S.R.B.; writing—review and editing, P.S.R.B., P.T. and S.L.T.; visualization, P.S.R.B. and P.T.; supervision, P.T and S.L.T. All authors have read and agreed to the published version of the manuscript.

Funding

This research received no external funding.

Institutional Review Board Statement

Not applicable.

Informed Consent Statement

Not applicable.

Data Availability Statement

The data presented in this study are available on request from the corresponding author.

Conflicts of Interest

The authors declare no conflict of interest.

References

  1. Environment and Climate Change Canada. Canada’s Changing Climate Report; Environment and Climate Change Canada: Gatineau, QC, Canada, 2019. [Google Scholar]
  2. Daniel, J.S.; Jacobs, J.M.; Miller, H.; Stoner, A.; Crowley, J.; Khalkhali, M.; Thomas, A. Climate change: Potential impacts on frost–thaw conditions and seasonal load restriction timing for low-volume roadways. Road Mater. Pavement Des. 2018, 19, 1126–1146. [Google Scholar] [CrossRef]
  3. TCCA. Manual of Pavement Structural Design ASG-19; Transport Canada Civil Aviation: Ottawa, ON, Canada, 1992. [Google Scholar]
  4. Argue, G.H.; Denyes, B.B. Estimating the depth of pavement frost and thaw penetrations. Transp. Res. Rec. 1974, 2, 21–25. [Google Scholar]
  5. TCCA. Pavement Structural Design Training Manual, ATR-021, AK-77-68-300; Public Works & Government Services Canada: Victoria, BC, Canada, 1995. [Google Scholar]
  6. Chamberlain, E.J. Frost Susceptibility of Soil, Review of Index Tests; Cold Regions Research and Engineering Lab: Hanover, NH, USA, 1981. [Google Scholar]
  7. St-Laurent, D. Routine mechanistic pavement design against frost heave. In Cold Regions Engineering 2012: Sustainable Infrastructure Development in a Changing Cold Environment; ASCE: Reston, VA, USA, 2012. [Google Scholar]
  8. Saarelainen, S. Modelling Frost Heaving and Frost Penetration in Soils at Some Observation Sites in Finland: The SSR Model. Ph.D. Thesis, Tampere University of Technology, Tampere, Finland, 1992. [Google Scholar]
  9. Doré, G.; Grellet, D.; Richard, C.; Bilodeau, J.P.; Pérez-González, E.L.; Barón, H.M.F. Mechanistic-Empirical Flexible Pavement Design Software: i3c-me User’s Manual; Department of Civil and Water Engineering Université Laval: Québec City, QC, Canada, 2019. [Google Scholar]
  10. Andersland, O.B.; Ladanyi, B. Frozen Ground Engineering; John Wiley & Sons: Hoboken, NJ, USA, 2003. [Google Scholar]
  11. Smith, S.L.; Burgess, M.M. Sensitivity of Permafrost to Climate Warming in Canada. 2004. Available online: https://www.osti.gov/etdeweb/biblio/20581743 (accessed on 15 November 2021).
  12. Abreu, E.A. Impacts of Climate Change on Canadian Airport Pavements. Master’s Thesis, University of Waterloo, Waterloo, ON, Canada, 2019. [Google Scholar]
  13. Özgan, E.; Serin, S. Investigation of certain engineering characteristics of asphalt concrete exposed to freeze–thaw cycles. Cold Reg. Sci. Technol. 2013, 85, 131–136. [Google Scholar] [CrossRef]
  14. Feng, D.; Yi, J.; Wang, D.; Chen, L. Impact of salt and freeze–thaw cycles on performance of asphalt mixtures in coastal frozen region of China. Cold Reg. Sci. Technol. 2010, 62, 34–41. [Google Scholar] [CrossRef]
  15. Boutonnet, M.; Savard, Y.; Lerat, P.; St-Laurent, D.; Pouliot, N. Thermal aspect of frost-thaw pavement di-mensioning: In situ measurement and numerical modeling. Transp. Res. Rec. 2003, 1821, 3–12. [Google Scholar] [CrossRef]
  16. Government of Canada. Historical Climate Data. 25 November 2021. Available online: https://climate.weather.gc.ca/ (accessed on 4 February 2022).
  17. National Solar Radiation Database (NSRDB). NSRDB Data Viewer. Available online: https://nsrdb.nrel.gov/ (accessed on 16 February 2022).
  18. Prairie Climate Centre. Climate Atlas of Canada. Available online: https://climateatlas.ca/ (accessed on 4 November 2021).
  19. Ministry of Transportation of Ontario. Pavement Design and Rehabilitation Manual; Materials Engineering and Research Office: Toronto, ON, Canada, 2013. [Google Scholar]
Figure 1. The projected maximum frost depths using actual pavement cross-sections. Adapted from [2].
Applsci 13 07801 g001
Figure 2. Determination of the freezing index for Beatrice, Ontario, over the winter of 1996/1997.
Applsci 13 07801 g002
Figure 3. Permafrost zones of the Canadian permafrost region [11].
Applsci 13 07801 g003
Figure 4. Comparison between frost depth field data and prediction methods.
Applsci 13 07801 g004
Figure 5. Frost penetration, TCCA.
Applsci 13 07801 g005
Figure 6. Thaw penetration depth, TCCA.
Applsci 13 07801 g006
Figure 7. Frost penetration depth, MTO.
Applsci 13 07801 g007
Figure 8. Frost penetration depth in clay, MTQ.
Applsci 13 07801 g008
Figure 9. Frost heave in clay, MTQ.
Applsci 13 07801 g009
Figure 10. Frost penetration depth in clayey silt, MTQ.
Applsci 13 07801 g010
Figure 11. Frost heave in clayey silt, MTQ.
Applsci 13 07801 g011
Figure 12. Frost heave predictions for clay and clayey silt soils.
Applsci 13 07801 g012
Table 1. Locations evaluated in Analyses I and II.
Analysis IAnalysis II
Canada:
  • Winnipeg, MB
  • Viscount, SK
  • Beatrice, ON
  • St. Célestin, QC
  • Virden, MB
Not underlain by permafrost
  • Toronto Airport (YYZ)
  • Montréal International Airport (YUL)
  • Québec City International Airport (YQB)
  • Calgary International Airport (YYC)
  • Regina International Airport (YQR)
  • Winnipeg International Airport (YWG)
U.S.A.
  • New Haven, VT
  • Bemidji, MN
  • Great Falls, MT
  • Hamlin, NY
Underlain by Permafrost
  • Yellowknife Airport (YZF)
  • Iqaluit International Airport (YFB)
  • Baker Lake Airport (YBK)
  • Cambridge Bay Airport (YCB)
Table 2. Summary of recorded field data for the selected sites in this study.
IDYearSoil DescriptionClosest CityFrost Depth (cm)AMT (°C)FI °C-Days
83_380293/94Fat Inorganic ClayWinnipeg, MB1782.601775
87_162296/97Sandy SiltBeatrice, ON1524.78921
-98/99Silty ClaySt. Célestin, QC1305.10666
50_100202/03Poorly Graded Gravel with Silt & SandNew Haven, VT17711.00963
27_625102/03Poorly Graded Sand with SiltBemidji, MN1784.581339
30_011403/04Poorly Graded Sand with SiltGreat Falls, MT768.25486
36_080103/04Silty SandHamlin, NY714.251170
83_180102/03Silty SandVirden, MB1789.08461
90_640595/96Fat Inorganic ClayViscount, SK1772.751607
Table 3. Pavement structures and subgrade soil classification per USCS.
Closest CityPavement Structure: Material (Thickness in cm)Soil TypeSoil Class
Winnipeg, MBAC (15.24) Concrete (24.89) Granular (12.446) Granular (14.986)Fat Inorganic Clay (CH)CH
Beatrice, ONAC (14.48) AC (11.68) Granular (17.02) Granular (66.80)Sandy Silt (ML)ML
St. Célestin, QCAC (18) Granular (30) Granular (42)Silty Clay (CL)CL
New Haven, VTAC (7.62) AC (13.97) Granular (65.53)Poorly Graded Gravel with Silt and Sand (GM)GM
Bemidji, MNAC (8.64) AC (14.73) Granular (25.91)Poorly Graded Sand with Silt (SP)SP
Great Falls, MTAC (19.05) Granular (31.50)Poorly Graded Sand with Silt (SP)
Hamlin, NYAC (3.05) AC (9.65) Granular (21.34)Silty Sand (SM)SM
Virden, MBAC (11.18) Granular (14.22) granular (33.53)Silty Sand (SM)
Viscount, SKAC (15.49) Granular (22.86) Sand Asphalt (6.35)Silty Sand (SM)
Table 4. Comparison between methods with reference to the measured field data.
Soil TypeCoarseFine
MethodMTOMTQTCCAMTOMTQTCCA
Min.0%7%5%6%1%4%
Max.28%44%20%18%3%27%
Standard Deviation10%13%5%6%1%11%
Average Difference20%28%21%12%2%14%
Table 5. Average annual air temperature and air freezing index.
AirportAMT ΨAMT 2041AMT 2061FI/*TIFI/*TI 2041FI/*TI 2061Temp. Change 2041Temp. Change
2061
Toronto (YYZ)9111242625216623
Montreal (YUL)891075855142012
Quebec (YQB)568114481864213
Calgary (YYC)56785775467512
Regina (YQR)35615601231110523
Winnipeg (YWG)35716741317113324
Yellowknife (YZF)−4−101860 *2099 *3273 *34
Iqaluit (YFB)−8−6−4666 *1015 *1355 *24
Baker Lake (YBK)−10−7−6986 *1474 *1639 *34
Cambridge Bay (YCB)−13−10−8683 *1035 *1310 *35
Ψ AMT, Annual Mean Temperature (°C); FI, Freezing Index (°C-days); * TI, Thawing Index (°C-days); Temp. Change, Temperature Change (°C).
Table 6. Geotechnical and thermal conductivity parameters assumed in the simulations in this study [10].
SoilGeotechnical ParametersThermal Conductivity Parameters
ρ S (kg/m3) ρ d (kg/m3) w (%) S S (m2/g) k S ( W / m . °C) χ
( W / m . °C)
η k u k f a
(MPa−1)
SP0 (mm2/°K.H)
CL2750130034602.91.71.81.90.97.05.0
ML2700145030402.91.71.81.90.97.08.0
where ρ S = density of soil solids (kg/m3), ρ d = dry density (kg/m3), w = water content (%), S S = specific surface area of fine particles (m2/g), k S = thermal conductivity of soil solid particles (W/m.°C), χ = material parameter that considers the effect of the particle shape (W/m.°C), η = material parameter that considers the effect of the particle shape (no unit), k u = granularity factor for unfrozen thermal conductivity, k f = granularity factor for frozen thermal conductivity, a = overload coefficient (MPa−1), and SP0 = segregation potential without vertical load (mm2/°K.H). Geotechnical and thermal conductivity parameters were used to calculate the degree of saturation (Sr), latent heat of fusion (Lf), and unfrozen and frozen thermal conductivity (ku and kf).
Disclaimer/Publisher’s Note: The statements, opinions and data contained in all publications are solely those of the individual author(s) and contributor(s) and not of MDPI and/or the editor(s). MDPI and/or the editor(s) disclaim responsibility for any injury to people or property resulting from any ideas, methods, instructions or products referred to in the content.

