Abstract
Spectroscopy in the terahertz (THz) band has been discussed as a promising tool for identifying substances such as mold in food, narcotics, or explosive materials. Other than the technological limitations, the most important difficulty is the presence of water vapor in the atmosphere, which affects THz measurements. In this paper, we present a systematic approach to the challenging subject of remote identification. We start with a brief analysis of the technical capabilities of the THz components and report the choice of devices for designing an experimental setup for reflection spectroscopy. We follow with the presentation of the transmission THz spectrometer working in an open atmosphere. Research conducted on the transmission configuration provides findings that are implemented in the experimental setup working in a reflective configuration. The final phase is an experiment providing data measured in the reflection configuration with the presence of water vapor, allowing the use of spectra in the identification of the measured samples.
1. Introduction
Spectroscopy in the terahertz (THz) band has developed significantly since the introduction of pulsed techniques. Basic research [1,2] and practical applications have benefited from THz technology development [3,4]. Since the attacks on 11 September 2001, law regulations have enforced their highest ever security measures. While implementing new safety measures is a priority, the health and safety of people being screened are equally important. A perfect solution to a security checkpoint would be a system that informs the staff if someone is hiding something under their clothes and also provide information about what that object is made of. When considering the achievements of modern material technology such as ceramic knives or 3D-printed guns, in terms of security, none of the standard security solutions is sufficient by itself. Metal detectors are becoming a technology with a limited capability for threat detection. Due to the ionizing nature of X-ray radiation, it is not suitable for passenger screening. Chemical substance detectors are slow and need dedicated personnel and constant maintenance, reducing the throughput of the people checked. Only complex systems using many different techniques can be effective with a high probability of success. THz waves meet health requirements due to their low photon energy and lack of ionizing properties. For over a decade, the industry has offered THz and sub-THz imaging solutions, which are evolving towards multispectral imaging [5,6]. Combining several safety precautions gives a high probability of finding suspicious objects, but remote identification of substances can be achieved only by spectroscopic methods. The presence of the spectral fingerprints of some explosive and dangerous materials in the THz range along with the ability of THz radiation to penetrate lighter clothing [7] makes it an ideal candidate as a sensing tool.
The subject of using THz radiation in the spectroscopy-based identification of materials was mentioned in [8,9,10]. Although years of research have been dedicated to making improvements in THz techniques, technology puts limitations on the parameters of the available sources and detectors of THz radiation. Some work describing the research dedicated to THz sources, detectors, or optics has mentioned remote identification as a possible application for THz technology. The working environment of the existing systems able to perform measurements necessary for the identification of the aforementioned substances has been limited to laboratory conditions. In this paper, we present an experiment for which remote identification is the main purpose; hence, the experiment design and equipment selection were tailored to the subject and not the other way around. The first step was to confirm the correct operation of the setup and to acquire knowledge of the measurements in high relative humidity conditions. For this, a transmission setup was built. Transmission spectra are much easier to interpret than those measured in reflection mode. Thus, the water vapor impact or other experiment-related issues were easier to uncover.
We obtained the identification results of six selected materials, three of them not previously measured, in the experimental setup for remote reflection THz spectroscopy with samples distanced at a 1, 3, and 5 m range. A key issue in the experiment was basing the identification on measurements made in a normal atmosphere with the presence of water vapor. Due to the many challenges water vapor creates for handling THz measurements, this is a significant step towards real-life applications. This approach was carefully planned to test the hypothesis of the practical remote identification of concealed material by use of THz reflective spectroscopy. This paper provides proof of concept that THz reflection spectroscopy can be used in the process of remote identification of some materials with a general focus on the setup configuration.
2. Materials and Methods
2.1. Technical Analysis
In this study, selection of the key components of the experimental setup was of the greatest importance. To ensure the best experimental results, the criteria and requirements for the functionality were defined. As the main components of the setup, the authors selected the source of the radiation and the detector. In Table 1, a comparison of the THz radiation sources is presented, and in Table 2, a comparison of the THz detectors is presented. All the considered devices were selected based on their commercial availability and practical aspects for exploitation. For the sources, two main properties were selected—the power of the generated radiation and the spectral range. The spectral range contained cases of both broadband sources or sources with tuning capabilities.

Table 1.
Overview of the currently available THz sources [11].
Table 2.
Overview of the currently available THz radiation detectors [11].
The first position in Table 1—semiconductor diodes—refers to the many types of semiconductor sources, including Gunn diodes, IMPATT diodes, TUNNETT diodes, or resonant tunnel diodes. Although these sources produce radiation with different properties, none of them outperforms the others in combined terms of optical power and bandwidth. There is another class of sources that gives high-power broadband THz radiation with high repeatability. The underlying principle for electromagnetic radiation generation is manipulating charged particle beams. These sources—gyrotrons, synchrotrons, and free electron lasers [32,33]—produce radioactive radiation as a side effect, so they would not meet the health requirements for practical application. These were also omitted in the analysis because of the size and cost. They are typically institution-level devices often built as nationally funded projects. Another class of THz generators are sources based on THz laser-induced generation devices producing broadband, pulsed signals [34]. Broadband sources, especially pulsed, are an interesting solution but they produce significant technical difficulty in terms of detection. To detect broadband pulse in most cases, a delay line is incorporated. The length of the delay line provides some margin for geometrical configuration of the setup, but unfortunately, providing capabilities to change according to the length of the optical path varying from 5 to 15 m in an elastic way is a significant technical complication. This applies to both broadband sources and systems operating in a TDS configuration.
As for the selection of the detectors, three main properties were selected: sensitivity, speed, and spectral range.
Photoconductive antennas, photomixers, and electro-optic detection work best in a TDS configuration. Although they have good parameters, their practical applications are limited. The evaluation was conducted as objectively as possible. Even though some of the assessments may seem disputable, one should keep in mind that the evaluation was conducted from the angle of possible applications in reflection spectroscopy.
For the purpose of identification, at least one of the devices must provide information about the frequency. From the point of view of the whole setup, the dynamic range is a crucial parameter. A more sensitive detector and stronger source were preferred, since the dynamic range can be expanded by externally attenuating radiation from the source. An Optical Parametric Oscillator (OPO) as the oscillator and a Hot-electron Bolometer (HEB) as the detector were selected as the best solution for the setup. An OPO generates short pulses with an amplitude up to several watts with tunability over 2 THz. Above about 1 THz, superconductor-based Hot-electron Bolometers offer the best parameters in terms of the sensitivity and speed [35,36,37]. Despite such undisputed advantages, the THz technology is rather bulky and is in constant development.
2.2. Samples and Reference Data
In THz spectroscopy, pure materials have very high attenuation. This is good for the reflection measurement, where characteristic frequencies are selectively absorbed by the material. Unfortunately, at the same time, high attenuation renders transmission spectroscopy challenging. For this reason, two sets of samples were prepared. Pure samples, for reflection measurements, containing 100% of the investigated substance were ground in a mortar into fine powder. Then, the powder was loaded into a form and pressed with 2 tons of pressure for 3 min. As a result, disc-shaped samples with a diameter of 30 mm and a thickness of 3–4 mm were produced. In this case, the amount of the substance was not important, because in reflection measurements, only the signal reflected from the front surface is analyzed.
For transmission measurements, the pellet preparation methods were adopted from FTIR spectrometry [38], which are well established. The samples were made of 10% of a substance and 90% polyethylene to obtain a weight of 400 mg per pellet. For the transmission reference measurements, the samples were prepared with a 13 mm diameter to fit a standard holder for the commercially available Time Domain Spectrometer (TDS). A TDS spectrometer, TeraView3000, was used to collect the reference measurements for both the 30 mm pure material for reflection and the 13 mm 10% material, for transmission configuration. A gold mirror and a 100% polyethylene pellet were used as a reference for reflection and transmission reference data measurements, respectively. The TDS measurements were carried out in an atmosphere with a humidity below 1% and with a THz optical path of about 30 cm. The reference data of the water vapor were also measured with the TDS spectrometer in an atmosphere with a humidity of 41%.
The availability of the data on the spectral absorption features was satisfactory; nonetheless, samples were prepared, measured using a TDS spectrometer for the reference data, and compared with the data from the literature, before being used in the actual experiment.
To ensure clarity, all measurements conducted in the TDS spectrometer are referred to as reference data and serve only that exact purpose, i.e., reference data. When the term reference measurement is used hereafter, it means a background measurement needed to calculate the transmission or reflectance spectrum in an experimental setup.
2.3. Transmission Setup
Based on the conducted analysis, we used commercially available equipment to build the setup for the THz transmission spectroscopy. Figure 1 shows a diagram of the experimental setup. The source of radiation used was the solid-state OPO delivered by MSquare. It worked in the 0.7-2.5 THz range with nonlinear characteristics providing a 53 Hz pulse repetition rate. The produced pulses had about a 20 ns time length, 50 GHz bandwidth, and 10 nJ maximum energy, corresponding to a 10W maximum amplitude. The OPO generated two output signals: the optical idler signal with a wavelength of approximately 1067 nm and the terahertz signal [39,40]. The idler pulse was coupled into the optical fiber and used as a trigger for data acquisition. The THz beam generated by the OPO was slightly divergent, with a diameter of approximately 20 mm (1/e2). It was collimated by two 2” concavo-plane lenses with a 15 mm focal length in the 2f configuration. Using a polarizer, the THz beam was limited to the linear vertical polarization, which is relevant for the spectroscopy of some materials. To avoid detector saturation, a set of attenuators was placed after the polarizer. The THz beam with the appropriate parameters was directed onto the sample in a holder. The signal transmitted through the sample was reflected by the 8" off-axis mirror to the detector. The terahertz signal was detected by the HEB [41,42]. The sensing component was a 4 nm thick bridge made of niobium nitride (NbN) integrated with a planar logarithmic spiral antenna on a substrate of highly resistive silicon. The aperture of the detector input was limited to 1–2°. The signal directed to the bolometer was filtered by a window made of high-density polyethylene (HDPE), with the pass band in the range of 0.3–3.0 THz. The filtered signal was collected by a silicon lens and focused on the NbN bridge. This is a reconfigured and optimized version of the setup from [43].
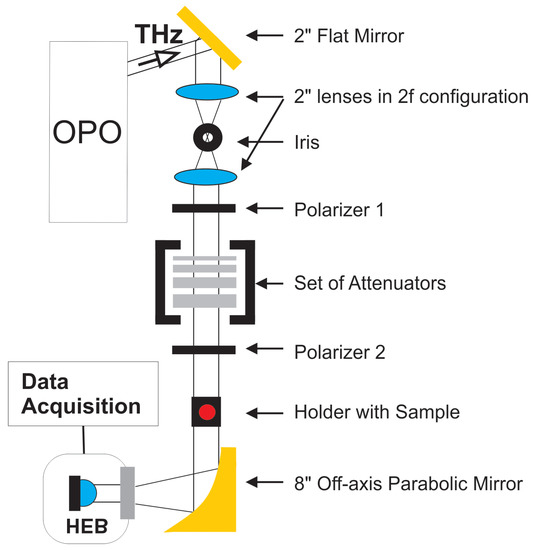
Figure 1.
Measurement setup in the transmission configuration.
During the measurements, technical issues arose. A second polarizer was added to fine-tune the signal amplitude in addition to using attenuators with four set values. The delivered attenuators had to be remeasured due to significant attenuation deviations from the nominal values. The divergence of the lower frequency part of the signal was high enough to pass around the polarizer, bounce from metal elements, and produce unwanted interference in the measured spectra. To eliminate this, an iris with an additional blockade was placed in the focal point shared by the two lenses.
2.4. Reflection Setup
To reconfigure the setup for reflection configuration, a 3” flat mirror was placed after the polarizers. With this mirror, the THz beam was directed onto the specially designed holder with the sample. The signal reflected from the sample hit the 8” flat mirror and then was directed to the 8” parabolic mirror, which focused the beam on the detector, as shown in Figure 2. The optical alignment was designed in a way that allowed for the sample holder to be placed at distances from 0.5 to 5 m. The sample holder was placed on the optical pedestal, between 3” and 8” flat mirrors, about 10 cm below the optical table level. For practical reasons, holder distances from the mirrors of 1, 3, and 5 m were selected for the experiments. The THz radiation angles of incidence were 14°, 5°, and 3°, respectively. This is a reconfigured and optimized version of the setup from [44].
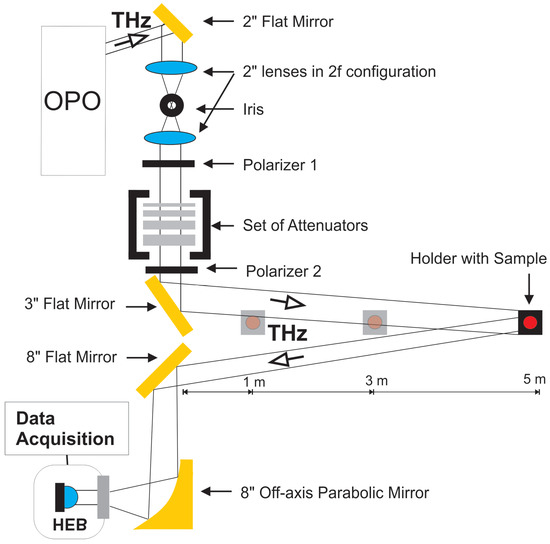
Figure 2.
Measurement setup in the reflection configuration.
Since the size of the beam directed onto the sample was wider than the sample, a special holder with rounded surfaces was built to eliminate the signal backscatter noise from the sides, as shown in Figure 3. That solution assured that no unwanted THz interference was directed to the detector. This is a slightly upgraded version of the holder in [44]. This solution has no back wall behind the sample, thus preventing reflections. The sample holder was moved from the optical table and placed on a separate pedestal, as the reflections from the metal elements of the holder tend to find their way to the detector by bouncing from the table. Additionally, absorbing metal foam was added as a cover of exposed parts of the holder. Samples used in the research were flat but not with a mirror quality, rather with a rough surface which resulted in radiation bounced from the sample being more scattered in nature than reflected, and making obtained signals very weak. For the reference measurements in this setup, a flat 30 mm polished metal disc was used.
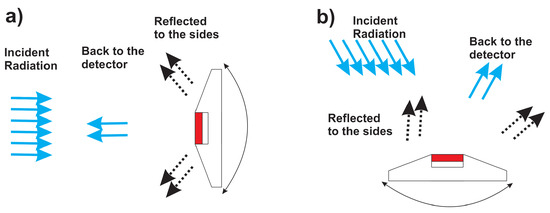
Figure 3.
Schematic diagram of the sample holder illustrating the interference reduction: (a) view from the side and (b) view from the top.
3. Methods
The spectral response measurement of the material was carried out by tuning the source and collecting a data point for each frequency. Due to the different duration of the pulses at different frequencies (Figure 4), information about the spectral properties of the test material was determined on the basis of the total pulse energy. Pulse time width depends on the frequency. In a broad range, the value was 20–25 ns. For each frequency, the pulse width varies, but no more than 1 ns. The relation between the frequency and pulse width is nonlinear. Taking into account the fluctuations in the shape of the pulse and the changes in the optical path length that led to changes in the position of the pulses in time, each received signal was processed separately. Based on the parameters from the 1067 nm trigger signal, the oscilloscope processed the corresponding THz pulse. The pulse energy was calculated by integrating the signal envelope within the appropriate limits. To minimize the measurement uncertainty and impact of other layers, each frequency point was averaged from at least 30 pulses.
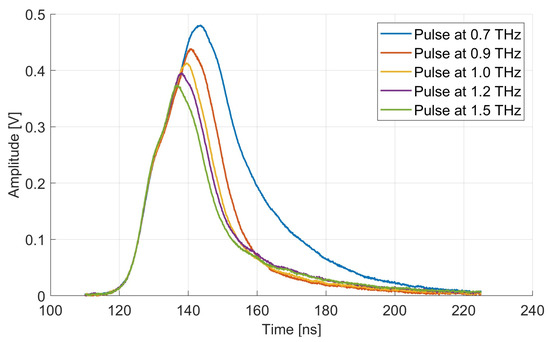
Figure 4.
Examples of the pulses measured at five different frequencies.
The sample absorption characteristics were determined by measuring the reference material, a 13 mm, 100% polyethylene, 400 mg pellet, followed by measuring the prepared 10% material. The sample spectral characteristics were determined by processing the gathered spectra according to the formula
where is the sample measurement, and is the reference measurement.
To determine the spectral reflectance characteristics , we needed to perform a reference measurement. In case of the reflection measurements for the reference data, a gold mirror was used, and for the experiment reference measurements, a well-polished flat disc with a 30 mm diameter was used. The reference measurement was followed by the sample measurement, and the spectral reflectance of the sample was determined by processing the gathered spectra according to the formula
where is the sample measurement, and is the reference measurement.
4. Results
4.1. Transmission Results
In Figure 5 and Figure 6, selected results of the transmission measurements are presented for tartaric acid and PABA, respectively. Samples were selected due to the occurrence of multiple spectral features originating from the technical properties of the experimental setup. Selection was based on the previous research [43], where a wider selection of the preliminary selection can be found. The measurements were conducted in an upgraded setup with an atmosphere with about 40% RH. The measurements were set with the reference data, and the water vapor spectra were added to the figures. Data gathered during transmission measurements presented low noise; hence, only a moving average was applied to smooth the curves.
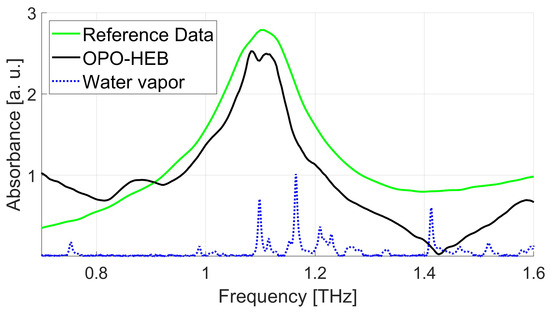
Figure 5.
The transmission spectra of tartaric acid measured in the 0.7–1.6 THz range in an atmosphere with 42% RH.
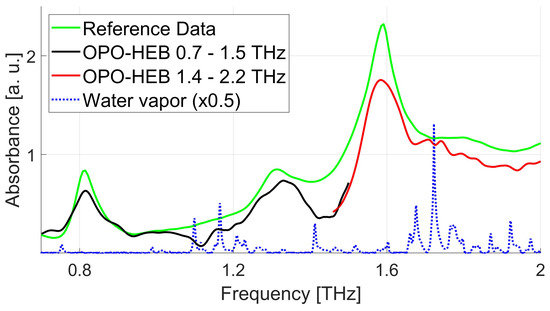
Figure 6.
The transmission spectra of PABA measured in the 0.7–1.5 THz and 1.4–2.2 THz range in an atmosphere with 38% RH.
In Figure 6, it is shown that the sample of PABA was measured in two series. This is where the value of the used attenuators was lowered, and new reference measurements and sample measurements were needed. This was conducted to extend the dynamic range of the measurement above the 21 dB offered by the detector. In Figure 5 and Figure 6, around 1.1–1.2 and 1.4 THz minor absorption features in the form of holes in the transmission spectra were noticed. They appeared on the frequencies correlated with the water vapor absorption lines. Considering the fact that the reference measurement and sample measurement were taken in comparable conditions, only the water lines with higher value had a noticeable impact. After investigation, we concluded that we could observe the effects of water lines with attenuation multiplied by the distance in an open atmosphere that was higher than 21 dB, which was strictly correlated with the detector parameters. This factor had a higher impact on the reflection measurements, where the optical path was 2–4 times longer.
4.2. Reflectance Results
We report on the terahertz reflectance spectra of six materials measured in the final reflection configuration. The improved setup with optimized, remeasured components, and added reflection-eliminating features provided us with a better signal-to-noise ratio and provided an opportunity to express the measured reflection as a percentage, rather than in arbitrary units as in previous preliminary research [44]. The improved setup enabled the possibility to measure samples with a low reflection coefficient and in a wider frequency range, providing at the same time experimental results with better signal quality. In Figure 7, Figure 8, Figure 9, Figure 10, Figure 11 and Figure 12, we present the original results of measurements conducted at the distance of 1m of lactose, PABA, RDX, PETN, salicylic acid and sugar. Measurements were conducted in an atmosphere with about 40% RH at room temperature. This fact implied the presence of water vapor absorption features in the measured characteristics. The reflectance measurements were compared with the reference data, and the water vapor transmission spectra were added to the figures.
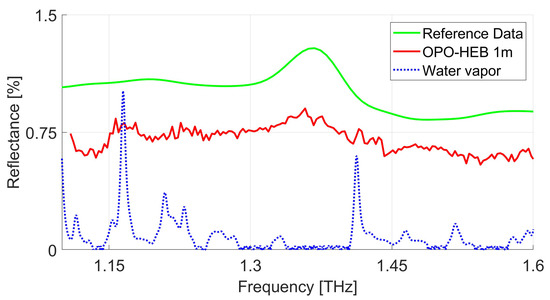
Figure 7.
The reflectance spectra of lactose measured in the 1–1.8 THz range in an atmosphere with 40% RH. The presented water vapor absorption spectra were measured in the transmission configuration.
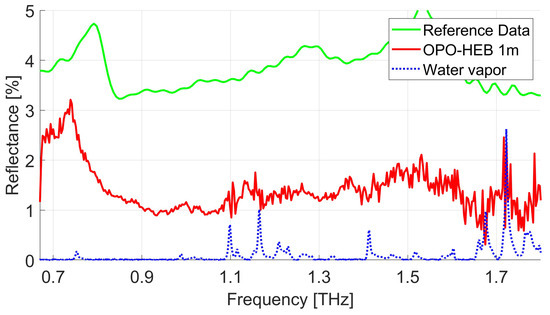
Figure 8.
The reflectance spectra of PABA measured in the 0.67–1.8 THz range in an atmosphere with 40% RH. The presented water vapor absorption spectra were measured in the transmission configuration.
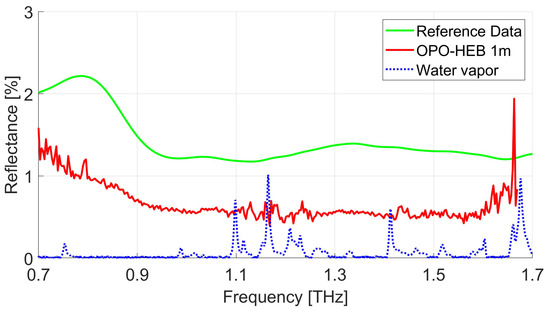
Figure 9.
The reflectance spectra of RDX measured in the 0.7–1.7 THz range in an atmosphere with 40% RH. The presented water vapor absorption spectra were measured in the transmission configuration.
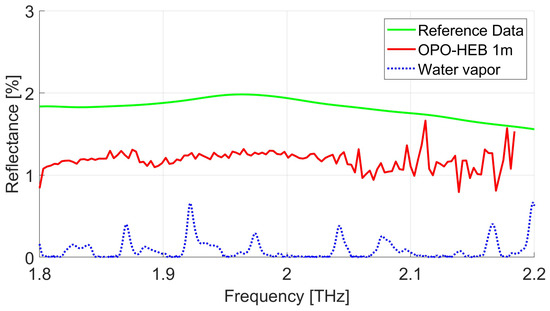
Figure 10.
The reflectance spectra of PETN measured in the 1.8–2.2 THz range in an atmosphere with 40% RH. The presented water vapor absorption spectra were measured in the transmission configuration.
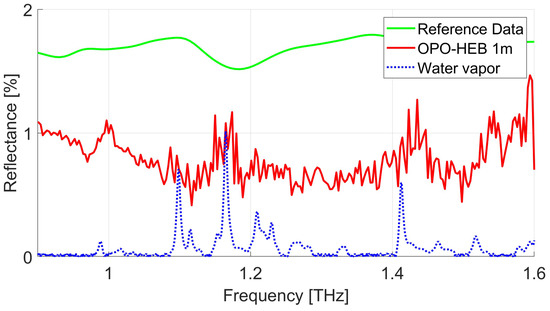
Figure 11.
The reflectance spectra of salicylic acid measured in the 0.9–1.6 THz range in an atmosphere with 40% RH. The presented water vapor absorption spectra were measured in the transmission configuration.
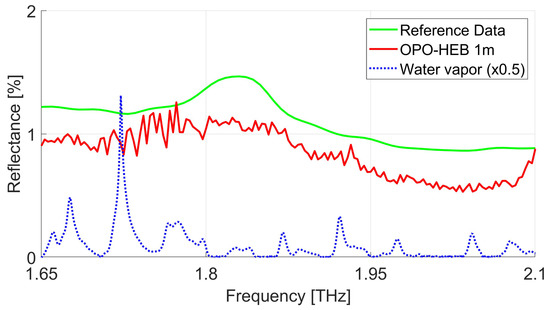
Figure 12.
The reflectance spectra of sugar measured in the 1.65–2.1 THz range in an atmosphere with 40% RH. The presented water vapor absorption spectra were measured in the transmission configuration.
Two of the selected materials, RDX and PABA, were measured at longer distances up to 5 m. In Figure 13 and Figure 14, results of the measurements are presented for RDX and PABA, respectively. A wider selection of transmission results can be found in [44].
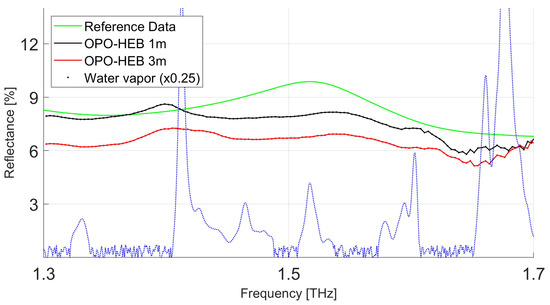
Figure 13.
The reflectance spectra of RDX measured in the 0.67–1 THz range in an atmosphere with 40% RH. The presented water vapor absorption spectra were measured in the transmission configuration.
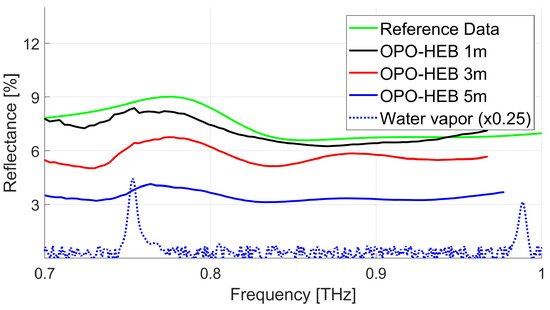
Figure 14.
The reflectance spectra of PABA measured in the 0.67–1 THz range in an atmosphere with 44% RH. The presented water vapor absorption spectra were measured in the transmission configuration.
4.3. Identification Results—Calculating Spectrum Similarity
Spectrum similarity is a metric used to measure how two different spectra are related. In this article, we use only most common methods used to calculate spectrum similarity, the Pearson correlation coefficient.
This method measures the linear correlation between two spectra by using a correlation coefficient. It is often used to compare the similarities of two spectra in the same band. The higher score values of the comparison indicate that the spectra are more similar, while lower scores of the comparison indicate that they are less similar. Results of the comparison are show in two sets. First, Table 3 contains the correlation efficiencies of six materials measured over 1 m, presented in Figure 7, Figure 8, Figure 9, Figure 10, Figure 11 and Figure 12. Data from this part of the experiment have not been processed in any way. Results were computed from the comparison of reference data and raw data from the detector.
Table 3.
Results of identification of six materials at 1 m distance.
The second set of correlation coefficients, presented in Table 4, contains results measured over 1, 3, and 5 m, as presented in Figure 13 and Figure 14. Data from this part of the experiment were submitted to noise reduction and signal filters. Namely, outlier elimination was applied, and a few missing points were filled by calculating the interpolation between neighboring points. A basic low-pass filter was applied, and finally, curves were smoothed with a moving average. Results were computed from a comparison of reference data and raw data from the detector.
Table 4.
Results of identification of three materials at 1, 3, and 5 m.
In the case of measurements at 1 m distance, we can see that correlation scores in Table 3 span from 0.23 up to 0.87, and in Table 4 span from 0.58 to 0.94. Particularly for lactose, when results from both sets are compared, we can see significant improvement from 0.36 to 0.94. When we investigate the measurement data collected at different distances, there is a tendency for the correlation coefficient to decrease with increasing distance. Since the overall detected power levels were high, the decrease in the correlation coefficients most probably was caused by the decrease in the signal-to-noise ratio. Values of the correlation for RDX in the Table 4 show an almost constant value. The authors believe that the lack of correlation value decrease is a coincidence of the main spectral feature of RDX present in the 0.7–0.9 THz range perfectly aligning with the spectral range of the source with the highest power output. This provided an additional 10+dB of dynamic range in the crucial spectral range. Authors believe that with increasing distance, the decrease in correlation values would appear eventually.
In conclusion, there are many methods used to calculate spectrum similarity. Each method has its own advantages and disadvantages, and should be selected depending on the specific application. The proposed methods identified all test chemicals correctly when used with processed data. This indicates that the methods could be used in a laboratory-based experiment. For real life applications, a more complex solution may be desired. Recent advancements in the area of scientific computing, machine learning, neural networks, and similar make it possible to prepare tailored methods, adapting to the appropriate aspects of the experiment.
5. Discussion
This paper brings up the subject of the practical application of THz radiation. The discussion about the best selection of the equipment is one without an absolute solution. Preferences will change depending on the field, application and specialist expertise. In our considerations, besides strictly technical parameters, user-friendliness, ease of implementation, and a low to moderate level of expertise needed by the designated operator to use the whole setup in an industrial situation were taken into account. Our selection, as any other among various possibilities, will often generate discussion in scientific world. Hopefully, it will lead to a better or more cost-effective solution.
The experiment was conducted in an atmosphere with 38–42% RH, as these were the dominant conditions indoors. Only low variability was observed during the one day period, and minimal variations not exceeding about 1% during the time of one measurement were observed. According to the accepted methodology, when the reference and sample measurements are conducted in similar conditions, the background influence should be eliminated. In our study, the water vapor had observable minimal to minor influence on the measured spectra. The observed spectral features occurred in close proximity to the material absorption peak. From our observations, the water vapor absorption features appeared on the measured spectra when the sum of the material absorption, water vapor absorption, and the atmosphere absorption exceeded the value of the detector dynamic range. The water vapor influence could be limited by the software. Furthermore, with engineering and calibration, the THz source output power could be controlled in an automatic manner by appropriately attenuating the signal. This could provide overall improved performance and limit the water vapor influence only to the strongest lines. Although the number of the samples was relatively small, they were selected to have absorption peaks spread across the range of the radiation generated by the OPO. The authors see significant room for improvement in terms of the methods used for analytical comparison for identification purposes. The novelty in using AI, neural networks, and other advanced computing methods could provide a higher certainty of positive identification. This is a necessary direction for progress toward practical application. The results showed that it is possible to use THz reflection spectroscopy for remote identification of some materials at a distance of a few meters. Although the methods used do not provide adequate results to prove clear positive identification they provide sufficient results for future, more sophisticated analysis and methods to be implemented.
6. Conclusions
We presented a concept of a practical solution to the problem of the remote identification of materials. A technical analysis of the commercially available equipment was shown. Based on the conclusions, a THz radiation source and detector were selected. The detailed description of the setup for the transmission and reflection configuration was provided. We reported the terahertz transmission and reflectance spectra of selected materials, measured in a normal atmosphere with about 40% RH at room temperature. The methods of data acquisition and processing were presented. Reference data measurements were conducted in the TDS spectrometer and compared with the experimental measurement results. The comparison showed a satisfactory auto-correlation of the obtained results to be used in the process of material identification after applying more sophisticated numerical methods. Suggestions for improving the performance and directions toward more practical implementation were given. This paper emphasizes the hardware and setup configuration with the aim of providing proof of concept that THz reflection spectroscopy can be used for the remote identification of some materials. This research did not advocate that only the highest-performing equipment was suitable for use in practical applications. The presented approach aimed to show opportunities for and find the physical limitations of the remote identification of selected materials in the THz range to enable more suitable future technology developments.
Author Contributions
Conceptualization, M.W. and N.P.; methodology, M.W. and N.P.; software, M.M.; validation, M.W., M.M. and N.P.; formal analysis, M.W. and N.P.; investigation, M.W.; resources, N.P.; data curation, M.W. and M.M.; writing—original draft preparation, M.W.; writing—review and editing, M.W., M.M. and N.P.; visualization, M.W; supervision, N.P.; project administration, M.M.; funding acquisition, M.M. All authors have read and agreed to the published version of the manuscript.
Funding
This research was funded by the Military University of Technology; grant number UGB/22-726/2022/WAT.
Institutional Review Board Statement
Not applicable.
Informed Consent Statement
Not applicable.
Data Availability Statement
The data presented in this study are available on request from the corresponding author.
Acknowledgments
We are grateful to Slawomir Dyjak from the Faculty of Chemistry, Military University of Technology, for preparing and providing the samples of the materials used in the research. We would like to thank Adam Czerwiński from Warsaw University of Technology for his help and suggestions with the design and manufacture of the 8" parabolic mirror.
Conflicts of Interest
The authors declare no conflict of interest.
References
- Siegel, P.H. Terahertz technology. IEEE Trans. Microw. Theory Tech. 2002, 50, 910–928. [Google Scholar] [CrossRef]
- Leisawitz, D.T.; Danchi, W.C.; Di Pirro, M.J.; Feinberg, L.D.; Gezari, D.Y.; Hagopian, M.; Langer, W.D.; Mather, J.C.; Moseley, S.H.; Shao, M.; et al. Scientific motivation and technology requirements for the SPIRIT and SPECS far-infrared/submillimeter space interferometers. Proc. SPIE 2000, 4013, 36–46. [Google Scholar]
- Pałka, N.; Maciejewski, M.; Kamiński, K.; Piszczek, M.; Zagrajek, P.; Czerwińska, E.; Walczakowski, M.J.; Dragan, K.; Synaszko, P.; Świderski, W. Fast THz-TDS Reflection Imaging with ECOPS—Point-by-Point versus Line-by-Line Scanning. Sensors 2022, 22, 8813. [Google Scholar] [CrossRef]
- May, Z.; Alam, M.K.; Nayan, N.A. Recent Advances in Nondestructive Method and Assessment of Corrosion Undercoating in Carbon–Steel Pipelines. Sensors 2022, 22, 6654. [Google Scholar] [CrossRef] [PubMed]
- Kowalski, M. Real-time concealed object detection and recognition in passive imaging at 250 GHz. Appl. Opt. 2019, 58, 3134–3140. [Google Scholar] [CrossRef] [PubMed]
- Ahi, K. Quality control and authentication of packaged integrated circuits using enhanced-spatial-resolution terahertz time-domain spectroscopy and imaging. Opt. Lasers Eng. 2018, 104, 274–284. [Google Scholar] [CrossRef]
- Kowalski, M. Hidden object detection and recognition in passive terahertz and mid-wavelength infrared. J. Infrared Millim. Terahertz Waves 2019, 40, 1074–1091. [Google Scholar] [CrossRef]
- Rheenen, A.; Haakestad, M. Detection and identification of explosives hidden under barrier materials: What are the THz-technology challenges? Proc. Spie Int. Soc. Opt. Eng. 2011. [Google Scholar] [CrossRef]
- Chanteau, B.; Lopez, O.; Auguste, F.; Darquié, B.; Chardonnet, C.; Amy-Klein, A.; Zhang, W.; Santarelli, G.; Le Coq, Y. Mid-IR frequency measurement using an optical frequency comb and a long-distance remote frequency reference. In Proceedings of the 2012 European Frequency and Time Forum, Gothenburg, Sweden, 23–27 April 2012; pp. 456–458. [Google Scholar]
- Nusinovich, G.S.; Sprangle, P.; Romero-Talamas, C.A.; Rodgers, J.; Pu, R.; Dmytro, G.K.; Thomas, M.; Antonsen, T.A., Jr.; Granatstein, V.L. Possible standoff detection of ionizing radiation using high-power THz electromagnetic waves. In Proceedings of the Chemical, Biological, Radiological, Nuclear, and Explosives (CBRNE) Sensing XIII, Baltimore, MD, USA, 24–27 April 2012; Volume 8358, pp. 420–424. [Google Scholar]
- Dhillon, S.S.; Vitiello, M.S.; Linfield, E.H.; Davies, A.G.; Hoffmann, M.C.; Booske, J.; Paoloni, C.; Gensch, M.; Weightman, P.; Williams, G.P.; et al. The 2017 terahertz science and technology roadmap. J. Phys. Appl. Phys. 2017, 50, 043001. [Google Scholar] [CrossRef]
- Khalid, A.; Dunn, G.M.; Macpherson, R.F.; Thoms, S.; Macintyre, D.; Li, C.; Steer, M.J.; Papageorgiou, V.; Thayne, I.G.; Kuball, M.; et al. Terahertz oscillations in an In0.53Ga0.47As submicron planar Gunn diode. J. Appl. Phys. 2014, 115, 114502. [Google Scholar] [CrossRef]
- Acharyya, A. Three-Terminal Graphene Nanoribbon Tunable Avalanche Transit Time Sources for Terahertz Power Generation. Phys. Status Solidi (A) Appl. Mater. Sci. 2019, 216, 1900277. [Google Scholar] [CrossRef]
- Biswas, A.; Sinha, S.; Acharyya, A.; Banerjee, A.; Pal, S.; Satoh, H.; Inokawa, H. 1.0 THz GaN IMPATT Source: Effect of Parasitic Series Resistance. J. Infrared Millim. Terahertz Waves 2018, 39, 954–974. [Google Scholar] [CrossRef]
- Balasekaran, S.; Endo, K.; Tanabe, T.; Oyama, Y. Patch antenna coupled 0.2 THz TUNNETT oscillators. Solid-State Electron. 2010, 54, 1578–1581. [Google Scholar] [CrossRef]
- Gunn, J.B. Microwave oscillations of current in III–V semiconductors. Solid State Commun. 1963, 1, 88–91. [Google Scholar] [CrossRef]
- Haitao, J.; Zhonghao, Z.; Jing, L.; Zemin, L.; Yintong, J. Generation of terahertz waves based on nonlinear frequency conversion with stimulated Raman adiabatic passage. Opt. Express 2022, 30, 43815–43825. [Google Scholar]
- Hoghooghi, N.; Xing, S.; Chang, P.; Lesko, D.; Lind, A.; Rieker, G. Broadband 1-GHz mid-infrared frequency comb. Light Sci. Appl. 2022, 11, 264. [Google Scholar] [CrossRef]
- Yeh, K.-L.; Hoffmann, M.C.; Hebling, J.; Nelson, K.A. Generation of 10uJ ultrashort terahertz pulses by optical rectification. Appl. Phys. Lett. 2007, 90, 171121. [Google Scholar] [CrossRef]
- Guiramand, L.; Nkeck, J.E.; Ropagnol, X.; Ozaki, T.; Blanchard, F. Near-optimal intense and powerful terahertz source by optical rectification in lithium niobate crystal. Photon. Res. 2022, 10, 340–346. [Google Scholar] [CrossRef]
- Mei, J.; Zhong, K.; Wang, M.; Liu, Y.; Xu, D.; Shi, W.; Wang, Y.; Yao, J.; Liang, W. Widely Tunable High-Repetition-Rate Terahertz Generation Based on an Efficient Doubly Resonant Type-II PPLN OPO. IEEE Photonics J. 2016, 8, 7762105. [Google Scholar] [CrossRef]
- Li, Z.; Jiao, B.; Liu, W.; Hu, Q.; Li, Y.; Sun, X.; Zhao, J.; Bing, P.; Zhang, H.; Zhong, K.; et al. High-efficiency terahertz wave generation combined with optimized cascaded difference frequency generation and optical parametric oscillator. Optik 2021, 234, 166622. [Google Scholar] [CrossRef]
- Virginia Diodes Inc. Virginia Diodes, Inc—Frequency Multipliers. Available online: http://vadiodes.com/en/frequency-multipliers (accessed on 17 May 2023).
- Dietz, R.J.B.; Globisch, B.; Roehle, H.; Stanze, D.; Göbel, T.; Schell, M. Influence and adjustment of carrier lifetimes in InGaAs/InAlAs photoconductive pulsed terahertz detectors: 6 THz bandwidth and 90 dB dynamic range. Opt. Express 2014, 22, 19411–19422. [Google Scholar] [CrossRef] [PubMed]
- Cunningham, J.; Byrne, M.B.; Wood, C.D.; Dazhang, L. On-chip terahertz systems for spectroscopy and imaging. Electron. Lett. 2010, 46, 34. [Google Scholar] [CrossRef]
- Morales, A.; Nazarikov, G.; Rommel, S.; Okonkwo, C.; Monroy, I.T. Highly Tunable Heterodyne Sub-THz Wireless Link Entirely Based on Optoelectronics. IEEE Trans. Terahertz Sci. Technol. 2021, 11, 9372853. [Google Scholar] [CrossRef]
- Liebermeister, L.; Nellen, S.; Kohlhaas, R.B.; Lauck, S.; Deumer, M.; Breuer, S.; Schell, M.; Globisch, B. Optoelectronic frequency-modulated continuous-wave terahertz spectroscopy with 4 THz bandwidth. Nat. Commun. 2021, 12, 1071. [Google Scholar] [CrossRef] [PubMed]
- Cruz, F.C.; Nogueira, G.T.; Costa, L.F.L.; Frateschi, N.C.; Viscovini, R.C.; Pereira, D. Continuous and Pulsed THz generation with molecular gas lasers and photoconductive antennas gated by femtosecond pulses. In Proceedings of the 2007 SBMO/IEEE MTT-S International Microwave and Optoelectronics Conference, Salvador, Brazil, 29 October–1 November 2007; Volume 992, pp. 446–449. [Google Scholar]
- Köhler, R.; Tredicucci, A.; Beltram, F.; Beere, H.E.; Linfield, E.H.; Davies, A.G.; Ritchie, D.A.; Iotti, R.C.; Rossi, F. Terahertz semiconductor-heterostructure laser. Nature 2002, 417, 156–159. [Google Scholar] [CrossRef]
- Rauter, P.; Capasso, F. Multi-wavelength quantum cascade laser arrays. Laser Photonics Rev. 2015, 9, 452–477. [Google Scholar] [CrossRef]
- Paoloni, C.; Mineo, M. Double Corrugated Waveguide for G-Band Traveling Wave Tubes. IEEE Trans. Electron Devices 2014, 61, 4259–4263. [Google Scholar] [CrossRef]
- Booske, J.H.; Dobbs, R.J.; Joye, C.D.; Kory, C.L.; Neil, G.R.; Gun-Sik, P.; Park, J.; Temkin, R.J. Vacuum Electronic High Power Terahertz Sources. IEEE Trans. Terahertz Sci. Technol. 2011, 1, 54–75. [Google Scholar] [CrossRef]
- Müller, A.-S. Accelerator-Based Sources of Infrared and Terahertz Radiation. Rev. Accel. Sci. Technol. 2010, 3, 165–183. [Google Scholar] [CrossRef]
- Fan, Z.; Lu, C.; Liu, Y. Tunable broadband THz emission from air plasma pumped by femtosecond pulses composed of a fundamental frequency with its detuned second harmonic. Opt. Commun. 2022, 505, 127532. [Google Scholar] [CrossRef]
- Baselmans, J.J.A.; Hajenius, M.; Gao, J.R.; Klapwijk, T.M.; de Korte, P.A.J.; Voronov, B.; Gol’tsman, G. Doubling of sensitivity and bandwidth in phonon cooled hot electron bolometer mixers. Appl. Phys. Lett. 2004, 84, 1958–1960. [Google Scholar]
- Yagoubov, P.; Kroug, M.; Merkel, H.; Kollberg, E.; Schubert, J.; Hübers, H.-W. NbN hot electron bolometric mixers at frequencies between 0.7 and 3.1 THz. Supercond. Sci. Technol. 1999, 12, 989. [Google Scholar] [CrossRef]
- Chen, J.; Liang, M.; Kang, L.; Jin, B.B.; Xu, W.W.; Wu, P.H.; Zhang, W.; Jiang, L.; Shi, S.C. Low Noise Receivers Using Niobium Nitride Hot Electron Bolometer Mixers from 0.76 to 3.1 THz. Terahertz Sci. Technol. 2009, 2, 68–74. [Google Scholar]
- Schiele, C. Polyethylene molding technique for infrared spectroscopy. Spectrochim. Acta 1966, 22, 1967–1968. [Google Scholar] [CrossRef]
- Firefly-THz User Manual; MSquared Lasers Ltd.: Glasgow, UK, 2012.
- Molter, D.; Theuer, M.; Beigang, R. Nanosecond terahertz optical parametric oscillator with a novel quasi phase matching scheme in lithium niobate. Opt. Express 2009, 17, 6623–6628. [Google Scholar] [CrossRef] [PubMed]
- Semenov, A.D.; Gol’tsman, G.N. Nonthermal mixing mechanism in a diffusion-cooled hot-electron detector. J. App. Phys. 2000, 87, 502–510. [Google Scholar] [CrossRef]
- Superconducting Nanotechnology, HEB User Manual; Scontel: Moscow, Russia, 2012.
- Walczakowski, M.J.; Palka, N.; Zagrajek, P.; Szustakowski, M. Terahertz spectra of materials measured by the OPO-based system. In Proceedings of the Terahertz Physics, Devices, and Systems VII: Advanced Applications in Industry and Defense, Baltimore, MD, USA, 29 April–3 May 2013; Volume 8716, pp. 185–191. [Google Scholar]
- Walczakowski, M.J.; Palka, N.; Szustakowski, M.; Czerwinski, A.; Sypek, M. Detection of the THz waves from the 5 m distance. In Proceedings of the Millimetre Wave and Terahertz Sensors and Technology VI, Dresden, Germany, 23–26 September 2013; Volume 8900, pp. 162–168. [Google Scholar]


Disclaimer/Publisher’s Note: The statements, opinions and data contained in all publications are solely those of the individual author(s) and contributor(s) and not of MDPI and/or the editor(s). MDPI and/or the editor(s) disclaim responsibility for any injury to people or property resulting from any ideas, methods, instructions or products referred to in the content. |
© 2023 by the authors. Licensee MDPI, Basel, Switzerland. This article is an open access article distributed under the terms and conditions of the Creative Commons Attribution (CC BY) license (https://creativecommons.org/licenses/by/4.0/).