Article

Methicillin Resistance of Food-Borne Biofilm-Forming Staphylococci

by
Acácio Salamandane
1,2,*,
Jussara Correia
1,
Belo Afonso Muetanene
3,
Madalena dos Santos
1,
Manuel Malfeito-Ferreira
1 and
Luísa Brito
1
1
LEAF—Linking Landscape, Environment, Agriculture and Food Research Center, Associate Laboratory TERRA, Instituto Superior de Agronomia, Universidade de Lisboa, Tapada da Ajuda, 1349-017 Lisbon, Portugal
2
Faculdade de Ciências de Saúde, Universidade Lúrio, Campus Universitário de Marrere, Nampula 4250, Mozambique
3
Faculdade de Ciências Agrárias, Universidade Lúrio, Campus Universitário de Unango, Sanga 3300, Mozambique
*
Author to whom correspondence should be addressed.
Appl. Sci. 2023, 13(13), 7725; https://doi.org/10.3390/app13137725
Submission received: 4 June 2023 / Revised: 26 June 2023 / Accepted: 28 June 2023 / Published: 29 June 2023
(This article belongs to the Special Issue Food Safety and Microbiological Hazards)

Abstract

:
The aim of this study was to evaluate the biofilm-forming ability and the resistance of planktonic cells and biofilm to methicillin (MIC and MBC, and log CFU/cm2 reduction, respectively). Thirty-four isolates were used, including coagulase-positive Staphylococcus (CPS) and coagulase-negative Staphylococcus (CNS), recovered from ready-to-eat (RTE) foods. Biofilm-forming ability was based on enumeration of viable cells from biofilms formed on three types of surfaces, namely stainless steel, polystyrene, and glass. Thirteen of the thirty-four isolates (38.2%) were methicillin-resistant (MIC higher than 4 µg/mL). Staphylococcus aureus (CPS) and Staphylococcus saprophyticus (CNS) were the species that showed the highest percentage of resistance (50% and 71.4%, respectively). Staphylococcus warneri was the only species susceptible to methicillin. In 20 of the 34 isolates, the MBC value was twice the MIC value. The CPS (S. aureus) and the CNS (the other species) were not significantly different (p > 0.05) on biofilm-forming ability on the three surfaces used. However, when comparing the averages obtained for the biofilm-forming ability of the isolates, the values obtained (log CFU/cm2) in polystyrene were significantly higher (p < 0.05) than those obtained with the isolates on stainless steel. On the other hand, data from biofilm-forming ability of the isolates on glass and stainless steel are positively and significantly correlated with each other (r = 0.54; p = 0.02). It was not possible to determine the concentration of methicillin that promotes biofilm removal since log reductions were less than 3 log CFU/cm2. The results of this study indicate that foodborne CPS and CNS can form biofilms on different types of material. As these biofilms are resistant to high concentrations of methicillin, their occurrence in food environments and their spread to medical settings can result in staphylococcal food poisoning or, in the worst-case scenario, septicemia, respectively. Good hygiene and good manufacturing practices (GHP and GMP) are therefore mandatory to prevent contamination with Staphylococcus spp.

1. Introduction

Biofilms are complex and highly structured aggregations of sessile bacteria, formed on biotic or abiotic surfaces, embedded in a self-produced extracellular matrix of exopolysaccharides, proteins, and DNA [1,2,3]. The quorum sensing of microorganisms in the biofilm is oriented to mobilize resources for the survival of microorganisms, such as reducing their metabolism, activating protectors against the host’s immune defenses, in addition to protecting against antimicrobial agents, often resulting in persistent and difficult-to-treat infections [1,2]. Biofilm formation involves several steps such as adhesion, accumulation, maturation, and biofilm dispersion, determined by several genes, mainly from the icaABCD operon encoding a Polysaccharide Intercellular Adhesion (PIA), the main component of biofilms [4,5]. The ability of the bacterial strain to form a biofilm can be assessed by indirect methods, for instance based on the application of crystal violet, and by direct methods based on the viable cell count (CFUs) [6]. The crystal violet method involves growing biofilms in microtiter plates, staining them with crystal violet, and then solubilizing the bound dye to measure its absorbance [5,6]. This method has been widely used for simple high-throughput screening of cultures [7]. However, it is based on the crystal violet binding to viable and non-viable cells and extracellular polymers of the biofilm matrix, not allowing the exact quantification of viable cells in the biofilm [7]. On the other hand, direct methods for measuring biofilm formation rely on removing cells from the surface and plating the resulting cell suspension to determine the number of CFUs [8]. Stainless steel is often used as a surface for the growth of biofilms but, in general, bacteria can adhere and form biofilms on different types of materials, such as polystyrene, Teflon, marble, granite, glass, and polypropylene [6,8,9]. Staphylococcus spp. include important human and animal biofilm-forming pathogens that can cause severe infections [1,10]. These bacteria can adhere to implanted medical devices or damaged tissues, causing persistent infections through the formation of biofilms [2,5]. Multidrug-resistant strains such as methicillin-resistant S. aureus (MRSA), which are isolated from various environments, are highly prone to forming biofilms and causing clinically complicated infections, increasing the likelihood of developing persistent, chronic, and recurrent infections [10].
The aim of this study was to evaluate the biofilm-forming ability of Staphylococcus spp. recovered from ready-to-eat (RTE) street food. Isolates included coagulase-positive Staphylococcus and coagulase-negative Staphylococcus. Three different surfaces were used for biofilm formation (glass, stainless steel, and polystyrene). Since in Staphylococcus methicillin resistance is closely associated with multidrug resistance, methicillin resistance of planktonic cells and biofilms were also investigated.

2. Materials and Methods

This study used 34 isolates of Staphylococcus spp. previously recovered from RTE street food sold in Maputo [11]. This set of isolates included 10 S. aureus (coagulase-positive staphylococci (CPS) and 24 coagulase-negative staphylococci (CNS): seven isolates of S. warneri and S. saprophyticus, respectively, and five isolates of S. pasteuri and S. xylosus, respectively (Table 1). The procedures for obtaining, identifying, and characterizing these isolates by biochemical and molecular tests were previously described in Salamandane et al. [12]. Briefly, Staphylococcus spp. presumptive colonies were obtained after incubation for 48 h at 37 °C onto Chromogenic Baird Parker Agar—CBPA (Biokar Diagnostics, Beauvais, France) according to ISO 6888 [11,13]. Biochemical tests were carried out to characterize the presumptive Staphylococcus colonies from CBPA plates, namely: Gram staining, catalase, and oxidase tests [11]. Subsequently, coagulase tests were performed in Coagulase Rabbit Plasma (Biokar Diagnostics, Beauvais, France) and in Baird Parker RPF Agar (Biokar Diagnostics, Beauvais, France), according to ISO 6888-2/A1-2003 [14]. Molecular identification was performed targeting the 16S rRNA gene (1500 bp) with Bac27F forward primer (5-AGAGTTTGGATCMTGGCTCAG-3) and Univ1492R universal reverse primer (5-CGGTTACCTTGTTACGACTT-3). The amplified products were sequenced (STAB VIDA, Caparica, Portugal) and the resulting sequences were submitted to Blastn using the megablast algorithm against Reference RNA sequences database (RefSeq RNA) from the National Center of Biotechnology Information (NCBI) for isolate identification.
The presence of seven virulence genes, namely encoding toxins (hlb and sak) and staphylococcal enterotoxins (sea, seb, sec, sed, and see) were previously investigated by multiplex PCR [12]. Fourteen of the thirty-four (41.2%) isolates were also multidrug-resistant. These characteristics are presented in Table 1.
Table 1. Antibiotic resistance profile and virulence genes in the isolates used in this study [12].
Isolate CodeSpeciesAntibiotic Resistance ProfileVirulence Genes
11S. aureusFOX, AMP, MET, VANC, PEN, ERYhlb
15S. aureusAMP, PEN, ERY-
32S. aureusFOX, AMP, MET, PEN, SXThlb
47S. aureusVANC, PEN, ERY-
48S. aureusPEN, ERYhlb, sea
49S. aureusPEN-
50S. aureusFOX, AMP, MET, VANC, PENhlb
52S. aureusVANC-
53S. aureusFOX, AMP, MET, VANC, PEN, TET, ERYhlb, sed
68S. aureusFOX, MET, VANC, PEN, TET, ERYhlb, sec
24S. pasteuriPENsec
37S. pasteuri-hlb
40S. pasteuriPEN, TET-
41S. pasteuriERYhlb
43S. pasteuriFOX, MET, PEN, ERYhlb
6S. saprophyticusPEN-
13S. saprophyticusFOX, MET, PEN, VANC, TET, ERYsec
19S. saprophyticusFOX, MET, VANC, PEN, ERYsec, sed, sak
26S. saprophyticusFOX, MET, PEN, ERYsec
31S. saprophyticusPEN, ERYseb, hlb
35S. saprophyticusFOX, MET, PEN, ERYsec
59S. saprophyticusFOX, MET, PEN, SXTsec
1S. warneriPEN, ERYsak
18S. warneriAMP, PEN, ERYsec, sak
9S. warneriERYsec, sak
10S. warneriERYsak
20S. warneriPENsec
22S. warneriPENsec
34S. warneriAMP, PEN, GEN, ERYsec
21S. xylosusPENsec, sed
23S. xylosusAMP, PEN, ERY-
28S. xylosusFOX, MET, VAN, PEN-
30S. xylosusPEN-
65S. xylosus VANC, PEN, ERYseb, sec, sed
The nine antibiotics tested were: Cefoxitin (FOX), Ampicillin (AMP), Methicillin (MET), Vancomycin (VAN), Penicillin G (PEN), Tetracycline (TET), Gentamicin (GEN), Trimethoprim/sulfamethoxazole (SXT), and Erythromycin (ERY). Isolates signed in bold and underlined are multidrug-resistant isolates. Multidrug resistance was considered as non-susceptibility to at least one agent in three or more antimicrobial categories and/or resistance to methicillin [15].

2.1. Determination of the Minimum Inhibitory Concentration (MIC) and the Minimum Bactericidal Concentration (MBC)

The MIC was determined according to the standard broth dilution method (CLSI M07-A8) as indicated by the Clinical and Laboratory Standards Institute (CLSI) [15], evaluating the visible growth of microorganisms in Trypto–Casein–Soy Broth (TSB) (Biokar Diagnostics, Beauvais, France) at 37 °C for 18 ± 2 h. Briefly, serial two-fold dilutions of methicillin at concentrations ranging from 64 µg/mL to 1 µg/mL were used in 96-well polystyrene microtiter plates (CellStar®, Kremsmünster, Austria). Then, 100 μL of inoculum was then added to obtain a final bacterial concentration of 108 CFU mL−1 (0.5 McFarland’s standard) in each well, in a total volume of 200 μL. Cells that were not subjected to the antibiotic at any time and TSB that was not inoculated at any time were controls for inoculum viability and sterility of the culture medium. The MIC was defined as the lowest concentration of methicillin that prevents visible growth of a selected isolate after a 24 h incubation period.
MBC was determined after MIC determination. In fact, after 24 h incubation at 37 °C, from all the wells that did not show visible bacterial growth, 100 µL were removed, inoculated onto TSA-YE, Trypto–Casein–Soy agar plates (Biokar Diagnostics, Beauvais, France), and incubated at 37 °C, for 24 h. MBC was defined as the lowest concentration of methicillin capable of killing 99.9% of the bacterial population (3 log reduction) [16].

2.2. Assessment of Biofilm Formation Capacity

The evaluation of the biofilm formation capacity of the isolates was carried out based on the removal of aggregated cells from different surfaces and their respective plating for CFU quantification. Three different surfaces were used, namely: polystyrene, stainless steel, and glass surface. The inocula were always prepared from isolated colonies grown onto TSA-YE for 22 ± 2 h, at 37 °C, which were suspended in TSB to obtain a turbidity equivalent to the McFarlands 0.5 standard (about 108 CFU mL−1).

2.2.1. Polystyrene Surface (P24 Microplates)

For this method, 24-well polystyrene microplates (P24 microplates) (Orange Scientific, Braine-l’Alleud, Belgium) were used. Wells were inoculated with 1 mL of the inoculum prepared as described above and the microplates were sealed with Parafilm® (Amcor, Zurich, Switzerland) and incubated for 24 h at 37 °C. Non-inoculated wells (negative controls) were filled with 1 mL of sterilized TSB. After this period, the broth with the culture was removed and each well were subjected to three series of washes with 1.5 mL of Ringer’s solution (Biokar Diagnostics, Beauvais, France) (RS). The microplates were inverted onto absorbent paper to remove the remaining washing liquid.
Thirty glass beads of 4 mm of diameter and 1 mL of RS per well were added. The microplate was vortexed on a microplate vortex (Tittertek DSG, Flowlabs, Berlin, Germany) for 2 min at maximum speed to remove biofilm from the surface of the wells. Decimal dilutions were performed, and TSA-YE plates were inoculated by spreading (100 µL). The CFU count was performed after 24 h and confirmed after 48 h of incubation at 37 °C. After calculating the total adhesion surface area, the biofilm formation capacity of the isolates was expressed in log CFU/cm2.

2.2.2. Stainless Steel Coupons

The stainless-steel coupons (Metalurgica Quinacorte, Lda, Lousa, Portugal) (1 × 1 cm) were previously treated to remove grease and autoclaved for 15 min at 121 °C. The procedure used for the formation of biofilms was in accordance with Costa et al. (2016) [16]. Briefly, each coupon was immersed in a 24-well polystyrene microplate containing 1.5 mL of inoculum. The microplates were sealed with Parafilm® and incubated at 37 °C for 24 h. Coupons used as negative controls (non-inoculated) were immersed in 1.5 mL of sterilized TSB.
After incubation, each coupon was washed with RS (1 mL for each face) in order to remove planktonic cells. Each coupon thus washed was placed in a new P24 microplate with 20 glass beads of 4 mm of diameter per well. Another 30 glass beads of 4 mm of diameter and 1 mL RS were placed on top of each coupon. The P24 microplate was shaken on a microplate shaker (Tittertek DSG, Flowlabs, Berlin, Germany) for 2 min at maximum speed to disaggregate adhered cells. Subsequently, decimal dilutions were performed and inoculated by spreading onto plates of TSA-YE plates. The CFU count was performed after 24 h and confirmed after 48 h of incubation, at 37 °C. After calculating the total adhesion surface area, the biofilm formation capacity of the isolates was expressed in log CFU/cm2.

2.2.3. Glass Test Tubes

For this method, glass test tubes (16 × 160 mm) with metal caps were previously autoclaved at 121 °C for 15 min and their inner surface used as the adhesion surface. The tubes were added with 5 mL of inoculum and incubated for 24 h, at 37 °C. After this period, the broth with the culture was removed and each tube was subjected to three series of washes with 7 mL of sterilized RS. The tubes were then inverted onto absorbent paper to remove any remaining washing liquid. Then, 6 mL of RS was added to each tube, which was placed in an ultrasound bath (JP Selecta, Barcelona, Spain) at room temperature for 10 min to release the biofilm. Decimal dilutions were performed and inoculated by spreading onto TSA-YE plates. The CFU count was performed after 24 h and confirmed after 48 h of incubation, at 37 °C. After calculating the total adhesion surface area, the biofilm formation capacity of the isolates was expressed in log CFU/cm2.

2.3. Evaluation of Methicillin Resistance of Biofilm Produced on Polystyrene Surface (P24 Microplates)

Biofilms were produced on P24 polystyrene microplates as described in Section 2.2.1. For each isolate, six wells were inoculated and incubated at 37 °C, for 24 h. After incubation, three series of washes were performed for each well with RS solution and then 2 mL of methicillin at concentrations of 1, 2, 4, 8, 16, and 32 μg/mL were added. The sixth well was filled with 2 mL of sterilized distilled water. These microplates were again incubated at 37 °C for 24 h. After this period, the antibiotic solution was removed, and each well was washed with three series of 1.5 mL of RS. Thirty glass beads per well and 1 mL of RS were added. The microplate was vortexed for 2 min at maximum speed to remove biofilm from the surface of the wells. After shaking the plates, decimal dilutions were made, and the resulting suspensions were inoculated for CFU counting as described in Section 2.2.1. To calculate log reductions, the controls exposed to sterilized water were used. The minimum biofilm eradication concentration (MBEC) was defined as the lowest concentration of methicillin capable of reductions of more than 3 log (99.9% reduction of the bacterial population) [17].

2.4. Interpretation of Results and Data Analysis

Assays performed to determine MIC and MBC were always performed in duplicate. Thus, and after the respective incubation period, the wells of the recovery plate that showed visible turbidity in contrast to the non-inoculated controls were considered as positive results. When at least two of the three replicates showed turbidity, the result was considered positive (growth). When only one or none of the replicates showed turbidity, the result was considered negative (absence of growth).
The values obtained for viable cell counts in biofilms (CFU) were transformed into decimal logarithms. Compliance with data normality was determined using the Shapiro–Wilk test. The homogeneity of variance was determined by the Bartlett test. The ANOVA was performed, and the Scheffeé test was used to compare the means differences between Log CFU on the three surfaces used. Pearson correlation analyses were performed to determine the relationships between MIC and MBC, and between MIC and biofilm-forming capacity of the isolates. Comparison of results from the three surfaces was obtained by calculating Spearman rank correlation coefficients (r), and their relationships were explored subsequently through principal component analysis (PCA). All statistical analyses were performed at 5% in the R programming language (R, 2020).

3. Results

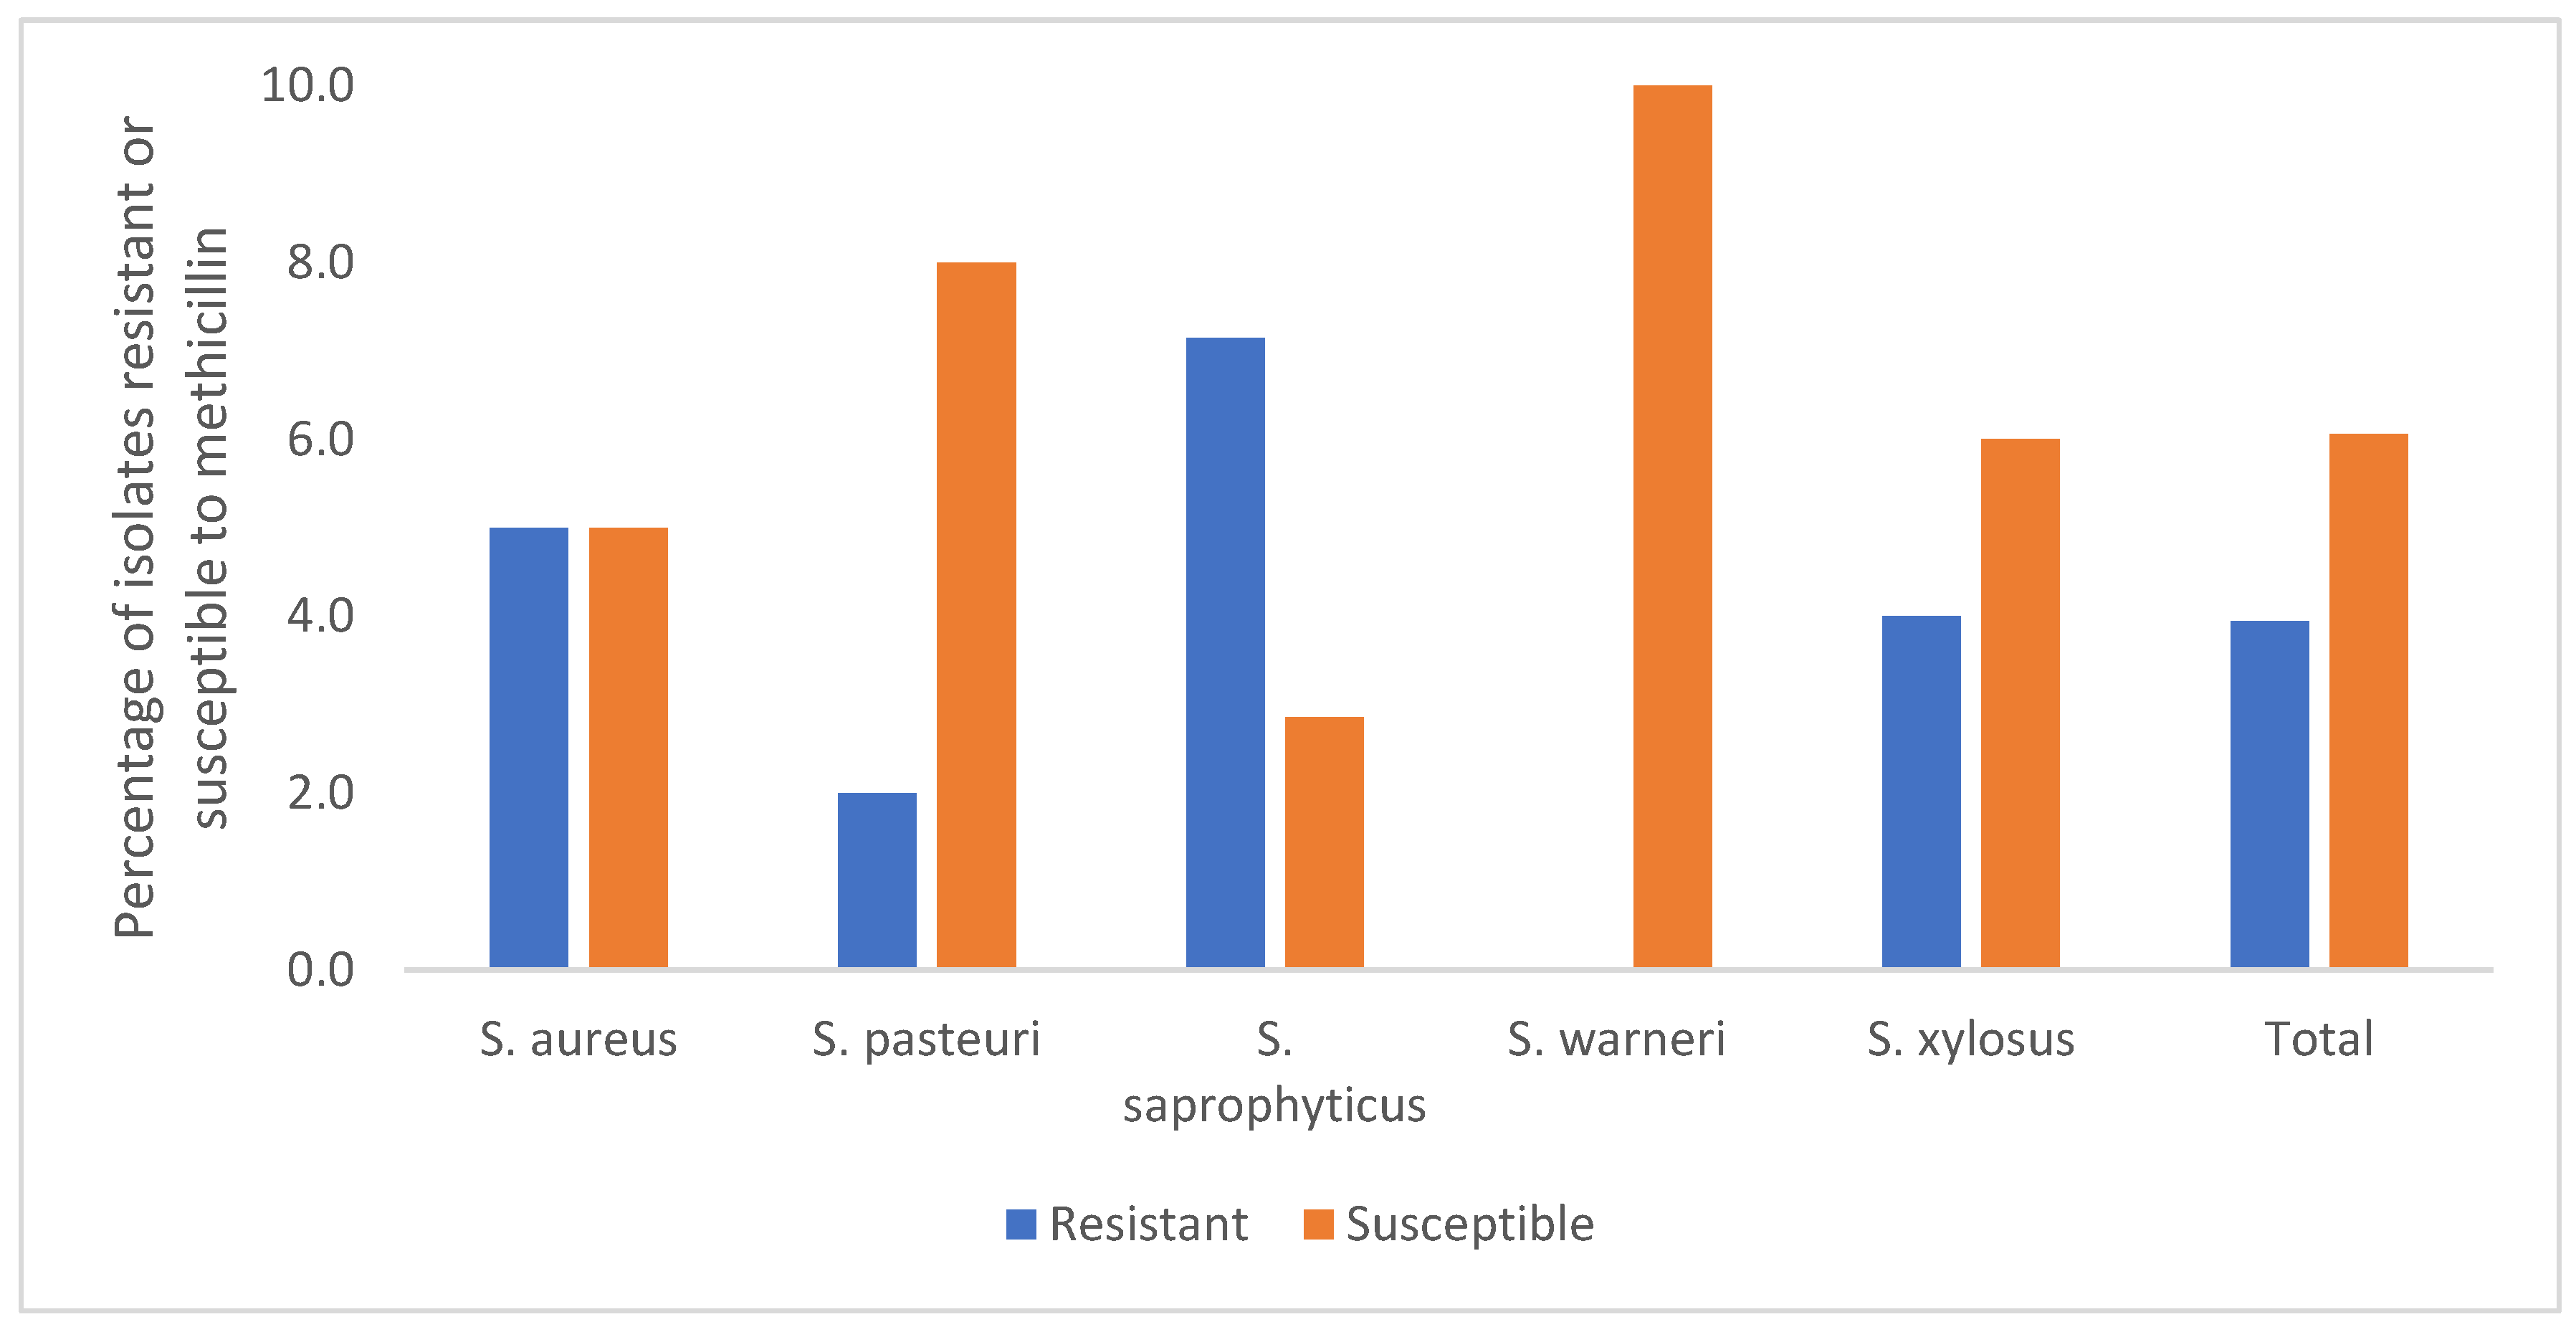
3.1. Minimum Inhibitory Concentration (MIC) and Minimum Bactericidal Concentration (MBC) of Methicillin

Thirty-four Staphylococcus isolates were evaluated for methicillin MIC and MBC. MIC values ranged from 1 µg/mL to over 32 µg/mL (Table 2). Of the 34 isolates tested in this study, 13 (38.2%) had MICs higher than 4 µg/mL (resistant to methicillin according to CLSI breakpoints) (Table 2). None of the seven S. warneri isolates was methicillin resistant (MICs ranging from 2 µg/mL and 4 µg/mL) (Figure 1 and Table 2). On the contrary, among S. aureus and S. saprophyticus, the highest percentage of resistance was found (50% and 71.4%, respectively) (Figure 1). The four isolates that showed MIC values higher than 32 µg/mL included two S. aureus, one S. pasteuri and one S. saprophyticus (Table 2).
MBC values followed the same trend as MIC. In 20 of the 34 isolates, the MBC value was twice the MIC value.
Table 2. MIC and MBC of methicillin for Staphylococcus isolates and MBC/MIC ratio.
Strain CodeSpeciesMIC (µg/mL)MBC (µg/mL)MBC/MIC
11S. aureus881
15S. aureus242
32S. aureus16322
47S. aureus242
48S. aureus441
49S. aureus482
50S. aureus32>32-
52S. aureus482
53S. aureus>32>32-
68S. aureus>32>32-
41S. pasteuri441
24S. pasteuri482
37S. pasteuri441
40S. pasteuri441
43S. pasteuri>32>32-
6S. saprophyticus242
13S. saprophyticus881
19S. saprophyticus>32>32-
26S. saprophyticus8162
31S. saprophyticus4164
35S. saprophyticus8162
59S. saprophyticus32>32-
1S. warneri482
18S. warneri242
9S. warneri482
10S. warneri242
20S. warneri221
22S. warneri242
34S. warneri242
21S. xylosus482
23S. xylosus122
28S. xylosus32>32-
30S. xylosus441
65S. xylosus32>32-
Figure 1. Methicillin resistance profile (%) of Staphylococcus isolates (susceptible—MIC ≤ 4 µg/mL: resistant—MIC > 4 µg/mL). At least two biological replicates were performed, with two technical replicates each.
Applsci 13 07725 g001

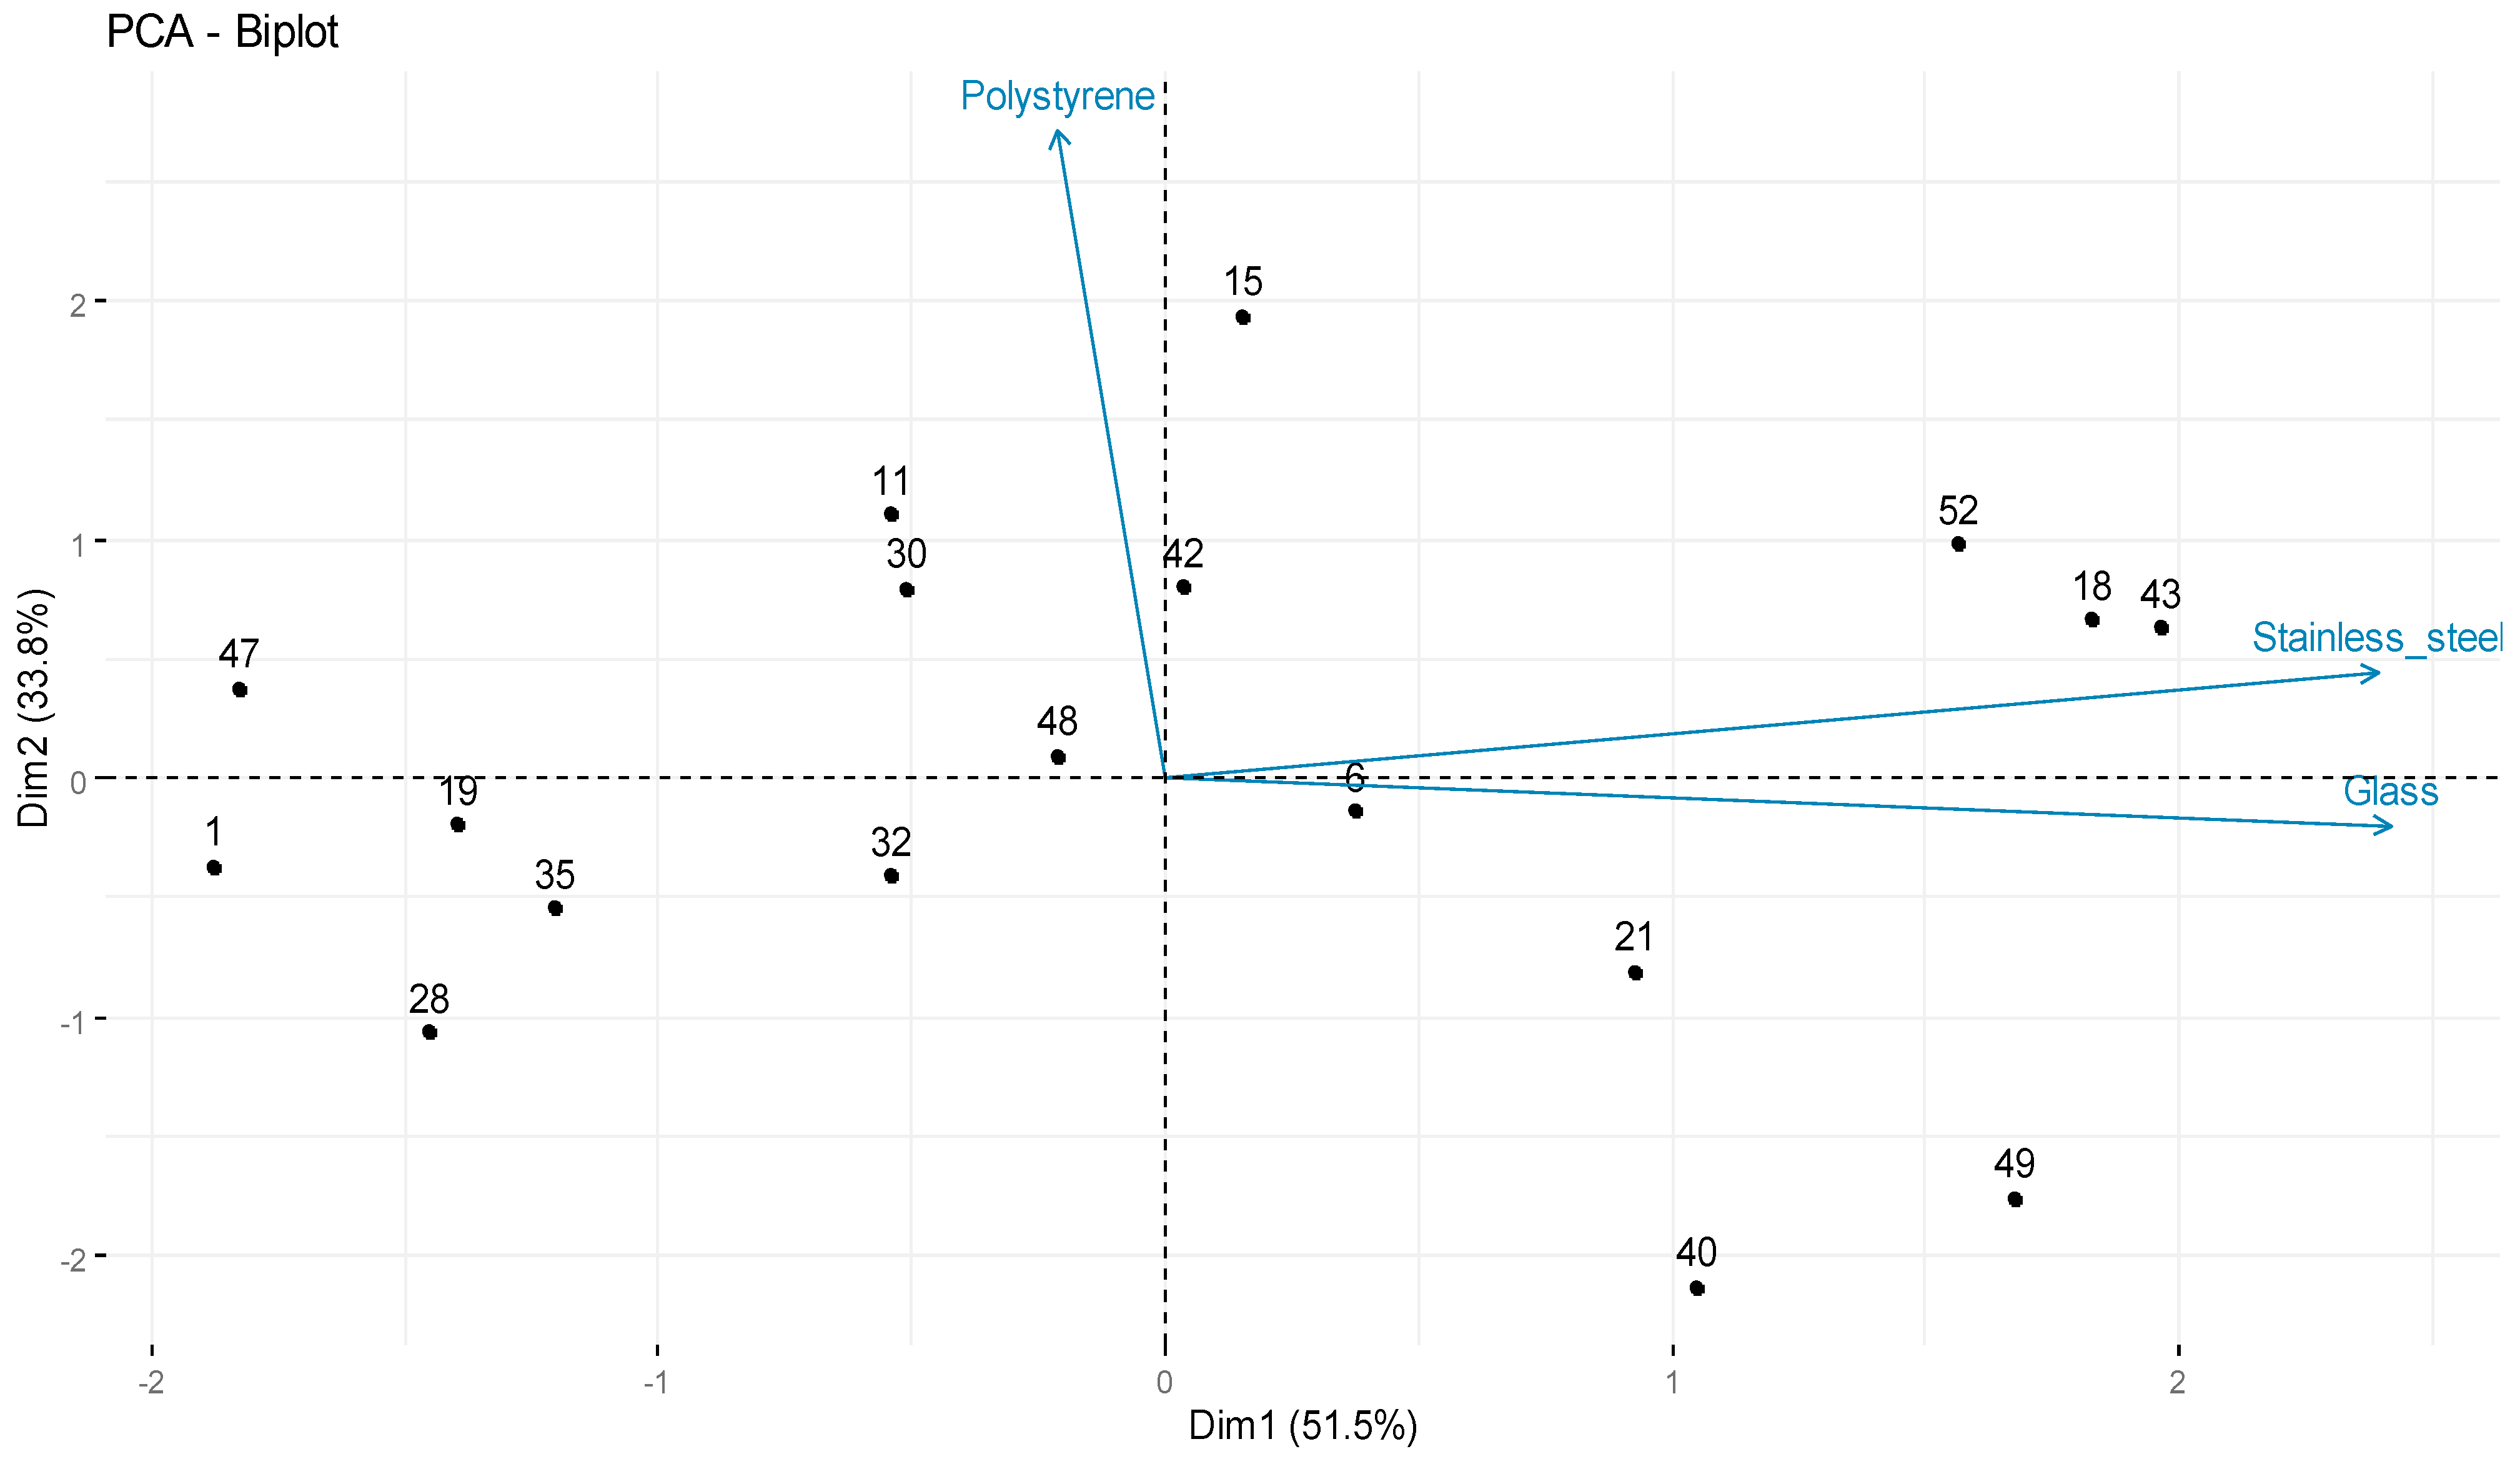
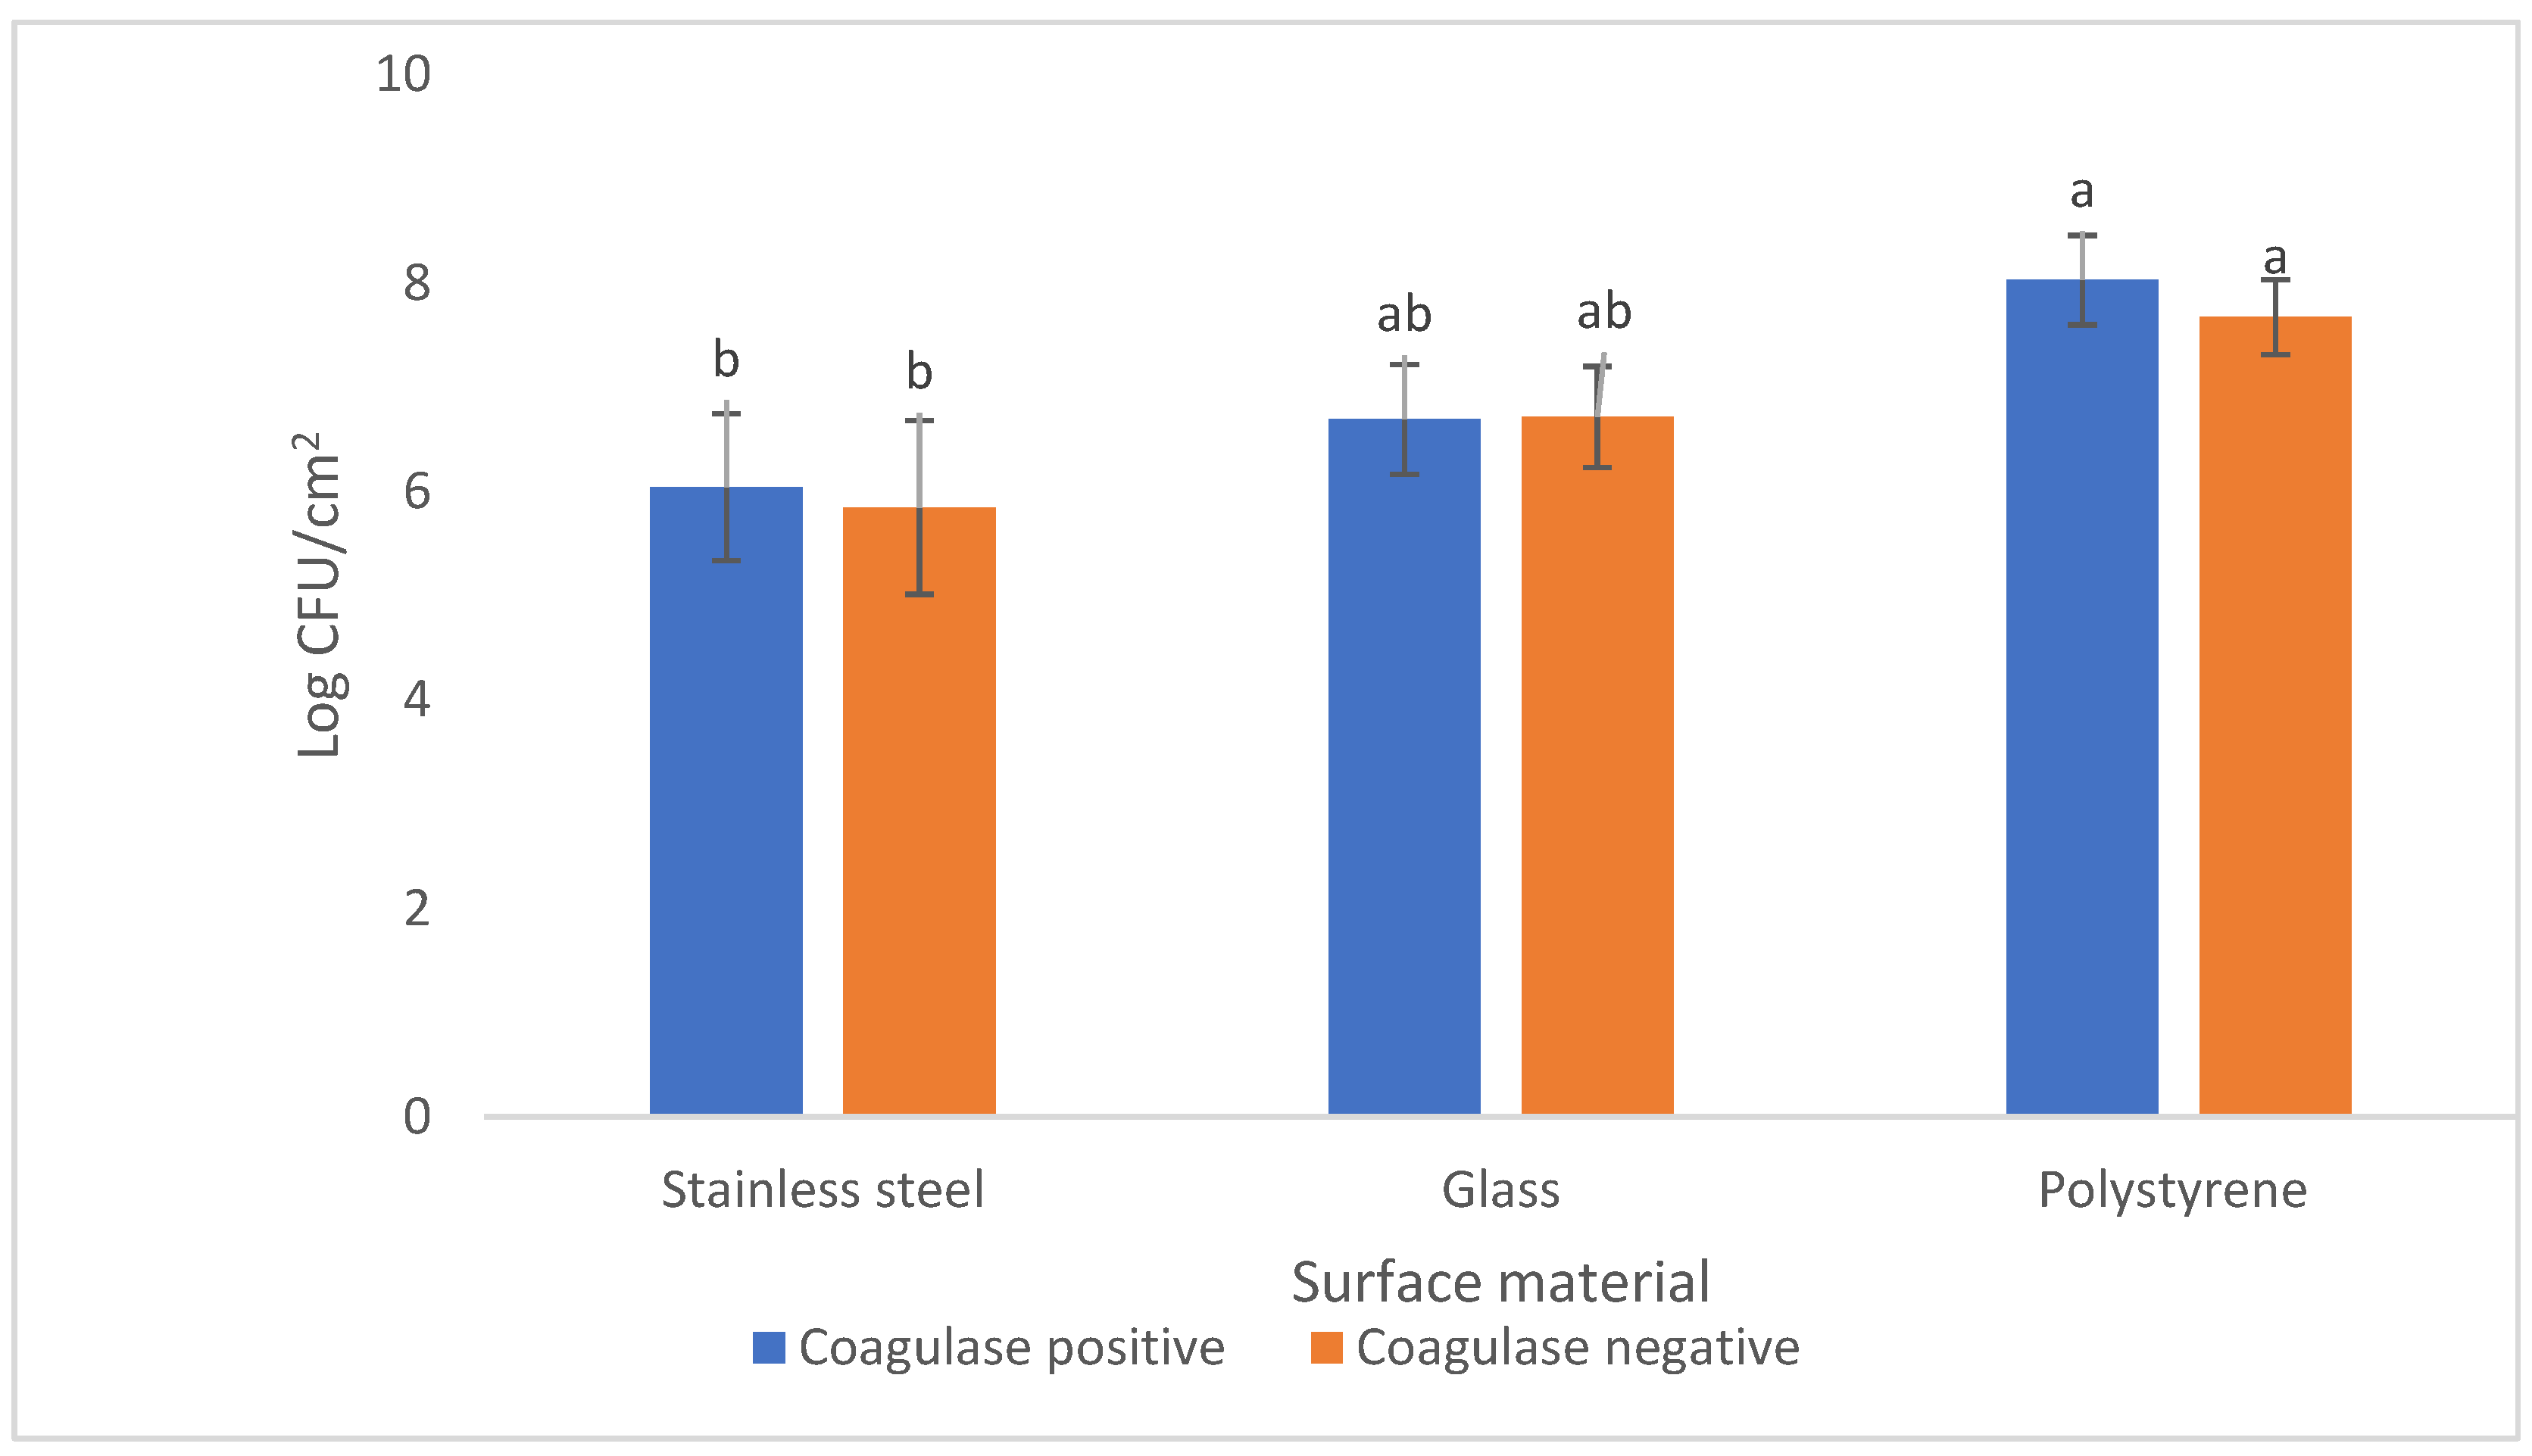
3.2. Evaluation of Biofilm-Forming Ability on Tree Types of Surfaces

In order to evaluate the ability of biofilm formation in three different materials, 18 isolates of Staphylococcus spp. (8 CPS and 10 CNS) were used. On stainless-steel, the biofilm-forming ability expressed in Log (CFU/cm2) ranged between 4.58 ± 0.02 and 6.86 ± 0.02 in CPS isolates, and between 4.30 ± 0.04 to 6.97 ± 0.01 in CNS isolates (Table 3).
In the glass, the results were between 6.30 ± 0.01 and 7.66 ± 0.01 log CFU/cm2 in the CPS isolates, and between 6.10 ± 0.01 and 7.67 ± 0.03 log CFU/cm2 in the CNS isolates (Table 3).
On polystyrene, the biofilm-forming ability varied between 7.04 ± 0.13 and 8.47 ± 0.53 log CFU/cm2 in CPS isolates, and between 6.68 ± 0.11 and 8.13 ± 0.05 log CFU/cm2 in SCN isolates (Table 3). The lowest and highest production capacity on polystyrene were verified for the species S. pasteuri where counts ranged from 6.64 log CFU/cm2 to 9.72 log CFU/cm2, followed by S. xylosus with counts ranging from 7.53 log CFU/cm2 to 9.4 log CFU/cm2) (Table 3). S. pasteuri and S. saprophyticus were the species with the highest biofilm productivity, with mean counts above 8 log CFU/cm2 (Table 3).
Table 3. Biofilm-forming ability of the Staphylococcus isolates on three types of surfaces (stainless steel, glass, and polystyrene).
Isolate CodeSpeciesBiofilm-Forming Ability (log CFU/cm−2)
Stainless SteelGlassPolystyrene
11S. aureus4.98 ± 0.016.99 ± 0.048.32 ± 0.02
15S. aureus6.86 ± 0.016.30 ± 0.028.47 ± 0.53
32S. aureus5.85 ± 0.066.36 ± 0.097.56 ± 0.11
42S. aureus6.26 ± 0.076.56 ± 0.078.05 ± 0.19
47S. aureus4.58 ± 0.026.30 ± 0.018.00 ± 0.01
49S. aureus6.24 ± 0.077.63 ± 0.047.04 ± 0.13
53S. aureus6.25 ± 0.017.66 ± 0.018.20 ± 0.47
48S. aureus5.53 ± 0.016.83 ± 0.017.83 ± 0.07
1S. warneri4.30 ± 0.046.41 ± 0.037.72 ± 0.04
18S. warneri6.49 ± 0.097.67 ± 0.038.04 ± 0.02
6S. saprophyticus6.32 ± 0.016.72 ± 0.107.66 ± 0.03
19S. saprophyticus5.32 ± 0.026.10 ± 0.017.68 ± 0.03
35S. saprophyticus4.85 ± 0.066.53 ± 0.017.60 ± 0.09
21S. xylosus6.28 ± 0.017.11 ± 0.017.40 ± 0.16
28S. xylosus4.85 ± 0.066.33 ± 0.027.37 ± 0.05
30S. xylosus5.41 ± 0.036.72 ± 0.038.13 ± 0.05
40S. pasteuri6.28 ± 0.017.13 ± 0.016.85 ± 0.11
43S. pasteuri6.97 ± 0.017.46 ± 0.017.97 ± 0.12
The comparison between means for CPS (S. aureus) and for CNS (the other species) were not significantly different (p > 0.05) on the three surfaces used. However, when comparing the averages obtained for the biofilm-forming ability of the 18 isolates, the values obtained (log CFU/cm2) in polystyrene were significantly higher (p < 0.05) than those obtained with the isolates on stainless steel (Figure 2).
The count values obtained on the three surfaces (log CFU/cm2) by the 18 isolates were transformed into rank orders and evaluated by principal component analysis (PCA) (Figure 3). The initial three-dimensional space (three variables–three surfaces) was reduced to a plane (Dim1/Dim2) defined by the two principal components that account for 85.3% of the variability of the data (51.5% in the first component and 33.8% in the second component).
When the 18 isolates were projected in this plane (Dim1/Dim2), the biofilm-forming ability was not consistently determined on the three tested surfaces. The capacity for biofilm formation on polystyrene is positively correlated with Dim2, indicating that higher values of Dim2 correspond, in general, to an increase in the biofilm-forming ability of the isolates. Likewise, variations in the opposite direction indicate a decrease in the biofilm forming-ability of the isolates. This can be illustrated by isolates 15 (S. aureus) and isolate 30 (S. xylosus) as good biofilm producers and by isolates 49 (S. aureus) and isolate 40 (S. pasteuri) as poor biofilm producers (Figure 3).
Data from the assessment of the biofilm-forming ability of the 18 isolates on glass and stainless steel are positively correlated with each other (r = 0.54, Table 4) and with Dim1 (Figure 3), indicating that higher Dim1 values correspond, in general, to an increase in the capacity of biofilm formation of the isolates. Likewise, variations in the opposite direction indicate a decrease in the biofilm formation capacity of the isolates. This can be illustrated by isolates 18 (S. warneri) and 43 (S. pasteuri) as good biofilm producers and by isolates 28 (S. xylosus) and 47 (S. aureus) as poor biofilm producers (Figure 3).
On the other hand, the enumeration method based on cell counts on stainless steel surfaces is positively correlated with the two components, Dim1 and Dim2, which indicates that higher values of Dim1 added to the contribution of Dim2 correspond to an increase in the ability to form biofilm (isolate 43—S. pasteuri) (Figure 3).
Figure 3. Principal component analysis of data from enumeration of cells from biofilms of the 18 Staphylococcus isolates on the three surfaces used: stainless steel (coupons); glass (test tubes), and polystyrene (24−well polystyrene microplates−24 microplates).
Applsci 13 07725 g003
Table 4. Pairwise Spearman rank order correlation coefficient (r) for biofilm analysis on three different surfaces.
GlassPolystyrene
Stainless steelr = 0.54r = 0.04
p-value = 0.02p-value = 0.86
Polystyrener = −0.09
p-value = 0.72

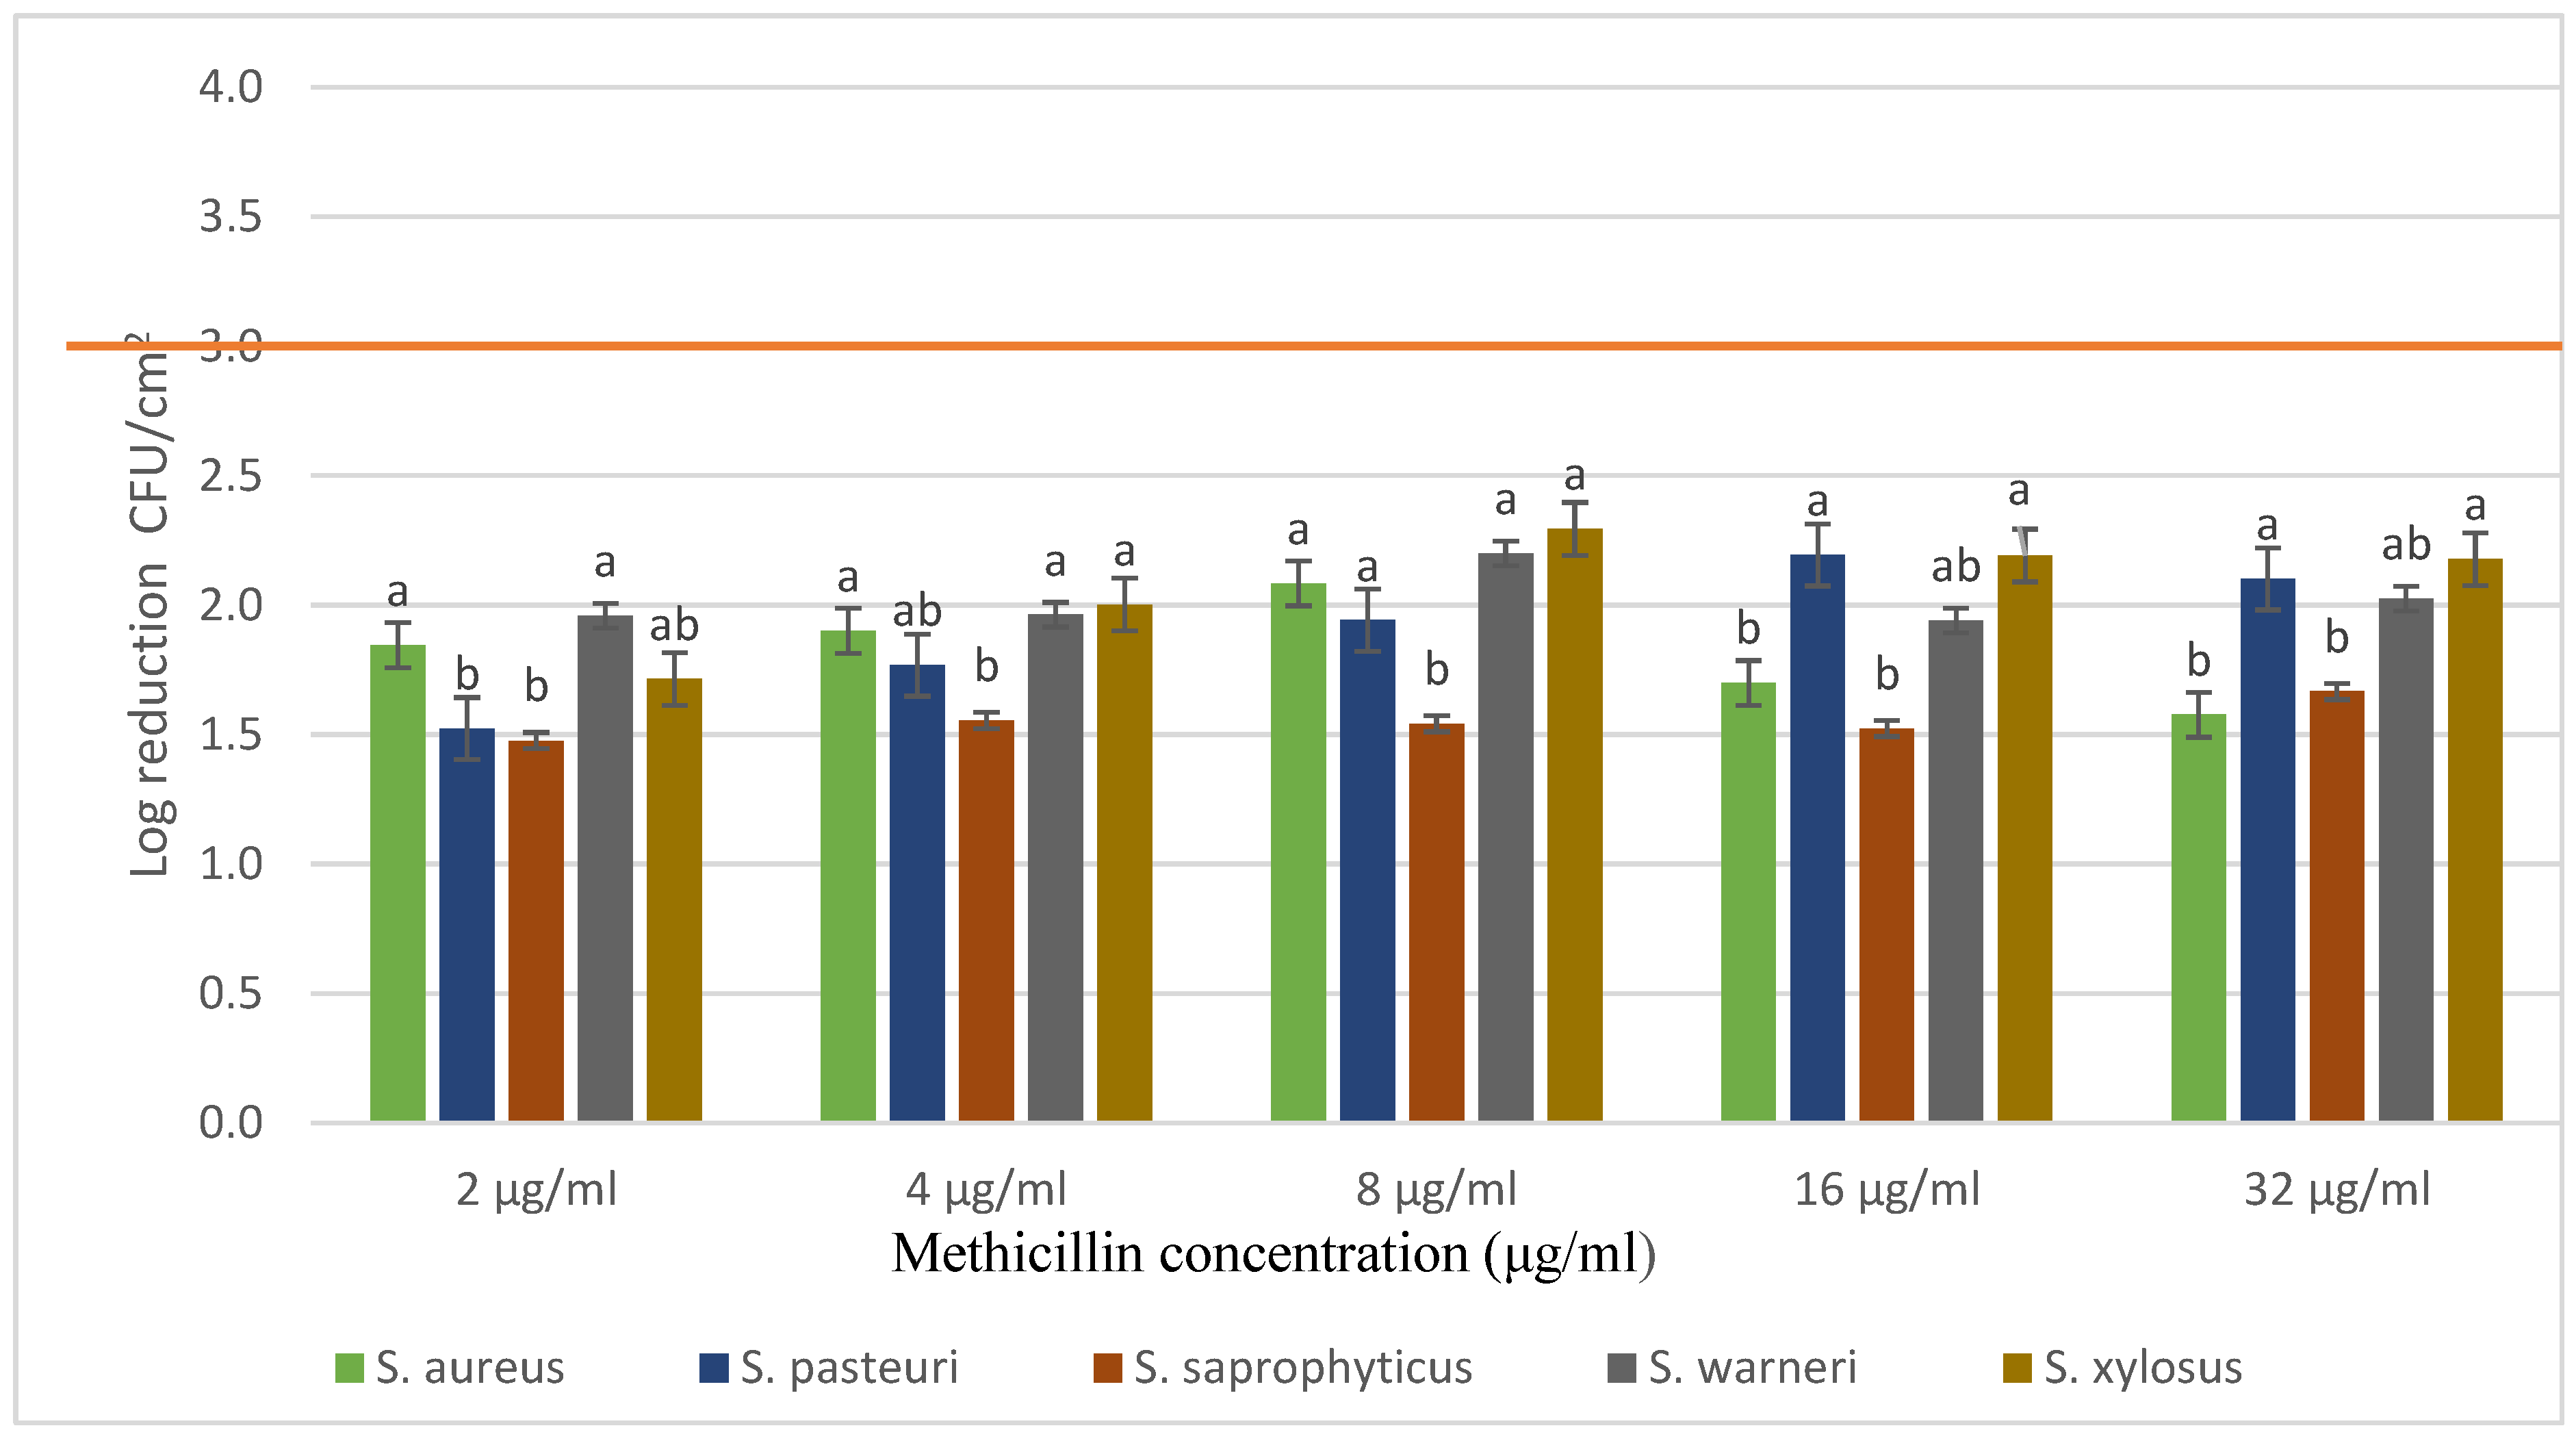
3.3. Evaluation of Methicillin Resistance of Biofilms Produced on Polystyrene Surface (P24 Microplates)

Regarding the evaluation of the susceptibility of biofilms to methicillin, high resistance was observed with all methicillin concentrations tested (up to 32 µg/mL).
Figure 4 shows the logarithmic reduction of biofilm after exposure to the different concentrations of methicillin used. In general, reductions ranging from 1.5 to 2.3 Log CFU/cm2 were observed. The species S. saprophyticus showed reductions of less than 1.6 Log CFU/cm2 with all concentrations tested. S. warneri isolates showed no difference in reduction with the different methicillin concentrations tested. S. aureus showed reductions of less than 1.7 log CFU/cm2, with high concentrations of the antibiotic (16 and 32 µg/mL). For S. xylosus, log reductions varied as a function of antibiotic concentration, from 2 µg/mL to 8 µg/mL. With the highest concentrations (16 and 32 µg/mL) of methicillin there was no difference in the logarithmic reductions of the isolates. The greatest reduction in viable cells observed were obtained in S. warneri and S. xylosus species with 8 µg/mL. On the other hand, the smallest reductions (greater difficulty in eradicating biofilms) were observed in the species S. saprophyticus (close to 1.5 Log CFU/cm2 with all methicillin concentrations tested).
The antibiotic would be considered effective if a 3-log reduction in viable bacterial counts had been achieved. For each methicillin concentration tested, different letters in the columns indicate significant differences (p < 0.05). At least two biological replicates were performed, with two technical replicates each.

4. Discussion

In this study, the ability of 34 Staphylococcus isolates recovered from RTE street foods to form biofilms was evaluated. This set included coagulase positive Staphylococcus (CPS) as well as coagulase negative (CNS). The CNS have emerged as pathogens with risk potential for humans and animals similar to coagulase-positive Staphylococcus (CPS) [12,18]. These isolates were selected from a group of 70 Staphylococci previously characterized by antibiotic resistance profile and presence of virulence and antibiotic resistance genes [12]. Some of these isolates (namely, S. aureus isolate 68, S. saprophyticus isolate 19, and S. xylosus isolate 65) are not only multidrug-resistant but also present more than one of the seven virulence genes investigated most associated with their pathogenicity.
Three different surfaces were used, namely stainless steel, polystyrene, and glass surface. The methodology used was based on the removal of aggregated cells and enumeration of CFUs after plating (log CFU/cm2). Of the three tested surfaces, polystyrene was the surface on which both CPS and CNS showed the highest biofilm production. However, for each surface tested, no statistical differences were found between CPS and CNS isolates. There was a high and significant correlation between stainless steel and glass counts. This indicates that these two surfaces have similar properties related to biofilm adhesion. On the other hand, there was a low correlation between stainless steel and polystyrene, and between glass and polystyrene. This indicates differences in biofilm adhesion between polystyrene and the other two materials, glass, and stainless steel.
Polystyrene is more hydrophobic and has low surface energy, while stainless steel is moderately hydrophilic and has a slight negative charge [7]. Therefore, polystyrene surfaces, which are naturally hydrophobic, promote greater adhesion of microbial cells when compared to other hydrophilic surfaces, such as stainless steel and glass [19]. In a study using S. epidermidis, Koseki et al. (2014) [20] showed a decrease in biofilm formation on the cobalt-chromium molybdenum (Co-Cr-Mo) alloy, which was attributed to the increase in hydrophilicity in this alloy [20,21]. However, other studies have shown opposite results. For instance, the yeast C. albicans has been shown to have less metabolic activity on polycarbonate and stainless steel (hydrophilic surfaces) compared to Teflon (hydrophobic surface) [22]. Similarly, some studies claim that hydrophilicity has only trace impact on biofilm formation, as shown by the fact that S. epidermidis biofilm formation was not significantly altered by differences in surface wettability [23]. Another determining factor that influences cell adhesion and biofilm production are the electrostatic interactions established between the surface and the cells due to the formation of an electrostatic double layer on each part [24]. The formation of this double layer depends on the ionic strength and the pH value of the surrounding medium. For example, S. aureus has been described as adhering more to positively charged polymeric surfaces than to negatively charged ones [24,25]. This observation corroborates our results, in which a greater production of biofilm was observed on polystyrene surfaces than on glass and stainless steel.
As already mentioned, the isolates used in this study were previously characterized in terms of their antibiotic resistance profile as having a high level of resistance to β-lactam and to non-β-lactam antibiotics (such as vancomycin, erythromycin, tetracycline, and trimethoprim/sulfamethoxazole) [12]. In the present work, the β-lactam antibiotic, methicillin, had MICs ranging from 1 µg/mL to over 32 µg/mL, with 13 of the 34 isolates having MICs greater than 4 µg/mL (38% of methicillin resistant isolates). In 20 of the 34 isolates, the MBC value was twice the MIC value. In fact, most antibiotics show this ratio between MBC and MIC [26].
Regarding the biofilms formed, it was not possible to determine the concentration of methicillin that promotes their removal. Several factors have been suggested to explain the extraordinary resistance of biofilm bacteria to antibiotics. Among them are the low metabolic rates and reduced growth rates exhibited by biofilm bacteria, particularly those in the innermost layers. All together with the activation of antibiotic resistance mechanisms can make biofilm cells between 10 and 1000 times more resistant than their planktonic counterparts [27,28]. The gene that encodes resistance to methicillin resistance mecA was previously identified in the Staphylococcus isolates used in this study [12]. This gene is located in a mobile genetic element called SCCmec (staphylococcal cassette chromosome mec) and encodes a modified penicillin-binding protein called PBP2a or PBP2’ (penicillin-binding protein 2a or 2-prime) [29]. The bacterial community of the biofilm can exhibit altered gene expression, including the mecA. This altered expression can lead to an increase in the production of resistance proteins such as PBP2a that deactivate or bind to antibiotics, reducing their effectiveness [30]. Consequently, even in the presence of high methicillin concentrations, the methicillin-resistant S. aureus (MRSA) and the methicillin-resistant Staphylococcus biofilm community in general can continue to synthesize their cell wall, which allows it to survive and reproduce.
In this study, the maximum biofilm removal (reduction of 2 log CFU/cm2) was observed with 8 µg of methicillin/mL. The exception was the species S. pasteuri (reduction of 1.5 log CFU/cm2), although this was one of the species that showed the highest susceptibility to methicillin (80% of the isolates with MIC = 4 µg/mL). These results suggest that the higher concentration of methicillin may limit its own penetration into the biofilm matrix. However, several authors [31,32,33,34] have suggested that reduced penetration of antibiotics cannot fully explain the resistance of biofilms to antibiotics. Other mechanisms that may explain the resistance and tolerance of biofilms to antibiotics may be related to persistent cells and adaptive responses [35]. Antibiotics such as fluoroquinolones, rifampin, and ampicillin have good penetration into the biofilm matrix, although they fail to eradicate bacteria from the biofilm (log reductions < 3 log CFU/cm2) [36]. Moreover, even in the case of compounds with low diffusion within biofilms, they all end up reaching the bacteria in the biofilm, although with different times of action and efficiencies [37]. Hoiby et al. [38] suggested the use of a combination of several strategies for the management of S. aureus biofilms, including early physical removal of colonized materials or local administration of high doses of antibacterial chemotherapy.
The occurrence of biofilm-forming strains in the food environment is of significant relevance, particularly when considering species that are multidrug-resistant, as was the case in this study. In the food environment, biofilms can develop on various equipment and surfaces, such as food processing machinery, utensils, and storage containers. These biofilms provide a favorable environment for the growth and survival of pathogenic bacteria, including S. aureus [35,39]. Furthermore, the presence of virulence genes in multidrug-resistance biofilm-forming strains enhances their pathogenic potential. This combination of multidrug resistance and virulence genes increases the risk of food contamination and poses a significant threat to public health.

5. Conclusions

The results of this study show the ability of different species of foodborne Staphylococcus, coagulase positive (CPS), and coagulase negative (CNS) to equally produce biofilms on different surfaces. As these biofilms are resistant to high concentrations of methicillin, the spread of these food-borne biofilm-forming staphylococci to clinical environments with the formation of biofilms on medical devices can lead to the occurrence of difficult-to-treat bacteremia, which can culminate in fatal septicemia. Our study highlights that biofilm formation depends not only on the characteristics of the strains used, as observed by the variability of values obtained for different S. aureus strains, but also on the physical and chemical properties of the surface materials employed.

Author Contributions

Conceptualization, A.S., M.M.-F. and L.B.; methodology, A.S., B.A.M., M.M.-F. and L.B.; validation, A.S., B.A.M., M.M.-F. and L.B.; formal analysis, A.S., B.A.M., J.C. and M.d.S.; investigation, A.S., J.C., M.d.S., M.M.-F. and L.B.; writing—original draft preparation, A.S., J.C. and M.d.S.; writing—review and editing, A.S., M.M.-F. and L.B.; supervision, M.M.-F. and L.B.; funding acquisition, M.M.-F. and L.B. All authors have read and agreed to the published version of the manuscript.

Funding

This work was supported by national funds through FCT—Foundation for Science and Technology, I.P., under the scholarship grant with the reference PRT/BD/151521/2021, and institutional support of project UIDB/04129/2020 of LEAF-Linking Landscape, Environment, Agriculture and Food, Research Unit.

Institutional Review Board Statement

Not applicable.

Informed Consent Statement

Not applicable.

Data Availability Statement

The authors confirm that the data supporting the findings of this study are available within the article.

Conflicts of Interest

The authors declare no conflict of interest.

References

  1. Neopane, P.; Nepal, H.P.; Shrestha, R.; Uehara, O.; Abiko, Y. In Vitro Biofilm Formation by Staphylococcus aureus Isolated from Wounds of Hospital-Admitted Patients and Their Association with Antimicrobial Resistance. Int. J. Gen. Med. 2018, 11, 25. [Google Scholar] [CrossRef] [PubMed]
  2. Gowrishankar, S.; Duncun Mosioma, N.; Karutha Pandian, S. Coral-Associated Bacteria as a Promising Antibiofilm Agent against Methicillin-Resistant and -Susceptible Staphylococcus aureus Biofilms. Evid. Based Complement. Altern. Med. 2012, 2012, 16. [Google Scholar] [CrossRef] [PubMed] [Green Version]
  3. Karygianni, L.; Ren, Z.; Koo, H.; Thurnheer, T. Biofilm Matrixome: Extracellular Components in Structured Microbial Communities. Trends Microbiol. 2020, 28, 668–681. [Google Scholar] [CrossRef] [PubMed]
  4. Arciola, C.R.; Campoccia, D.; Ravaioli, S.; Montanaro, L.; Vasil, M.L.; Otto, M. Polysaccharide Intercellular Adhesin in Biofilm: Structural and Regulatory Aspects. Front. Cell. Infect. Microbiol. 2015, 5, 7. [Google Scholar] [CrossRef] [Green Version]
  5. Gajewska, J.; Chajecka-Wierzchowska, W. Biofilm Formation Ability and Presence of Adhesion Genes among Coagulase-Negative and Coagulase-Positive Staphylococci Isolates from Raw Cow’s Milk. Pathogens 2020, 9, 654. [Google Scholar] [CrossRef]
  6. Peeters, E.; Nelis, H.J.; Coenye, T. Comparison of Multiple Methods for Quantification of Microbial Biofilms Grown in Microtiter Plates. J. Microbiol. Methods 2008, 72, 157–165. [Google Scholar] [CrossRef] [Green Version]
  7. Lourenço, A.; Rego, F.; Brito, L.; Frank, J.F. Evaluation of Methods to Assess the Biofilm-Forming Ability of Listeria monocytogenes. J. Food Prot. 2012, 75, 1411–1417. [Google Scholar] [CrossRef]
  8. Azeredo, J.; Azevedo, N.F.; Briandet, R.; Cerca, N.; Coenye, T.; Rita Costa, A.; Desvaux, M.; di Bonaventura, G.; Hébraud, M.; Jaglic, Z.; et al. Critical Review on Biofilm Methods. Crit. Rev. Microbiol. 2017, 43, 313–351. [Google Scholar] [CrossRef] [Green Version]
  9. Merritt, J.H.; Kadouri, D.E.; O’Toole, G.A. Growing and Analyzing Static Biofilms. Curr. Protoc. Microbiol. 2006, 22, 1B.1.1–1B.1.18. [Google Scholar] [CrossRef] [Green Version]
  10. Chung, P.Y.; Toh, Y.S. Anti-Biofilm Agents: Recent Breakthrough against Multi-Drug Resistant Staphylococcus aureus. Pathog. Dis. 2014, 70, 231–239. [Google Scholar] [CrossRef] [Green Version]
  11. Salamandane, A.; Silva, A.C.; Brito, L.; Malfeito-Ferreira, M. Microbiological Assessment of Street Foods at the Point of Sale in Maputo (Mozambique). Food Qual. Saf. 2021, 5, fyaa030. [Google Scholar] [CrossRef]
  12. Salamandane, A.; Oliveira, J.; Coelho, M.; Ramos, B.; Cunha, M.V.; Malfeito-Ferreira, M.; Brito, L. Enterotoxin- and Antibiotic-Resistance-Encoding Genes Are Present in Both Coagulase-Positive and Coagulase-Negative Foodborne Staphylococcus Strains. Appl. Microbiol. 2022, 2, 367–380. [Google Scholar] [CrossRef]
  13. ISO 6888-1 ISO 6888-1; Microbiology of Food and Animal Feeding Stuffs—Horizontal Method for the Enumeration of Coagulase-Positive Staphylococci (Staphylococcus aureus and Other Species)—Part 1: Technique Using Baird-Parker Agar Medium—Amendmen. International Standard: Geneva, Switzerland, 1999.
  14. ISO 6888-2 ISO 6888-2; Microbiology of Food and Animal Feeding Stuffs—Horizontal Method for the Enumeration of Coagulase-Positive and Other Species)—Staphylococci (Staphylococcus aureus Part 2: Technique Using Rabbit Plasma Fibrinogen Agar Medium. International Standard: Geneva, Switzerland, 2008.
  15. Magiorakos, A.P.; Srinivasan, A.; Carey, R.B.; Carmeli, Y.; Falagas, M.E.; Giske, C.G.; Harbarth, S.; Hindler, J.F.; Kahlmeter, G.; Olsson-Liljequist, B.; et al. Multidrug-Resistant, Extensively Drug-Resistant and Pandrug-Resistant Bacteria: An International Expert Proposal for Interim Standard Definitions for Acquired Resistance. Clin. Microbiol. Infect. 2012, 18, 268–281. [Google Scholar] [CrossRef] [Green Version]
  16. Costa, A.; Bertolotti, L.; Brito, L.; Civera, T. Biofilm Formation and Disinfectant Susceptibility of Persistent and Non-Persistent Listeria monocytogenes Isolates from Gorgonzola Cheese Processing Plants. Foodborne Pathog. Dis. 2016, 13, 602–609. [Google Scholar] [CrossRef] [Green Version]
  17. Raad, I.; Darouiche, R.; Hachem, R.; Sacilowski, M.; Bodey, G.P. Antibiotics and Prevention of Microbial Colonization of Catheters. Antimicrob. Agents Chemother. 1995, 39, 2397–2400. [Google Scholar] [CrossRef] [Green Version]
  18. Kumari, H.; Chakraborti, T.; Singh, M.; Chakrawarti, M.K.; Mukhopadhyay, K. Prevalence and Antibiogram of Coagulase Negative Staphylococci in Bioaerosols from Different Indoors of a University in India. BMC Microbiol. 2020, 20, 211. [Google Scholar] [CrossRef]
  19. Kim, J.-H.; Lee, E.-S.; Song, K.-J.; Kim, B.-M.; Ham, J.-S.; Oh, M.-H. Development of Desiccation-Tolerant Probiotic Biofilms Inhibitory for Growth of Foodborne Pathogens on Stainless Steel Surfaces. Foods 2022, 11, 831. [Google Scholar] [CrossRef]
  20. Koseki, H.; Yonekura, A.; Shida, T.; Yoda, I.; Horiuchi, H.; Morinaga, Y.; Yanagihara, K.; Sakoda, H.; Osaki, M.; Tomita, M. Early Staphylococcal Biofilm Formation on Solid Orthopaedic Implant Materials: In Vitro Study. PLoS ONE 2014, 9, e107588. [Google Scholar] [CrossRef]
  21. Wagner, C.; Aytac, S.; Hänsch, G.M. Biofilm Growth on Implants: Bacteria Prefer Plasma Coats. Int. J. Artif. Organs 2011, 34, 811–817. [Google Scholar] [CrossRef]
  22. Frade, J.P.; Arthington-Skaggs, B.A. Effect of Serum and Surface Characteristics on Candida albicans Biofilm Formation. Mycoses 2011, 54, e154–e162. [Google Scholar] [CrossRef]
  23. Subbiahdoss, G.; Grijpma, D.W.; van der Mei, H.C.; Busscher, H.J.; Kuijer, R. Microbial Biofilm Growth versus Tissue Integration on Biomaterials with Different Wettabilities and a Polymer-Brush Coating. J. Biomed. Mater. Res. A 2010, 94, 533–538. [Google Scholar] [CrossRef] [PubMed]
  24. Giaouris, E.; Heir, E.; Hébraud, M.; Chorianopoulos, N.; Langsrud, S.; Møretrø, T.; Habimana, O.; Desvaux, M.; Renier, S.; Nychas, G.J. Attachment and Biofilm Formation by Foodborne Bacteria in Meat Processing Environments: Causes, Implications, Role of Bacterial Interactions and Control by Alternative Novel Methods. Meat Sci. 2014, 97, 298–309. [Google Scholar] [CrossRef] [PubMed]
  25. Frank, J.F. Microbial Attachment to Food and Food Contact Surfaces. Adv. Food Nutr. Res. 2001, 43, 319–370. [Google Scholar] [CrossRef] [PubMed]
  26. Macia, M.D.; Rojo-Molinero, E.; Oliver, A. Antimicrobial Susceptibility Testing in Biofilm-Growing Bacteria. Clin. Microbiol. Infect. 2014, 20, 981–990. [Google Scholar] [CrossRef] [Green Version]
  27. Silva, V.; Correia, E.; Pereira, J.E.; González-Machado, C.; Capita, R.; Alonso-Calleja, C.; Igrejas, G.; Poeta, P. Exploring the Biofilm Formation Capacity in S. pseudintermedius and Coagulase-Negative Staphylococci Species. Pathogens 2022, 11, 689. [Google Scholar] [CrossRef]
  28. Kranjec, C.; Morales Angeles, D.; Torrissen Mårli, M.; Fernández, L.; García, P.; Kjos, M.; Diep, D.B. Staphylococcal Biofilms: Challenges and Novel Therapeutic Perspectives. Antibiotics 2021, 10, 131. [Google Scholar] [CrossRef]
  29. Miragaia, M. Factors Contributing to the Evolution of Meca-Mediated β-Lactam Resistance in Staphylococci: Update and New Insights from Whole Genome Sequencing (WGS). Front. Microbiol. 2018, 9, 2723. [Google Scholar] [CrossRef] [Green Version]
  30. Shalaby, M.A.W.; Dokla, E.M.E.; Serya, R.A.T.; Abouzid, K.A.M. Penicillin Binding Protein 2a: An Overview and a Medicinal Chemistry Perspective. Eur. J. Med. Chem. 2020, 199, 112312. [Google Scholar] [CrossRef]
  31. Zheng, Z.; Stewart, P.S. Penetration of Rifampin through Staphylococcus epidermidis Biofilms. Antimicrob. Agents Chemother. 2002, 46, 900–903. [Google Scholar] [CrossRef] [Green Version]
  32. Rodríguez-Martínez, J.M.; Ballesta, S.; Pascual, Á. Activity and Penetration of Fosfomycin, Ciprofloxacin, Amoxicillin/Clavulanic Acid and Co-Trimoxazole in Escherichia Coli and Pseudomonas aeruginosa Biofilms. Int. J. Antimicrob. Agents 2007, 30, 366–368. [Google Scholar] [CrossRef]
  33. Walters, M.C.; Roe, F.; Bugnicourt, A.; Franklin, M.J.; Stewart, P.S. Contributions of Antibiotic Penetration, Oxygen Limitation, and Low Metabolic Activity to Tolerance of Pseudomonas aeruginosa Biofilms to Ciprofloxacin and Tobramycin. Antimicrob. Agents Chemother. 2003, 47, 317–323. [Google Scholar] [CrossRef] [Green Version]
  34. Anderl, J.N.; Franklin, M.J.; Stewart, P.S. Role of Antibiotic Penetration Limitation in Klebsiella Pneumoniae Biofilm Resistance to Ampicillin and Ciprofloxacin. Antimicrob. Agents Chemother. 2000, 44, 1818–1824. [Google Scholar] [CrossRef] [Green Version]
  35. Singh, S.; Singh, S.K.; Chowdhury, I.; Singh, R. Understanding the Mechanism of Bacterial Biofilms Resistance to Antimicrobial Agents. Open Microbiol. J. 2017, 11, 53–62. [Google Scholar] [CrossRef] [Green Version]
  36. Lebeaux, D.; Ghigo, J.-M.; Beloin, C. Biofilm-Related Infections: Bridging the Gap between Clinical Management and Fundamental Aspects of Recalcitrance toward Antibiotics. Microbiol. Mol. Biol. Rev. 2014, 78, 510–543. [Google Scholar] [CrossRef] [Green Version]
  37. Maya, I.D.; Carlton, D.; Estrada, E.; Allon, M. Treatment of Dialysis Catheter–Related Staphylococcus aureus Bacteremia With an Antibiotic Lock: A Quality Improvement Report. Am. J. Kidney Dis. 2007, 50, 289–295. [Google Scholar] [CrossRef]
  38. Høiby, N.; Bjarnsholt, T.; Moser, C.; Bassi, G.L.; Coenye, T.; Donelli, G.; Hall-Stoodley, L.; Holá, V.; Imbert, C.; Kirketerp-Møller, K.; et al. ESCMID Guideline for the Diagnosis and Treatment of Biofilm Infections 2014. Clin. Microbiol. Infect. 2015, 21, S1–S25. [Google Scholar] [CrossRef] [Green Version]
  39. Bonneville, L.; Ortiz, S.; Maia, V.; Brito, L.; Martínez-Suárez, J.V. Strain and Growth Conditions May Regulate Resistance of Listeria Monocytogenes Biofilms to Benzalkonium Chloride. Appl. Sci. 2020, 10, 988. [Google Scholar] [CrossRef] [Green Version]
Figure 2. Biofilm-forming ability of CPS and CNS isolates assessed on the three tested surfaces. Means followed by the same letter do not differ statistically from each other, according to the Tukey test at a 5% probability level.
Applsci 13 07725 g002
Figure 4. Logarithmic reductions (Log CFU/cm2) obtained after exposure of biofilms to five concentrations of methicillin, for 24 h at 37 °C. Means followed by the same letter do not differ statistically from each other, according to the Tukey test at a 5% probability level. Yellow horizontal line: Breakpoint of minimum biofilm eradication concentration (MBEC).
Applsci 13 07725 g004
Disclaimer/Publisher’s Note: The statements, opinions and data contained in all publications are solely those of the individual author(s) and contributor(s) and not of MDPI and/or the editor(s). MDPI and/or the editor(s) disclaim responsibility for any injury to people or property resulting from any ideas, methods, instructions or products referred to in the content.

