1. Introduction
Multimodal image matching is the process of overlaying two or more images of the same scene captured by different sensors [
1]. Since the imaging methods are based on different physical effects, remotely sensed multimodal images acquired by different sensors can capture different object characteristics, which provide complementary information. Multimodal image matching can integrate the complementary information by registering different multimodal images into one identical map, which is an important step for many remote sensing image processing tasks, such as image fusion [
2], vision-based satellite attitude determination [
3], and image-to-map rectification [
4].
Automatic high-performance matching for remotely sensed multimodal images remains a problematic task because of the severe radiometric deformation produced by different types of sensors.
Traditional image-matching methods can be classified into two categories: feature-based [
5,
6,
7,
8] and area-based methods [
9,
10,
11]. The scale-invariant feature transform (SIFT), which is invariant to scale and rotation changes, is the most representative feature-based method [
12]. The SIFT-based method has been widely employed in the registration of remotely sensed multimodal images [
6,
7,
8,
13,
14]. However, these SIFT-based descriptors were developed to handle the geometric affine variation of images with linear intensity changes. Therefore, these methods cannot resolve complicated nonlinear intensity changes caused by radiometric variations among remotely sensed multimodal images [
14,
15]. Ye et al. proposed a descriptor based on the local histogram of phase congruency to adapt to nonlinear intensity variation [
16]. This method can accurately register remotely sensed multimodal images if the overlapping areas in the images are sufficiently large.
Feature correspondence-based methods usually fail to match remotely sensed multimodal images because repeatable and reliable feature detection is considerably difficult for these images. To address this problem, locality-preserving matching [
17] and matching based on local linear transformation [
18] are proposed to achieve reliable feature correspondence.
The area-based method also called the correlation-like or template-matching method [
1], compares the template to each candidate window on the base image; the corresponding window with maximum similarity is then selected as the matching result. Compared with the feature-based matching method, the area-based method exhibits better performance in matching images with few features or noise distortion [
11].
There are two problems in using the area-based method for matching remotely sensed multimodal images. One is that some remotely sensed images contain intense noise. For example, synthetic aperture radar (SAR) images have randomly distributed speckle noise introduced by the interference of ground objects or surfaces to the backward reflection of electromagnetic waves.
Another problem is the significant nonlinear radiometric difference among remotely sensed multimodal images. This difference introduces nonlinear intensity variation, indicating that the same part of an object may be represented by different intensities in the images captured by different modalities [
19]. It is impossible to calculate (even roughly) the intensity variation among multimodal images through a single mapping function [
20]. Therefore, it is not ideal to match two remotely sensed multimodal images directly based on grayscale via commonly used similarity measurements techniques, such as the sum of squared differences (SSD), the sum of absolute differences (SAD), normalized cross-correlation (NCC), and matching by tone mapping (MTM) [
21].
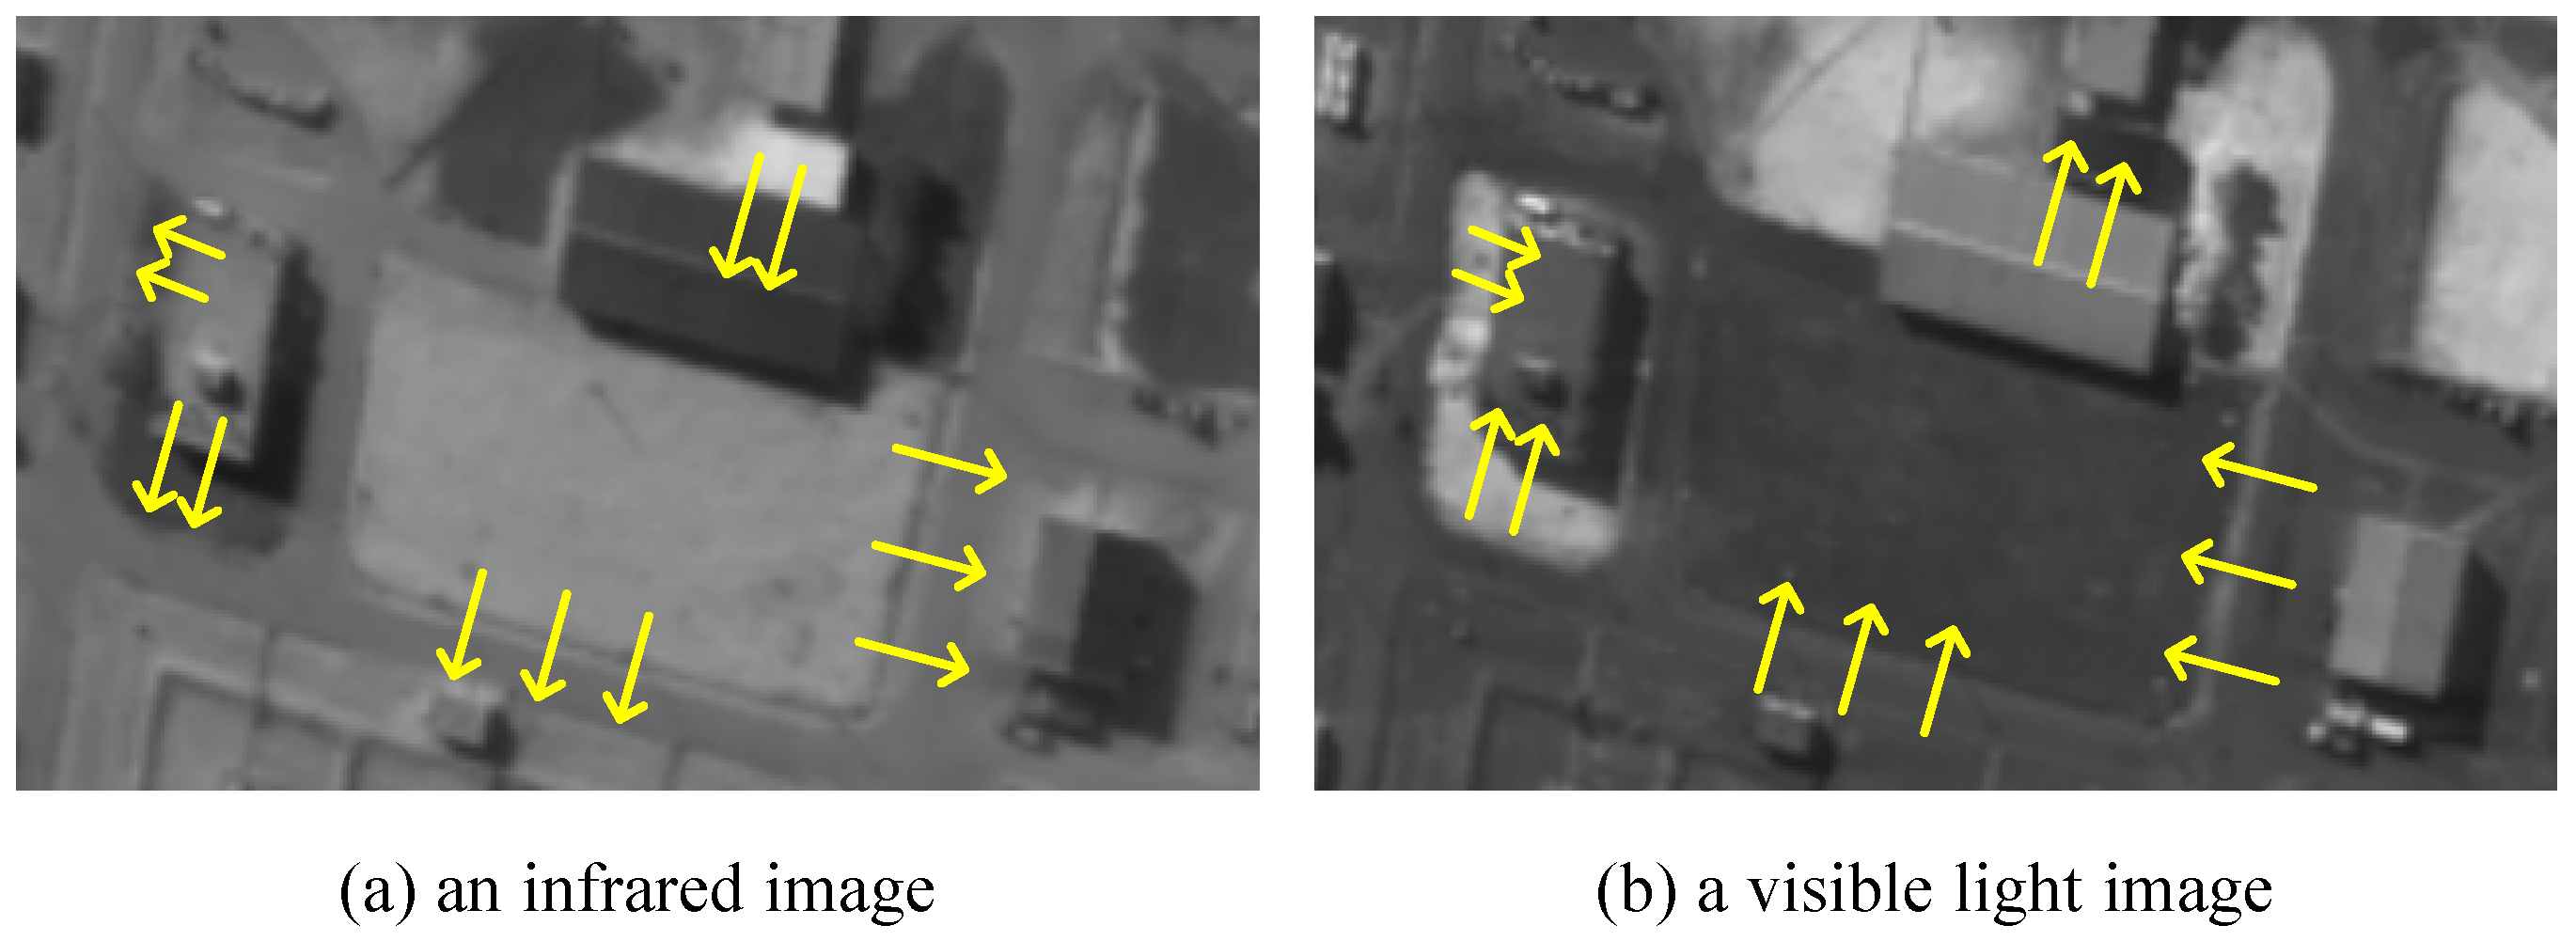
In addition, radiometric differences can cause gradient reversal, i.e., the gradients of corresponding parts of images change their orientation in the opposite direction [
19], as shown in
Figure 1. In this case, if the image feature is represented by a descriptor based on the texture gradient or structure orientation, then the two images of the same object display opposite geometric information. However, gradient reversal does not always occur, and the location may be unknown, making this problem more intractable.
In recent years, deep learning-based methods are proposed for addressing the challenge problems of image matching [
22,
23,
24,
25,
26]. Their testing results show that the deep learning based matching methods can achieve significant improvement compared with the traditional matching methods.
The main advantage of deep learn based methods is that they employ convolutional neural networks to learn powerful feature descriptors which are more robust to appearance changes than the classical descriptors. However, the feature learning networks are usually pre-trained in large datasets such as ImageNet [
27] which consists of visible light images with rich and clear features. Therefore, the performance of these deep learning-based methods could drop significantly for matching SAR or infrared images, and the retraining or the fine tuning is also not idea ways if the application dataset is small.
In order to address the aforementioned challenges, this study introduces a template-matching algorithm that aims to achieve accurate matching of remotely sensed multimodal images. The algorithm proposed in this research enhances the estimation of structural features by incorporating principal component analysis (PCA) and employs a learnable matching network (LMN) to measure the similarity between two images. The primary contributions of this study can be summarized as follows:
Novel descriptor based on PCA-enhanced structure feature. As introduced, nonlinear intensity variation can significantly decrease the gray-level correlation among images. Instead of directly matching images based on the image grayscale, a descriptor based on the structure feature for capturing the geometric information of the image is introduced. Since the structure feature may be distorted by noise affection, a PCA-enhancing method is proposed to reduce the noise component in signals and estimate the local dominant orientation. The structure feature can be accurately calculated by the proposed descriptor even in images with severe noise distortion.
Improved similarity measurement based on LMN. Severe miscalculations can result if SAD or SSD is used to measure the similarity of the structure feature because the complicated radiometric variation causes gradient reversal. To solve this problem, a similarity measurement based on the LMN is proposed. The correlation layer and the regression network of the LMN can handle the gradient reversal and significantly improve the matching of remotely sensed multimodal images, as described in the experimental section.
A Novel combined matching method for application with a small dataset. It is very hard to train a deep convolutional network to extract robust cross-modal features with a small dataset. Therefore, the PCA-enhanced structure feature is adopted, which is a handcraft stable cross-modal feature. For addressing the complicated gradient reversal and radiometric variation between multi-modal images, we developed a light learnable matching network to learn the similarity measurement and regress the transformation parameters.
The remainder of this paper is organized as follows.
Section 2 introduces related works. The proposed PCA–LMN template-matching algorithm is described in
Section 3. In
Section 4, the performance of the proposed algorithm is evaluated. Conclusions are presented in
Section 5.
2. Related Work
Complex grayscale variation is a major problem for area-based multimodal image matching. Some template-matching algorithms have attempted to solve this problem by improving the similarity measurement [
21,
28,
29]. These algorithms usually assume that the gray distortion caused by different imaging conditions, or the spectral sensitivity of sensors can satisfy a mapping model [
1]. Therefore, gray distortion can be resolved by developing a similarity measurement that ignores the grayscale variation, conforming to the mapping model. The NCC, which is invariant to linear gray changes, is the most commonly used similarity measurement approach for adapting gray distortion among images [
29]. Even under conditions with monotonic nonlinear gray variation, the NCC usually performs well, because these variations can be typically assumed as locally linear. However, the NCC cannot handle complex gray distortions, such as non-monotonic nonlinear gray differences, or situations where the gray mapping between two images is not function mapping [
21]. Visual examples of gray mapping between remote sensing multimodal images can be found in [
30].
Hel-Or proposed a fast-matching measurement called MTM [
21], which is invariant to nonlinear gray variation. It can be regarded as a generalization of the NCC for nonlinear mappings and reduces to the NCC when the mappings are linear. Although the computational time of MTM is the same as that of the NCC, it exhibits better matching performance. However, the MTM also assumes that the grayscale mapping between two images is function mapping.
The mutual information (MI) technique is a similarity measurement approach commonly used in multimodal image matching [
28]. This technique measures the gray statistical dependency between two images, without requiring their grayscale mapping to be function mapping. Moreover, compared with the NCC and MTM, MI affords advantages in adapting the nonlinear gray variation among multimodal images [
10]. However, it requires the construction of a local histogram for each candidate window during the search process, thereby leading to high computational costs. Additionally, the MI technique is sensitive to the size of histogram bins for joint density estimation [
21].
Measurement improvement is not the only approach for resolving multimodal image matching. Some area-based methods match remotely sensed multimodal images with dense feature descriptors based on structural information.
The histogram of oriented gradient (HOG) is a commonly used descriptor that employs the orientation and amplitude of gradients to capture the structural features of an image [
31]. This descriptor was successfully applied to many image-matching methods. Sibiryakov proposed a template-matching algorithm based on the projected and quantizing histograms of oriented gradients (PQ-HOG). It transforms the images into dense binary codes to improve their computational efficiency [
32]. The HOG is considerably resistant to illumination change or contrast variation; however, it cannot adapt to the complex nonlinear grayscale distortion among remotely sensed multimodal images. In addition, the gradient-based descriptor is usually sensitive to image noise.
Schechtman and Irani proposed the local self-similarity (LSS) descriptor [
33], which had been previously applied to various template-matching methods [
14,
34]. However, the LSS cannot effectively capture informative features for multimodal matching in textureless areas [
35], and its discriminative power is considerably limited [
36].
The phase congruency model proposed by Kovesi [
37] can capture the structure magnitude of the image, which is invariant to the complex nonlinear grayscale distortion among multimodal images. However, this model cannot capture the structure orientation of an image which is crucial for multimodal image matching. To solve this problem, Ye et al. extended the phase congruency model to build a dense descriptor called histogram of oriented phase congruency (HOPC) [
9]. They used the log-Gabor odd-symmetric wavelets to calculate the orientation of phase congruency and construct a descriptor using the orientation and amplitude of phase congruency.
Compared with the HOG, the HOPC is more robust for matching remotely sensed multimodal images. Ye et al. demonstrated that the performance of the template-matching algorithm based on the HOPC is superior to those based on the NCC, MTM, or MI for remotely sensed multimodal images [
9]. Recently, a novel template-matching method based on the channel features of oriented gradients (CFOGs) was proposed. This novel feature is an extension of the pixel-wise HOG descriptor [
35]. Compared with the HOPC, the CFOG is more robust and efficient in matching multimodal images [
35]. However, both the HOPC and CFOG handle the gradient reversal in a problematic manner, as described in part 2 of
Section 3. Furthermore, they are sensitive to noise distortion, as discussed in
Section 4.
In recent years, deep learning-based methods are proposed for matching multimodal images or aerial images. X. Han et al. [
23] proposed a unified approach for feature and metric learning, dubbed Match-Net. They developed a deep convolutional network to extract features from images and a network of three fully connected layers to measure the similarity. Match-Net can achieve better performance compared with the state-of-the-art handcraft methods according to their testing results. I. Rocco et al. [
24] proposed a trainable end-to-end matching network, which is not just for learning the feature and the similarity, but also estimating the transformation parameters with a regression network. This method is further developed for aerial image matching in [
25,
26], and the testing results confirmed that deep learning-based matching methods can achieve significant improvement compared with the traditional matching methods.
3. Template Matching Based on PCA–LMN
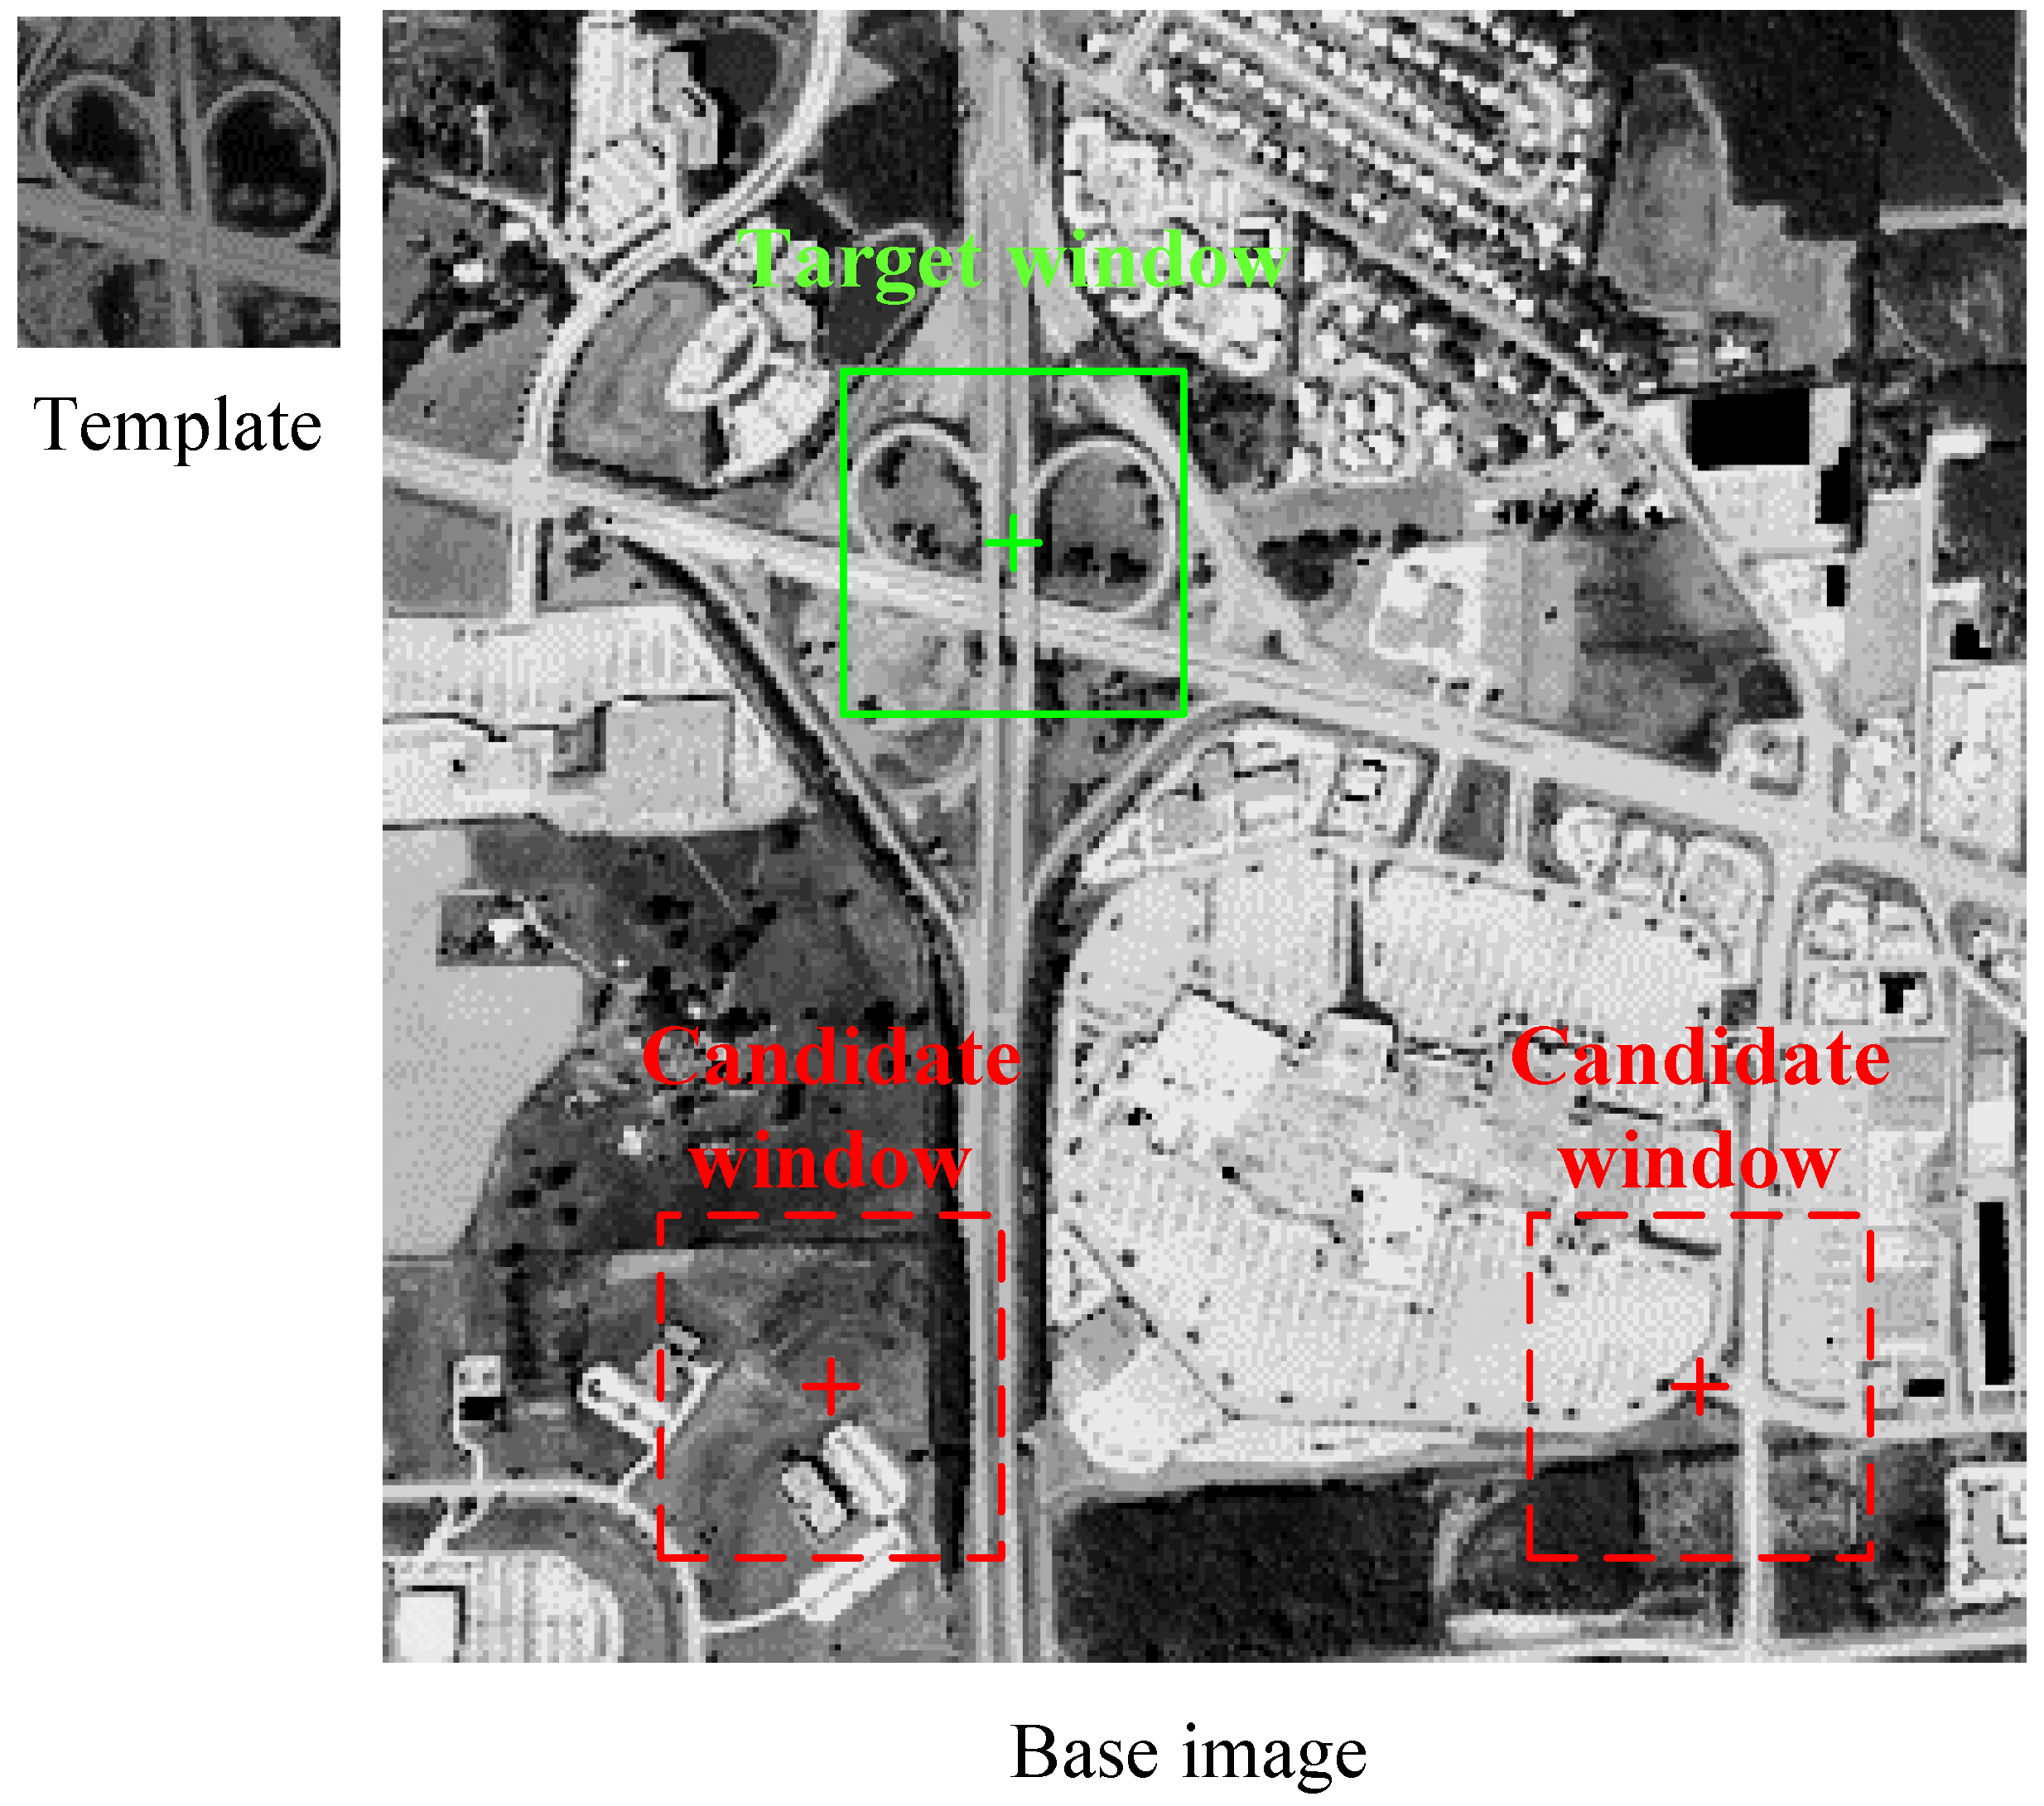
The proposed matching algorithm is a full-search template-matching method that compares the template with a candidate window of the same size on the base image to identify the position of the target window (
Figure 2). Since the method only searches in translation, a preliminary correction must be performed before the matching, so the direction and scale of the template and the direction and scale of the base image are approximately the same. Usually, the preliminary correction can be automatically performed according to the altitude and attitude information provided by the onboard navigation system [
38].
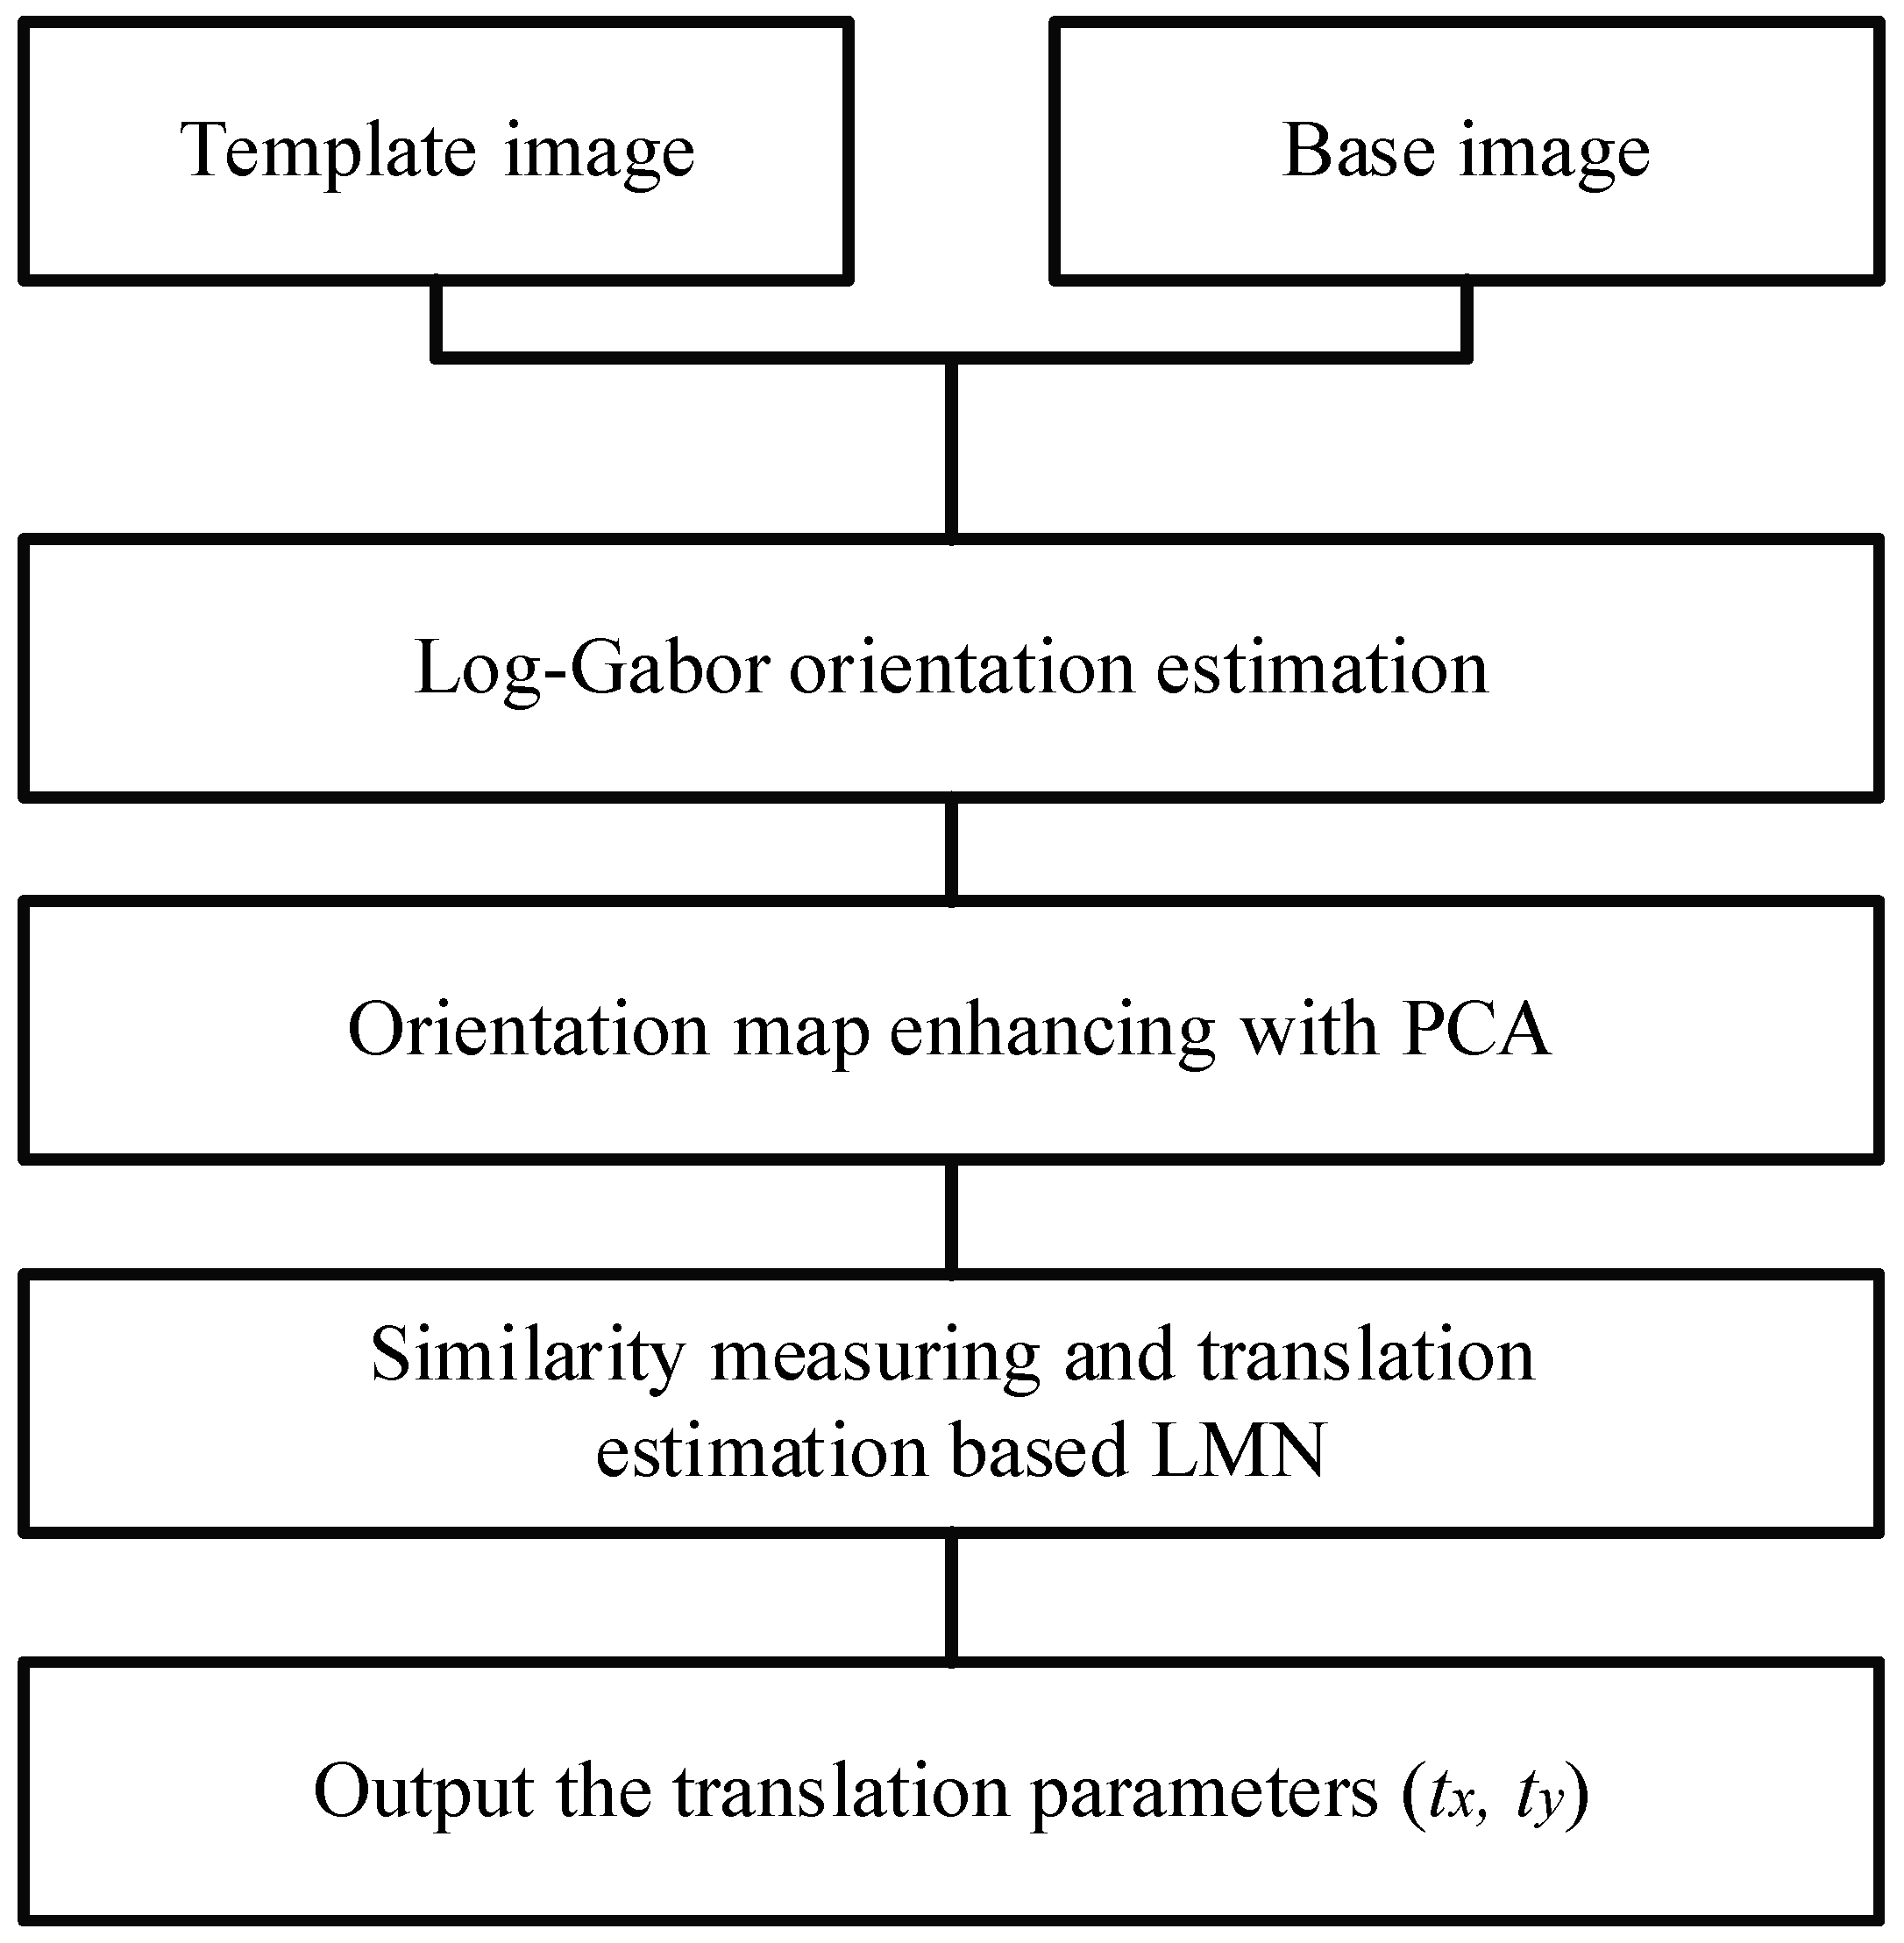
The template-matching algorithm based on the PCA–LMN consists of three main steps: log-Gabor orientation estimation, orientation enhancement using the PCA, and similarity measurement and translation estimation based on the LMN; the algorithm flowchart is shown in
Figure 3.
3.1. Orientation Estimation and Enhancing
A significant challenge in matching remotely sensed multimodal images lies in the severe distortion of grayscale relationships among the images. As shown in
Figure 4, the grayscale change between infrared image (a) and visible light image (b) is considerably significant; however, the structural orientation, which is present in images (c) and (d), is considerably more stable than the gray part of the image. Accordingly, the structure orientation based on log-Gabor is employed by some methods [
7,
9] for matching multimodal images. These methods exhibit a significant advantage in terms of matching performance over template-matching algorithms directly based on the image grayscale.
However, the structure orientation estimated with the log-Gabor filter is sensitive to noise distortion. The orientation map is estimated via log-Gabor filters. Note that the orientation map is disturbed by noise distortion.
To improve the noise adaptiveness, the PCA is employed to enhance the structure orientation estimated using log-Gabor. The PCA is typically used to calculate the dominant vectors of a given dataset that can reduce the noise component in signals and estimate the local dominant orientation.
For each pixel, the PCA can be applied to the local gradient vectors to obtain their local dominant direction. In general, the PCA can be implemented in two ways: eigenvalue decomposition (EVD) of the data covariance matrix and singular value decomposition (SVD) of the data matrix. In this work, because of the superiorities in flexibility and robustness [
39], SVD is employed to calculate the PCA.
Given the original image (I) with its horizontal derivative image (
) and vertical derivative image (
), an
local gradient matrix is constructed for each pixel:
where
is determined by the size of the local window of the PCA calculation. For example, if the size of the window for each pixel is
, then the value of
is 9. The vectors of the local derivatives, i.e.,
and
, can be calculated using the following expression.
where
can be calculated according to Equation (1) and
can be calculated according to Equation (2).
The dominant orientation can be estimated by determining a unit vector,
, perpendicular to the local gradient vectors (
Figure 5). This can be formulated as the following minimization problem.
This can be solved by applying SVD to the local gradient matrix,
.
where
is an
orthogonal matrix;
is an
matrix;
is a
orthogonal matrix; and
indicates the local dominant orientation of the local gradient vectors. The PCA-enhanced structure orientation can be calculated according to the following equation.
where
,
is the element in the first row of
and
is the element in the second row of
. Note that the structure orientation is orthogonal to the orientation of the gradient vector.
The structure orientation enhanced by PCA is more robust against noise than the structure orientation directly estimated with log-Gabor filters. The enhanced structure orientation, which can be represented by , is estimated for each pixel. Suppose the size of an image is , and the size of its feature map is .
3.2. Learnable Matching Network
The gradient reversal among remotely sensed multimodal images is considerably common. This causes orientation reversal (
Figure 1), which is a critical problem for the similarity measurement of structure orientation.
To solve this problem, some methods remap the structure orientation to range [0–180°] by adding 180° to the negative value [
9,
10,
35]. However, miscalculations can result if the orientation is not appropriately reversed. For example, suppose that a structure orientation vector in one image is 5°. The orientation of the corresponding structure in the other image should be changed to −5° because of the noise effect. According to the remapping rule, the orientation difference between them is 170°, which is evidently unreasonable. The SAR and infrared images sometimes contain intense noise; hence, these methods may encounter problems in matching the images.
Instead of changing the orientation mapping, a learnable matching network (LMN) is proposed, which consists of a correlation layer and a regression network.
3.2.1. Correlation Layer
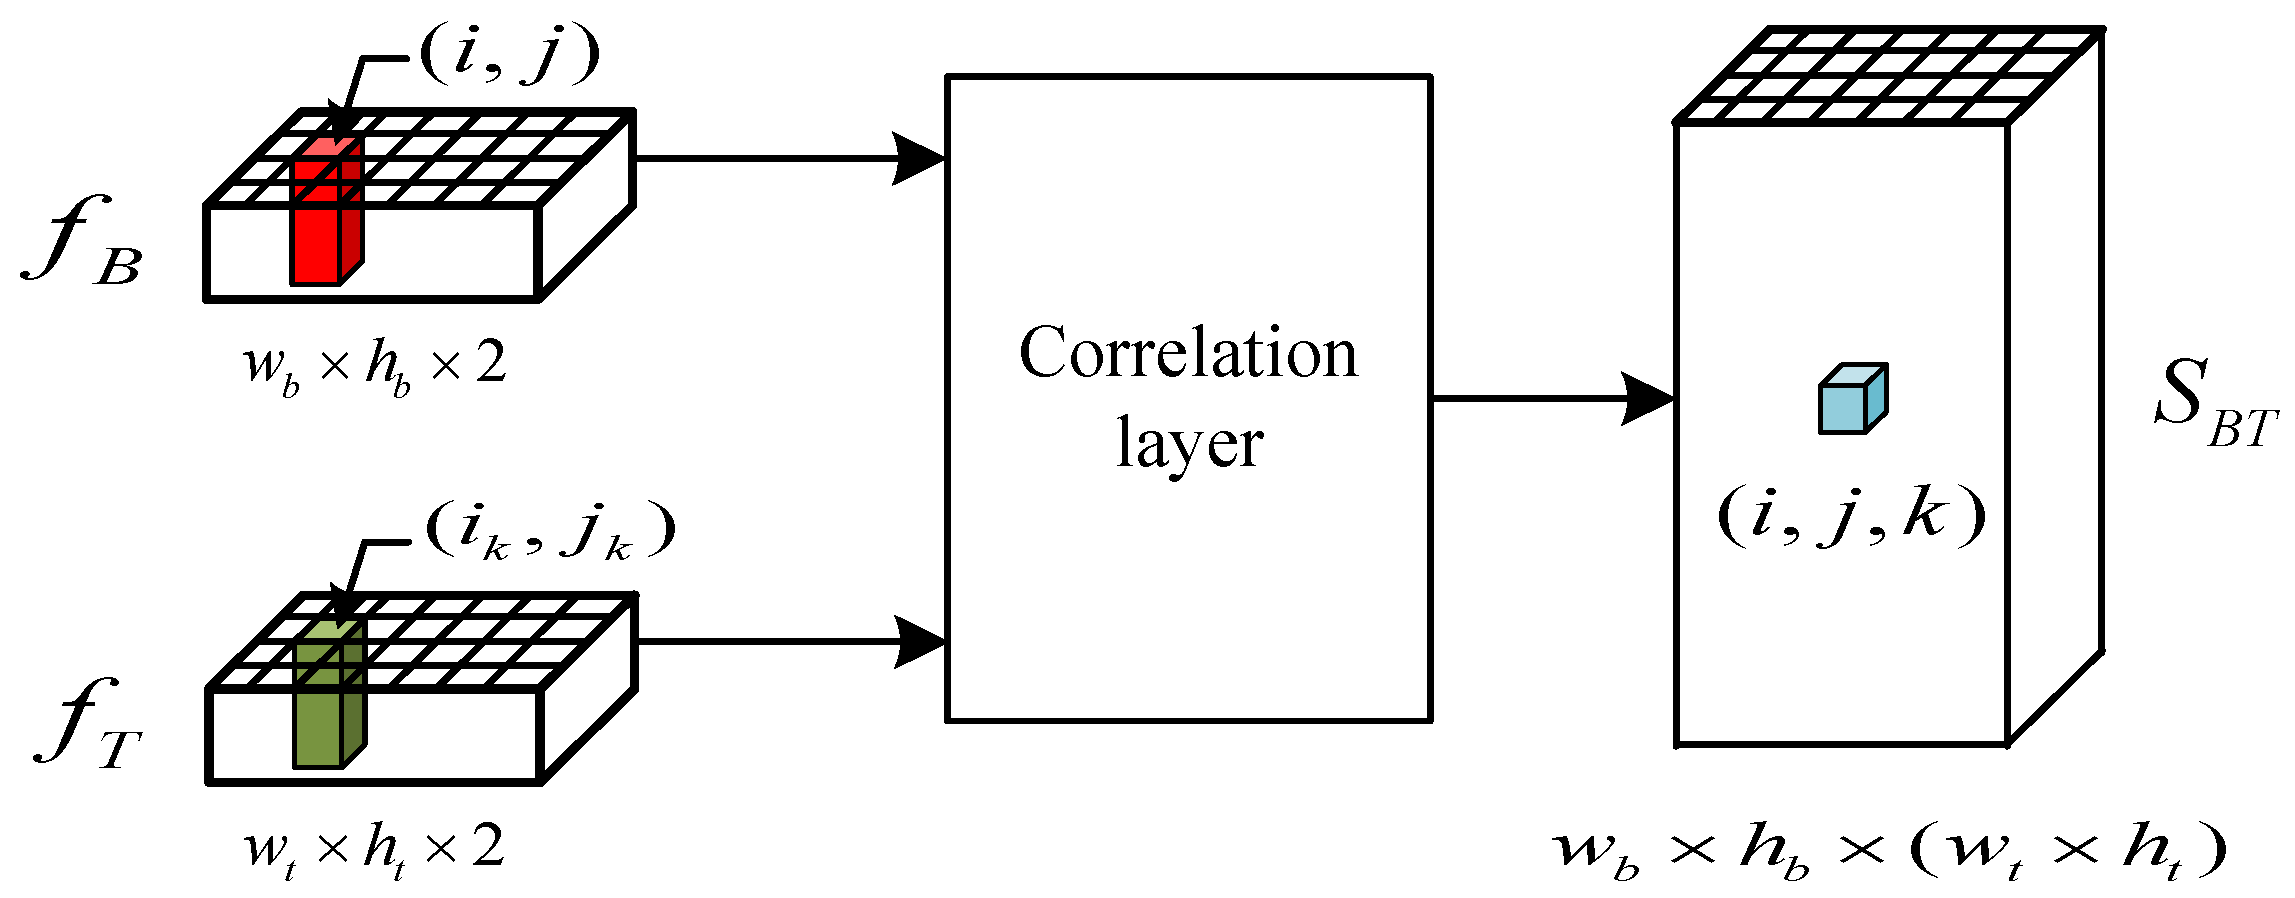
Suppose the feature map of a base image is
, and the feature map of a template is
, the correlation layer between them is shown in
Figure 6.
The similarity between the feature map of the base image and the feature map of the template is calculated with the following equation,
where
indicates the individual feature position in the feature map of the base image, and
indicates the individual feature position in the feature map of the image. The correlation layer output
contains all pairs of similarities between individual features of
and
.
3.2.2. Regression Network
The similarity map is passed through a regression network for translation estimation, which can be represented by the function F:
where
n is the number of parameters to regress,
n = 2 for translation.
As shown in
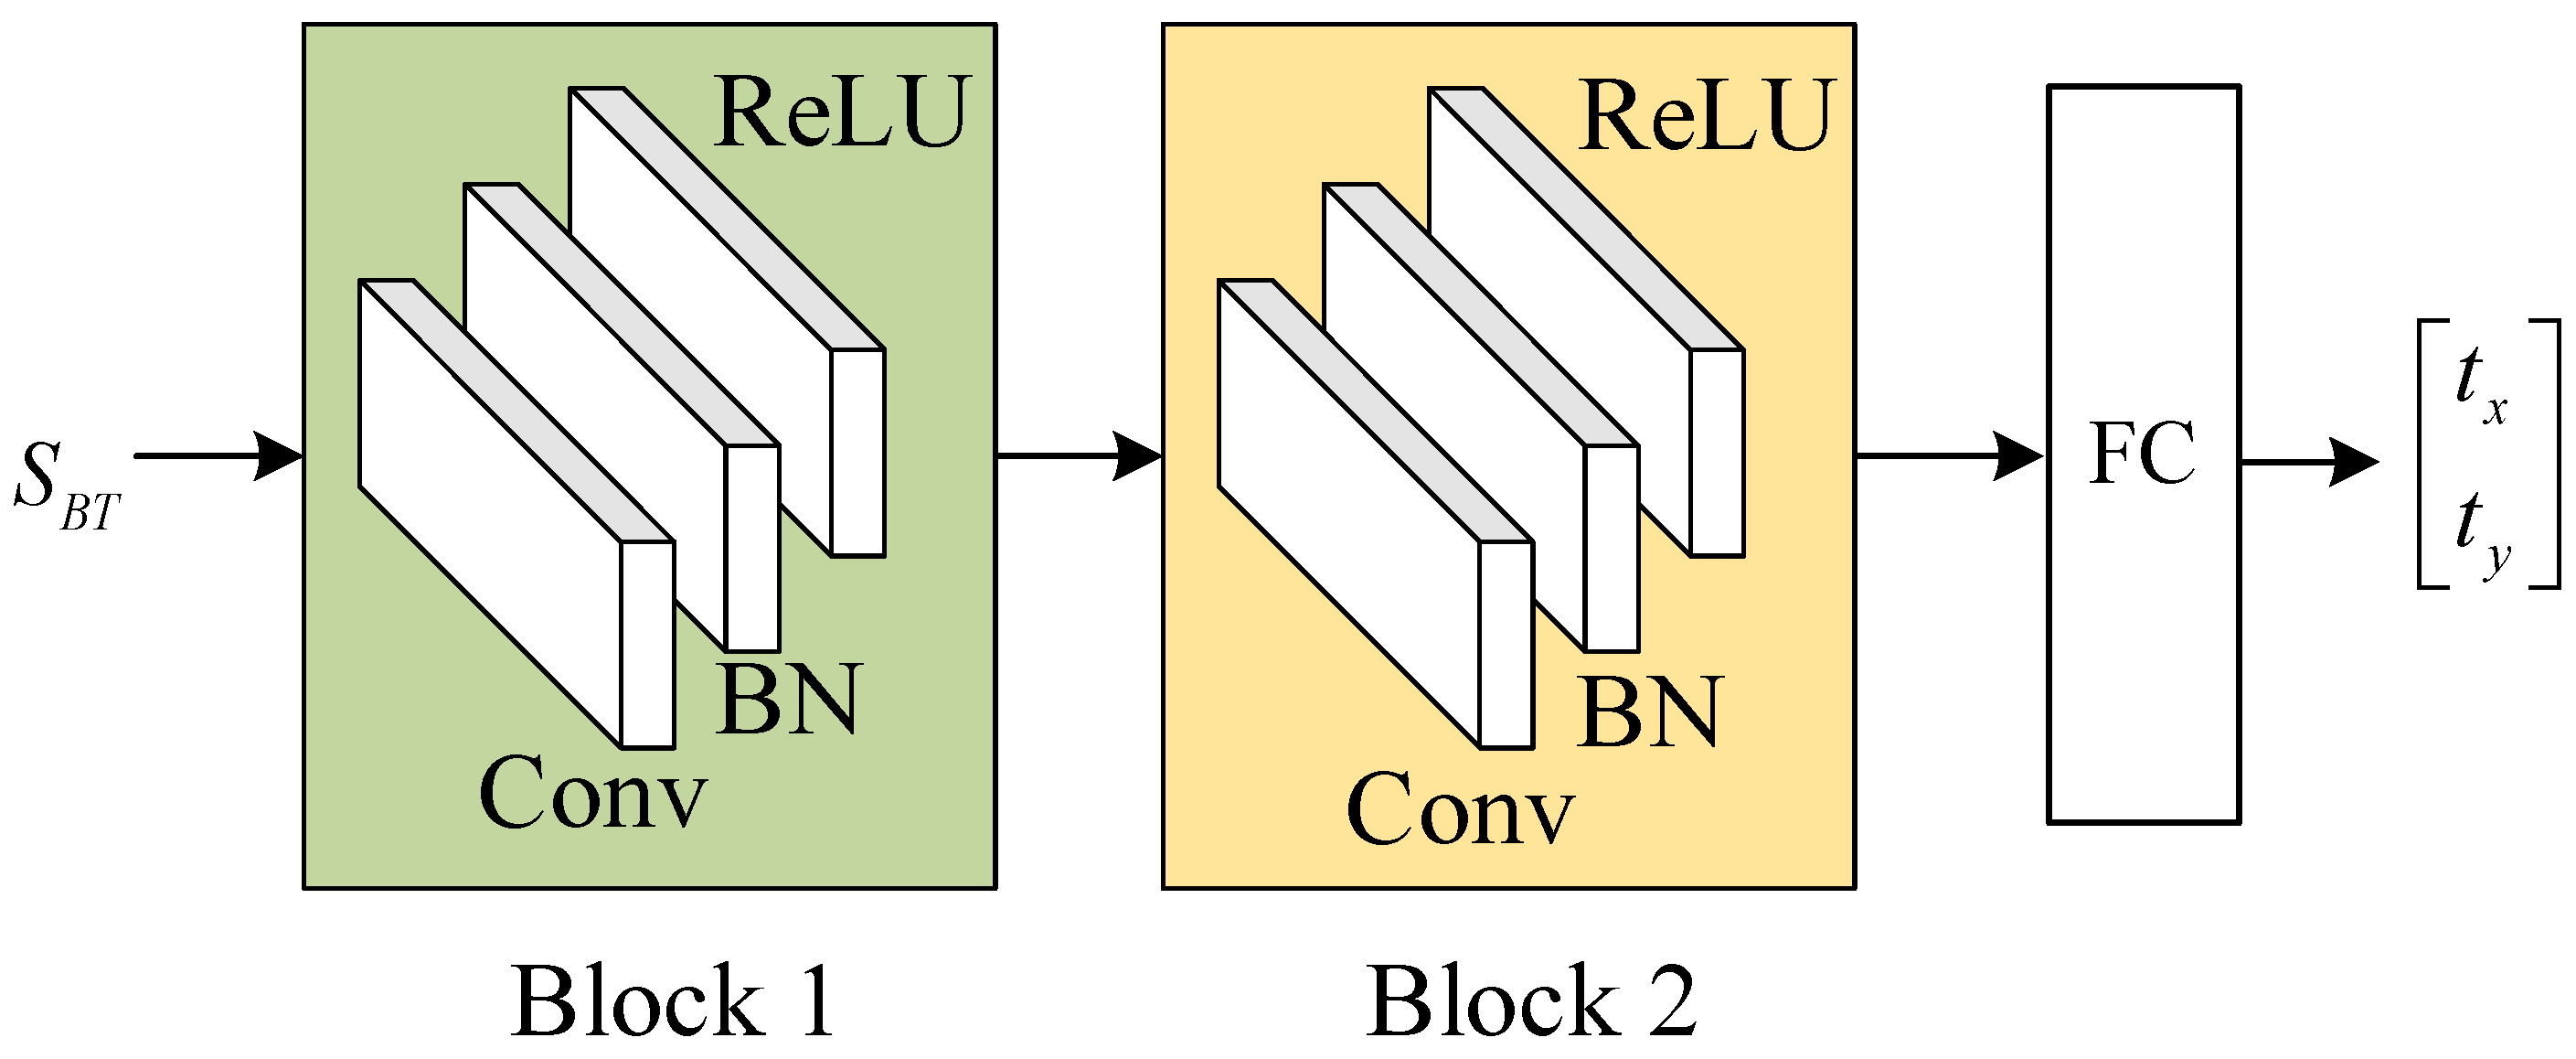
Figure 7, The regression network consists of two blocks, each block contains a convolutional layer, followed by batch normalization and ReLU. The last layer is a fully connected layer that regresses to the parameters of the transformation.
3.2.3. Loss Function
Each training pair includes a template and a base image. Suppose the ground truth transformation between them is
, and the transformation estimated between the sub-areas of this training pair is
, the loss function is calculated by the following:
where
is the number of grid points, and
is the translation between the sub-area and the template, as shown in
Figure 7. The loss function is based on the transformed grid loss [
24], which minimizes the discrepancy between the estimating transformation and the ground truth transformation.
The partition approach increases the resolution of the input image and the resolution of the feature extraction, which helps improve the matching precision. In the partition approach, the four subarea pairs share the regression network, which means the number of the parameters of the network is not increased. This facilitates the retraining processing and the deployment of the network, which will eventually enhance the matching performance with a small training dataset.
The other way of enhancing the precision is inputting image with high resolution, but that may introduce an enormous increase of parameters to the network, which makes the retraining process (for cross-modal images) difficult and eventually lower the performance of the inference.
4. Experiment
The evaluation and comparison of the matching performance of PCA–LMN with the MTM [
21], MI [
28], HOPC [
9], CFOG [
35], and deep homography estimation (DHE) [
26] are presented in this section. MTM, MI, HOPC, and CFOG are traditional image-matching methods. MTM and MI match images directly based on image gray, while HOPC and CFOG match images based on handcraft features. PCA–LMN is also based on the handcrafted feature, but it employs a learnable matching network to measure the similarity and regress the transformation parameters. DHE is a deep learning-based end to end-trainable method.
For the ablation study, PCA–LMN is also compared with the PCA–SAD, which uses the similarity measurement based on the SAD, and LGO–LMN, which directly estimates the structure orientation based on the log-Gabor filters.
4.1. Dataset and Training
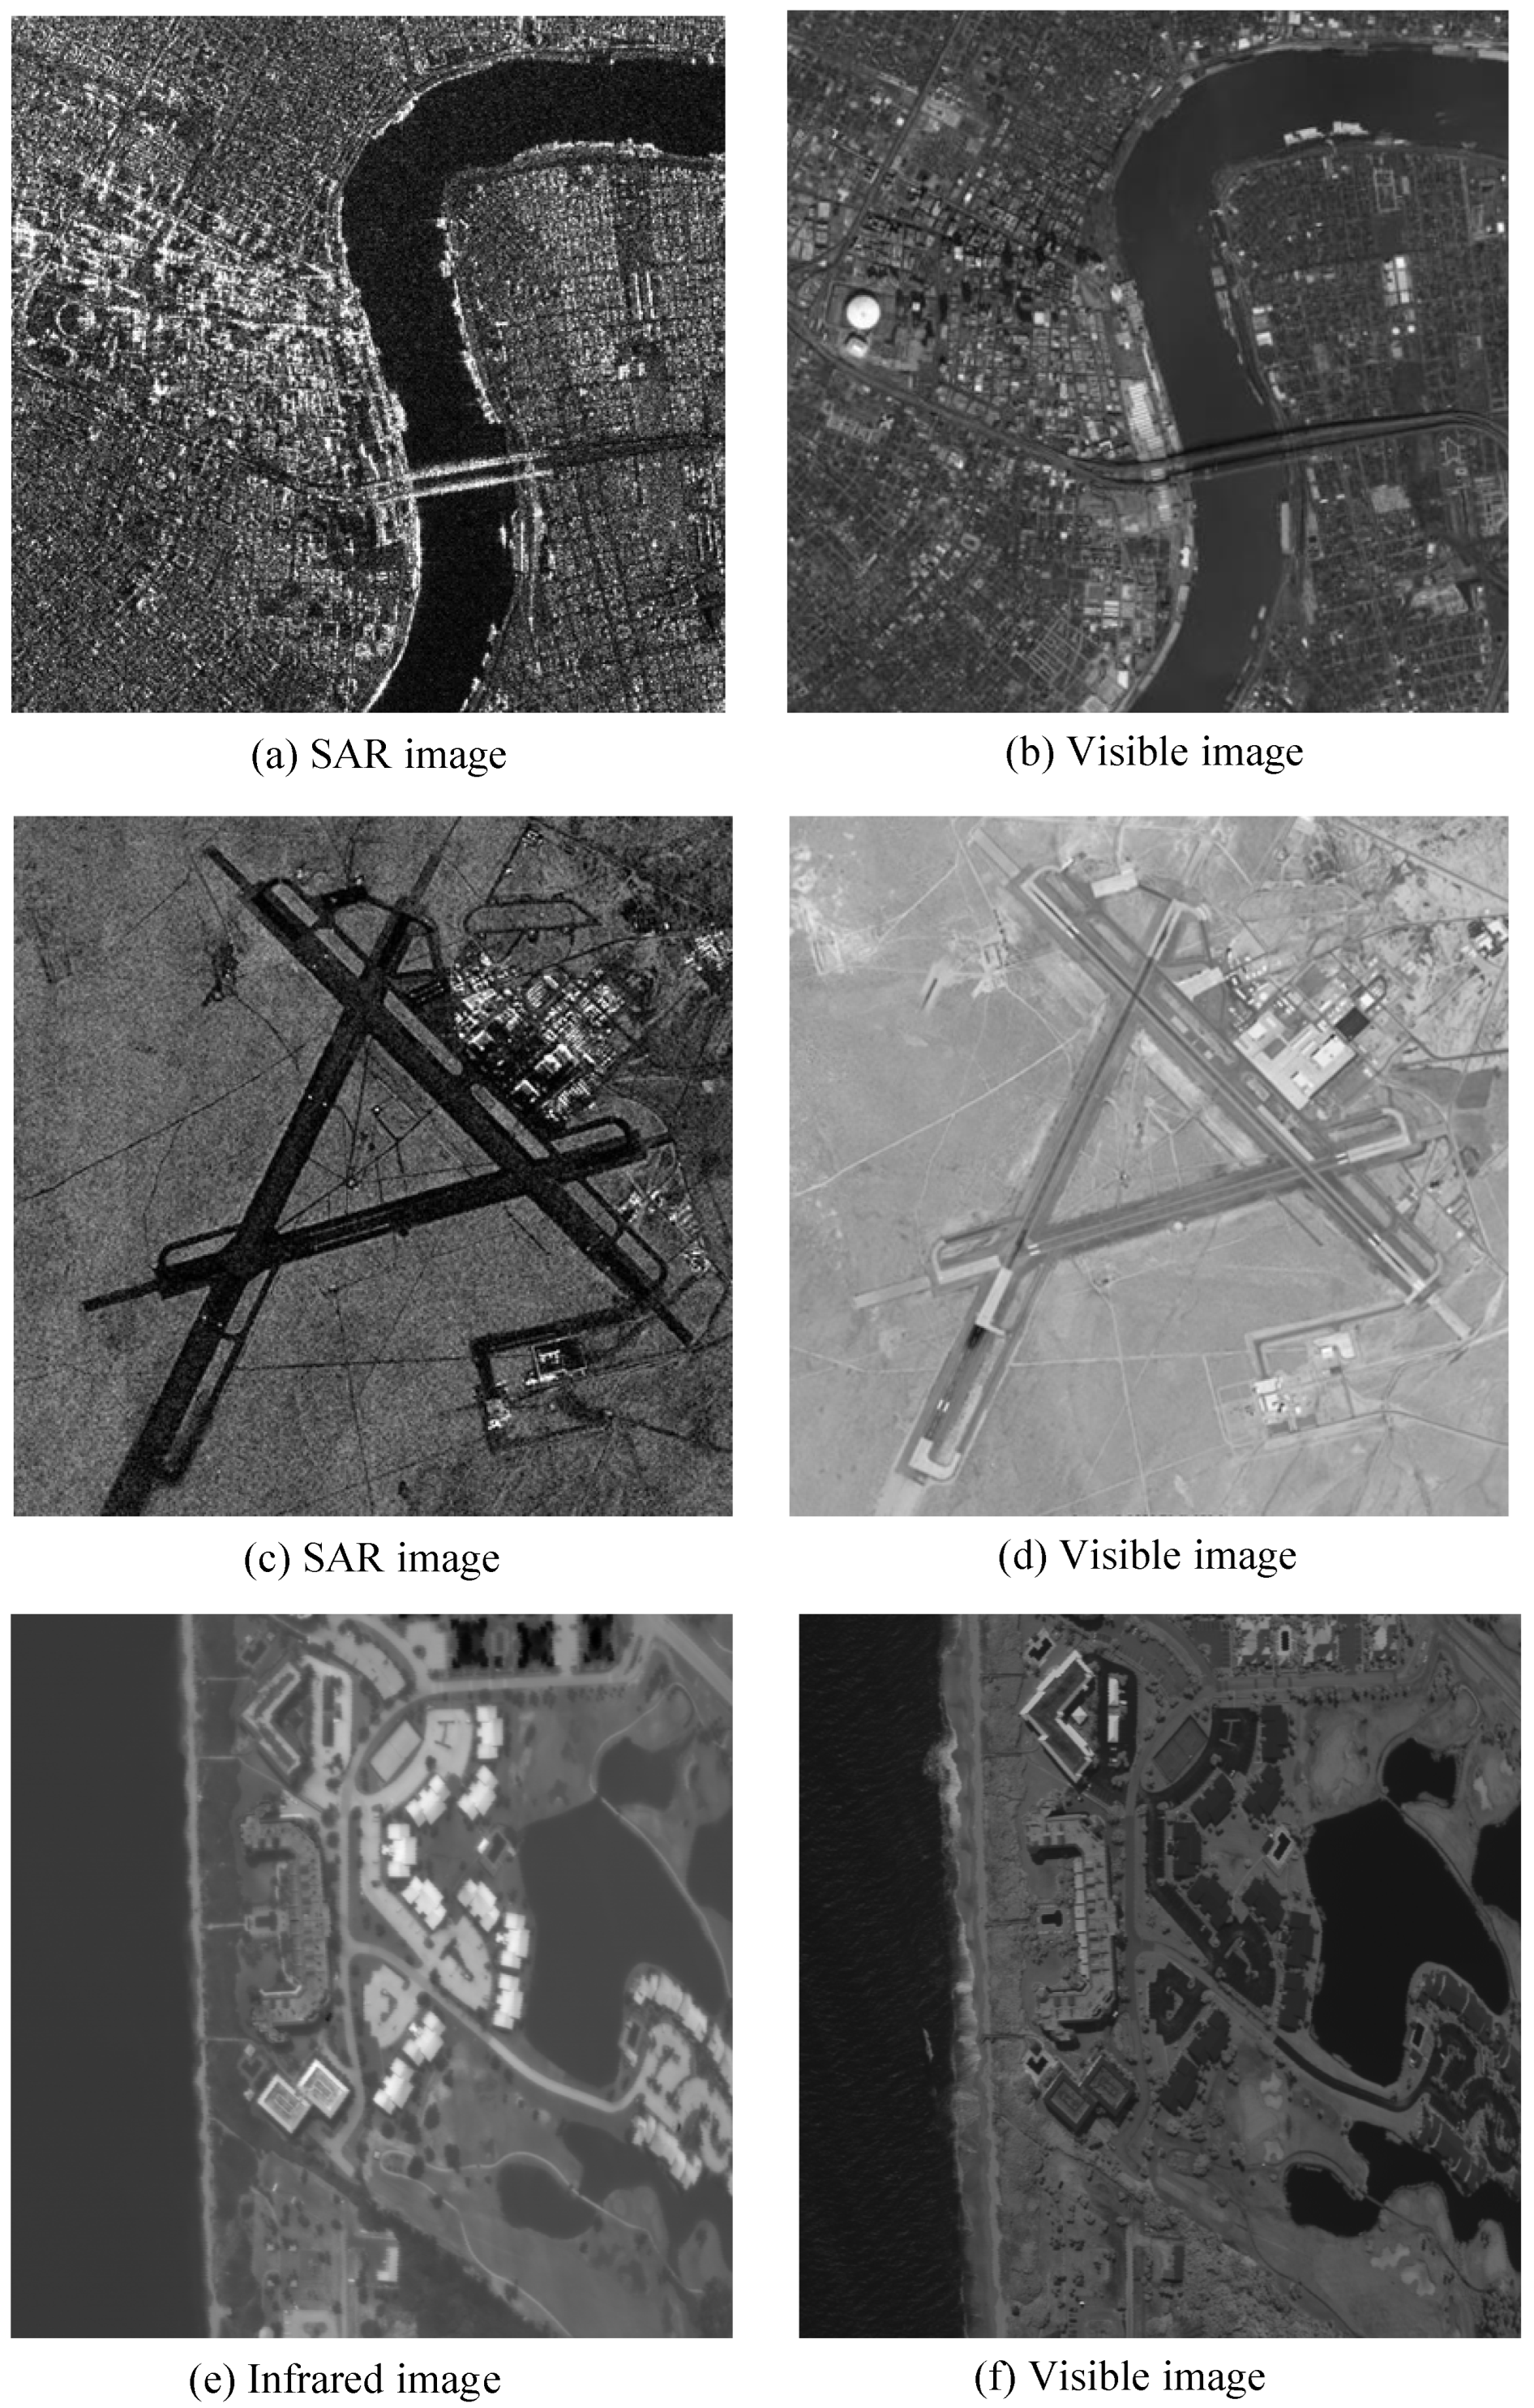
To test the proposed algorithms, 200 remotely sensed multimodal image pairs were used, which were taken from areas such as urban airports, plantations, harbors, and hilly terrain. Some examples of multimodal image pairs are shown in
Figure 8. Significant radiometric differences among these remotely sensed multimodal images are observed. In addition, the SAR image contains severe noise distortions and lacks details.
For each remotely sensed image, 100 templates of different sizes were randomly selected and matched to the base image. Since the dataset was small, 60% of the samples were employed for training and 20% of the samples were employed for validation and 20% were employed for testing. The final result was generated with the testing set. Data augmentation techniques such as grayscale variation, noise injection, and random erasing were adapted to the training set. Since our dataset was small, DHE used the pre-trained model provided by [
25] and fine-tuned it with our dataset. The regression network of the LMN was totally trained with our dataset.
To evaluate the algorithms, 16 tests were performed.
Table 1 summarizes the test information. Before the testing, the sensed image was manually corrected to the same coordinates as the base image. After the correction, the true position of the template in the based image and the position of the template selected from the sensed image were the same. In addition, Gaussian noise with different variances was added to test the noise adaptiveness of the algorithms.
4.2. Evaluation Criteria
The correct matching rate (CMR) was selected as the evaluation criterion;
; where M is the number of total matched point pairs, and CM is the number of correctly matched results. A matching result is correct if the overlapping area ratio (OAR) between the matching and true positions reaches 90%. The OAR is calculated according to the following equation:
where
is the template length;
and
denote the errors between the matching and true positions, respectively; and
is a truncate function, which is defined as follows:
4.3. Results and Analysis
The matching results of the tests (i.e.,
) are shown in
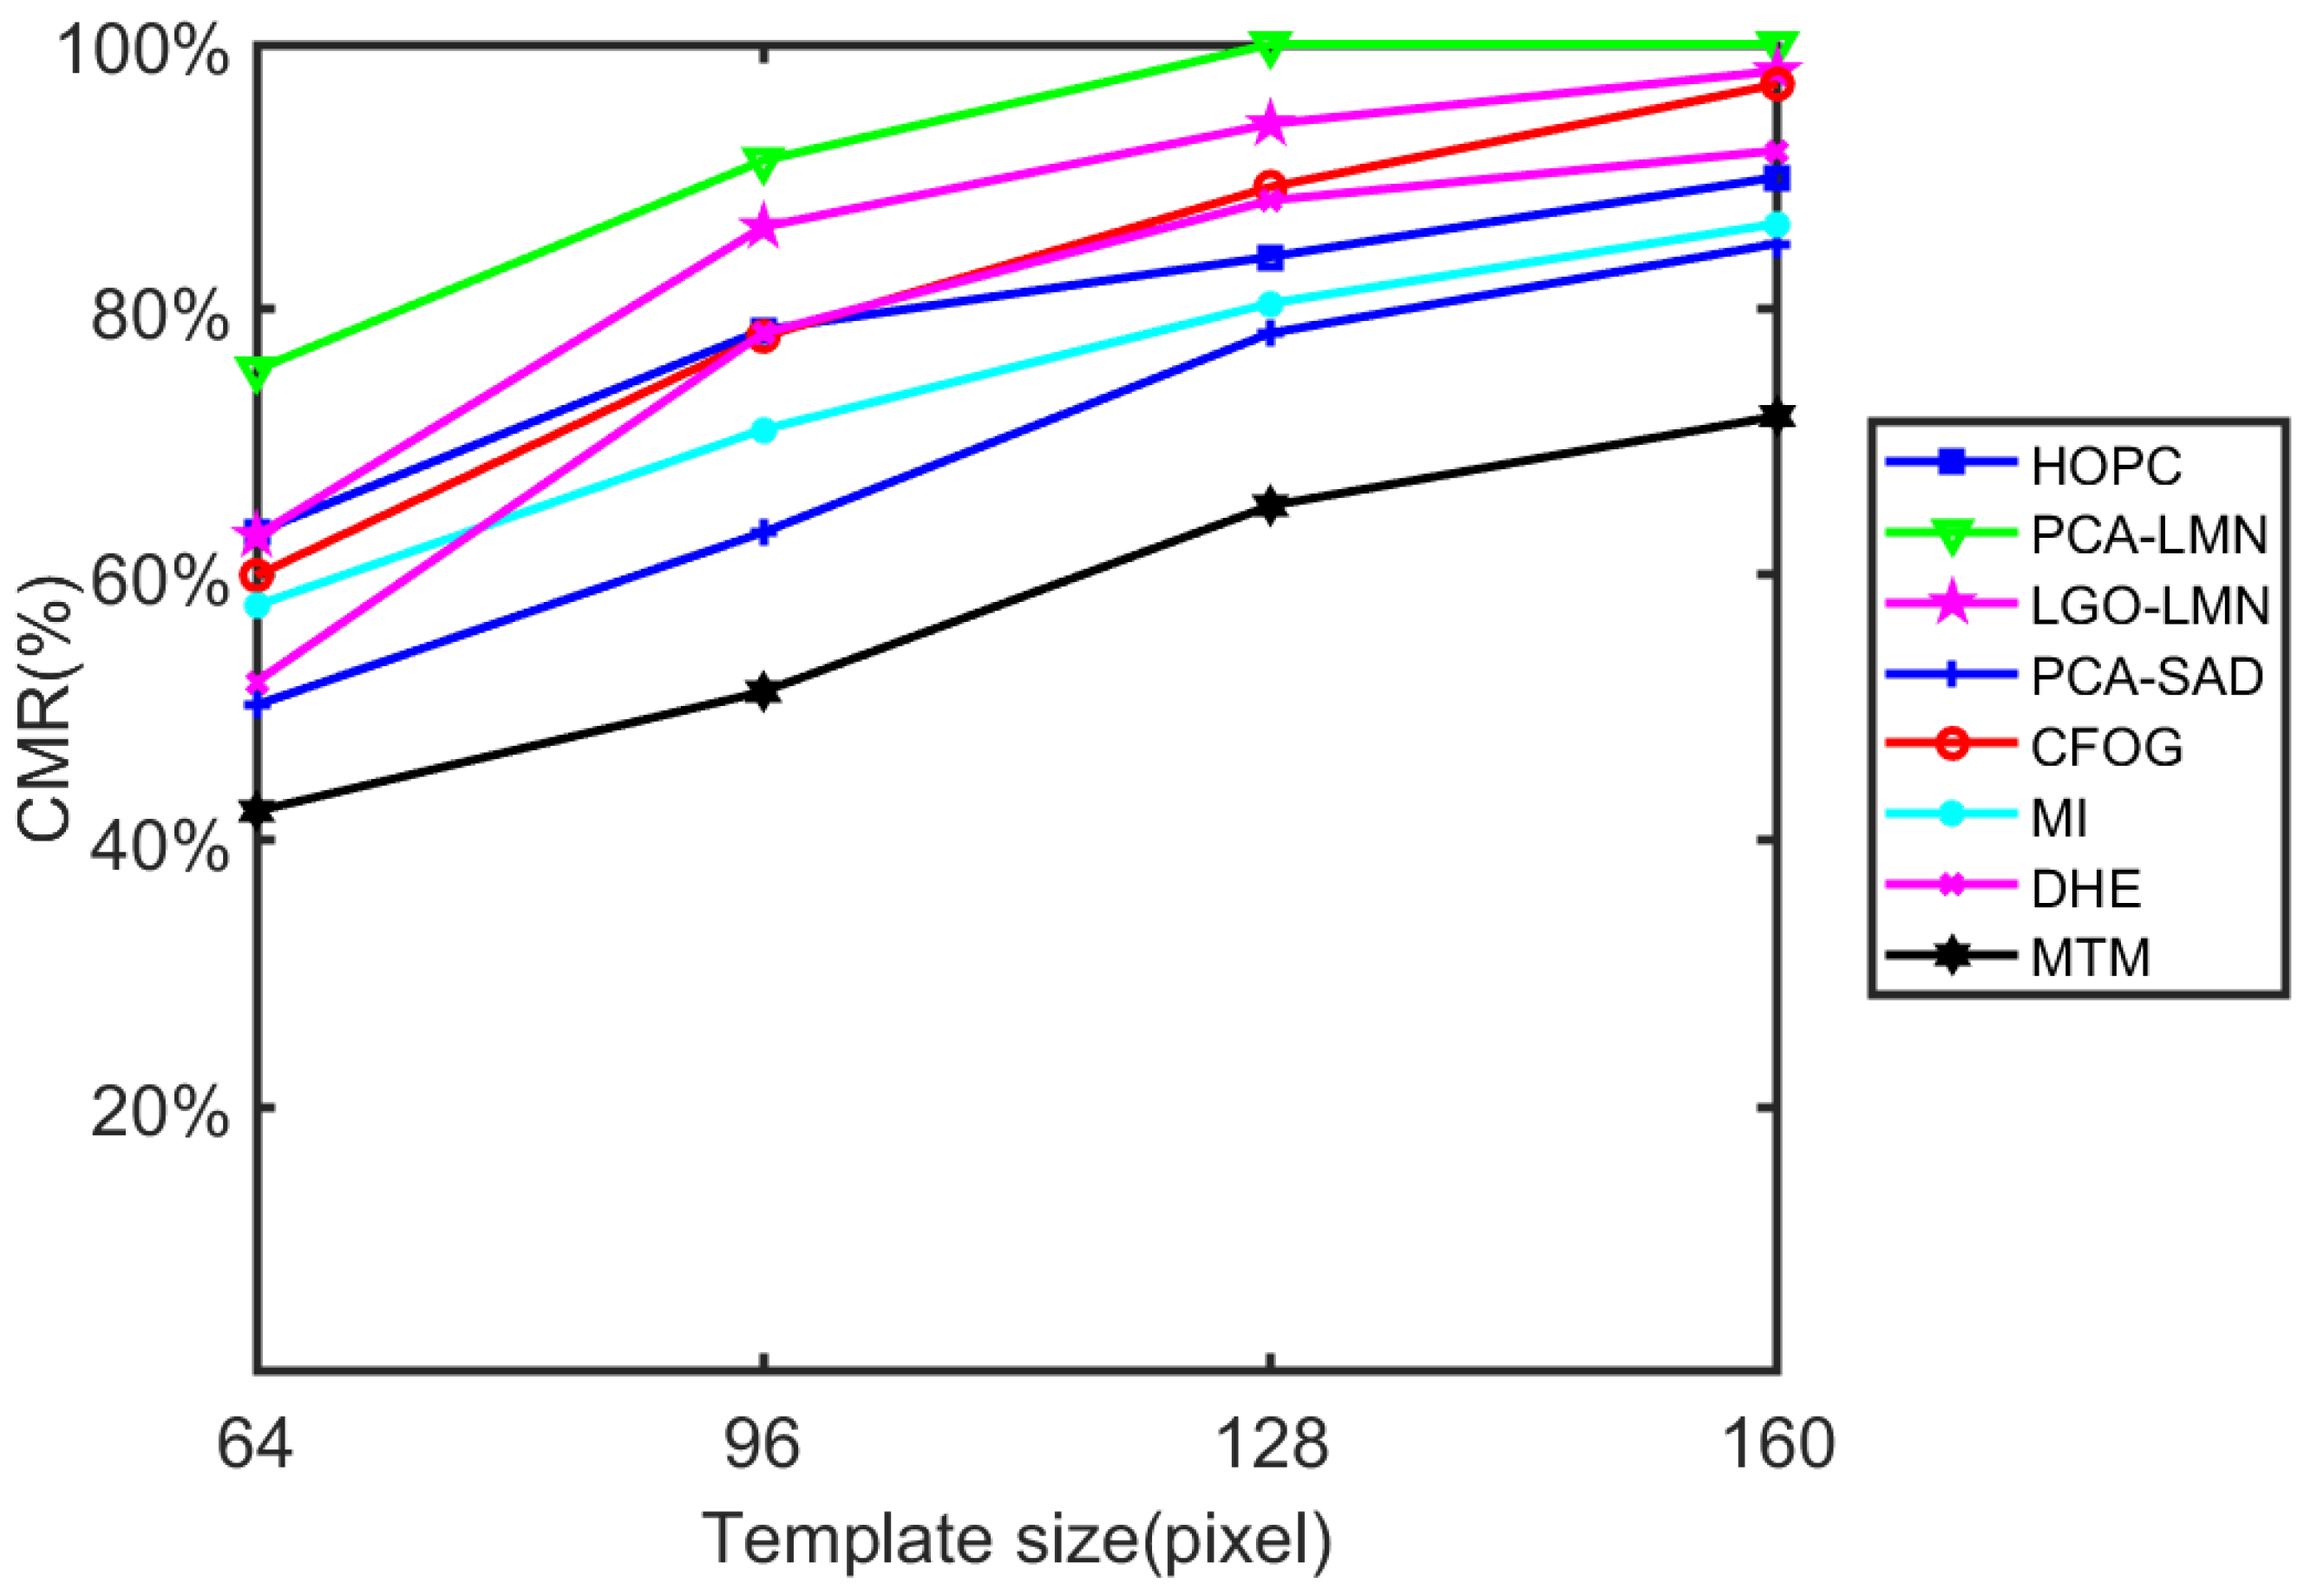
Figure 9. Notably, the CMRs of the investigated algorithms increase with the size of the templates. This is because a larger template aids in avoiding repetitive patterns in the base images.
Overall, the PCA–LMN achieved the best matching performance in the tests. The average CMR of PCA–LMN was 91.69%, which is 10.63% higher than that of the CFOG (the best traditional method in this test). It is assumed that this is because the PCA–LMN benefits from the PCA orientation enhancement and LMN. The PCA-enhanced orientation can accurately capture the structural features, even in the presence of significant noise distortions. This makes PCA–LMN more reliable in matching multimodal images with noise distortion, such as the optical SAR matching pairs in
Figure 10c. In addition, LMN can be trained to adapt to the gradient reversal caused by the radiometric difference among remotely sensed multimodal images. The measurement function trained from LMN can be more sophisticated and accurate than the remapping function employed by the CFOG and HOPC.
The performance of DHE is not ideal in the tests, the average CMR of DHE is 3.44% lower than that of the CFOG and 14.07% lower than PCA–LMN. We believe the reason for these results is that the testing dataset is too small to train the deep feature extraction network of DHM, while the pre-trained dataset is not including multi-modal image pairs, which is very different from the testing dataset.
A clear contribution of the PCA can be observed by comparing the PCA–LMN and LGO–LMN. The average CMR of PCA–LMN is 6.38% higher than the average CMR of LGO–LMN in
, as shown in
Figure 9. This is because the proposed PCA-enhanced method is more stable and can accurately capture the structure direction of remotely sensed multimodal images when compared with the log-Gabor orientation method, as described in parts 1 and 2 of
Section 3. A clear contribution of the LMN can be observed by comparing the PCA–LMN and PCA–SAD. The average CMR of PCA–LMN is 22.50% higher than that of the PCA–SAD in
, as shown in
Figure 9. This indicates that gradient reversal is a significant problem in matching remotely sensed images, as emphasized by numerous other works in this field of research [
9,
10,
35]. Clearly, the matching performance considerably can be improved by resolving the gradient reversal problem with the proposed LMN.
In tests
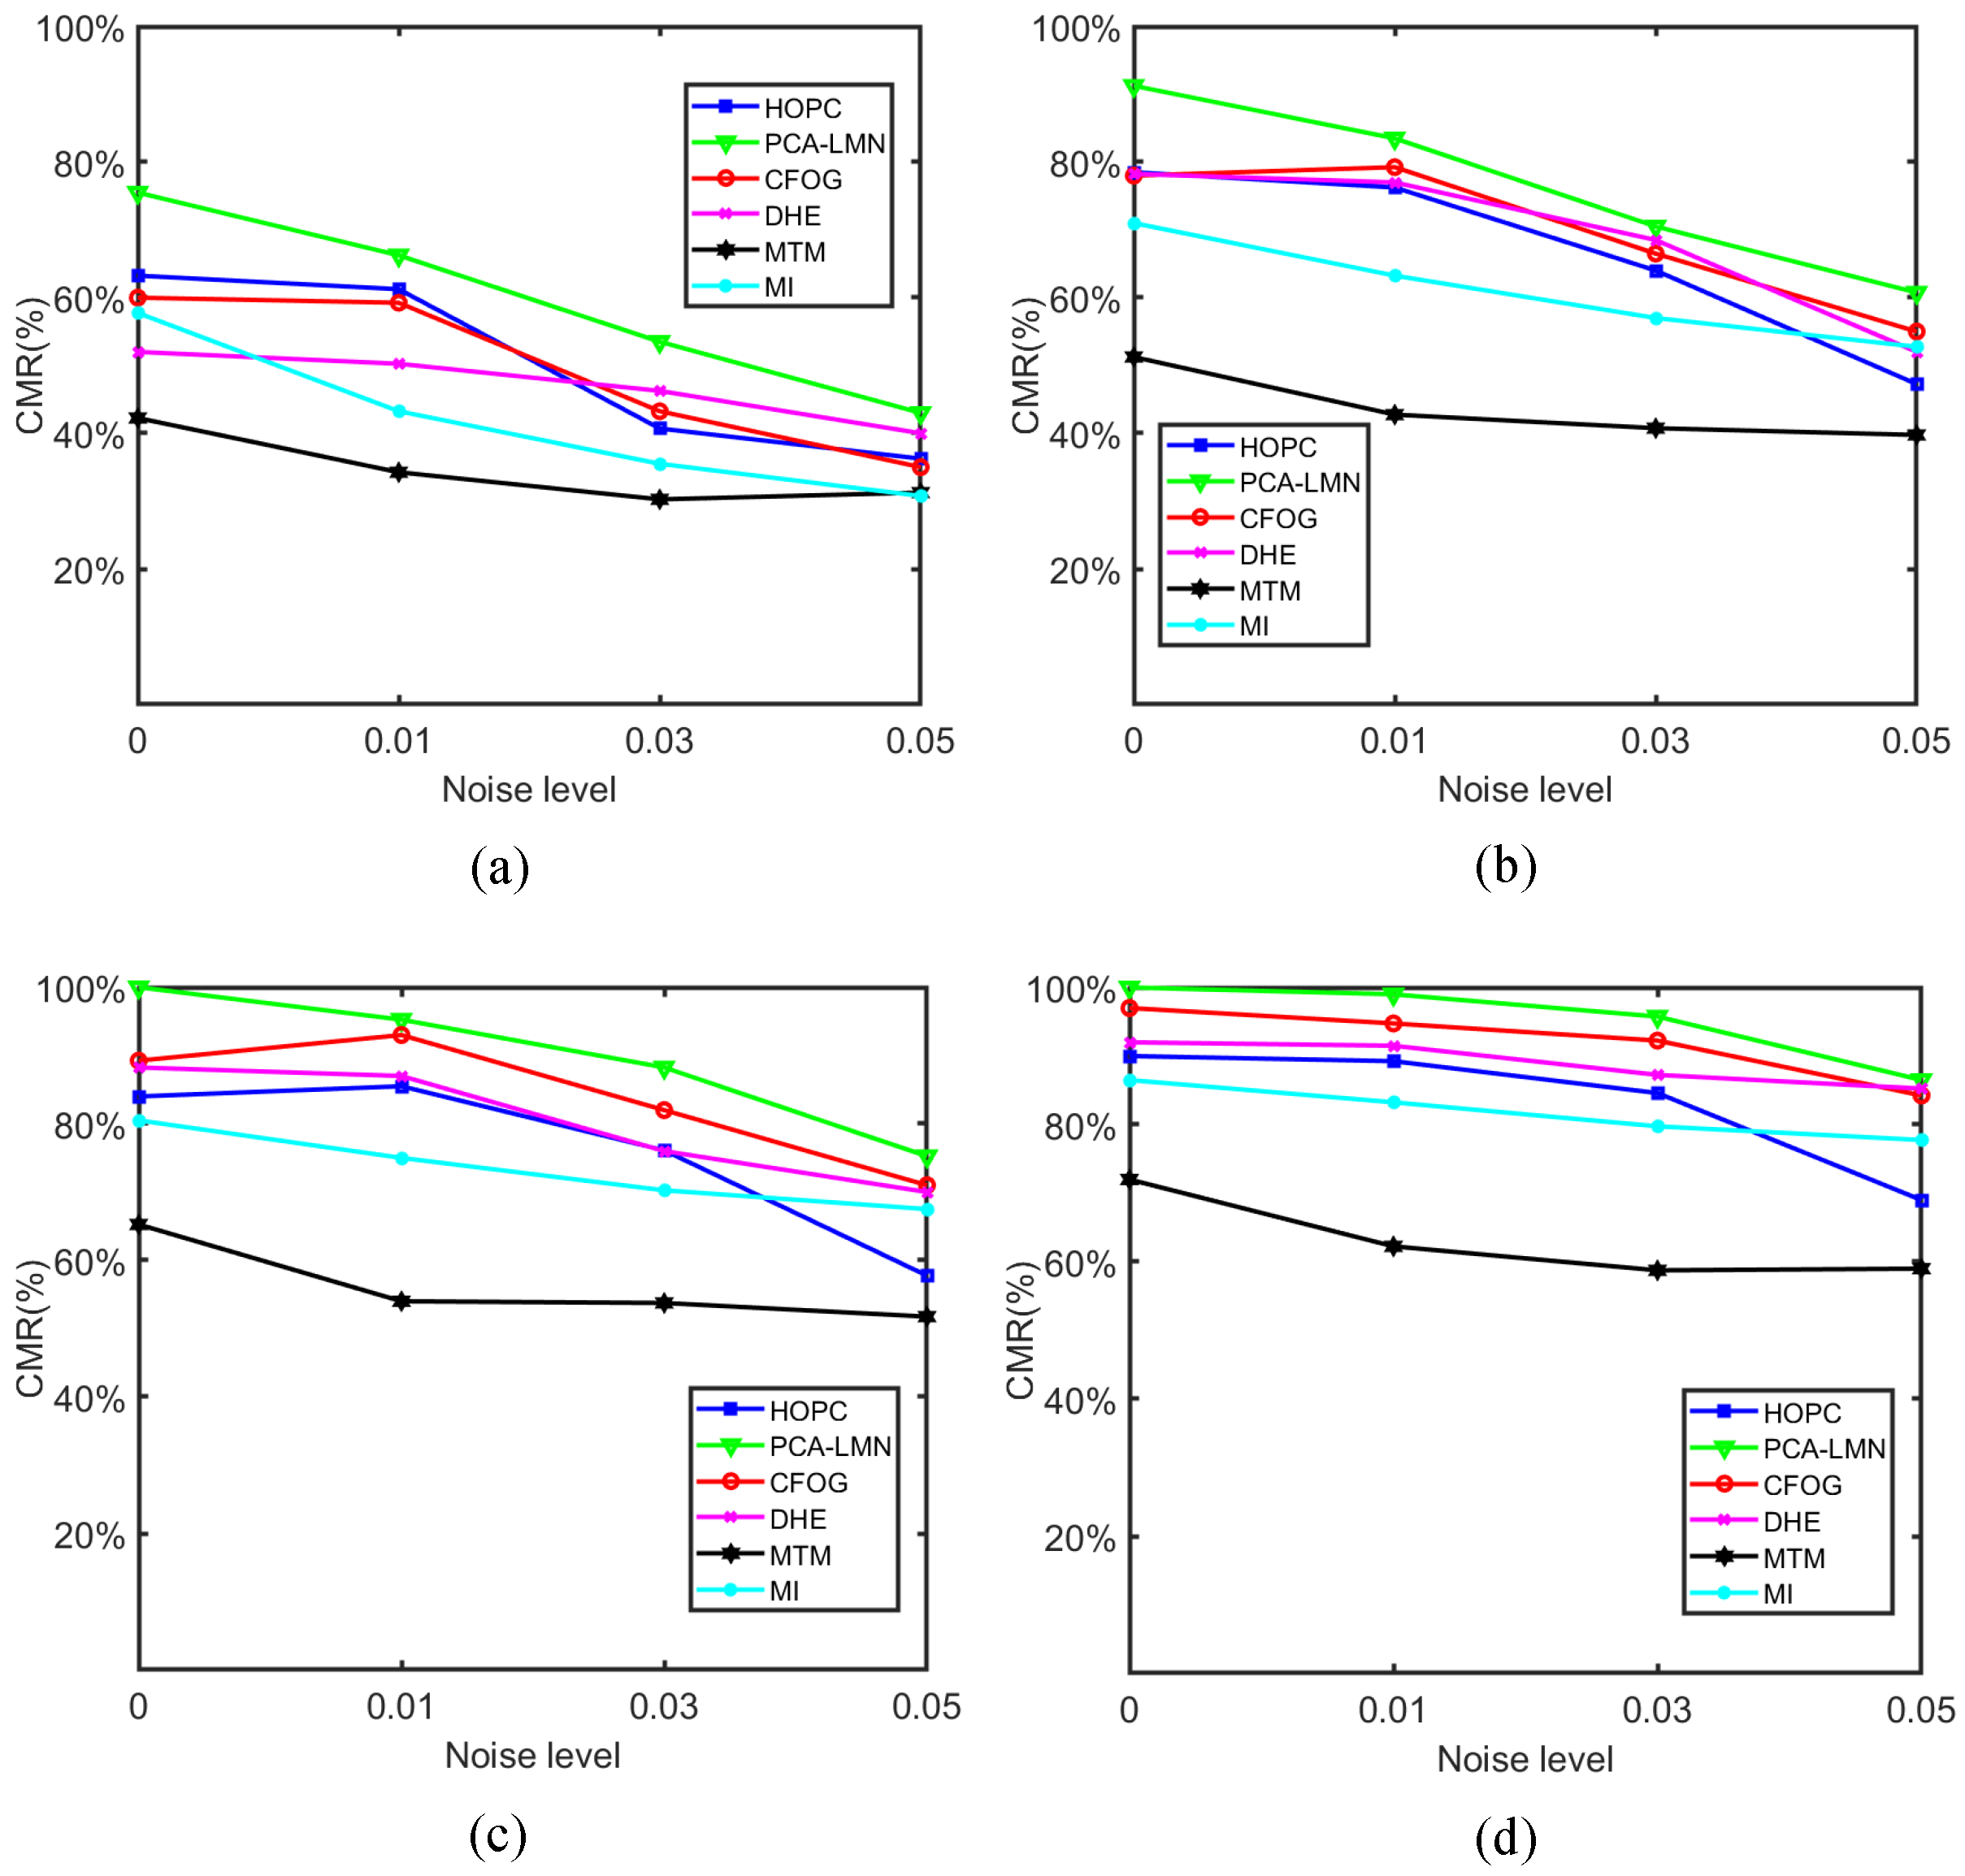
, Gaussian noise is added to the test images to evaluate the noise adaptability of the investigated algorithms;
Figure 11 shows the matching results. Notably, the CMRs of the algorithms decrease as the noise level increases. The CMRs of the structure feature-based algorithms (i.e., HOPC, CFOG, and PCA–LMN) decrease faster than the three algorithms directly based on the image grayscale (MTM, and MI). This indicates that the structure feature-based methods are more sensitive to noise distortion than the methods directly based on the image grayscale. This trend is assumed to occur because structural features can be easily distorted by image noise. For example, the log-Gabor orientation used in the HOPC, and the gradient orientation employed by the CFOG, are considerably sensitive to noise distortion. However, the structure orientation of the proposed method is enhanced by the PCA, which has considerably better noise adaptiveness than the log-Gabor and gradient orientations. Therefore, compared with the CFOG and HOPC, the PCA–LMN shows a significant advantage in tests
. In these tests, the average CMR of PCA–LMN is 80.27%, which is 6.54% and 11.29% higher than that of the CFOG and HOPC, respectively.
5. Conclusions
In this paper, we propose a novel approach that combines PCA-based noise adaptiveness with a learnable matching network to address the challenge of matching remotely sensed multimodal images. Our method focuses on enhancing the noise adaptiveness of structural features and providing a robust trainable measurement of similarity while regressing transform parameters.
By integrating the learnable matching network with PCA-enhanced structure features, our proposed method effectively handles the complex radiometric variations that exist among remotely sensed multimodal images. This adaptability is crucial in achieving robust image matching. As demonstrated in the experiments, the PCA–LMN approach achieves the best matching performance among all the methods evaluated. The average CMR achieved by PCA–LMN is 91.69%, which surpasses the CMR of CFOG, the best traditional method, by 10.63%.
The ablation study in
Section 4.3 further revealed that the improved performance of PCA–LMN can be attributed to two main factors. Firstly, PCA–LMN benefits from the PCA orientation enhancement, which enables accurate capture of structural features even in the presence of significant noise distortions. This enhancement plays a vital role in matching multimodal images with challenging noise distortions. Secondly, LMN is trained to adapt to gradient reversal caused by radiometric differences among remotely sensed multimodal images. This adaptability allows for more precise measurements and better handling of radiometric variations compared to traditional methods.
Furthermore, our method offers the advantage of not requiring the training of a deep convolutional neural network for feature extraction. This makes it easy to train and deploy, and it can achieve stable performance even with small training datasets. The testing results in
Section 4.3 show that PCA–LMN does have a significant advantage over DHE (which employs deep convolutional neural network for feature extraction) when the training dataset is small.
While our proposed method demonstrates superior performance, it is important to note that it lacks the ability to handle rotation and scale variations between images. As a prerequisite for accurate matching, it is necessary to correct the template’s direction and scale to align them with the base image approximately. Failure to do so can result in changes to directional features due to rotation and alterations to the scale of extracted features caused by image scaling.
