Article

Multiclass Apple Varieties Classification Using Machine Learning with Histogram of Oriented Gradient and Color Moments

by
Alper Taner
1,*,†,
Mahtem Teweldemedhin Mengstu
1,2,†,
Kemal Çağatay Selvi
1,
Hüseyin Duran
1,
Önder Kabaş
3,
İbrahim Gür
4,
Tuğba Karaköse
1 and
Neluș-Evelin Gheorghiță
5,*
1
Department of Agricultural Machinery and Technologies Engineering, Faculty of Agriculture, Ondokuz Mayıs University, 55200 Samsun, Turkey
2
Department of Agricultural Engineering, Hamelmalo Agricultural College, Keren P.O. Box 397, Eritrea
3
Vocational School of Technical Science, Akdeniz University, 07000 Antalya, Turkey
4
Fruit Research Institute, 32500 Isparta, Turkey
5
Department of Biotechnical Systems, Faculty of Biotechnical Systems Engineering, University Polytehnica of Bucharest, 006042 Bucharest, Romania
*
Authors to whom correspondence should be addressed.
These authors contributed equally to this work.
Appl. Sci. 2023, 13(13), 7682; https://doi.org/10.3390/app13137682
Submission received: 2 June 2023 / Revised: 24 June 2023 / Accepted: 27 June 2023 / Published: 29 June 2023

Abstract

:
It is critically necessary to maximize the efficiency of agricultural methods while concurrently reducing the cost of production. Varieties, types, and fruit classification grades are crucial to fruit production. High expenditure, inconsistent subjectivity, and tedious labor characterize traditional and manual varieties classification. This study developed machine learning (ML) models to classify ten apple varieties, extracting the histogram of oriented gradient (HOG) and color moments from RGB apple images. Support vector machine (SVM), random forest classifier (RFC), multilayer perceptron (MLP), and K-nearest neighbor (KNN) classification models were trained with 10-fold stratified cross-validation (Skfold) by using the textural and color features, and a GridSearch was implemented to fine-tune the hyperparameters. The trained models, SVM, RFC, MLP, and KNN were tested with separate test data and performed well, having an accuracy of 98.17%, 96.67%, 98.62%, and 91.28%, respectively. Having the top results, the MLP and SVM models demonstrated the potential of applying HOG and color moments to train ML models for classifying apple varieties. This study suggests conducting further research to thoroughly examine additional image features and determine the impact of combining features and utilizing different classifiers.

1. Introduction

Apple (Malus communis L.) is a well-known fruit species in the world, belonging to the Malus genus of the Pomoideae subfamily of the Rosaceae family [1]. It is among the most agriculturally important species and the most produced fruit worldwide [2,3], having a wide range of ecological adaptability across the world [4]. Unlike other fruits, the apple is a type of fruit that is easily recognized and sought after by consumers based on its variety [5].
Therefore, its variety is important in the marketing of apples. As a result of the developments in the fruit industry, the number of apple varieties has increased considerably in recent years [6]. Since it is a type of fruit that is suitable for the taste and income levels of many people worldwide, it has a significant trade proportion. It is a type of fruit that is traded the most globally, and consumer demands change very quickly. Meeting this demand is not difficult for countries where intensive cultivation is carried out [7]. Apple, the most common and oldest fruit, is mainly consumed for table purposes, and it is also used in purees, chips, vinegar, teas, jams, marmalades, medicinal plants, and fruit juices [8].
According to the statistical database of the Food and Agricultural Organization for the years between 1994 and2021, among the top ten apple producers, Turkey is the third largest producer, with an average apple production of 2.7 million tons following the U.S.A. and China as represented in Figure 1 [9].
It is critically necessary to maximize the efficiency of agricultural methods while concurrently reducing the cost of production and environmental load to address associated problems that negatively affect the agricultural sector [10]. These two components, in particular, have expedited the transition of farm activities to precision agriculture. The modernization of agriculture has the potential to guarantee environmental safety, maximum productivity, and sustainability [11].
In several scientific disciplines, including plant taxonomy, botanical gardens, and the discovery of new species, automatic recognition of crops has drawn a lot of interest. Analysis of plant organs, including leaves, stems, fruits, flowers, roots, and seeds, can be used to identify and categorize different species of plants. As a subfield of artificial intelligence (AI), machine learning is a series of algorithms that can extract relevant information from data and utilize that information in self-learning to make accurate classifications or predictions, and due to its precision and dependability, machine learning has become increasingly popular.
Varieties and types of fruit classification are crucial to food commercialization [12]. Traditional manual varieties classification has various real-world problems, such as high costs, inconsistent subjectivity, and tedious labor. To overcome these deficiencies, many researchers have focused on automated crop varieties classification systems to distinguish different apple varieties. Image processing and machine learning are widely used to classify apple varieties. Other researchers classified three apple varieties by training K-nearest neighbor (KNN) and multi-layer perceptron (MLP) classifiers [13].
Similarly, another investigation showed that Naive Bayes has good potential for the identification of apple varieties nondestructively and accurately [14]. In a study to classify six apple varieties [15], ML algorithms were trained by extracting statistical, textural, geometrical, discrete wavelet transform, a histogram of the oriented gradient (HOG), and Law’s energy texture features. Huang et al. [16], in their study of the identification of apple varieties using a multichannel hyperspectral imaging system, developed partial least squares discriminant analysis (PLSDA) models, and demonstrated that the multichannel hyperspectral imaging system has potential for apple variety detection. Li et al. [17] also developed a shallow convolutional neural network (CNN) for apple species classification and concluded that the model presented an alternative in classification-related tasks and brings attention to reducing the complexity of deep neural networks. The study highlights the importance of feature selection and classifier choice in image classification tasks.
De Goma et al. [18] studied the recognition of 15 different kinds of fruits using surface and geometric features and showed that by combining all features, namely color, texture, size, and shape, the overall recognition rate for all classifiers increased and reported that KNN outperformed the other classifiers. In their study on fruit classification, Patel and Chaudhari [19] examined six types of fruit including apple, banana, orange, pear, watermelon, and mango. They used thresholding and morphological processing to identify the area of interest and extract features such as color, area, centroid, zone, perimeter, size, and roundness and they employed five different machine learning algorithms: KNN, SVM, Naive Bayes, random forest, and neural network to classify the fruits.
To identify the type of seasonal fruits and detect spoiled ones, ref. [20] trained KNN and SVM algorithms using color and texture features and distinguished four types of fruit and detected spoiled fruit among fresh ones. A similar study was conducted on fruit recognition and classification using shape-based features for auto-harvesting [21]. They classified seven fruit types based on features such as fruit area, perimeter, major and minor axis lengths, and distance between the foci of an equivalent ellipse by employing the Naive Bayes classifier. In their study, Macanha et al. [22] utilized two feature descriptor methods to classify 15 different fruit types, using images with white backgrounds obtained from the internet. The zoning and character edge descriptor features were combined with discrete Fourier transform to extract the features. MLP and KNN classifiers were adopted. In their work to analyze visual features and classifiers to classify fruit types, Ghazal et al. [23] investigated the combination of hue, color-SIFT, discrete wavelet transform, and Haralick features by comparing the results obtained from six supervised machine learning techniques including KNN, SVM, Naive Bayes, linear discriminant analysis, decision trees, and feed forward back propagation neural network.
Applying statistical features to classify ten fruit types, other researchers utilized color and texture features [24]. In the feature extraction processes, they used HSV color space to perform thresholding and extract the region of interest, extracting color features through hue and saturation. The luminance channel was subjected to a three-level discrete wavelet transform to obtain texture features.
Therefore, our study aims to develop an efficient and repeatable system for classifying ten apple varieties by extracting textural and color features from RGB apple images. Developing a robust ML model depends on the application of representative features, the right combination of extracted features whenever different types of parameters are involved, and dimensionality reduction in the presence of numerous features. Thus, this study investigated the effect of combining textural (HOG) and color features (color moments) and compared the performances of widely used ML algorithms to find the best-performing classifier for apple varieties classification. Overall, combining HOG and color moments is what makes this study different from the aforementioned studies and its contribution is to investigate the effect of feature fusion in enhancing the classification accuracy of ML algorithms to classify apple varieties.
The rest of the article is organized as follows: Section 2, Materials and Methods, includes the data collection, feature extraction, training, and testing classification algorithms; Section 3 and Section 4 comprise the results and discussion of the experiment; followed by a conclusion in Section 5.

2. Materials and Methods

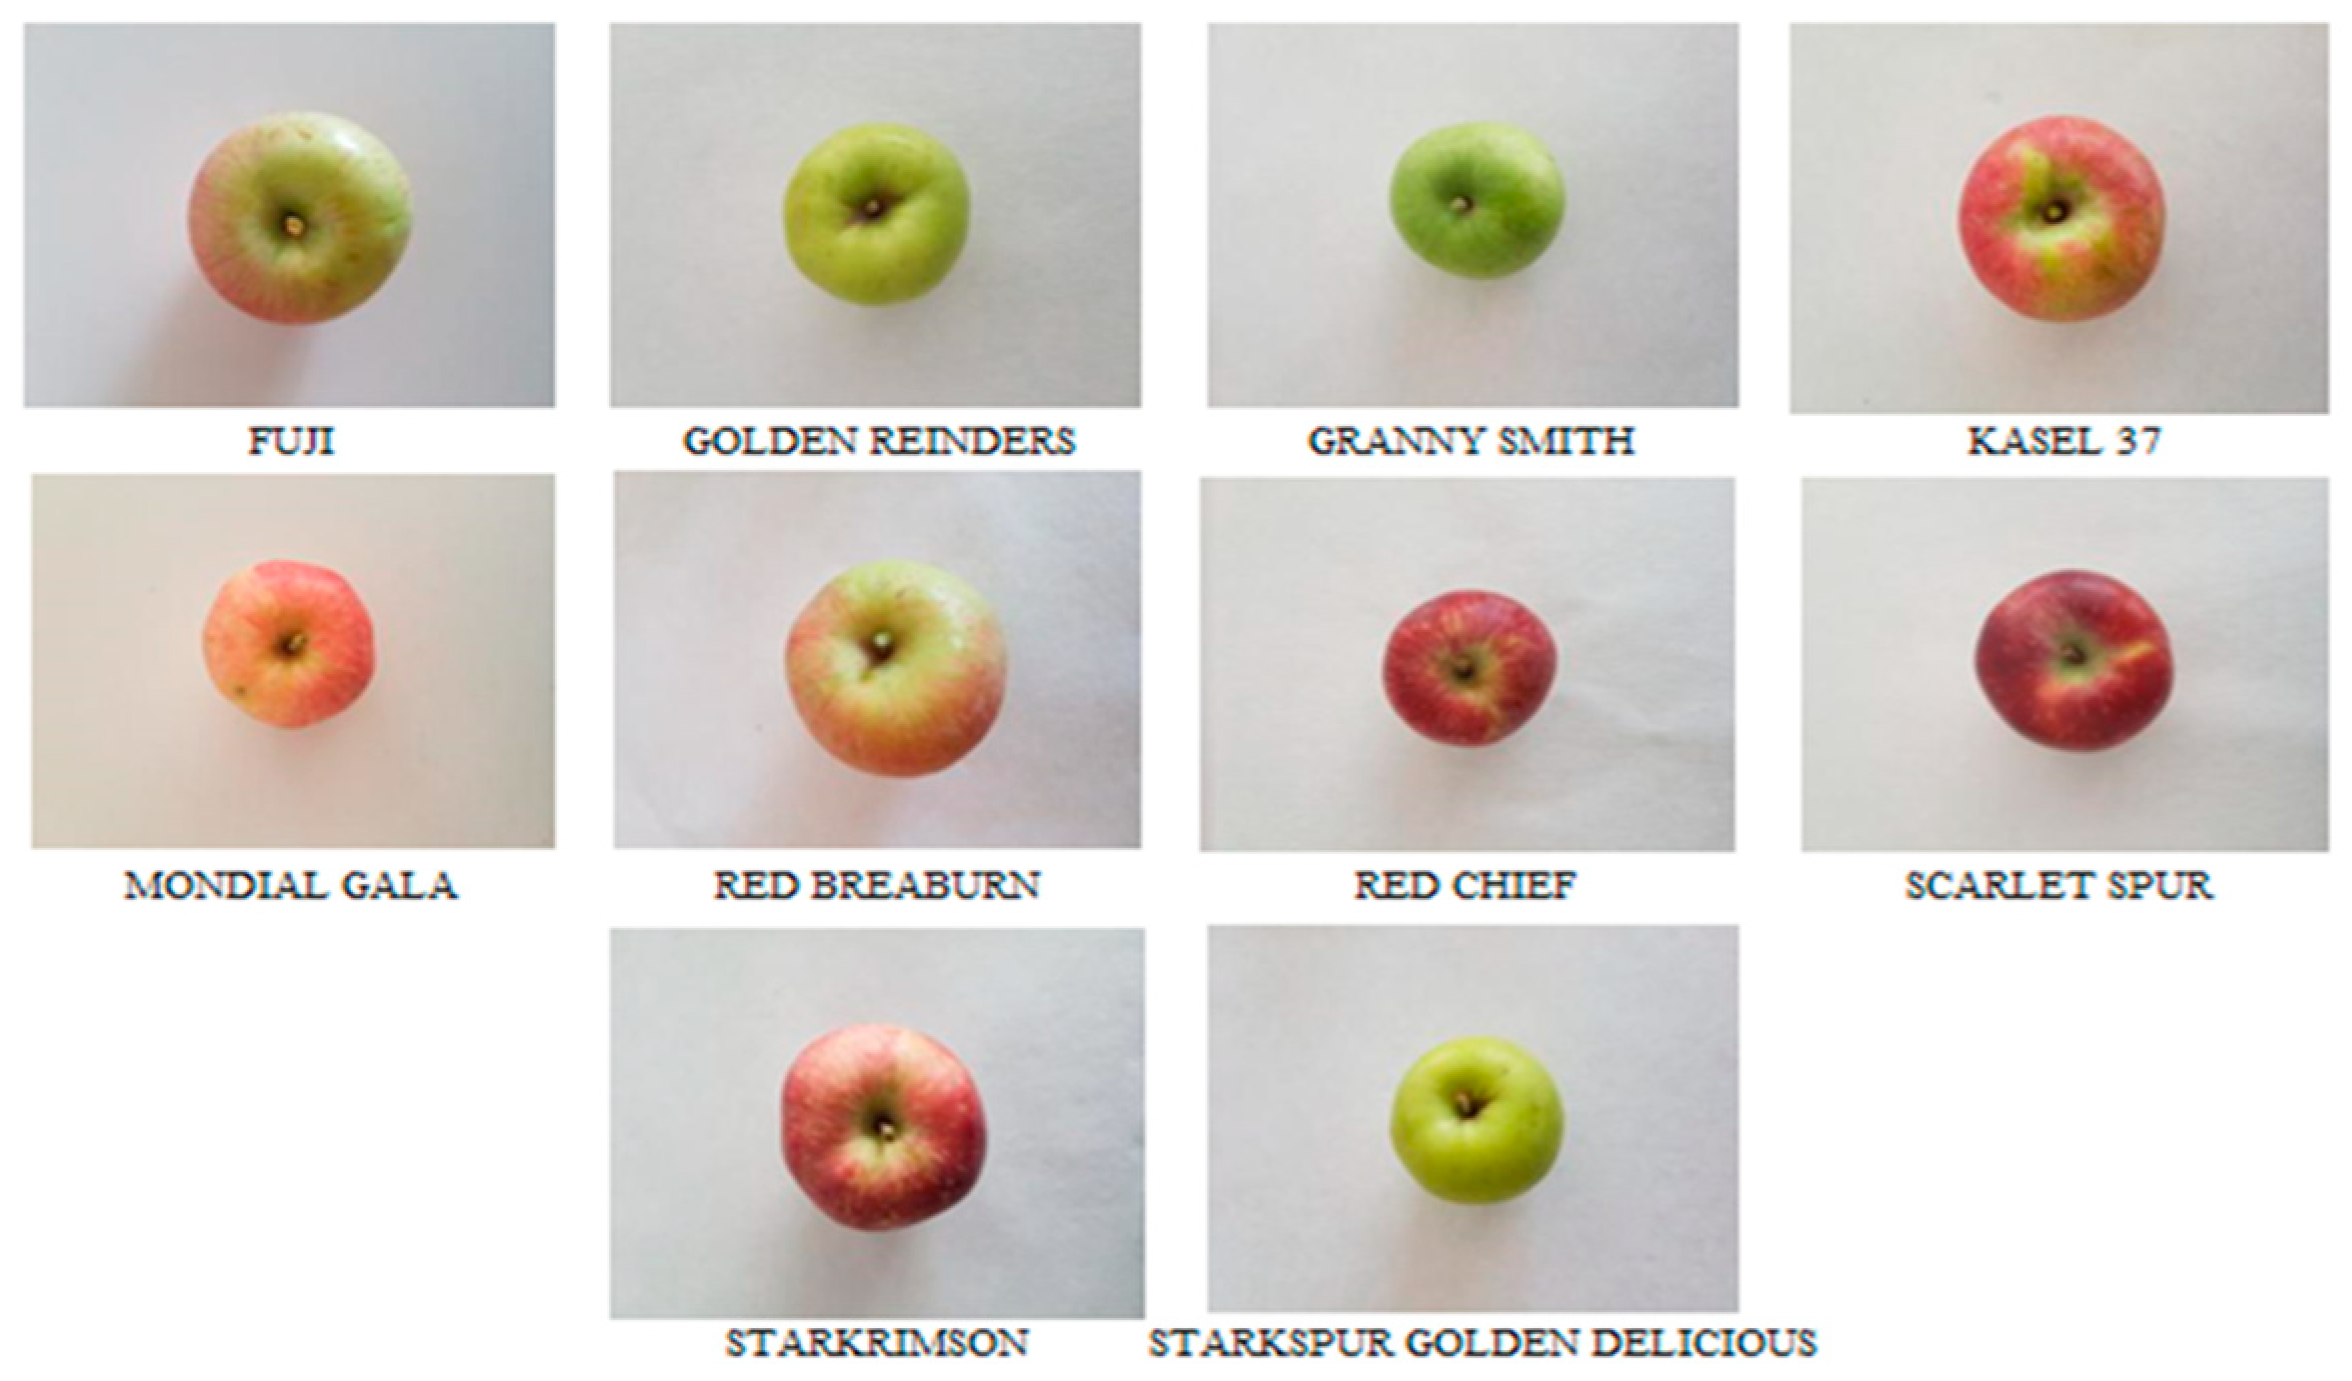
2.1. Image Acquisition

Our study used ten apple varieties commonly grown in Turkey (Figure 2). The apples were obtained from the Republic of Turkey’s Ministry of Agriculture and Fruit Research Institute. A camera with a resolution of 20 megapixels was used to capture images. All images were taken from a distance (20 cm) where the apples were put on a setup prepared for image acquisition. To make the quality of images as uniform as possible all images were taken under the same light condition. According to the availability of each variety, a total of 5830 images, a maximum of 669 (Starkspur Golden Delicious), and a minimum of 477 (Fuji and Mondial Gala) images were captured.
In an attempt to increase diversified representations from a single image, image acquisition was made in top and side views. The details of the data, total images, and portions used in training, validation, and testing have been provided in Table 1.

2.2. Image Features Extraction

Image feature extraction is the process of automatically identifying and extracting notable and meaningful information or representations from digital images. It can also be defined as reducing a large amount of raw data into smaller and more manageable representations [25]. Feature extraction involves identifying and describing an image’s key visual characteristics or features, such as edges, corners, textures, shapes, colors, and patterns [26].
Image feature extraction aims to reduce the complexity of an image by extracting the most important and relevant information that represents the original image [27]. Feature extraction is beneficial for various applications, such as object recognition, image retrieval, medical imaging, video surveillance, and other related tasks [28].
Multiple techniques and algorithms are used for image feature extraction, including edge detection, corner detection, blob detection, and texture analysis. In feature extraction, different techniques can be employed individually or in combination to extract a wide range of features [29]. The extracted features can be used as inputs to machine learning algorithms for image classification, object detection, and other problems. In our case, extracting color and texture features have been adopted. After capturing images of ten apple varieties, undertaking necessary preprocessing steps, color moments, and a textural feature, a histogram of oriented gradient (HOG), was extracted.

2.2.1. Histogram of Oriented Gradient HOG

The histogram of oriented gradient (HOG) is a popular feature descriptor used for object detection and recognition in computer vision [15]. As illustrated in Figure 3, it is a technique for extracting features from an image by analyzing the distribution of gradient orientations in local image patches [30].
In HOG feature extraction, the gradient magnitude and orientation for each pixel are computed using the Sobel operator or other edge detection algorithms, and the histogram distribution of oriented gradients of neighboring cells is normalized and concatenated into a single feature vector. In our case, 144 HOG features were extracted using MATLAB 2023a, “extractHOGFeatures” method with a filter cell size of 64 × 64.

2.2.2. Color Moments

Color moments are measures used to differentiate images based on the features of their color. Once calculated, these moments measure color similarity between images and are employed as inputs to train machine learning models [31,32]. Taking the RGB color space, mean (M), standard deviation (SD), skewness (Sk), kurtosis (K), and entropy (E) of each R, G, and B channels were computed by using MATLAB, image batch processor and 15 color moments were calculated for each image. The expressions below are used to compute color moments where Xi, N, and Pi denote input data, number of data points, and normalized histogram of the count, respectively.
M = 1 N i = 1 N Xi
SD = 1 N 1 i = 1 N Xi M 2
Sk = 1 N 1 i = 1 N Xi M 3 SD 3
k = 1 N 1 i = 1 N Xi M 4 SD 4
E = i = 1 m Pi log 2 Pi

2.3. Features Used for Training

The dataset in this work is obtained from color and texture image feature extraction in training the machine learning algorithms. The dataset consists of 159 attributes (144 HOG Features and 15 RGB color moments), and 5830 instances of ten (10) apple labels or classes, namely Fuji, Golden Reinders, Granny Smith, Kasel 37, Mondial Gala, Red Braeburn, Red Chief, Scarlet Spur, Starkrimson, and Starkspur Golden Delicious.

2.4. Machine Learning Classification Models

In this study, machine learning classifiers, namely support vector machine (SVM), a technique that involves finding the optimal separation surface between classes with the identification of the most representative training samples of the class known as support vectors [33]; random forest classifier (RFC), a combination of tree predictors such that each tree depends on the values of a random vector sampled independently and with the same distribution for all trees in the forest [34]; K-nearest neighbor (KNN) instance-based models based on learning by analogy, which is by comparing a given test tuple with training tuples that are similar to it [35]; and multilayer perceptron (MLP), a series of algorithms that simulate human brain structure and function based on interconnected nodes in which simple processing operations take place were trained and tested using the 144 HOG features and 15 color moments [36].
During the training, stratified cross-validation (Skfold) was applied. In applying Skfold, data points of each class are proportionally distributed across the k-fold. In other words, in k-fold cross-validation (CV), a dataset is not arbitrarily distributed into k-fold but in a manner that does not disturb the sample distribution ratios in the classes. In k-fold CV, class distribution rates are not considered, whereas, in Skfold, data are proportionally split among each fold. Thus, Skfold gives a more reliable prediction and, eventually, better accuracy than the normal k-fold CV method [37].
Hence, this study used Skfold because the data distribution across classes is not proportional. Moreover, we used a GridSearch approach to fine-tune hyperparameters to obtain the best parameters of every machine learning model trained in this study. Figure 4 shows the overall process of feature extraction and model training.

2.5. Performance Measures

The performance of the classification algorithms was evaluated using metrics of accuracy (Equation (6)), the proportion of correct predictions; precision (Equation (7)), the proportion of true positive predictions out of all positive predictions; recall (Equation (8)), the proportion of true positive predictions out of all actual positive instances; specificity measures the proportion of true negative predictions out of all actual negative instances (Equation (10)); and F1-score (Equation (9)), the weighted harmonic mean of precision and recall.
To examine the trade-off between true positive rate (TPR) and false positive rate (FPR), AUC-ROC (area under the receiver operating characteristic curve), and the trade-off between precision and recall for different classification thresholds, AUC-PR (area under the precision-recall curve) were used. In addition, we considered Cohen’s kappa (Equation (11) where Po: relative observed agreement among raters, and Pe: relative observed agreement among raters), a measure of inter-rater agreement expected by chance. Additionally, we used MCC (Matthews correlation coefficient) (Equation (12)), which represents the correlation between the predicted and actual classifications to assess the overall performance of the models [38].
As provided in the equations below, the performance metrics were computed using the following: the true positives (TP) objects, where their actual label is positive and whose class is correctly predicted as positive; the true negatives (TN) objects, where the actual label is negative and whose class is correctly predicted to be negative; the false positives (FP) objects, where the actual label is negative and whose class label is incorrectly predicted as positive; and the false negatives (FN) objects, where the true label is positive and whose class is incorrectly predicted as negative as obtained from the confusion matrix of the classification results of every model [38].
Accuracy = TP   +   TN TP   +   TN + FP + FN
Precision = TP TP   +   FP
Recall   = TP TP   +   FN
F 1 Score = 2 Precision Recall Precison + Recall
Specificity = TN TN + FP
K = P 0 Pe 1 Pe
MCC = TP TN FP FN TP + FP TP + FN TN + FP TN + FN

3. Results

The classification models, KNN, SVM, RF, and MLP, were trained using Scikit-learn, an open-source machine learning Python library. All models were trained with 10 Skfold, and a GridSearch was implemented to fine-tune the hyperparameters. The accuracy, precision, recall, specificity, F1-score, AUC-ROC, AUC-PR, Cohen’s Kappa, and MCC performance metrics calculated from the confusion matrices of each model are provided in Table 2.
The performance metrics in the figures above and below show the evaluation of the four ML models trained and tested on a test dataset and provide information about how well each model performed in terms of accuracy, precision, recall, specificity, F1-score, AUC-ROC, AUC-PR, Cohen’s kappa, and Matthews correlation coefficient (MCC).
According to Figure 5, a confusion matrix of the classification of the SVM model, out of 872 predictions, the overall accuracy was 98.17%, in which 15 misclassifications were found, out of which four instances were misclassified as Starkrimson.
Examining the results of the RFC in Figure 6, having an accuracy of 96.67%, a total of 20 misclassifications occurred. Similar to SVM, the highest confusion was between the Red Braeburn and Starkrimson varieties.
As shown in Figure 7, the MLPs confusion matrix shows the highest accuracy of 98.62% and the least misclassifications of 11 instances. Unlike all three models, the highest confusion was among the Red Braeburn and Fuji varieties.
Figure 8 also represents the confusion matrix according to KNN. The model achieved the lowest accuracy rate of 91.2% compared to the remaining three. A total of 78 misclassifications were observed, of which 18 instances belonging to Red Braeburn were confused with Starkrimson.
As detailed in each table above, confusion matrices representing the classification results of all models for 10 different apple varieties were tested using a separate test dataset.
The matrices represented actual classes in their rows, and the predicted classes are provided in the columns with the number of instances that were classified into each class given in each cell. In all the matrices examining cells with the highest off-diagonal values, we can observe that in all four models, Red Braeburn and Starkrimson are the most often confused with each other, likely due to the natural resemblance of the two varieties.

4. Discussion

In a task to recognize fruits and vegetables by blending color, shape, and texture features, ref. [39] used classifiers such as KNN, linear discriminant analysis, Naive Bayes, error-correcting output classifier, and decision tree classifier. A 10 cross-validation technique is used, and KNN achieved a classification accuracy of 97.5% with 2400 images from 24 categories of fruits and vegetables. Likewise, in an attempt to classify six apple varieties, Adige et al. [40] applied a bag of visual words (BoVW) and reported an accuracy of 96% using polynomial SVM. In the development of an automatic apple grading model, which classifies apples in real-time based on physical parameters of apples such as size, color, and external defects, ref. [41], reported that the ANN sorter achieved an accuracy of 96% during overall grading.
In a task of automatic apple sorting system using machine vision, Golden and Starking Delicious, and Granny Smith apple cultivars were sorted into different classes by their color, size, and weight, and the system achieved a sorting accuracy rate of 73–96% using decision tree [42]. In their study to classify six apple varieties [15], researchers achieved the highest accuracy of 95.27% using statistical, textural, geometrical, discrete wavelet transform, HOG, and Laws’ energy texture features with an SVM classifier.
In related studies, ref. [21] used shape-based features to classify seven fruit types and achieved 95% accuracy using the Naive Bayes classifier. Similarly, in another study were utilized two feature descriptor methods to classify 15 fruit types with a maximum accuracy of 97% using MLP and KNN classifiers [22]. Ghazal et al. [23] compared the performance of six supervised machine-learning techniques to classify fruit types based on visual features. They combined Hue, Color-SIFT, Discrete Wavelet Transform, and Haralick features and reported classification accuracies between 99% and 100% using back propagation neural network, SVM, and KNN classifiers. In their study, ref. [24] employed color and texture features to classify ten fruit types using an SVM classifier.
Researchers in [24] utilized HSV color space for thresholding and region of interest extraction and extracted color features through hue and saturation. Texture features were obtained by subjecting the luminance channel to three level discrete wavelet transform. Their results showed that the SVM classifier achieved an accuracy of 95.3%. Moreover, ref. [19] classified six fruit types: apple, banana, orange, pear, watermelon, and mango. Using thresholding and morphological processing, they extracted features such as color, area, centroid, zone, perimeter, size, and roundness, and out of five algorithms SVM achieved the highest accuracy of 91.67%.
Similarly, [20] used color and texture features to identify fruit types. They employed a KNN classifier, which achieved an accuracy of 96% to identify seasonal fruits and detect rotten fruit among fresh ones. For detecting rotten fruit, they used the SVM classifier, which achieved a performance of 98%.
A comparison showing the performance results of our proposed method and previous studies discussed in the above paragraphs has been provided in Table 3.
In our study, within the broader context of related studies, it can be inferred that the effectiveness of the strategy applied, and the results, are promising with the application of combined color moment and HOG features and a 10 Skfold technique. Comparatively, our approach outperformed related results, likely due to the incorporation of color moments as an additional feature, which has been shown to enhance the classification accuracy of apple varieties with increased classes.
According to the performance metrics (Table 2) of all models, MLP performed best, with the highest values for accuracy (98.62%), precision (98.59%), recall (98.41%), and F1-score (98.48%). MLP also has the highest AUC-ROC (99.99%) and AUC-PR (99.9%) values among the four models, indicating excellent discrimination power. Cohen’s kappa and MCC values are also high, indicating strong agreement between predicted and actual classes. SVM has also performed well with accuracy (98.17%), precision (98.2%), recall (97.97%), and F1-score (98.07%). It also has a high AUC-ROC (99.85%) and AUC-PR (98.89%), indicating good discrimination power and performing well across different classification thresholds.
Similarly, Cohen’s kappa and MCC values are also high, as in MLP, signifying strong agreement between predicted and actual classes. Relatively, RFC and KNN have lower accuracy, precision, recall, and F1-score values compared to SVM and MLP, especially an accuracy of 91.28% obtained by KNN is significantly different from all models. However, they still have good discrimination power, as indicated by their high AUC-ROC and AUC-PR values. Cohen’s kappa and MCC values are also above 90%, indicating strong agreement between predicted and actual classes. Based on the provided performance metrics, MLP and SVM appear to be the best-performing models for this dataset, showing that HOG and color moment can be successfully applied to train ML models and classify apple varieties.

5. Conclusions

Varieties and types of fruit classification are significant parts of the food industry. Image processing and machine learning have been widely used in classifying apple varieties. Our approach demonstrated the potential of ML models for accurate and efficient classification of ten apple varieties trained by combining HOG and color moments features. During the training, Skfold was applied because the data distribution across classes was not proportional. Moreover, a GridSearch approach was utilized to fine-tune hyperparameters to obtain the best parameters of every machine learning model trained.
The trained models SVM, RFC, MLP, and KNN were tested with separate test data and performed well, having an accuracy of 98.17%, 96.67%, 98.62%, and 91.28%, respectively. The study demonstrated the importance of ML-based models for quality control and monitoring of apple production and could lead to improvements in the apple industry. However, future research is required to adequality explore several other image features and the effect of combined features and different classifiers while increasing the number of varieties to be classified. Moreover, applying deep learning, which can potentially enhance the accuracy and efficiency of apple varieties classification, needs to be investigated.

Author Contributions

Conceptualization, A.T. and M.T.M.; methodology, A.T. and M.T.M.; software, K.Ç.S., H.D. and Ö.K.; validation, İ.G., H.D. and T.K.; formal analysis, N.-E.G. and A.T.; investigation, A.T. and M.T.M.; resources, N.-E.G. and İ.G.; data curation, M.T.M. and A.T.; writing—original draft preparation, A.T., K.Ç.S., M.T.M. and N.-E.G.; writing—review and editing, Ö.K., H.D., T.K. and K.Ç.S.; visualization, İ.G.; supervision, A.T. and M.T.M.; funding acquisition, N.-E.G. All authors have read and agreed to the published version of the manuscript.

Funding

The APC was funded by the University Politehnica of Bucharest, Romania, within the PubArt Program.

Institutional Review Board Statement

Not applicable.

Informed Consent Statement

Not applicable.

Data Availability Statement

Conflicts of Interest

The authors declare no conflict of interest.

References

  1. Özbek, S. Special Fruiting; No: 128, 1978 Textbook: 11; Ç.Ü. Faculty of Agriculture Publications: Adana, Turkey, 1978. (In Turkish) [Google Scholar]
  2. Wang, N.; Joost, W.; Zhang, F.S. Towards sustainable intensification of apple production in China-Yield gaps and nutrient use efficiency in apple farming systems. J. Integr. Agric. 2016, 15, 716–725. [Google Scholar] [CrossRef]
  3. Tijero, V.; Girardi, F.; Botton, A. Fruit Development and Primary Metabolism in Apple. Agronomy 2016, 11, 1160. [Google Scholar] [CrossRef]
  4. Chen, X.; Feng, T.; Zhang, Y.; He, T.; Feng, J.; Zhang, C. Genetic Diversity of Volatile Components in Xinjiang Wild Apple (Malus sieversii). J. Genet. Genom. 2007, 34, 171–179. [Google Scholar] [CrossRef] [PubMed]
  5. Popa, L.; Ciupercă, R.; Nedelcu, A.; Voicu, E.; Ştefan, V.; Petcu, A. Researches regarding apples sorting process by their size. INMATEH-Agric. Eng. 2014, 43–42, 97–102. [Google Scholar]
  6. Atay, A.N.; Atay, E. Innovational trends in apple breeding and cultivar management. Yüzüncü Yil. Univ. J. Agric. Sci. 2018, 28, 234–240. [Google Scholar]
  7. Bayav, A.; Konak, K.; Karamürsel, D.; Öztürk, F.P. Potential of Apple Production, Marketing and Export in Turkey. GAP IV. Agric. Congr. 2005, 1, 427–437. [Google Scholar]
  8. İşçi, M. Determination of Susceptibility Levels of Some Common Insecticides against Codling Moth (Cydia pomonella (L) Lep.: Tortricidae) Using in Apple Orchards of Isparta. Ph.D. Thesis, Süleyman Demirel University Graduate School of Applied and Natural Sciences Department of Plant Protection, Isparta, Türkiye, 2014. [Google Scholar]
  9. FAOSTAT. Food and Agriculture Organization of the United Nations. Available online: http://www.fao.org/faostat/en/#data/QC (accessed on 23 February 2021).
  10. Veringă, D.; Vintilă, M.; Popa, L.; Ştefan, V.; Petcu, A.S. Determination of the relaxation time at static compression of Idared apples variety. INMATEH-Agric. Eng. J. 2015, 47, 75–80. [Google Scholar]
  11. Lampridi, M.G.; Sørensen, C.G.; Bochtis, D. Agricultural sustainability: A review of concepts and methods. Sustainability 2019, 11, 5120. [Google Scholar] [CrossRef]
  12. Veringă, D.; Vintilă, M.; Popa, L.; Ştefan, V.; Petcu, A.S. Determination of the relaxation period at static compression of golden delicios apples variety. INMATEH-Agric. Eng. J. 2016, 48, 61–66. [Google Scholar]
  13. Sabanci, K.; Ünlerşen, M.F. Different apple varieties classification using KNN and MLP algorithms. Int. J. Intell. Syst. Appl. Eng. 2016, 8, 17–20. [Google Scholar] [CrossRef]
  14. Ronald, M.; Evans, M. Classification of selected apple fruit varieties using Naive Bayes. Indian J. Comput. Sci. Eng. (IJCSE) 2016, 7, 13–19. [Google Scholar]
  15. Bhargava, A.; Bansal, A. Classification and Grading of Multiple Varieties of Apple Fruit. Food Anal. Methods 2021, 14, 1359–1368. [Google Scholar] [CrossRef]
  16. Huang, Y.; Yang, Y.; Sun, Y.; Zhou, H.; Chen, K. Identification of Apple Varieties Using a Multichannel Hyperspectral Imaging System. Sensors 2020, 20, 5120. [Google Scholar] [CrossRef] [PubMed]
  17. Li, J.; Xie, S.; Chen, Z.; Liu, H.; Kang, J.; Fan, Z.; Li, W. A Shallow Convolutional Neural Network for Apple Classification. IEEE Access 2020, 8, 111683–111692. [Google Scholar] [CrossRef]
  18. De Goma, J.C.; Quilas, C.A.M.; Valerio, M.A.B.; Young, J.J.P.; Sauli, Z. Fruit recognition using surface and geometric information. J. Telecommun. Electron. Comput. Eng. (JTEC) 2018, 10, 39–42. [Google Scholar]
  19. Patel, C.C.; Chaudhari, V.K. Comparative Analysis of Fruit Categorization Using Different Classifiers. In Advanced Engineering Optimization through Intelligent Techniques; Springer: Berlin/Heidelberg, Germany, 2019; pp. 153–164. [Google Scholar]
  20. Nosseir, A.; Ahmed, S.E.A. Automatic Classification for Fruits’ Types and Identification of Rotten Ones using KNN and SVM. Int. J. Online Biomed. Eng. 2019, 15, 47. [Google Scholar] [CrossRef]
  21. Jana, S.; Parekh, R. Shape-based fruit recognition and classification. In Proceedings of the Computational Intelligence, Communications, and Business Analytics: First International Conference—CICBA 2017, Kolkata, India, 24–25 March 2017; Revised Selected Papers, Part II. Springer: Singapore; pp. 184–196. [Google Scholar]
  22. Macanha, P.A.; Eler, D.M.; Garcia, R.E.; Junior, W.E. Handwritten feature descriptor methods applied to fruit classification. In Advances in Intelligent Systems and Computing; Information Technology—New Generations; Latifi, S., Ed.; Springer: Cham, Switzerland, 2018; Volume 558, pp. 699–705. [Google Scholar]
  23. Ghazal, S.; Qureshi, W.; Khan, U.; Iqbal, J.; Rashid, N.; Tiwana, M. Analysis of visual features and classifiers for fruit classification problem. Comput. Electron. Agric. 2021, 187, 106267. [Google Scholar] [CrossRef]
  24. Kumari, R.S.S.; Gomathy, V. Fruit Classification using Statistical Features in SVM Classifier. In Proceedings of the 4th International Conference on Electrical Energy Systems (ICEES), Chennai, India, 7–9 February 2018; pp. 526–529. [Google Scholar] [CrossRef]
  25. Kumar, G.; Bhatia, P.K. A detailed review of feature extraction in image processing systems. In Proceedings of the Fourth International Conference on Advanced Computing & Communication Technologies, Washington, DC, USA, 8–9 February 2014; pp. 5–12. [Google Scholar]
  26. Jiang, X. Feature extraction for image recognition and computer vision. In Proceedings of the 2nd IEEE International Conference on Computer Science and Information Technology, Beijing, China, 8–11 August 2009; pp. 1–15. [Google Scholar] [CrossRef]
  27. Liang, H.; Sun, X.; Sun, Y.; Gao, Y. Text feature extraction based on deep learning: A review. EURASIP J. Wirel. Commun. Netw. 2017, 2017, 211. [Google Scholar] [CrossRef]
  28. Mutlag, W.K.; Ali, S.K.; Aydam, Z.M.; Taher, B.H. Feature extraction methods: A review. J. Phys. Conf. Ser. 2020, 1591, 012028. [Google Scholar] [CrossRef]
  29. Calzada-Ledesma, V.; Puga-Soberanes, H.J.; Rojas-Domínguez, A.; Ornelas-Rodriguez, M.; Carpio, M.; Gómez, C.G. A comparison of image texture descriptors for pattern classification. In Fuzzy Logic Augmentation of Neural and Optimization Algorithms: Theoretical Aspects and Real Applications, Computational Intelligence; Springer: Berlin/Heidelberg, Germany, 2018; Volume 749, pp. 291–303. [Google Scholar]
  30. Dalal, N.; Triggs, B. Histograms of oriented gradients for human detection. In Proceedings of the IEEE Computer Society Conference on Computer Vision and Pattern Recognition (CVPR), San Diego, CA, USA, 20–25 June 2005; IEEE Computer Society Press: Piscataway, NJ, USA, 2005; pp. 886–889. [Google Scholar]
  31. Kodituwakku, S.R.; Selvarajah, S. Comparison of color features for image retrieval. Indian J. Comput. Sci. Eng. 2011, 1, 207–211. [Google Scholar]
  32. Wang, Z.; Zhuang, Z.; Liu, Y.; Ding, F.; Tang, M. Color classification and texture recognition system of solid wood panels. Forests 2021, 12, 1154. [Google Scholar] [CrossRef]
  33. Liakos, K.G.; Busato, P.; Moshou, D.; Pearson, S.; Bochtis, D. Machine Learning in Agriculture: A Review. Sensors 2018, 18, 2674. [Google Scholar] [CrossRef] [PubMed]
  34. Breiman, L. Random Forests. Mach. Learn. 2001, 45, 5–32. [Google Scholar] [CrossRef]
  35. Han, J.; Kamber, M.; Pei, J. Data Mining Concepts and Techniques, 3rd ed.; Morgan Kaufmann Publishers: Burlington, MA, USA, 2012. [Google Scholar]
  36. Kujawa, S.; Niedbała, G. Artificial Neural Networks in Agriculture. Agriculture 2021, 11, 497. [Google Scholar] [CrossRef]
  37. Zeng, X.; Martinez, T.R. Distribution-balanced stratified cross-validation for accuracy estimation. J. Exp. Theor. Artif. Intell. 2000, 12, 1–12. [Google Scholar] [CrossRef]
  38. Chicco, D.; Jurman, G. The advantages of the Matthews correlation coefficient (MCC) over F1 score and accuracy in binary classification evaluation. BMC Genom. 2020, 21, 6. [Google Scholar] [CrossRef]
  39. Rajasekar, L.; Sharmila, D. Performance analysis of soft computing techniques for the automatic classification of fruits dataset. Soft Comput. 2019, 23, 2773–2788. [Google Scholar] [CrossRef]
  40. Adige, S.; Kurban, R.; Durmuş, A.; Uslu, V.V. Classification of apple images using support vector machines and deep residual networks. Neural Comput. Appl. 2023, 35, 12073–12087. [Google Scholar] [CrossRef]
  41. Bhatt, A.K.; Pant, D. Automatic apple grading model development based on back propagation neural network and machine vision, and its performance evaluation. AI Soc. 2015, 30, 45–56. [Google Scholar] [CrossRef]
  42. Sofu, M.; Er, O.; Kayacan, M.; Cetişli, B. Design of an automatic apple sorting system using machine vision. Comput. Electron. Agric. 2016, 127, 395–405. [Google Scholar] [CrossRef]
Figure 1. Average apple production for the year (1994–2021).
Applsci 13 07682 g001
Figure 2. Sample images of the ten apple varieties.
Applsci 13 07682 g002
Figure 3. HOG features extraction.
Applsci 13 07682 g003
Figure 4. Process of the development of apple varieties classification.
Applsci 13 07682 g004
Figure 5. SVM confusion matrix.
Applsci 13 07682 g005
Figure 6. RFC confusion matrix.
Applsci 13 07682 g006
Figure 7. MLP confusion matrix.
Applsci 13 07682 g007
Figure 8. KNN confusion matrix.
Applsci 13 07682 g008
Table 1. Image Dataset.
Class DataTotal ImagesTrainingValidationTest
Red Braeburn5794058787
Fuji4773357072
Golden Reinders6214359393
Granny Smith5904138988
Kasel 375253687879
Mondial Gala4773347172
Red Chief6124299192
Scarlet Spur6404489696
Starkrimson6184339293
Starkspur Golden Delicious669468100101
Table 2. Performance metrics of all classification models using the test dataset.
ModelPerformance Metrics
AccuracyPrecisionRecallSpecificityF1-ScoreAUC-ROCAUC-PRCohen’s KappaMCC
SVM98.1798.297.9797.398.0799.8598.8997.9697.96
RFC96.6796.6296.3597.1496.4699.9499.4296.2996.3
MLP98.6298.5998.4198.6798.4899.9999.998.4798.47
KNN91.2891.4290.49490.3899.0695.5590.2990.38
Table 3. Comparison of performance of the proposed method with previously reported works.
TaskModels and AccuracyReferences
Recognize fruits and vegetablesKNN, 97.5%[39]
Classify six apple varietiesSVM, 96%[40]
Apple gradingANN, 96%[41]
Automatic apple sortingDecision Tree, 73–96%[42]
Classify six apple varietiesSVM, 95.27%[15]
Classify seven fruit typesNaive Bayes, 95%[21]
Classify 15 fruit typesMLP, 97%[22]
Classify fruit typesNN, 99–100%[23]
Classify ten fruit typesSVM, 95.3%[24]
Classify six fruit typesSVM, 91.67%[19]
Identify fruit typesKNN, 96%[20]
Detect rotten fruitsSVM, 98%[20]
Classify ten apple varietiesMLP, 98.62%Proposed Method
Disclaimer/Publisher’s Note: The statements, opinions and data contained in all publications are solely those of the individual author(s) and contributor(s) and not of MDPI and/or the editor(s). MDPI and/or the editor(s) disclaim responsibility for any injury to people or property resulting from any ideas, methods, instructions or products referred to in the content.

