Article

Machine Learning-Based Shoveling Trajectory Optimization of Wheel Loader for Fuel Consumption Reduction

1
Department of Mechanical and Electrical Engineering, Guangxi Vocational College of Water Resources and Electric Power, Nanning 530023, China
2
School of Mechanical and Automotive Engineering, Guangxi University of Science and Technology, Liuzhou 545006, China
3
School of Computer Science and Telecommunication Engineering, Guangxi University of Science and Technology, Liuzhou 545006, China
*
Author to whom correspondence should be addressed.
Appl. Sci. 2023, 13(13), 7659; https://doi.org/10.3390/app13137659
Submission received: 19 April 2023 / Revised: 24 June 2023 / Accepted: 27 June 2023 / Published: 28 June 2023
(This article belongs to the Special Issue Advances in Robot Path Planning, Volume II)

Abstract

:
The difference in fuel consumption of wheel loaders can be more than 30% according to different shoveling trajectories for shoveling operations, and the optimization of shoveling trajectories is an important way to reduce the fuel consumption of shoveling operations. The existing shoveling trajectory optimization method is mainly through theoretical calculation and simulation analysis, which cannot fully consider the high randomness and complexity of the shoveling process. It is difficult to achieve the desired optimization effect. Therefore, this paper takes the actual shoveling operation data as the basis. The factors that have a high impact on the fuel consumption of shoveling are screened out through Kernel Principal Component Analysis. Moreover, the mathematical model of fuel consumption of shoveling operation is established by Support Vector Machine and combined with the Improved Particle Swarm Optimization algorithm to optimize the shoveling trajectory. To demonstrate the generalization ability of the model, two materials, gravel, and sand, are selected. Meanwhile, the influence of different engine speeds on the shoveling operation is considered. We optimize the shoveling trajectories for three different engine speeds. The optimized trajectories are verified and compared with the sample data and manually controlled shoveling data. The results show that the optimized trajectory can reduce the fuel consumption of shoveling operation by 27.66% and 24.34% compared with the manually controlled shoveling of gravel and sand, respectively. This study provides guidance for the energy-efficient operation of wheel loaders.

1. Introduction

The wheel loader is a relatively versatile construction vehicle widely used in many civil engineering and mining projects. It usually performs a variety of tasks, including shoveling, transporting, and dumping [1]. Among them, the most important form of operation is shoveling. The fuel consumption in the process of shoveling is one of the critical indicators for evaluating the operational efficiency of wheel loaders [2]. Reducing the fuel consumption of wheel loaders in shoveling operations has become an urgent problem. Numerous studies have shown that the fuel consumption of wheel loader shoveling operation is closely related to the shoveling trajectory. The shoveling trajectory is the track of the wheel loader bucket moving in the pile. The fuel consumption of wheel loader shoveling operations with different trajectories has obvious differences [3,4]. Thus, optimizing the shoveling trajectory is an effective way to reduce the fuel consumption of shoveling operations.
The wheel loader is usually divided into three phases, namely the insertion phase, scooping phase, and lifting phase, when carrying out the shoveling operation. Among them, the optimization of the shoveling trajectory in the insertion phase and the shoveling trajectory in the scooping phase is the key to reducing the fuel consumption of the wheel loader shoveling operation. The main point for the shoveling trajectory in the insertion phase is to determine the insertion depth. Sarata et al. [5] concluded that if the wheel loader is inserted too deep into the pile, the bucket resistance may exceed the maximum power of the wheel loader, and the bucket may get stuck in the pile. Hong et al. [6] planned three shoveling trajectories based on different insertion depths. The different insertion depths resulted in large differences in fuel consumption, and the best insertion depth was obtained in the three trajectories. Xu et al. [7] analyzed the relationship between insertion depth and resistance of the wheel loader and established a mathematical model for the optimization of insertion depth. The results showed that there exists an optimal bucket depth when the wheel loader is shoveling the pile. For the scooping phase, which is the phase with the highest fuel consumption in the whole shoveling process, it is important to determine the shoveling trajectory of the scooping phase to reduce the resistance and fuel consumption. Gong et al. [8] compared the shoveling operation with linear shoveling trajectory and curved shoveling trajectory by ADAMS software and concluded that the energy consumption of linear shoveling trajectory is smaller. Zhang et al. [9] proposed the concept of parallel trajectory, which means the trajectory of the scooping phase should be parallel to the pile plane, and with this trajectory, the resistance of the bucket will be the smallest. The corresponding fuel consumption will be lower. Filla et al. [10] generated 800 sets of trajectories based on four shoveling methods and compared them. The shoveling trajectories with parallel trajectories have obvious advantages. The above studies only start from the part of the shoveling process and ignore the continuity of the shoveling process, which has a limited effect on the optimization of the shoveling trajectory. Meng et al. [11] established the resistance model of the bucket based on the Coulomb theory and obtained the optimized trajectory based on the principle of minimum energy consumption. Yu et al. [12] established the agent model of shoveling trajectory and shoveling efficiency by the Kriging method and obtained the optimized shoveling trajectory under different working conditions by joint RecurDyn-EDEM simulation. Osumi et al. [13] established the bucket resistance model and optimized the shoveling trajectory with the objectives of resistance reduction and energy consumption reduction. Some other scholars optimized the shoveling trajectory by establishing a mathematical model of the shoveling process. Zhang et al. [14] established the trajectory motion model of the electric shovel by kinetic, combined with the pseudospectral method to convert the kinetic model into the algebraic format. They obtained the optimal excavation trajectory by solving the nonlinear programming. Shen et al. [15] modeled the whole excavation process and obtained the excavation trajectory by a rule-based planning method, which significantly reduced fuel consumption. Frank et al. [16] used a dynamic planning method to generate the shoveling trajectory. They conducted tests in a gravel pile, and the results showed a 15% improvement in fuel economy with this method. Yao et al. [17] established a mathematical model of the shoveling process to optimize the shoveling process to reduce fuel consumption, which can be reduced by 30% through simulation analysis. However, in these studies, the optimization of shoveling trajectory is mainly carried out by theoretical analysis and simulation analysis. It ignores the high randomness and complexity of the shoveling operation process, and there is a specific error between the dynamics or mathematical model and the actual shoveling operation [18,19,20]. As a result, it is difficult to achieve the desired effect in the actual shoveling operation.
Research has always focused on modeling the fuel consumption of shoveling operations. At present, the common fuel consumption modeling method is the theoretical calculation method [21,22,23]. This method is mainly based on theoretical analysis of energy consumption during the shoveling operation of wheel loaders and then calculates the overall fuel consumption. This method usually cannot consider the large randomness in the process of wheel loader shoveling operation, and there is a large error between it and the actual shoveling operation. In recent years, machine learning methods have shown excellent properties in solving real engineering problems. There have been several successful applications of using machine learning to achieve modeling of operational fuel consumption of engineering vehicles. Dindarloo et al. [24] analyzed the fuel consumption of mining dump trucks at each stage of operation with the objective of fuel consumption of a single operating cycle and constructed a fuel consumption model using machine learning methods. Siami-Irdemoosa et al. [25] established an Artificial Neural Network fuel consumption model to achieve fuel consumption prediction of mining trucks in each cycle with a model error of 10%. Alamdari et al. [26] used machine learning methods such as multiple linear regression, Random Forest, Artificial Neural Network, Support Vector Machine, and Kernel nearest neighbor to predict the fuel consumption of transport trucks and compared the accuracy of each model. Gong et al. [27] used a binary logistic regression model to analyze 21 fuel consumption influencing factors of heavy trucks and obtained 8 influencing factors that have a significant effect on fuel consumption. Meanwhile, the accuracy of the fuel consumption model was compared using Decision Tree, Artificial Neural Network, and Random Forest. Shen et al. [28] constructed an excavator data collection system and proposed an improved PSO-BP model for excavator energy consumption prediction, which achieved good prediction accuracy.
However, there are fewer applications for modeling the fuel consumption of wheel loaders using machine learning. Liu et al. [29] constructed a BP neural network model with wheel loader driver, pile type, and bucket capacity as input features, although the accuracy of the model was high. However, in this study, there are problems of fewer data samples and unreasonable selection of fuel consumption influencing factors, which are difficult to be extended to other application scenarios. Since the shoveling process itself is a high randomness process. There are many factors that can have a great impact on the fuel consumption of shoveling operations. Therefore, determining the reasonable influence factors on the fuel consumption of shoveling is the key task to establishing the fuel consumption model by machine learning. Therefore, this study selects the Kernel Principal Component Analysis (KPCA) method to filter the factors that have a strong influence on the fuel consumption of shoveling operations. Compared with the traditional Principal Component Analysis (PCA) method, KPCA has better nonlinear data processing capability [30]. After obtaining the factors with a strong influence on the fuel consumption of the shoveling operation, a model of the fuel consumption of the shoveling operation is constructed using Support Vector Machine (SVM), a typical machine learning method. It replaces the empirical risk in traditional neural networks with the structured risk minimization principle. It solves the drawback that it is difficult to overcome the local extremes when the sample size is small [31]. After establishing the fuel consumption model, the Improved Particle Swarm Optimization (IPSO) algorithm is selected in this study to optimize the factors with a strong influence on fuel consumption. Compared with the Particle Swarm Optimization (PSO) algorithm, IPSO greatly improves the ability of local optimization search. The optimization algorithm has been widely used to improve operational efficiency by optimizing the operational trajectory. For example, Yuasa et al. [32] optimized the excavating trajectory of an excavator by a Genetic Algorithm based on a parametric mathematical model of the excavating trajectory, loading, and linkage mechanism, which effectively improved the operational efficiency of the excavator. Bi et al. [33] obtained the optimal shoveling trajectory of a cable shovel by a Multi-Objective Genetic Algorithm with the operating time and energy consumption per payload as the optimization objectives.
In response to the above issues and discoveries, this study proposed a method to construct a fuel consumption model by SVM and optimize the shoveling trajectory by IPSO. Firstly, the wheel loader was shoveled several times with three different engine speeds on the gravel pile and sand pile to obtain samples. After that, the factors with a strong influence on the fuel consumption of shoveling operation were selected by KPCA and combined with a Grey relation analysis (GRA) to validate, and the fuel consumption model of shoveling operation was established by SVM. Finally, the factors with a strong influence on the fuel consumption of shoveling operation were optimized by the IPSO algorithm. The lowest energy consumption trajectory was obtained at different engine speeds. The optimized shoveling trajectory was used for validation experiments and compared with the sample data and manually controlled shoveling data to verify the optimization effect.

2. Shoveling Experiments and Analysis

2.1. Shoveling Principle and Experiment Design

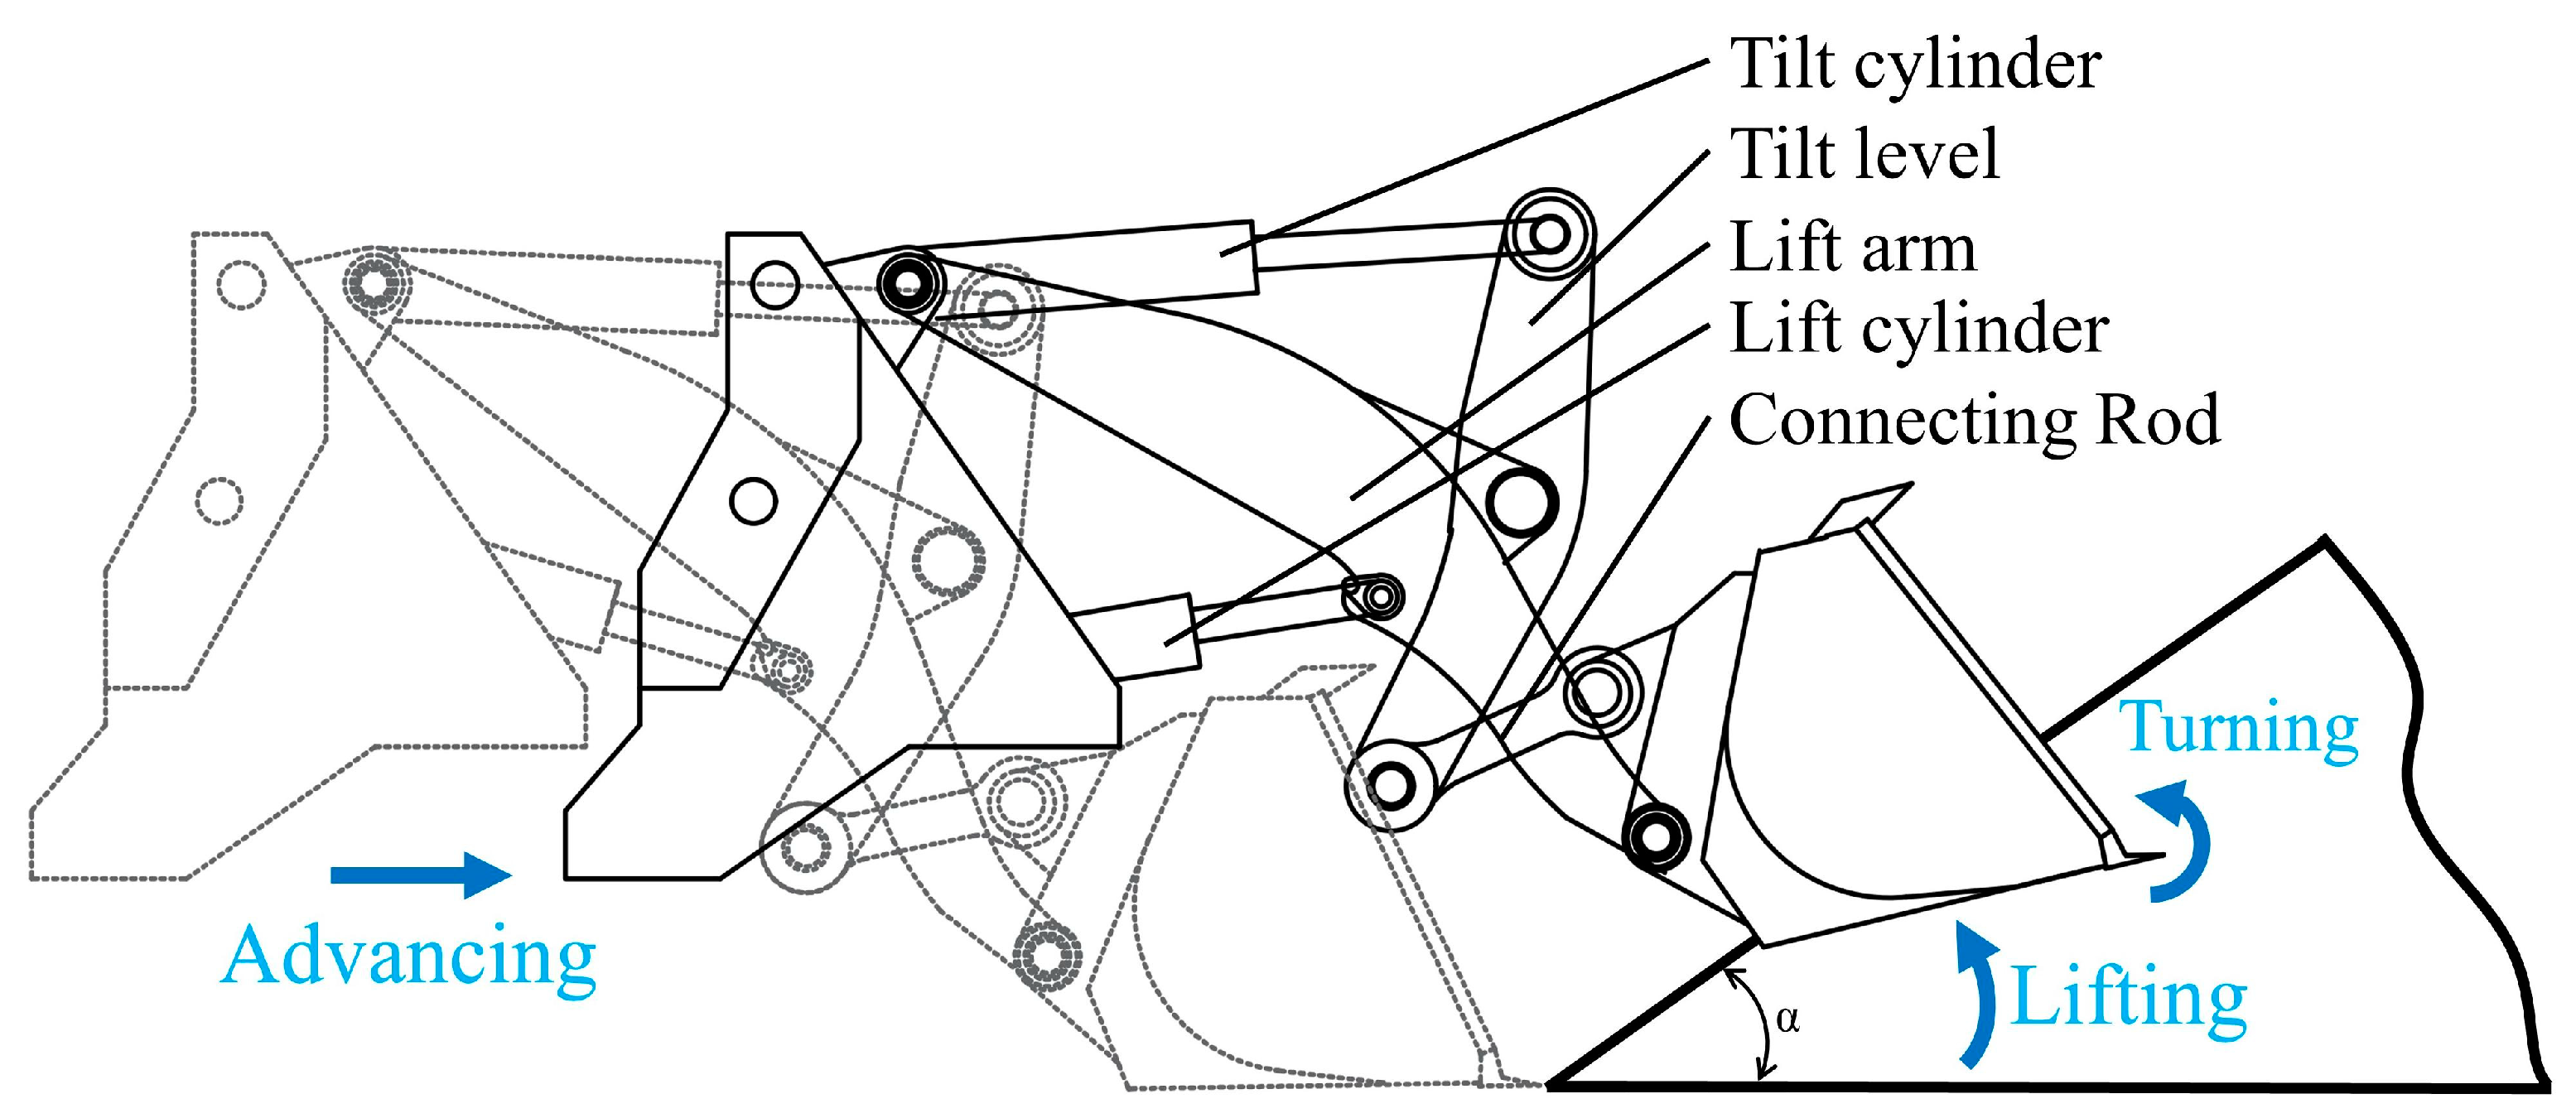
The shoveling method is characterized by the insertion of the wheel loader into the pile to a certain depth. Then, the bucket is turned and lifted by the action of the lift arm, tilt level, and connecting rod to complete the shoveling. Finally, the bucket is lifted. Among them, the shoveling trajectory of the scooping phase is parallel to the surface of the pile, as shown in Figure 1. Thus, the wheel loader can be regarded as a system with three degrees of freedom when carrying out the shoveling operation, which is wheel loader advancing, bucket lifting, and bucket turning. Among them, the bucket lifting and turning are controlled by the lift cylinder and the tilt cylinder, respectively, as shown in Figure 2. The wheel loader displacement, lift cylinder displacement, and tilt cylinder displacement are not the same in different shoveling trajectories, which is the reason for the large difference in fuel consumption during the shoveling operation of wheel loaders. Meanwhile, the different engine speeds provide different power to the wheel loader. Even if the same shoveling trajectory is used, however, due to the difference in engine speed, the fuel consumption of the shoveling operation will also appear as a large gap. Therefore, optimizing the shoveling trajectory at different engine speeds is a critical way to reduce the fuel consumption of the shoveling operation.
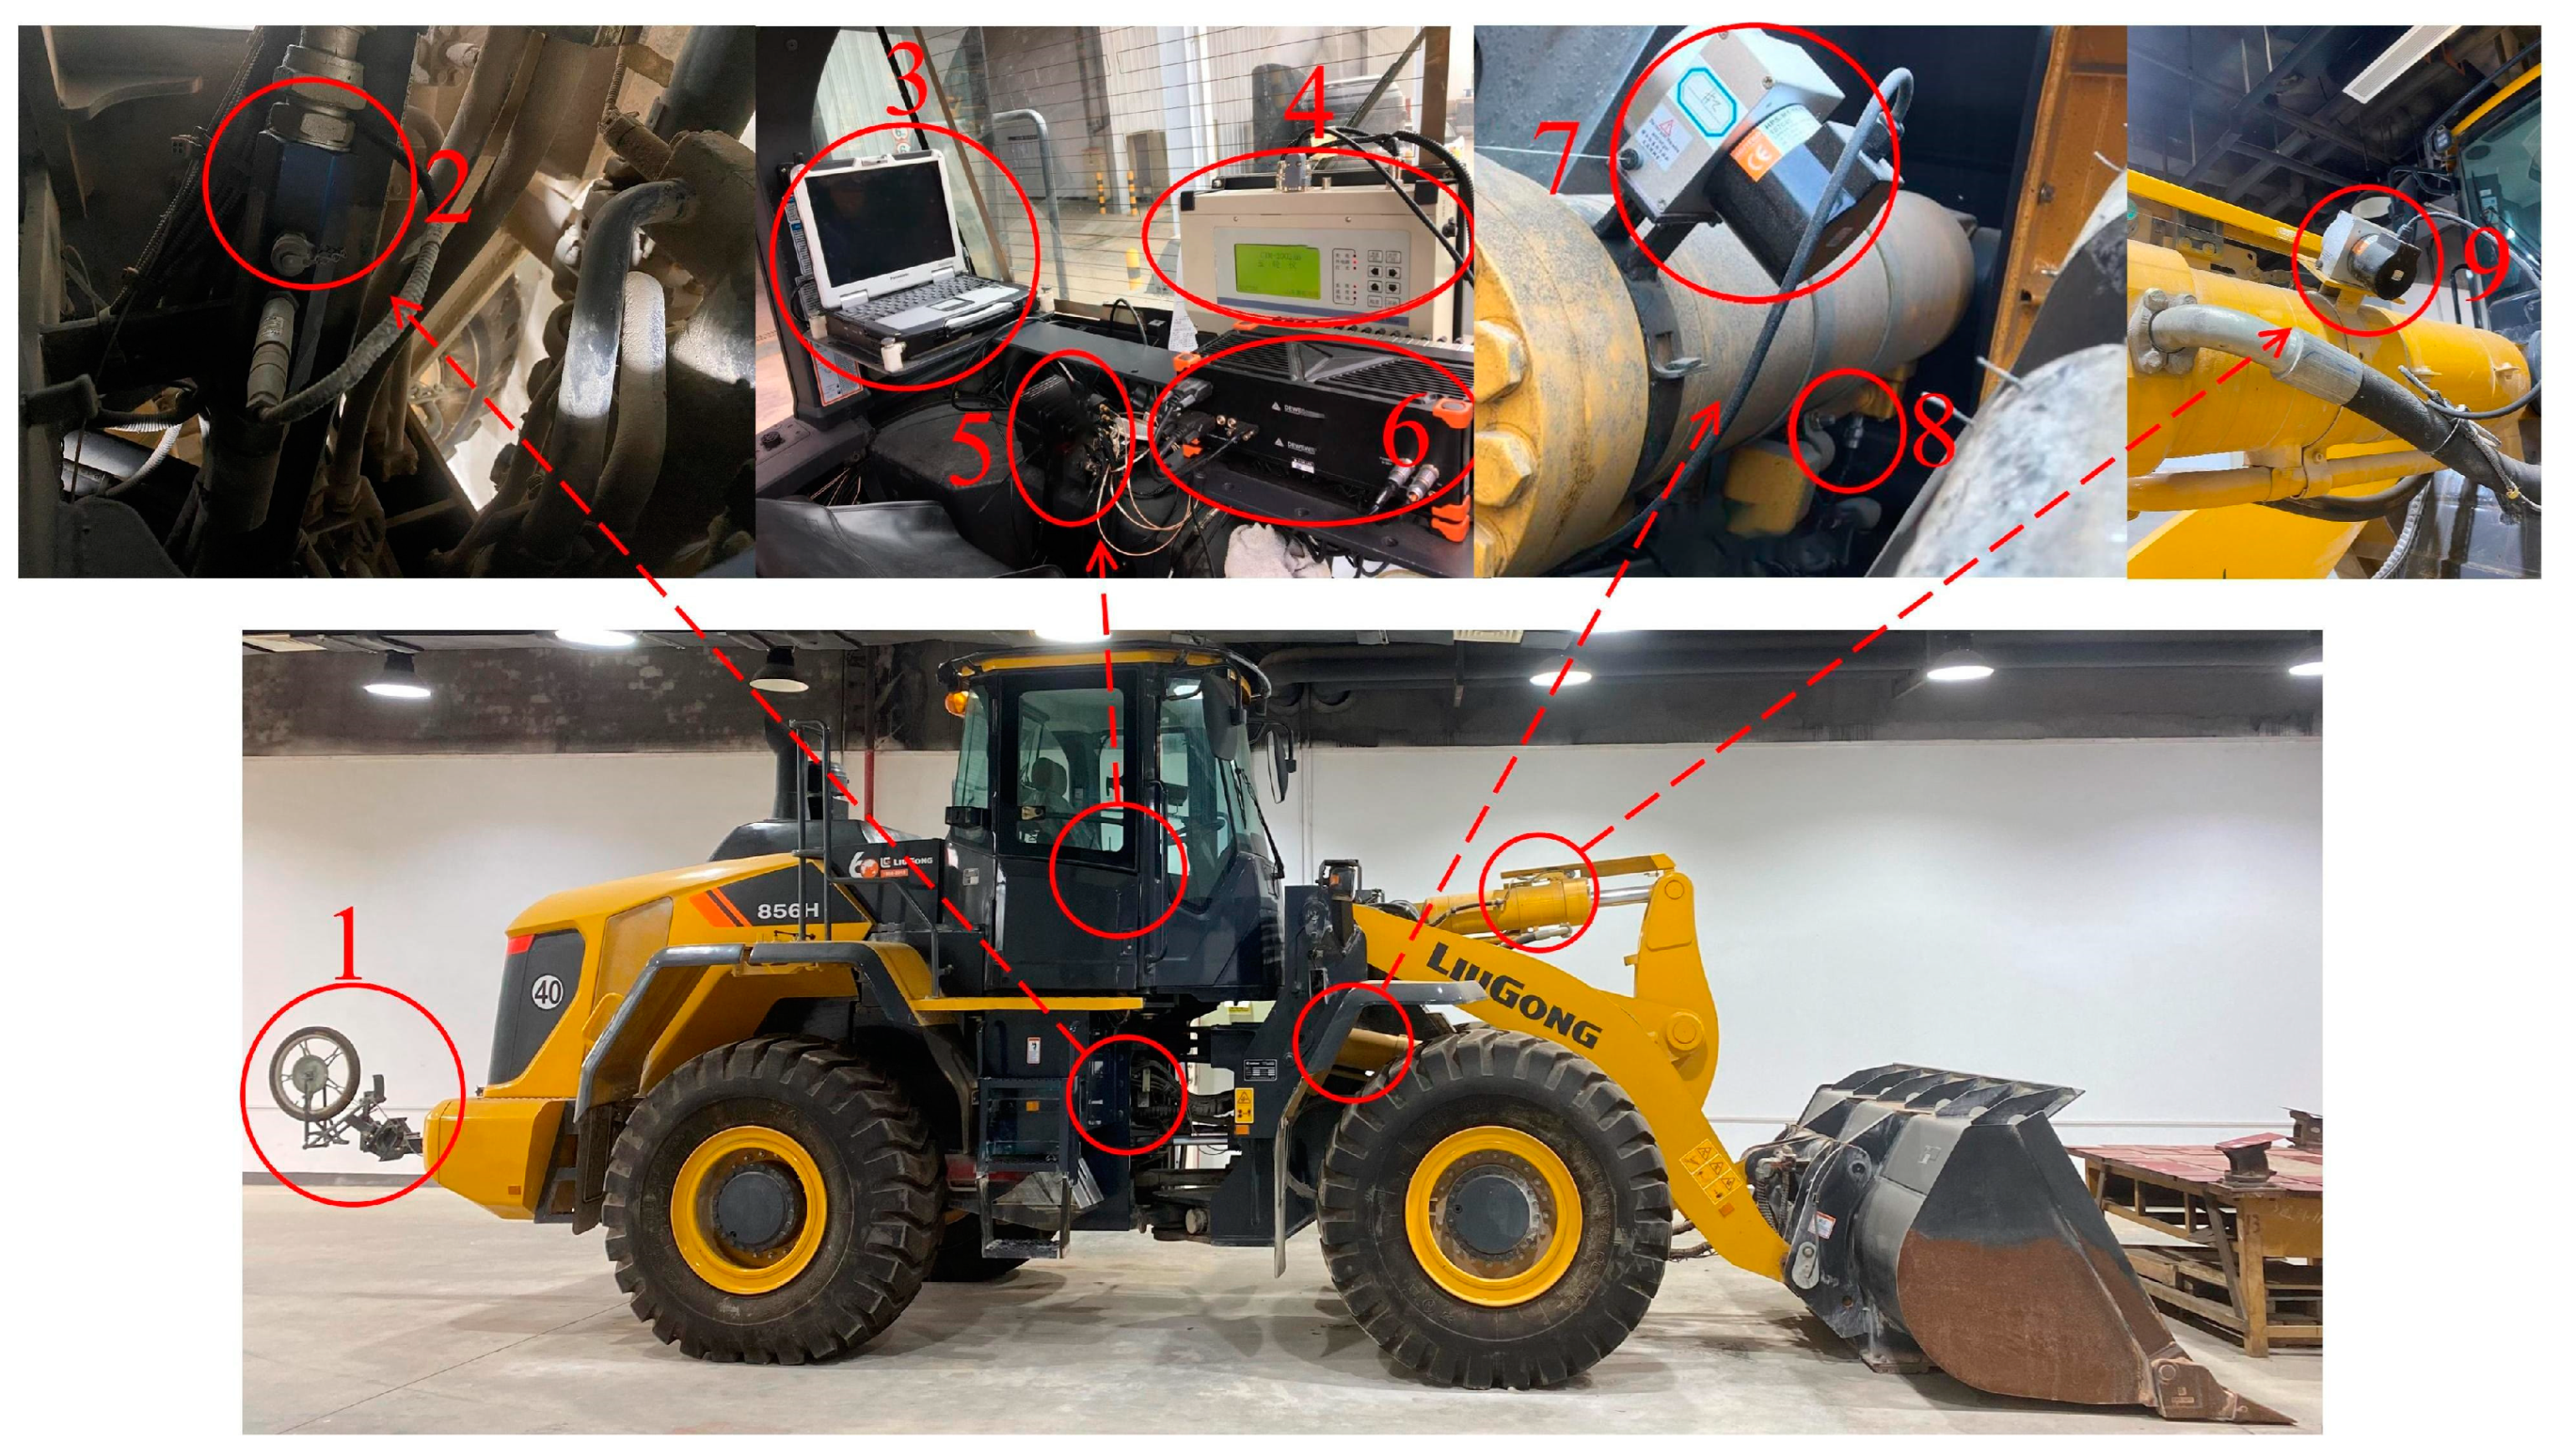
To execute the shoveling trajectory better and avoid the errors caused by manual operation. And to obtain more accurate data about the shoveling process, this study has developed an automatic shoveling experiment platform for a wheel loader. The platform will carry out automatic shoveling by preplanning the shoveling trajectory and setting the relevant shoveling parameters. The relevant parameters during the shoveling operation are recorded, including the wheel loader displacement, cylinder displacement, fuel consumption, engine speed, operation time, and shoveling weight. The recording frequency is 500 Hz, which is recorded once every 0.002 s. The automatic shoveling platform and the main sensors are shown in Figure 3.

2.2. Trajectory Planning

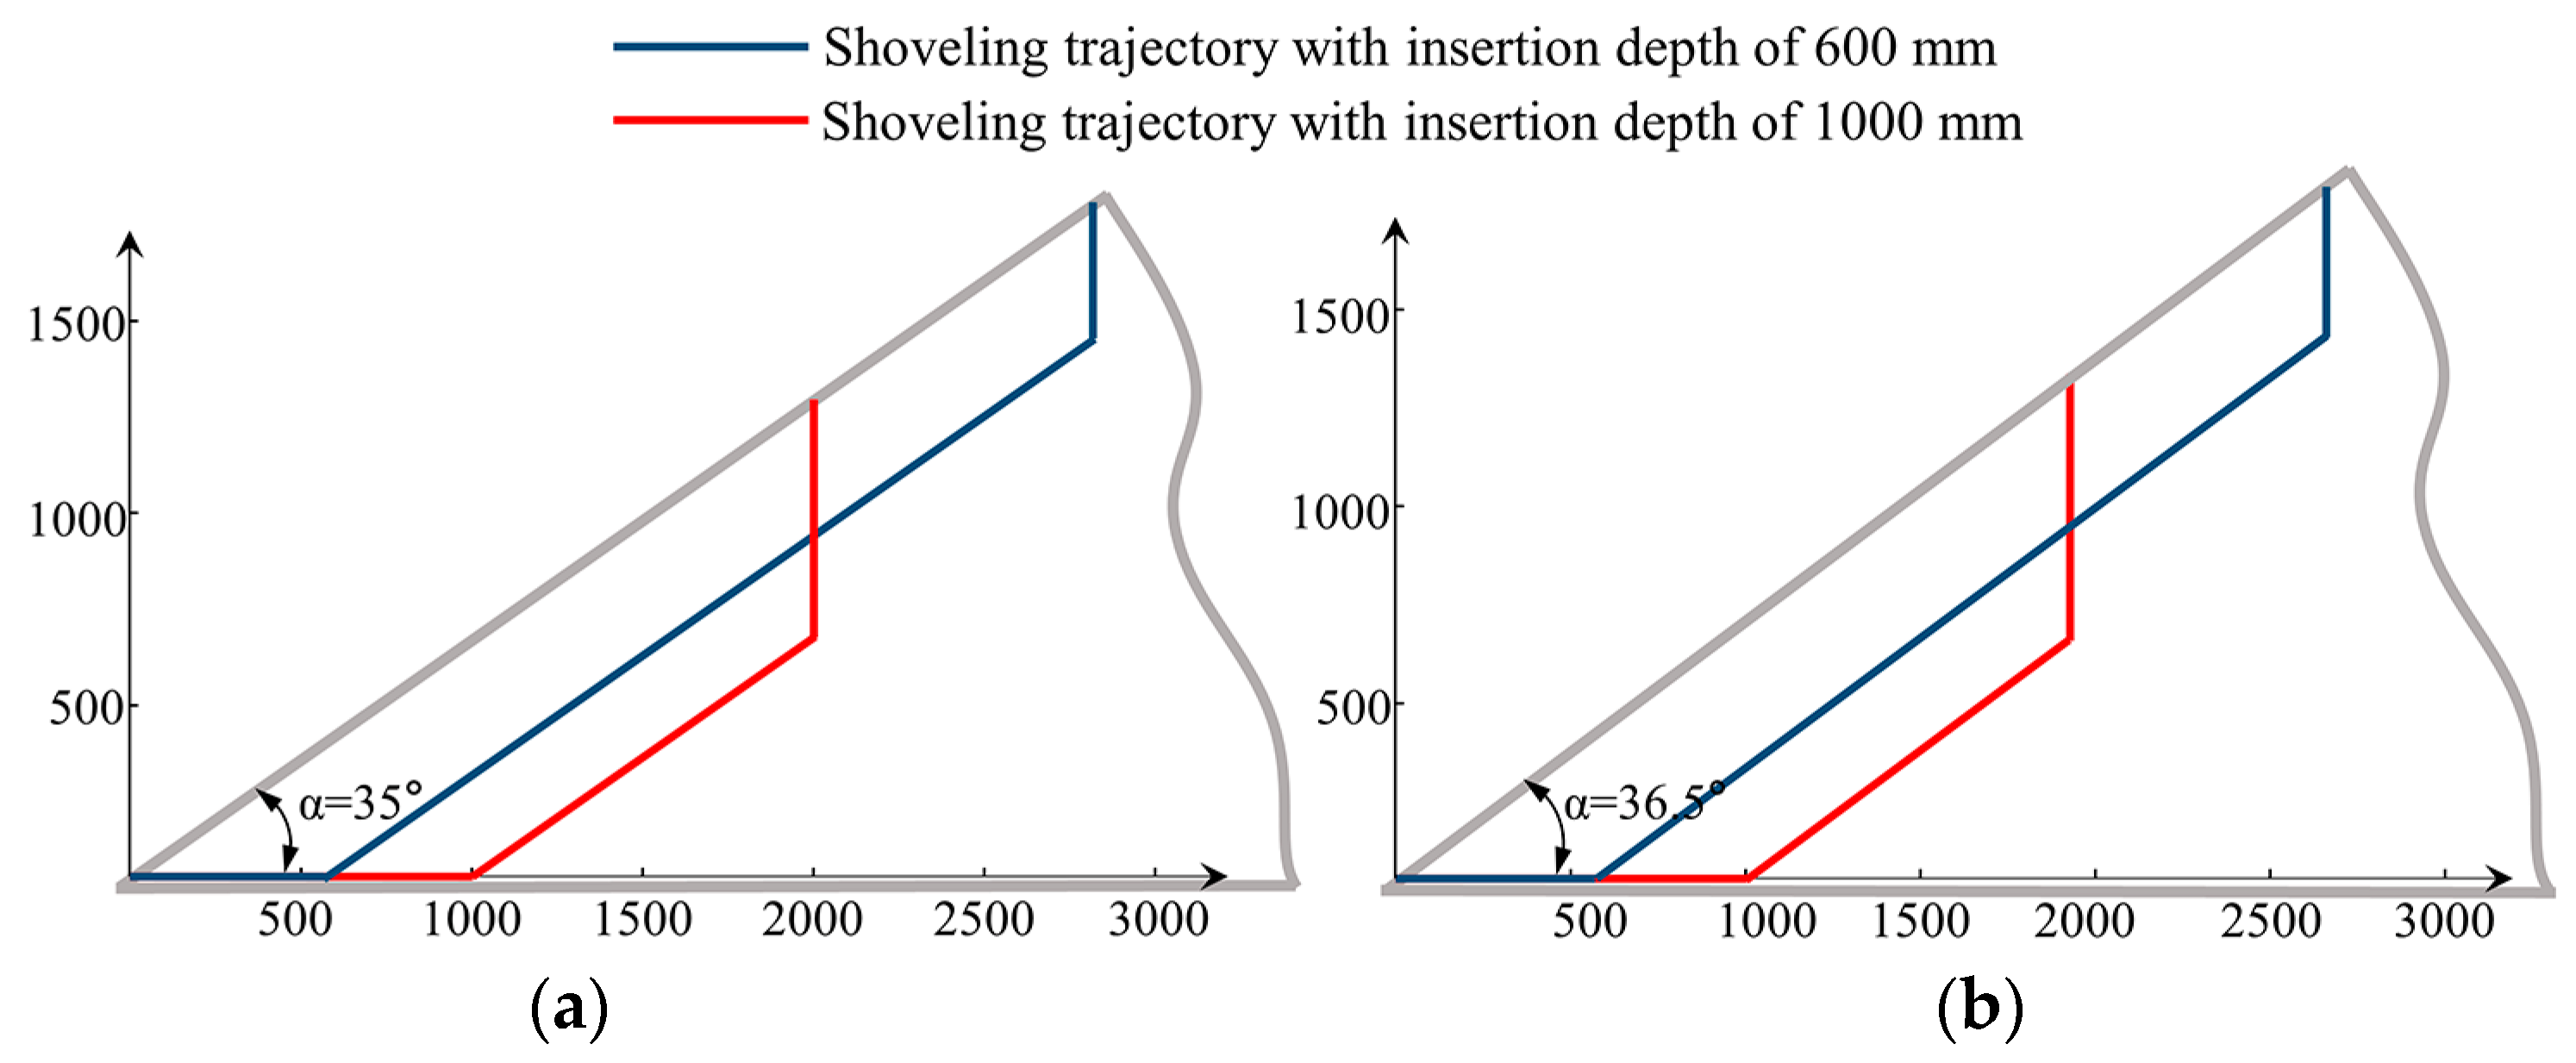
Due to the different insertion depths, the shoveling trajectories are also different. The fuel consumption of shoveling operations with different shoveling trajectories has obvious differences. In this study, a variety of insertion depths are randomly selected, ranging from 600 mm to 1000 mm. Two types of materials are selected, including gravel and sand. Gravel is characterized by non-uniform, high-density, and large particles. At the same time, sand is characterized as uniform, low-density, and with small particles. Both above materials have high representativeness, and the relevant parameters of the two materials are shown in Table 1. Due to the different angles of repose of the two piles, their shoveling trajectories are also different, as shown in Figure 4.
The shoveling area S consisting of the shoveling trajectory and the surface of the pile is shown in Figure 5. According to the geometric relationship in Figure 5, the shoveling area can be expressed as shown in Equation (1). However, the shoveling trajectory is not the same. However, the shoveling area composed of the shoveling trajectory and surface of the pile is always constant and equal to the bucket cross-section. When the length of lAB is determined, both lBC and lCD can be expressed as a function of lAB only. This is shown in Equation (2). When the shoveling area is held constant, different shoveling trajectories can be obtained by adjusting the length of lAB.
S = V L = 1 2 l A B l B Q + l B C l B P
where V is the bucket volume, and L is the bucket length.
l B P = l A B sin ( α ) l C D = l B Q = l A B tan ( α ) l B C = S l B P l B P sin ( 2 α ) l B C = l B C cos ( α )
where lAB is the insertion depth of the insertion phase, lBC is the shoveling length of the scooping phase, lCD is the shoveling length of the lifting phase, lBP is the horizontal distance between the trajectory of the scooping phase and the surface of the pile, and lBC′ is the wheel loader displacement of the scooping phase.

2.3. Engine Speed Analysis

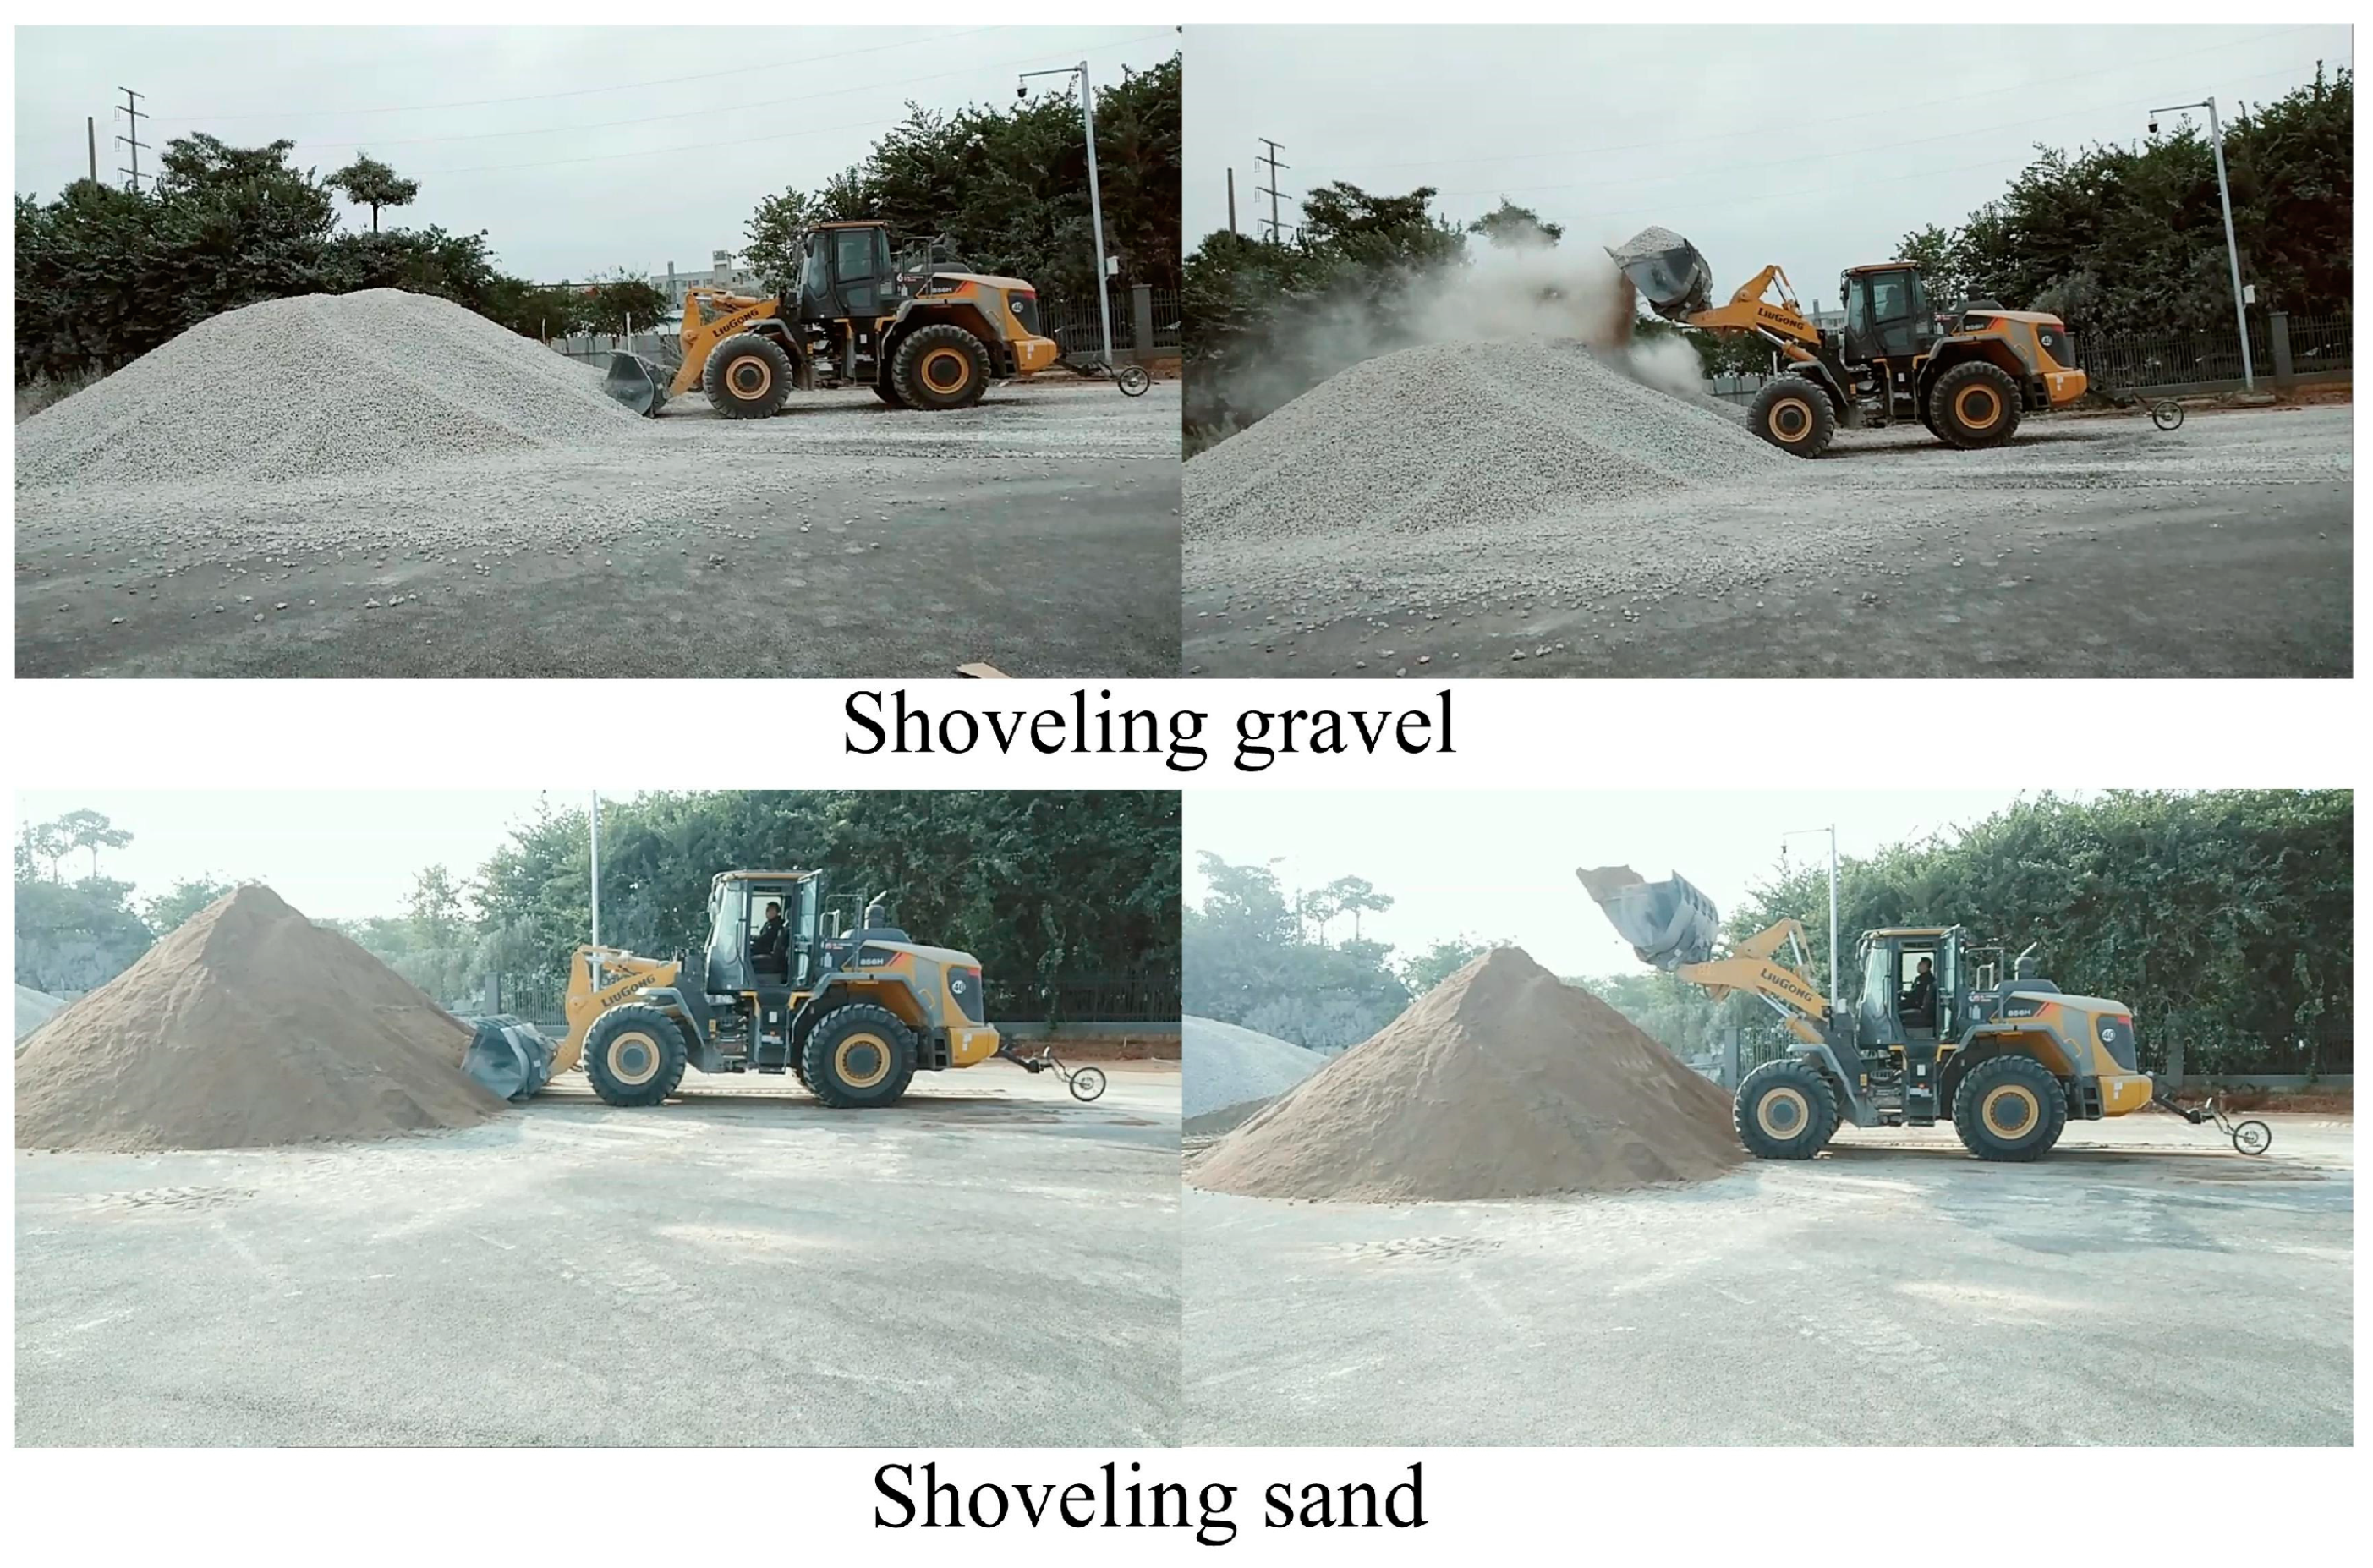
To obtain the optimal trajectory with different engine speeds. Three different engine speeds are selected, 900 RPM, 1200 RPM, and 1500 RPM, and 40 shoveling operations are performed on the gravel pile and the sand pile with each engine speed. The relevant parameters are recorded during the shoveling process. The pile is recovered after each shoveling operation. The process of shoveling gravel and the process of shoveling sand are shown in Figure 6. The experimental environment is an open flat area. The average temperature is 22 °C, and the average relative humidity is 83%.
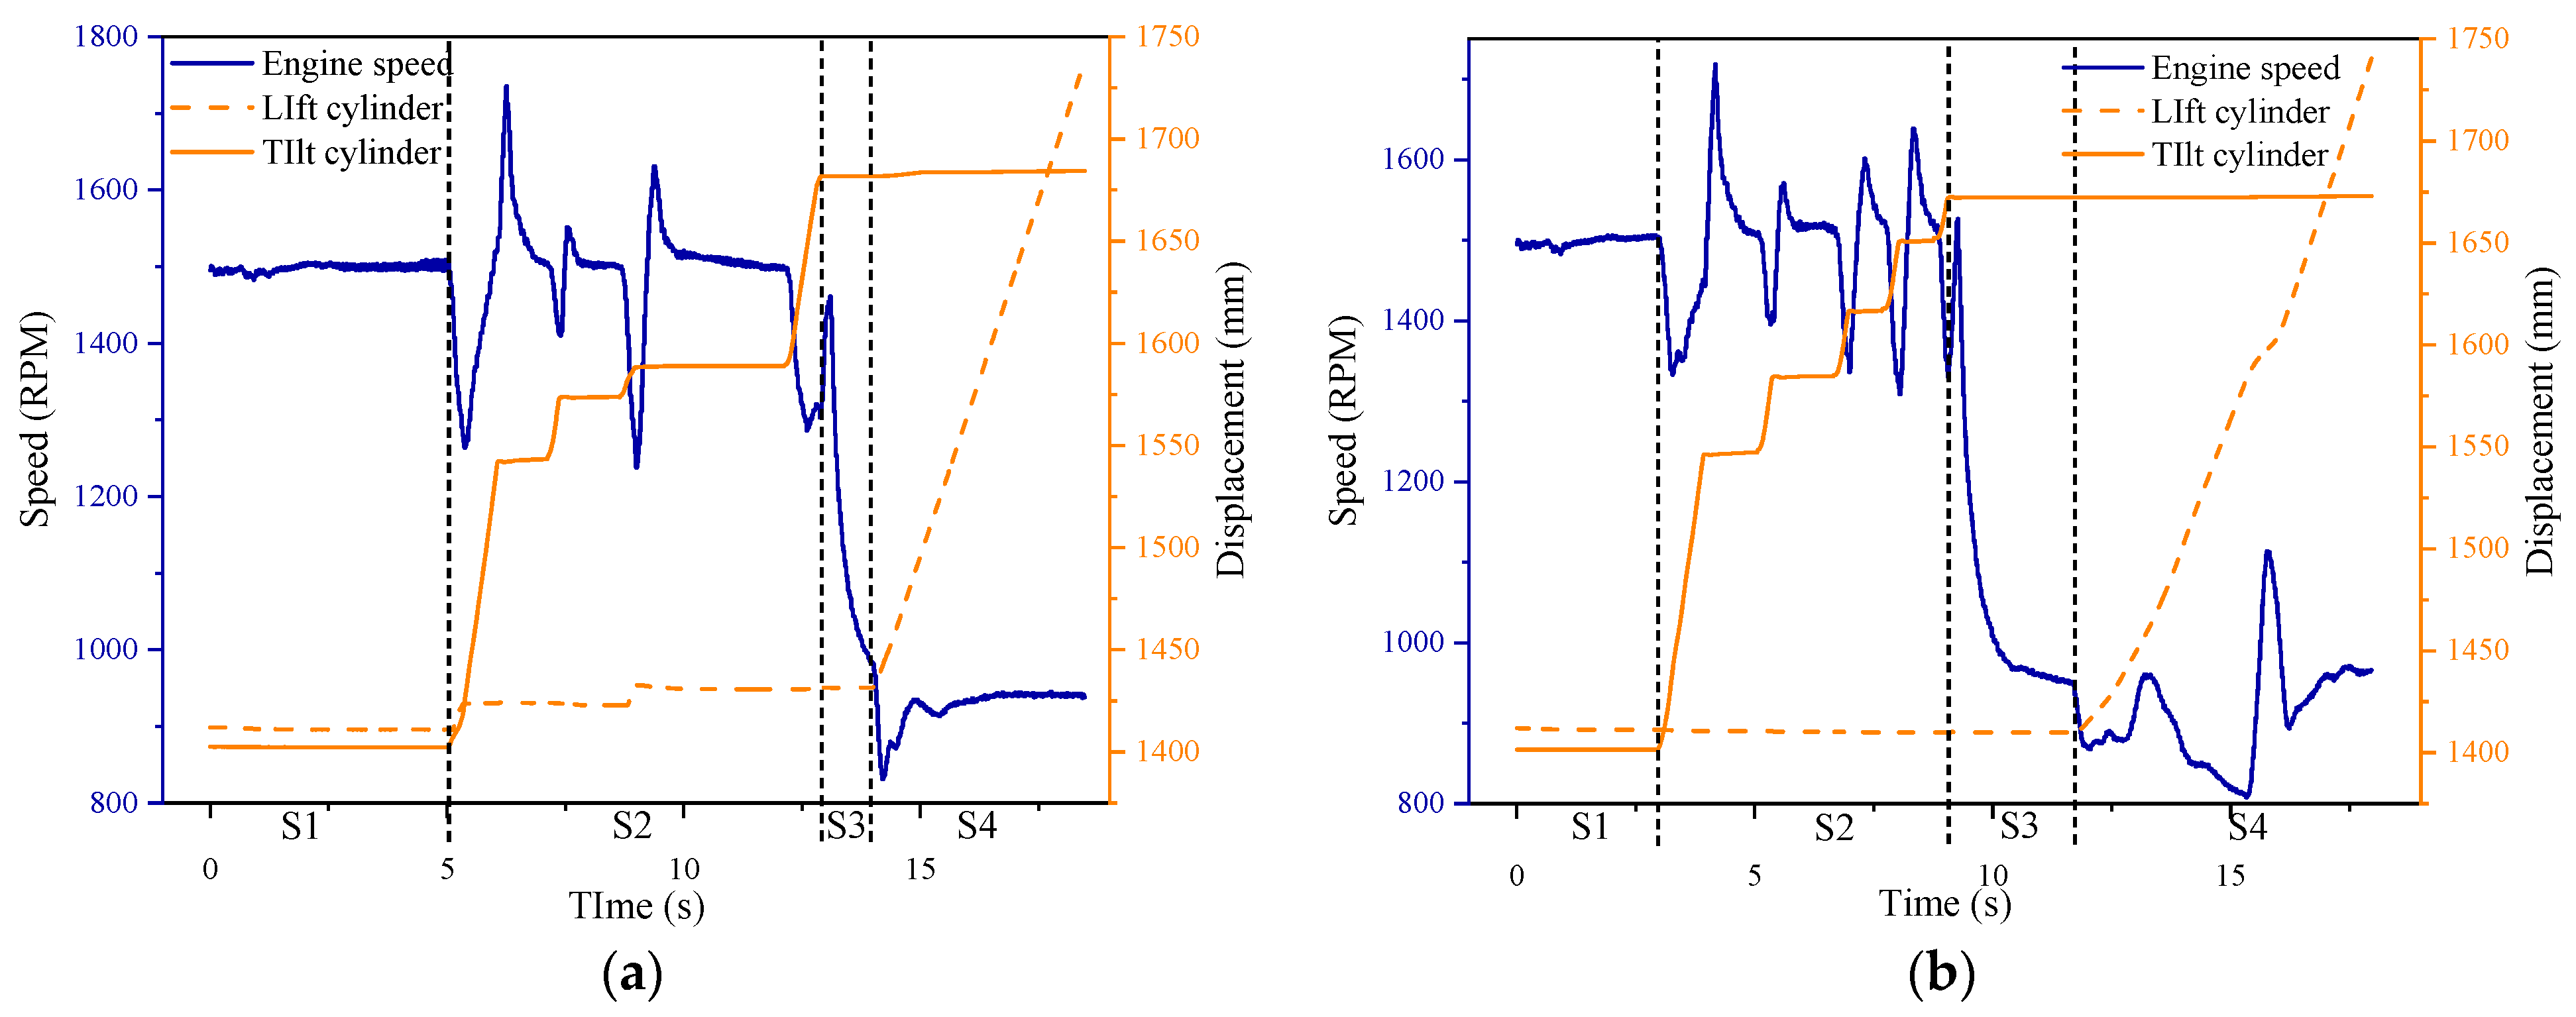
When the engine speed is 1500 RPM, the engine speed for shoveling gravel and shoveling sand is shown in Figure 7. The shoveling operation process can be divided into four phases with the change of displacement of the lift cylinder and the tilt cylinder, which are the insertion phase, scooping phase, stopping phase, and lifting phase, corresponding to S1, S2, S3, and S4 in Figure 7, respectively.
  • Insertion phase: There is no change in the displacement of the lift cylinder and the displacement of the tilt cylinder. The engine speed is maintained at 1500 RPM, but a smaller oscillation will occur. This oscillation is more violent at the beginning of the insertion phase. However, as the insertion depth increases, it gradually calms down and stays at 1500 RPM.
  • Scooping phase: The displacement of the tilt cylinder increases rapidly, and the displacement of the lift cylinder steps up. With the increasing displacement of the cylinder, there is a large change in engine speed. When the displacement of the cylinder starts to increase, the engine speed decreases at first, then increases rapidly and is higher than 1500 RPM. When the displacement of the cylinder is stable, the engine speed also falls back to 1500 RPM rapidly.
  • Stopping phase: The displacement of the tilt cylinder and lift cylinder has no change, and the engine speed decreases to a lower state in a short time.
  • Lifting phase: The displacement of the lift cylinder increases rapidly, and the displacement of the tilt cylinder is almost unchanged. The engine speed decreases to the lowest point in the whole shoveling process in a short period and then increases.

2.4. Fuel Consumption Analysis

The wheel loader fuel consumption per unit time, wheel loader displacement, lift cylinder displacement, and tilt cylinder displacement during the wheel loader shoveling process are shown in Figure 8.
  • Insertion phase: The wheel loader is inserted into the pile at a certain distance with traction. In the early insertion phase, the insertion speed of the wheel loader is fast. However, as the insertion depth increases, the resistance to the bucket also increases rapidly, and the wheel loader insertion speed gradually decreases. Meanwhile, the fuel consumption per unit of time rises rapidly after the insertion of the pile and then remains in a relatively stable state.
  • Scooping phase: The wheel loader continues to keep moving forward. In the early scooping phase, the wheel loader can move forward rapidly because the material is scooped up by the bucket to provide space for the wheel loader to move forward. In the later scooping phase, the wheel loader advances at a slower speed due to resistance. It is obvious that when the lift cylinder and tilt cylinder remain unchanged, the fuel consumption per unit time remains at a relatively stable level. The fuel consumption per unit time increases rapidly when the displacement of the lift cylinder and tilt cylinder increases and then is in a stable state.
  • Stopping phase: The resistance of the wheel loader increases sharply, and the wheel loader is forced to stop moving forward. However, to prevent the wheel loader from moving backward, the wheel loader will continue to keep moving ahead and move forward for a short distance. The fuel consumption per unit time is then reduced to the lowest state during the entire shoveling operation.
  • Lifting phase: The wheel loader is subjected to inertia in the process of lifting the bucket and continues to keep moving forward. And the fuel consumption per unit time increases with the displacement of the lift cylinder and then remains stable.
The sensor on the wheel loader is a flow sensor. The total fuel consumption needs to be obtained by the calculation formula, which is shown in Equation (3). As an example, in Figure 8, the total fuel consumption, the fuel consumption of each phase, and the percentage of the total fuel consumption by each phase are shown in Table 2.
C = i = 1 n c i f · 3600 · 1000
where C is the total fuel consumption, mL, c is the fuel consumption per unit time at a certain moment, L·h−1, f is the frequency, Hz.
According to Figure 8 and Table 2. The fuel consumption in the scooping phase is the highest, and the fuel consumption in the stopping phase is the lowest. In shoveling gravel, the fuel consumption in the insertion phase is higher than that in the lifting phase. While shoveling sand, the fuel consumption in the insertion phase is less than that in the lifting phase. This is related to the material properties, as gravel is a denser and less loose material. The wheel loader needs more operation time and energy consumption when inserting the gravel pile. Sand, on the other hand, is less dense and relatively looser. The wheel loader is easier to insert from the sand pile and therefore generates less fuel consumption when inserting into the sand pile. In short, the fuel consumption of shoveling gravel is higher than that of shoveling sand with the same engine speed, which is determined by the material characteristics. From Figure 8, the lift cylinder displacement and tilt cylinder displacement within different phases all affect fuel consumption, which increases with the expansion of cylinder displacement. Meanwhile, the different engine speed of the wheel loader leads to the different initial velocity of the wheel loader when inserted into the pile, which will directly affect the time of wheel loader shoveling operation. Moreover, the engine speed is related to the wheel loader power, which will have a direct impact on the fuel consumption of the shoveling operation. In addition, the final shoveling weight will also have an impact on the fuel consumption of the shoveling operation. It is mainly reflected in the lifting phase; if the shoveling weight is too high, it will increase the extra fuel consumption.

3. Research Methodology

3.1. KPCA and GRA

KPCA is an improved processing method of PCA. As for PCA, it only applies to linear data, and there is a significant error when dealing with nonlinear data. In contrast, KPCA can largely preserve the local structure of nonlinear data by introducing kernel functions. Meanwhile, PCA will map data points into a low-dimensional space when dealing with high-dimensional data, facing dimensional disaster and leading to the loss of distance information between data points. Therefore, KPCA is more advantageous than PCA [34]. The basic idea is to project the samples that are linearly indistinguishable in the low-dimensional space to the high-dimensional space and make them linearly distinguishable by the kernel function [35]. For a set of samples X = [x1, x2, …, xn] ∈ Rm, the mapping function is
i = 1 n φ ( x i ) = 0 ( φ : R m R k ( k m ) )
where φ(xi) is the mapping function, Rm is an m-dimensional vector, and Rk is a k-dimensional vector.
Then the covariance matrix can be expressed as
C = 1 n i = 1 n φ ( x i ) φ ( x i ) T
Suppose the eigenvalue of C is λ, and its corresponding eigenvector is v, the result is
λ v = C v = ( 1 n i = 1 n φ ( x i ) φ ( x i ) T ) v = 1 n i = 1 n ( φ ( x i ) T v ) φ ( x i )
For λv = Cv, by multiplying each left and right by φ(xi), we can obtain λφ(xi)v = Cvφ(xi). The introduced kernel function matrix can be expressed as Kij = K(xi, xj) = φ(xi)φ(xj). Then, we can obtain nλa = Ka, where a is the eigenvector of K. Then, the projection of x into the higher dimensional space can be expressed as
v φ ( x ) = i = 1 n a i φ ( x i ) φ ( x ) = i = 1 n a i K ( x i , x )
In this study, the Gaussian kernel function is chosen as the kernel function, which is defined as follows:
K ( x , q ) = exp ( x q 2 ) σ 2
where σ is the function parameter, and q is the center of the function.
GRA is an analytical method based on grey system theory, mainly used to study the strength of association between influencing factors. It converts the grey information between multiple factors into black-and-white information, then uses the magnitude of the grey relation coefficient value as the basis for evaluating the strength of the correlation. The specific steps are as follows.
  • Select the parent sequence Y and the subsequence X.
  • To eliminate the influence of the magnitude, the parent sequence and the subsequence are normalized, and the normalized parent sequence is recorded as Y′ and the subsequence is recorded as X′.
  • The formula is shown in Equation (9) to calculate the grey relation coefficient.
    ξ ( i ) = min i ( min Y X ( i ) ) + ρ max i ( max Y X ( i ) ) Y X ( i ) + ρ max i ( max Y X ( i ) ) ,    i = 1 n
    where ρ is the discriminant coefficient, which takes values from 0 to 1 and is taken as 0.5 in this paper.

3.2. SVM

SVM is to use the kernel function to map the sample data eigenvalues in the low-dimensional space to the corresponding high-dimensional space. And the optimal hyperplane is determined in the high-dimensional space based on the structural risk minimization principle [36]. The expression of the classification hyperplane is shown in Equation (9), the objective function is shown in Equation (10), and the constraints are shown in Equation (11).
f ( x ) = w · x + b
min 1 2 w 2 + g i = 1 m ( ξ i + ξ * )
s . t . y i ( w · φ ( x i ) + b ) ε + ξ i ( w · φ ( x i ) + b ) y i ε + ξ i * ξ i 0 , ξ i * 0   ( i = 1 , 2 , , m )
where w is the normal vector of the hyperplane, x is the input vector, b is the hyperplane translation distance, ξ is the relaxation factor, g is the penalty factor, m is the number of samples, ε is the insensitivity coefficient factor, and φ is the mapping function.
The output function of the SVM can be expressed as
g ( x ) = i = 1 m a i K ( x i , x j ) + b
where ai is the Lagrange multiplier, and K is the kernel function, and the radial basis kernel is chosen as the kernel function in this paper, as shown in Equation (13):
K ( x i , x j ) = exp ( x i x j 2 2 c 2 )
where c is the kernel function parameter.
For machine learning models, optimizing hyperparameters is decisive for the model performance [37]. A reasonable choice of hyperparameters is beneficial to improve the performance of the model. Studies have shown that the optimization of penalty factor g and kernel function parameter c in SVM is an effective way to improve the accuracy of SVM [38]. To obtain reasonable g and c and avoid overfitting of the model. In this study, we choose the method of K-fold Cross Validation (CV) to obtain reasonable parameters, and the pseudo-code of K-fold CV optimize g and c is shown in Algorithm 1.
Algorithm 1 K-fold Cross Validation
1: begin
2: bestaccuracy; cbest; gbest;
3:     for c = cmin2:cmax2
4:       for g = gmin2:gmax2
5:       divide the dataset equally into K groups;
6:          for = 1:K
7:             divide the dataset equally into K groups;
8:             train(K) as the test set, the rest as the training set;
9:             record the accuracy of the test set ace(K);
10:          end;
11:          cv = (ace(1) + ace(2) + ⋯ + ace(K))/K;
12:            if cv > bestaccuracy
13:                bestaccuracy = cv; cbest = c; gbest = g;
14:            end;
15:      end;
16:   end;
17: end.

3.3. IPSO

PSO is inspired by the foraging behavior of bird populations in nature, and the basic units in PSO are particles. Each particle is described by three features: fitness value, position, and velocity. Each particle in the algorithm is measured by the fitness function to measure the degree of merit of this particle. The velocity of the particle is influenced by itself and the population and can be adjusted during each iteration. And the position describes the current location of the particle and is updated by the velocity. The updated formulas for velocity and position are shown in Equations (14) and (15), respectively [39].
v i = w v i + c 1 r 1 ( p i x i ) + c 2 r 2 ( g b e s t x i )
x i = x i + v i
where w is the inertia coefficient, c is the acceleration factor, and r is a random number of [0, 1].
The choice of the inertia coefficient w directly affects the convergence of the PSO. In traditional PSO, w is taken as 1 by default. w tends to be the global search for larger PSO and the local search for smaller PSO. To avoid premature maturation of the algorithm and oscillation of particles near the global optimal solution in the late stage of the algorithm, the value of w is usually taken to decrease linearly with the increase of the number of iterations. However, it requires repeated trials to determine the maximum, minimum, and number of iterations, and the optimal value may not be found. Thus, an Improved Particle Swarm algorithm is applied in this study for implementing a nonlinear dynamic adaptive adjustment of the inertia coefficient w such that the inertia coefficient w can follow the change of the fitness value, calculated as shown in Equation (16) [40].
w = w min + ( w max w min ) ( f f min ) f a v g - f min   ( f f a v g ) w max ( f > f a v g )

4. SVM Fuel Consumption Model and IPSO Optimization

4.1. KPCA Processing and GRA Verification

From the previous analysis, it can be seen that the wheel loader displacement, lift cylinder displacement, and tilt cylinder displacement in different phases will influence fuel consumption. Meanwhile, the initial velocity, operation time, and shoveling weight will also influence fuel consumption. Since the displacement of the lift cylinder and the tilt cylinder in some phases do not change. The displacement of the wheel loader in the four phases, the displacement of the lift cylinder and the tilt cylinder in the scooping phase, the displacement of the lift cylinder in the lifting phase, the initial velocity, the operation time, and the shoveling weight, a total of 10 factors, are taken as the initial fuel consumption influencing factors. The partial data of the gravel sample and the sand sample are shown in Table 3.
Due to the different magnitudes among the initial fuel consumption influence factors, they need to be normalized. After the normalization process and then the KPCA operation, the contribution rate and cumulative contribution rate are calculated as shown in Equation (17). The contribution rate and cumulative contribution rate of each factor are shown in Table 4. The factors that have the greatest influence on the fuel consumption of shoveling operation are initial velocity and insertion phase displacement of the wheel loader. The initial velocity is related to the engine speed, which is responsible for providing power for the whole shoveling operation process. While the wheel loader displacement in the insertion phase is related to the insertion resistance, and the wheel loader reaches the peak of resistance in the insertion phase, which is the key factor that influences fuel consumption. In the sand sample, the contribution of shoveling weight is greater than the operation time, while in the gravel sample, the contribution of operation time is slightly greater than the shoveling weight. This is related to the experimental environment, which is affected by the climate, where the humidity in the air increases and the sand appears to stick, so the shoveling weight is higher when shoveling sand. The scooping phase is the most important phase in the shoveling operation process, so the displacement of the wheel loader in this phase also has a greater influence on the fuel consumption of the shoveling operation. From Figure 8, the cylinder displacement will influence the fuel consumption of the shoveling operation, but compared with other factors, the influence of cylinder displacement on the fuel consumption of the shoveling operation is not great. According to the principle of KPCA preference, the requirement of replacing all factors can be achieved for factors with a cumulative contribution of 90% [41]. In the gravel samples and sand samples, the initial velocity, wheel loader displacement in the insertion phase, shoveling weight, operation time, and wheel loader displacement in the scooping phase, the cumulative contribution rate is greater than 90%. Thus, these five factors are selected as the key factors for the influence of fuel consumption of shoveling operation, and further research is conducted.
γ = λ j i = 1 n λ i γ = i = 1 m λ j i = 1 n λ i ( j = 1 , 2 , , n )
where λ is the eigenvalue, γ is the contribution rate, and γ′ is the cumulative contribution rate.
In order to verify the correlation between the key factors of fuel consumption influence and fuel consumption, the GRA is selected to test the correlation. The fuel consumption is chosen as the parent sequence, and the key factors of fuel consumption influence the subsequence. After calculation, the grey relation coefficients of gravel samples and sand samples are shown in Table 5. The more the grey relation coefficient value tends to 1, the higher the correlation between the subsequence and the parent sequence. The grey relation coefficient values are greater than 0.75 in the gravel samples and sand samples. There is a greater correlation between fuel consumption and key factors of fuel consumption influence. It proves that the key factors of fuel consumption influence screened by KPCA are effective.

4.2. SVM Model

According to the results of KPCA, the initial velocity, the displacement of the wheel loader in the insertion phase, the shoveling weight, the operation time, and the displacement of the wheel loader in the scooping phase are selected as the input layer, and the fuel consumption as the output layer. Among 120 sets of gravel samples and sand samples, respectively, 100 sets of samples are randomly selected as the training set, and the other 20 sets are used as the test set. Meanwhile, the penalty factor g and the kernel function parameter c are optimized by combining them with the CV method. The optimal c and g for the gravel fuel consumption model are 3.03 and 143.58, respectively, and for the sand fuel consumption model, they are 4.32 and 123.52, respectively. The accuracy effect of the fuel consumption model is shown in Figure 9. Meanwhile, root mean square error (RMSE), average relative error (ARE), and goodness of fit R2 are used in this study as indicators to evaluate the performance of the fuel consumption model. The smaller the RMSE and ARE, the smaller the deviation between the predicted value and the true value, and the higher the accuracy of the model. The value of R2 is closer to 1, which indicates a higher degree of fit and higher accuracy of the model, and its calculation formula is as follows. The evaluation indicators of the fuel consumption model are shown in Table 6.
R M S E = 1 n i = 1 n ( y i * y i ) 2
A R E = 1 n i = 1 n y i y i * y i
R 2 = 1 i = 1 n ( y i y i * ) 2 i = 1 n ( y i y ¯ i ) 2
where y i is the true value, y i * is the predicted value, y ¯ i is the mean of the true value, and n is the number of samples.
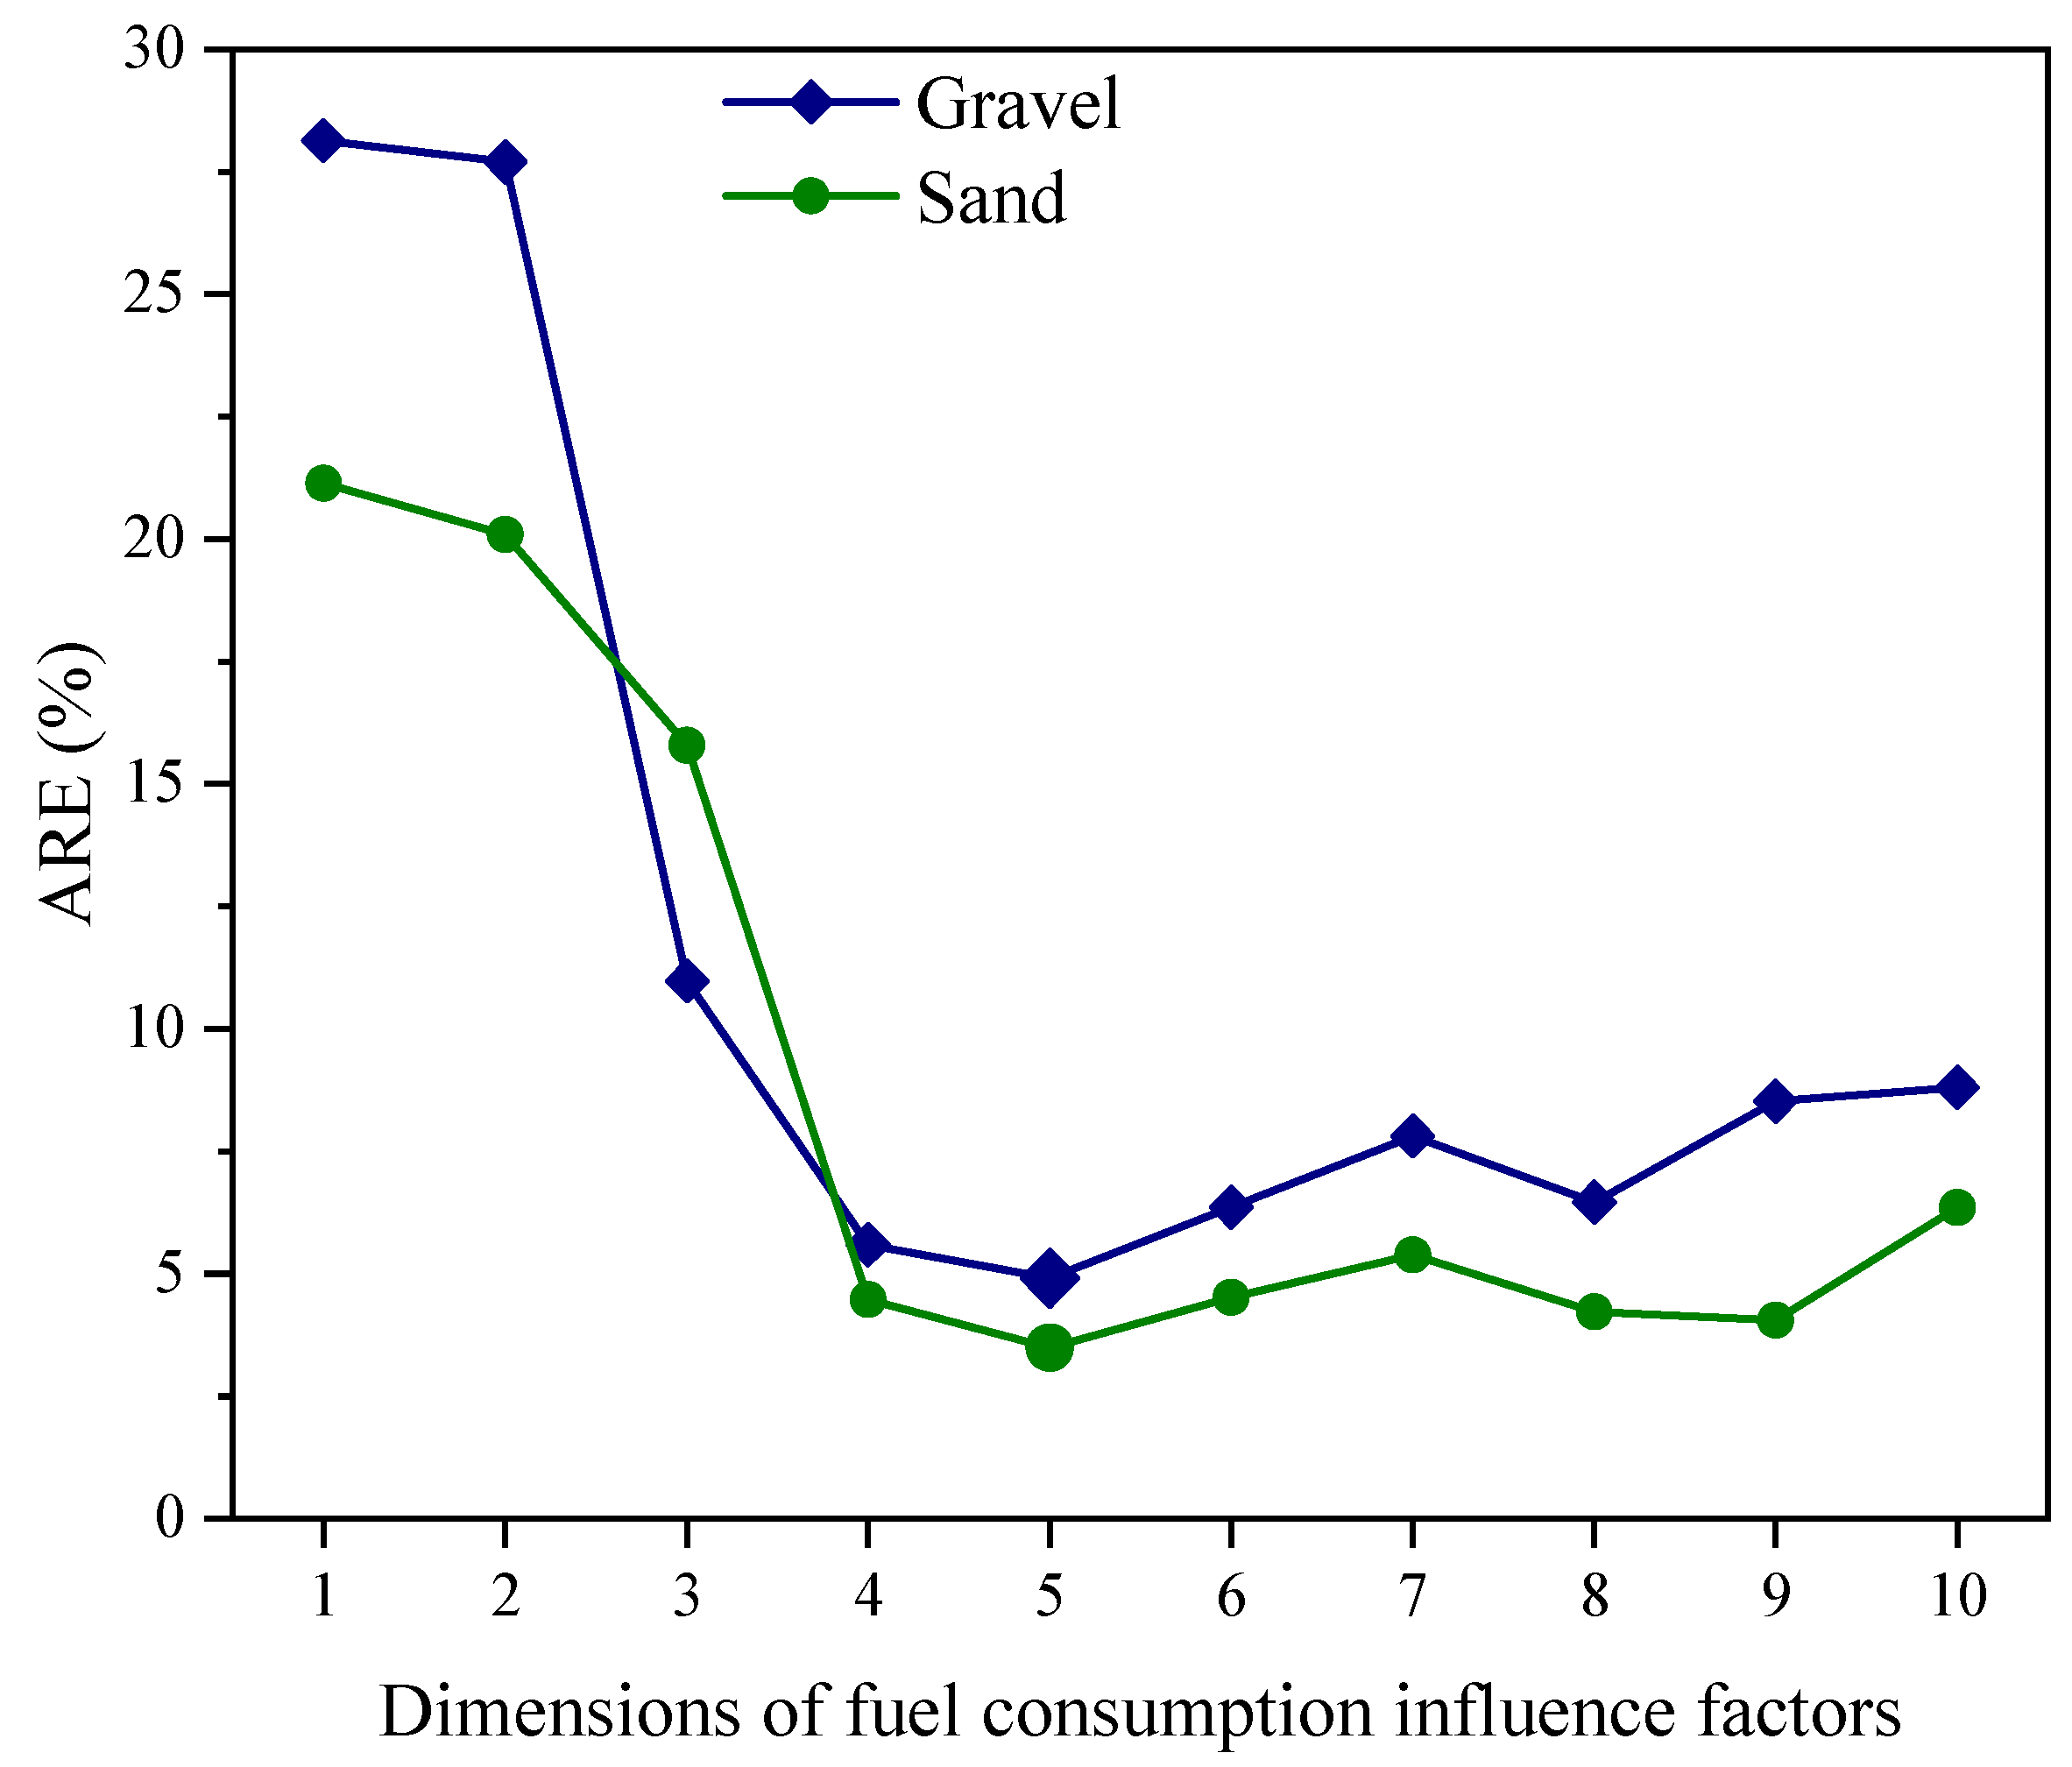
In the gravel fuel consumption prediction model, the ARE is 4.91%, the RMSE is 5.91, and the R2 is 0.9764. While in the sand fuel consumption prediction model, the ARE is 3.49%, the RMSE is 3.08, and the R2 is 0.9494. In terms of prediction accuracy, the prediction accuracy of the gravel fuel consumption prediction model is lower than that of the sand fuel consumption prediction model. And in terms of fitting ability, the gravel fuel consumption prediction model has a better fitting ability. Overall, the SVM fuel consumption prediction model showed better prediction ability in both the gravel samples and the sand samples. The deviation between the predicted and true values of the model is slight, and the model has high stability and generalization ability. To further test the rationality of KPCA. Different dimensions of fuel consumption influence factors are selected as input layers in the SVM fuel consumption model. The same training set and test set are selected, and ARE is used as the evaluation indicator. The prediction performance of the gravel model and sand model is shown in Figure 10. When the dimension increases, the value of ARE decreases rapidly, and when the dimension is 5, the ARE of the gravel model and sand model reaches the lowest point. When the dimension continues to increase, the values of ARE both have a small increase.

4.3. IPSO Optimization Process

To obtain the optimal shoveling trajectory with different engine speeds. IPSO is used to optimize the SVM fuel consumption model. The indicators of optimization are the input features of the SVM model, which are the initial velocity, the displacement of the wheel loader in the insertion phase, the shoveling weight, the operation time, and the displacement of the wheel loader in the scooping phase. Among them, the initial velocity exists in different intervals depending on the engine speed. The displacement of the wheel loader in the scooping phase is not involved in the optimization search due to the limitation of trajectory planning, and the results are obtained by the calculation of wheel loader displacement in the insertion phase. As for the operation time and shoveling weight, which is a posteriori data, as long as they correspond to the upper and lower limits of the sample data, the optimization intervals of each parameter are shown in Table 7.
In the IPSO algorithm, c1 and c2 are set to 1.5. The number of iterations is set to 200. The population size is set to 30. The optimal trajectories of the gravel model and the sand model are optimized for three different engine speeds, respectively. The optimization process is shown in Figure 11, and the optimization results are shown in Table 8.

5. Validation Experiment and Discussion

5.1. Validation Experiment

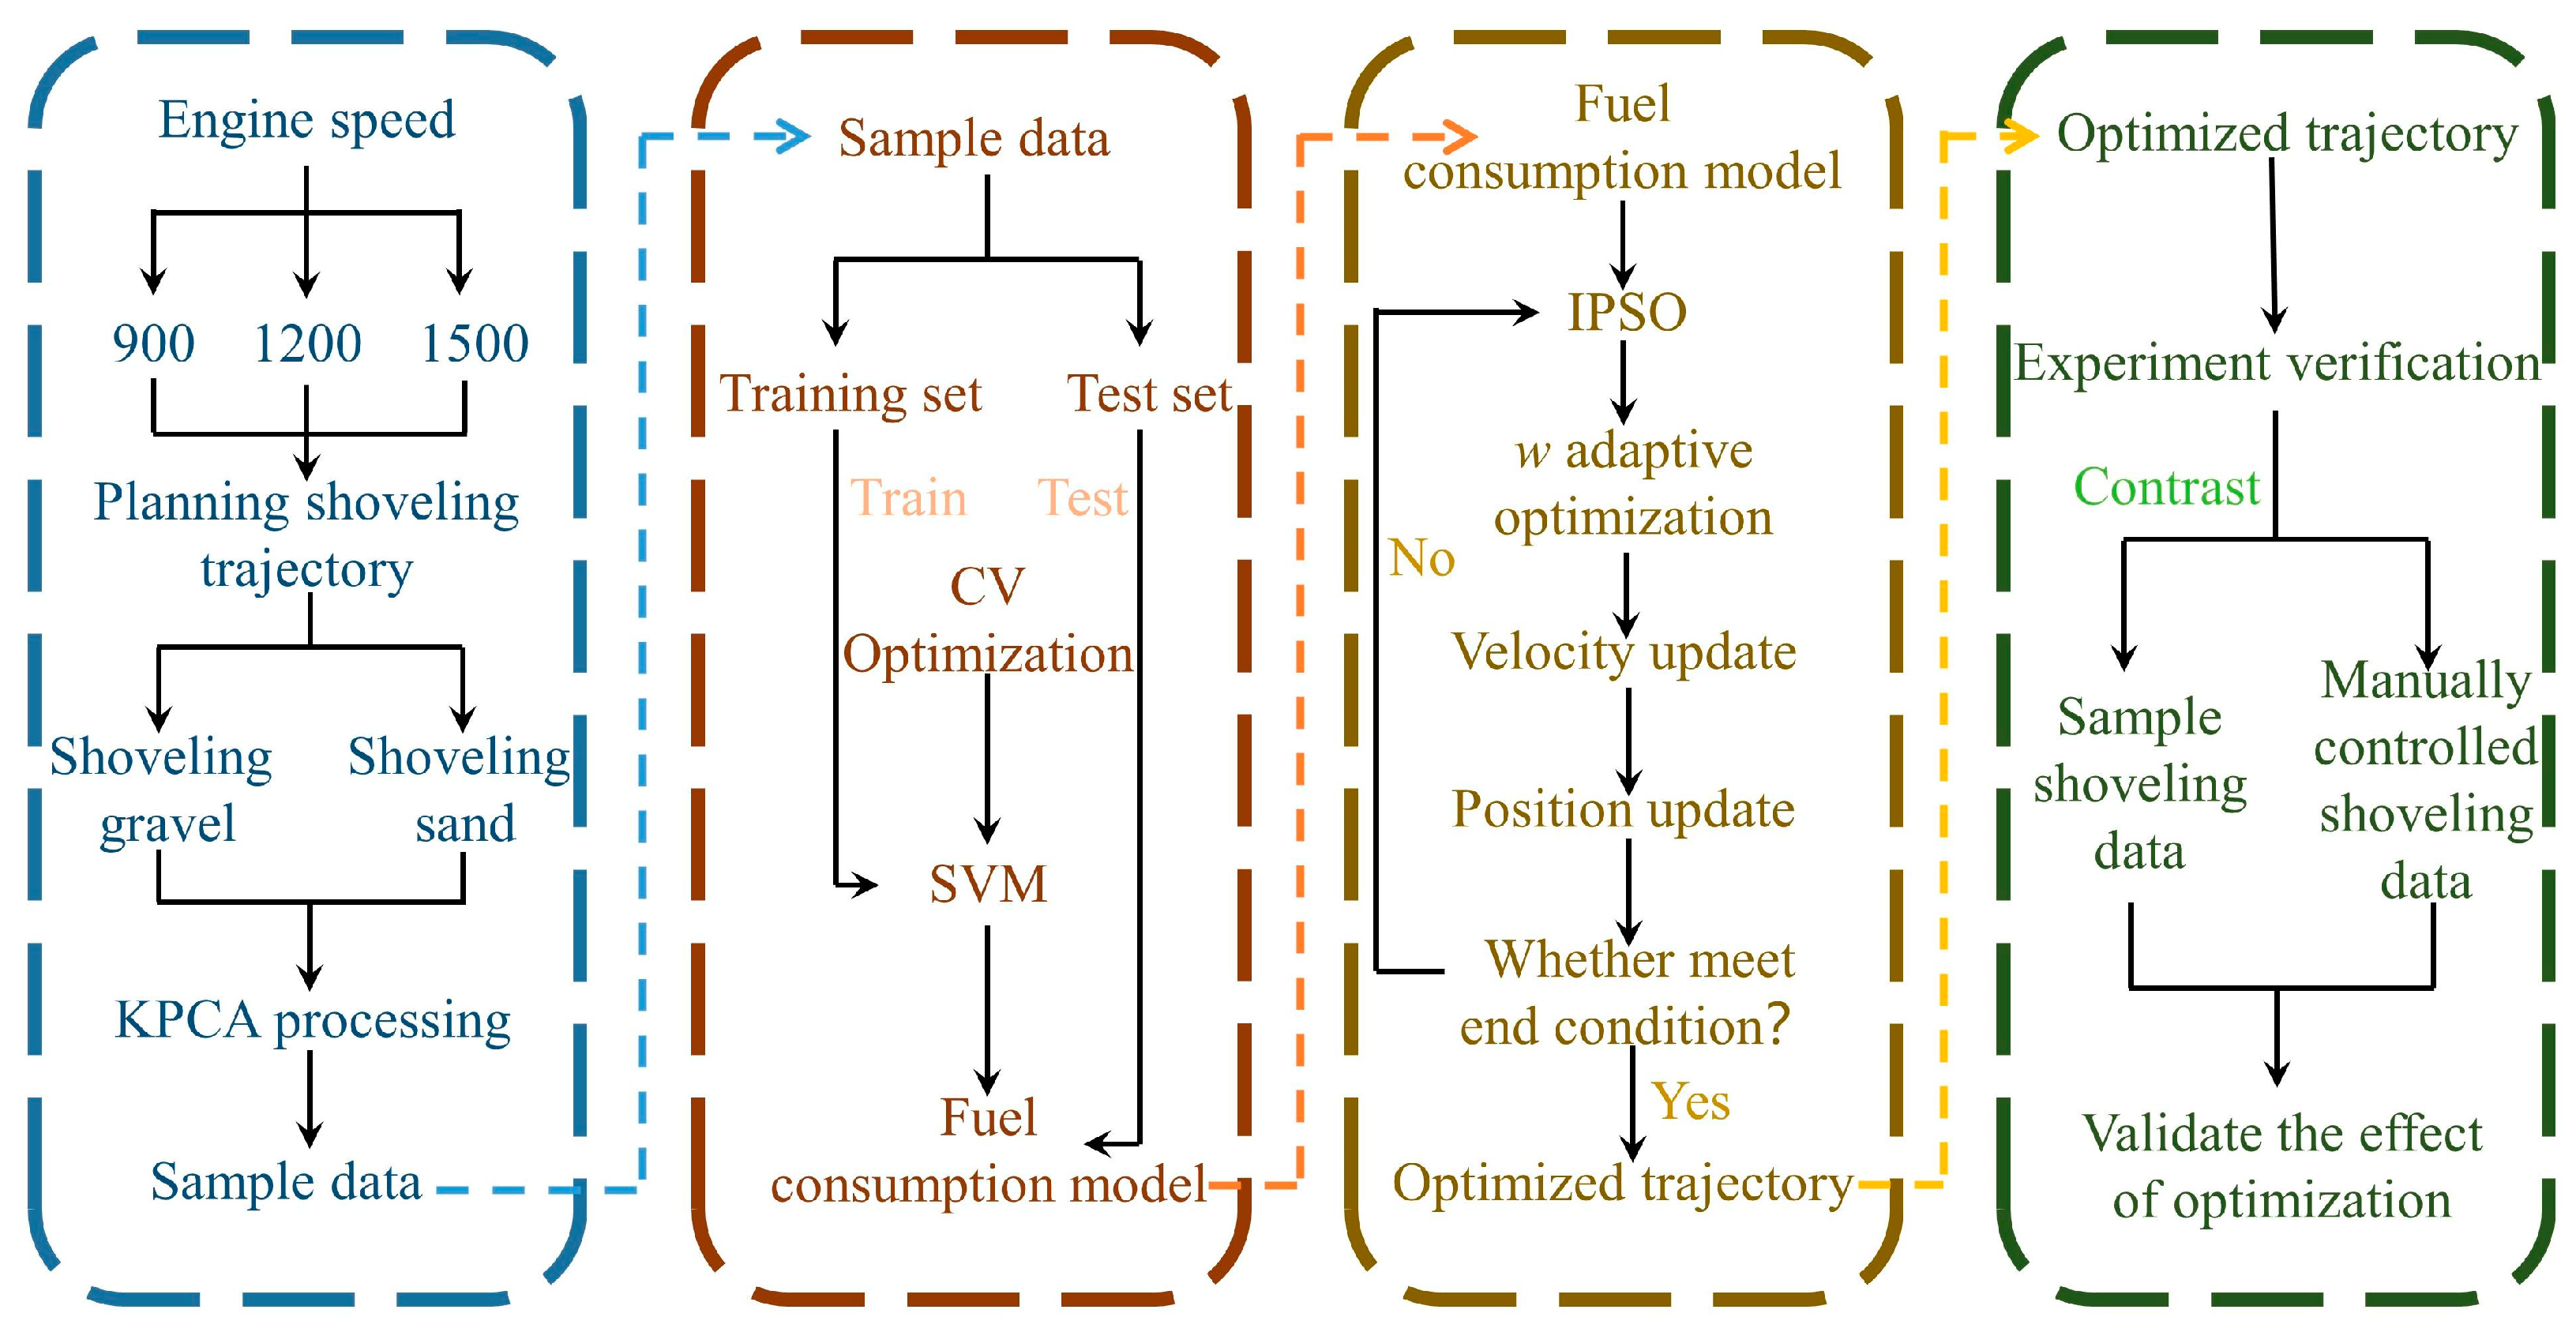
To verify the performance of the optimized shoveling trajectory, the corresponding trajectories were planned at different engine speeds according to the data in Table 8, and the research line of thought is shown in Figure 12. Three experiments at each of three different engine speeds with optimized trajectories in a gravel pile and sand pile and the results of the shoveling experiments with the shoveling operation parameters are shown in Table 9. Due to the large randomness of the shoveling operation itself and the accuracy problem in the data collection process, which led to certain errors in the testing process, it was difficult to ensure that the trajectory remained the same as the theoretical trajectory even by using the automatic shoveling platform. Therefore, in the insertion phase, when the error between the actual insertion distance of the wheel loader and the theoretical distance is less than 20 mm, it can be considered as basically conforming to the theoretical trajectory.
The average fuel consumption of the validation experiment, the theoretical fuel consumption of IPSO optimization, the minimum fuel consumption of the sample, the maximum fuel consumption of the sample, and the average fuel consumption of the sample are shown in Figure 13. The deviation between the average fuel consumption of the validation experiment and the theoretical fuel consumption of IPSO optimization is small. The maximum deviation value is 8.23%, and the accuracy of the fuel consumption model is high. The deviation from the actual shoveling operation is small. In Gravel-1200 RPM, the experimental average fuel consumption is slightly higher than the minimum fuel consumption of the sample, and the fuel consumption is improved by 0.62%. However, in the other models, the average fuel consumption of the validation experiment is reduced compared with the minimum fuel consumption of the sample. Among them, the maximum reduction in fuel consumption is 22.63% in Gravel-900 RPM. The average fuel consumption of the validation experiment is substantially reduced compared to the sample maximum fuel consumption, with a maximum reduction of 73.65% and a minimum reduction of 55.70%. In the gravel model with three different engine speeds, the average fuel consumption of the validation experiment is reduced by 60.93%, 45.79%, and 49.10%, respectively, compared to the sample average fuel consumption. In the sand model with three different engine speeds, the average fuel consumption of the validation experiment is reduced by 30.93%, 35.56%, and 28.59%, respectively, compared with the sample average fuel consumption. The optimized shoveling trajectory effectively reduced the fuel consumption of the shoveling operation.
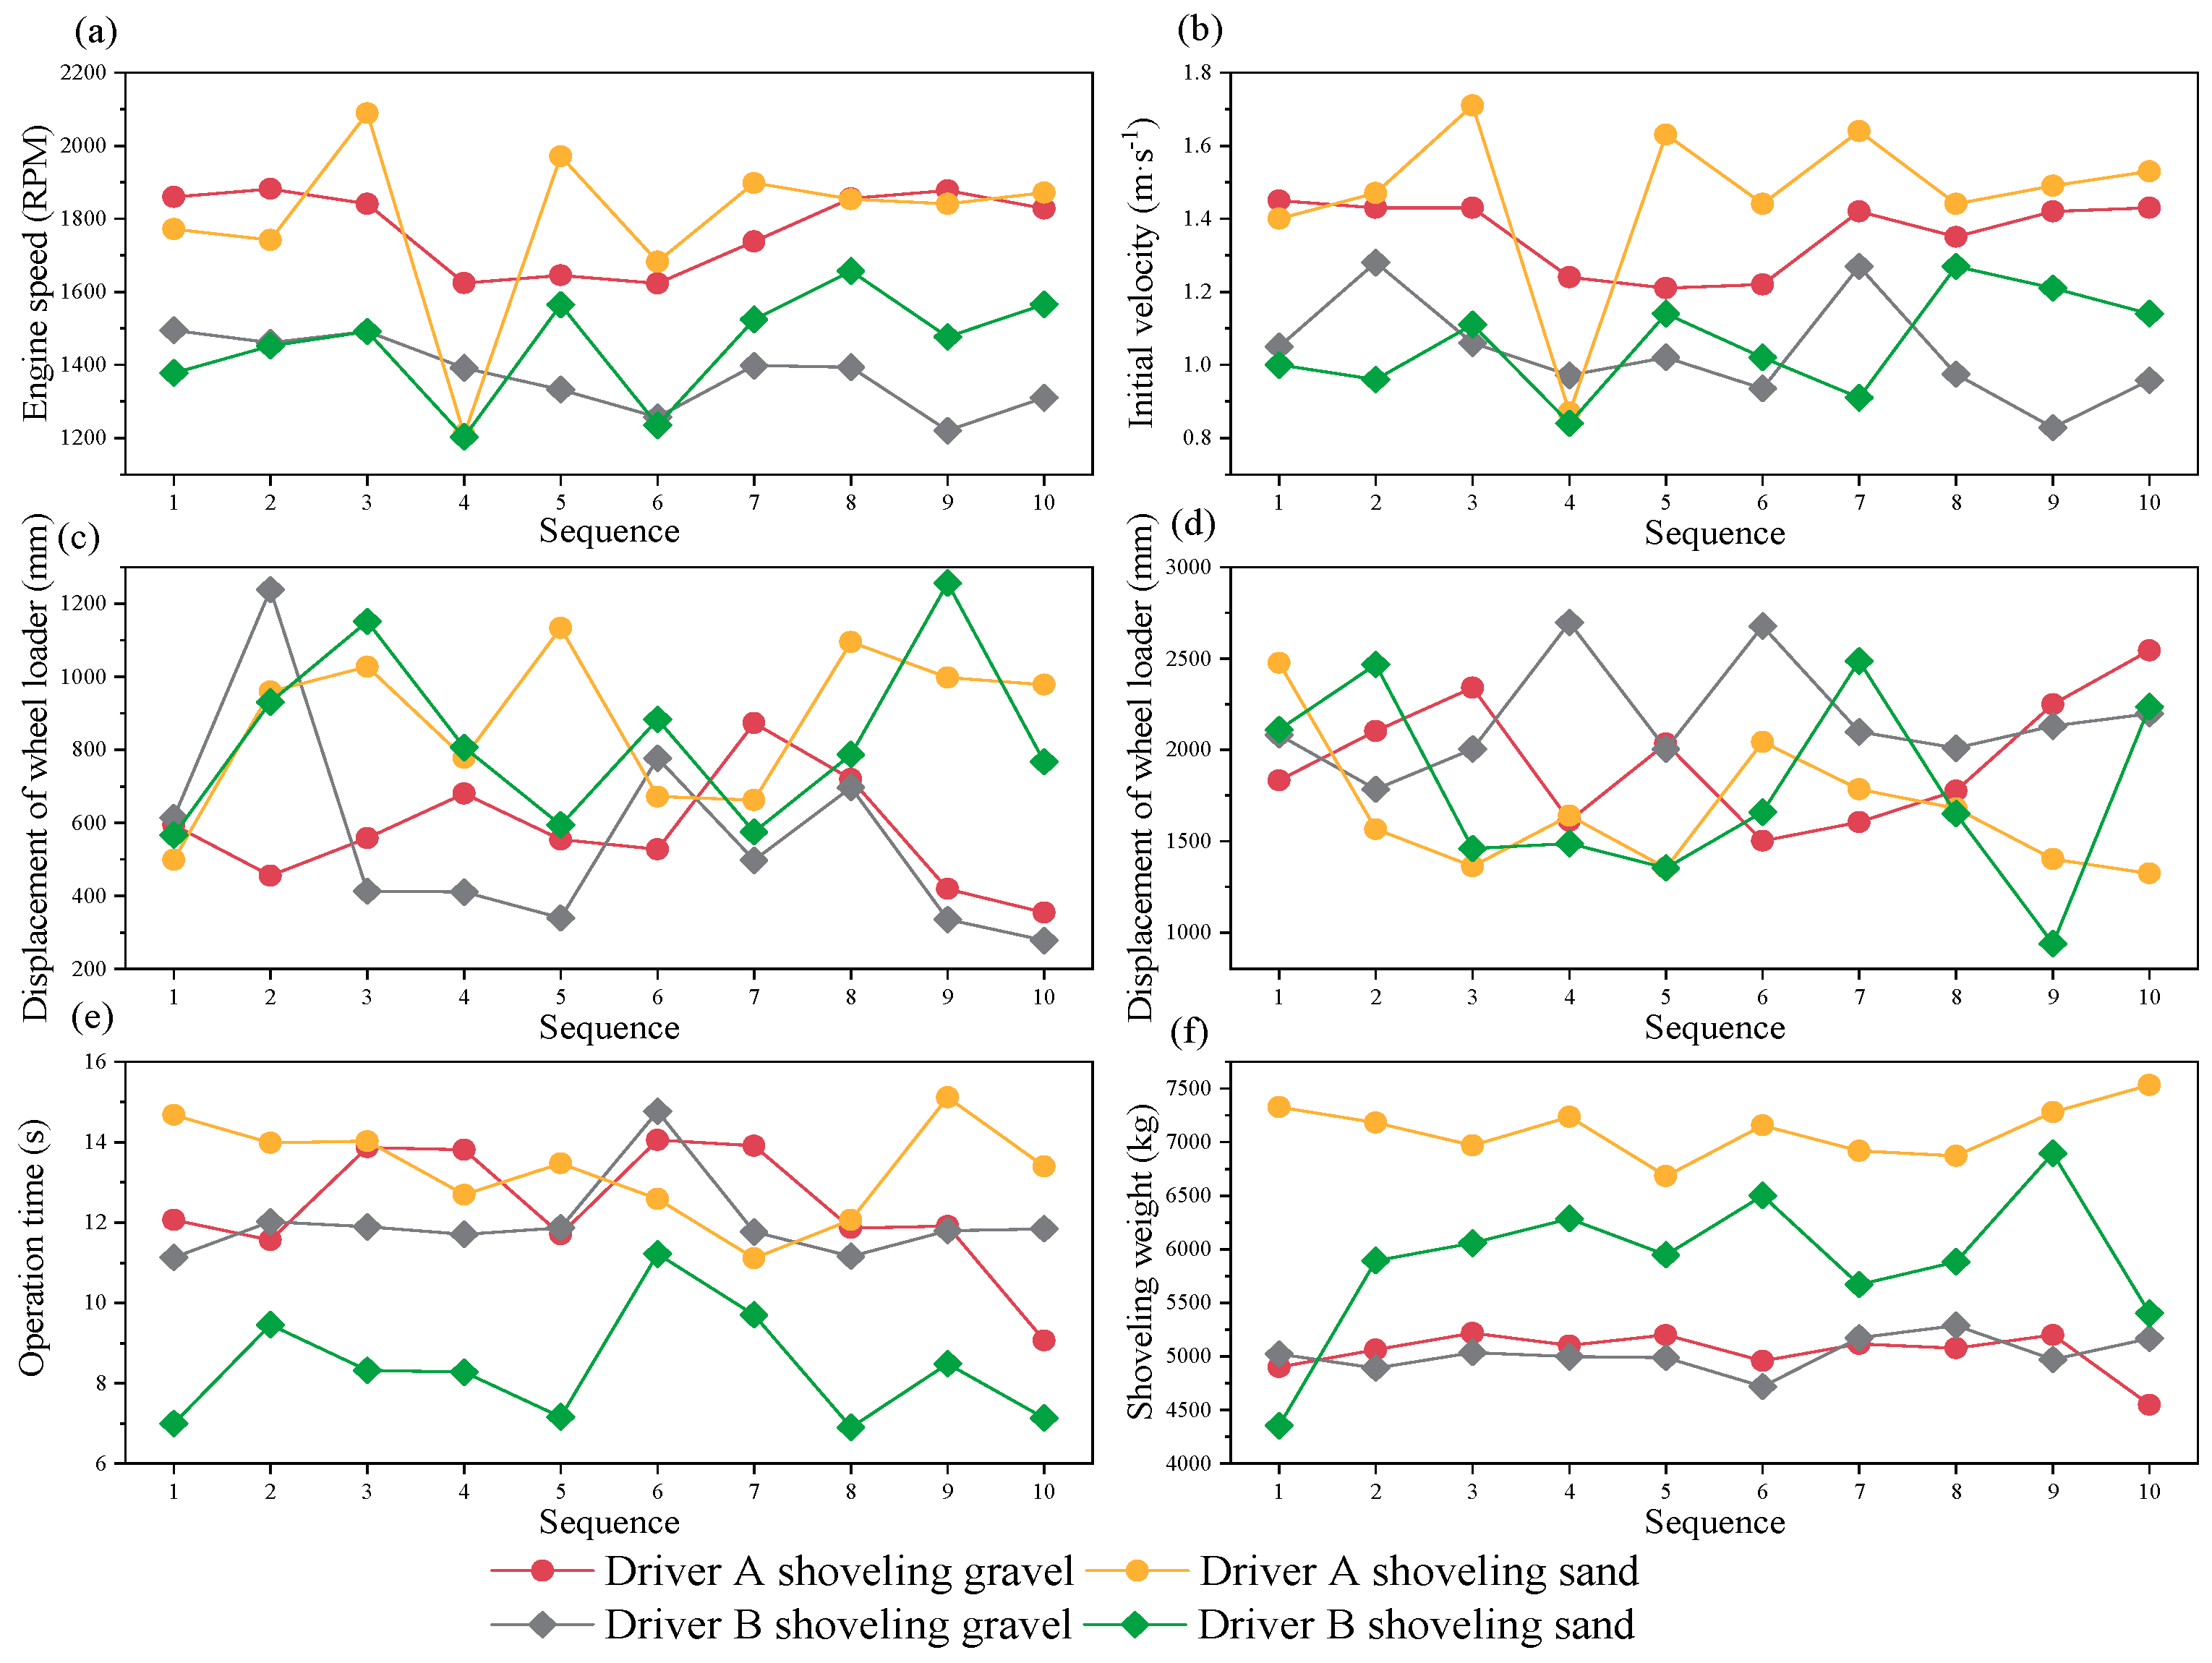
To further compare the performance of the optimized shoveling trajectory, a comparison with the shoveling operation of a manually operated wheel loader is selected. In manually controlled shoveling, there are no restrictions on the parameters such as the engine speed of the wheel loader, displacement of the wheel loader in the insertion phase, and displacement of the wheel loader in the scooping phase. Wheel loader drivers will conduct random shoveling according to their driving habits and operating experience. To increase the comparability, two drivers are selected to carry out 10 shoveling operations on the gravel pile and sand pile, respectively, in the same experimental conditions and record the parameters during the shoveling operations. The parameters of shoveling operations are shown in Figure 14, and the fuel consumption of shoveling operations is shown in Table 10.
The average fuel consumption for the validation experiments of the three optimized trajectories decreased by 29.54%, 19.84%, and 42.33%, respectively, compared to driver A’s control of shoveling gravel and by 30.39%, 21.42%, and 43.46%, respectively, compared to driver B. The average fuel consumption of the validation experiments for the three optimized trajectories decreased by 33.63%, 33.60%, and 23.76%, respectively, compared to driver A shoveling sand, and by 29.99%, 29.96%, and 19.58%, respectively, compared to driver B. The average fuel consumption for shoveling gravel with optimized trajectory with three engine speeds is 53.69 mL, which is 26.05% and 29.20% lower compared to Driver A and Driver B, respectively. And the average fuel consumption of shoveling sand with optimized trajectory with three engine speeds is 52.47 mL; compared with Driver A and Driver B, the average fuel consumption is reduced by 26.44% and 22.12%, respectively. The average fuel consumption for manually controlled shoveling of gravel is 74.22 mL, and the average fuel consumption for manually controlled shoveling of sand is 69.35 mL. The fuel consumption can be, on average, reduced by 27.66% when shoveling gravel with an optimized trajectory and by 24.34% when shoveling sand with an optimized trajectory. In conclusion, compared with the manually controlled shoveling operation, the shoveling operation, according to the optimized trajectory, can effectively reduce fuel consumption of shoveling operation.
In order to test the significance of the reduction in fuel consumption for the optimized shoveling trajectory, a t-test is chosen to test it in this paper. The samples are selected from the fuel consumption of the optimized shoveling trajectory and the fuel consumption of drivers A and B shoveling gravel and sand, respectively. The t-test allows us to obtain statistical conclusions about the significance of the difference between the means of the two groups of samples and to determine their level of statistical significance. First, the hypothesis is established. The null hypothesis H0 is that there is no significant difference between the fuel consumption data of the optimized shoveling trajectory and the fuel consumption data of the manually controlled shoveling. The alternative hypothesis H1 is that the fuel consumption data from the optimized shoveling trajectory performs significantly better than the fuel consumption data from the manually controlled shoveling, as shown in Equation (22). After that, the significance level needs to be determined. In this paper, the significance level α is chosen as 0.05. Finally, the T-value is calculated and compared with the critical value of the two-sided test, and the formula for calculating the T-value is shown in Equation (23). The fuel consumption of shoveling gravel with optimized shoveling trajectory is 5.02 and 5.50 compared to driver A and B, respectively, while the fuel consumption of shoveling sand with optimized shoveling trajectory is 5.80 and 5.83 compared to driver A and B, respectively, with all T-value greater than the critical value t0.05/2(17) = 2.11. Therefore, the null hypothesis can be rejected, and the alternative hypothesis is selected. Thus, we can conclude that the fuel consumption with an optimized shoveling trajectory performs significantly better than the fuel consumption with manually controlled shoveling. At the restricted significance level, fuel consumption is significantly reduced with the optimized shoveling trajectory.
H o : μ 1 = μ 2 H 1 : μ 1 > μ 2
where μ1 is the overall mean value of fuel consumption for manually controlled shoveling, and μ2 is the overall mean value of fuel consumption for optimized shoveling trajectory.
T = x ¯ 1 x ¯ 2 s 1 2 n 1 + s 2 2 n 2
where x ¯ 1 is the sample mean value of fuel consumption of manually controlled shoveling, x ¯ 2 is the sample mean value of fuel consumption of optimized shoveling trajectory, s1 is the sample standard deviation of fuel consumption of manually controlled shoveling, s2 is the sample standard deviation of fuel consumption of optimized shoveling trajectory, n1 is the sample number of fuel consumption of manually controlled shoveling, n2 is the sample number of fuel consumption of optimized shoveling trajectory.

5.2. Discussion

This paper is based on the constructed automatic operation platform of the wheel loader. The mathematical model of fuel consumption is established by SVM. And the optimized shoveling trajectory with three different engine speeds in the gravel pile and the sand pile is obtained by combining IPSO. By comparing with the fuel consumption of manually controlled shoveling, the fuel consumption with the optimized shoveling trajectory has been significantly reduced. In this study, only the effect of different engine speeds and different shoveling trajectories on fuel consumption has been considered. There are other influencing factors for fuel consumption. The main factors include the driver’s operating ability and the age of the wheel loader. The driver’s operating ability will directly affect the fuel consumption, varying from two to three times for different drivers [42]. The influence of manual operation on fuel consumption mainly includes the selection of insertion depth [43], the bucket attitude control during shoveling [44], and the cooperation between the gas pedal and the brake pedal [45]. The power possessed by the wheel loader is different at different engine speeds. When the engine speed is low, if the insertion is too deep, the bucket will get stuck in the pile and cause the tires to slip, increasing fuel consumption. Moreover, if the bucket is turned too much during the shoveling process, the resistance to the bucket will surge, which requires additional fuel consumption. It is worth noting that the shoveling process is not a uniform speed process, which needs a moderate increase and decrease, that is, better cooperation between the gas pedal and the brake pedal. For the age of the wheel loader, it is sure that with the increase in use time, there will be different degrees of wear between the mechanisms, and fuel efficiency will be reduced. In particular, the bucket tip of the bucket, as the part that contacts the pile, suffers the most wear during the long-term shoveling process [46]. Timely replacement or repair of bucket tips is an effective way to reduce fuel consumption. Automatic shoveling of wheel loaders has undoubtedly become the mainstream development trend in the future [47,48], and automatic shoveling means a more standard operation mode, higher fuel economy, and a corresponding reduction in wear for wheel loaders. At the same time, human safety is ensured to a large extent. Most importantly, automatic shoveling is an effective way to reduce fuel consumption. Azulay et al. [49] developed a controller based on deep reinforcement learning. They conducted experiments on a shoveling robot with three degrees of freedom, which included lift, turn, and speed, and the shoveling efficiency of the robot with this controller was significantly higher than that of the robot with manual control. Dadhich et al. [50] proposed a time-lag neural network-based shoveling operation method for wheel loaders was conducted, and several experiments were successful, with only 26% longer operation time and improved fuel economy for the same shoveling weight. Huang et al. [51] established an automatic shoveling model for wheel loaders by Q-learning, which could reduce fuel consumption by 8.0% and 10.6%, respectively, compared to manual operation by two drivers. Our study promotes the development of automatic shoveling by planning a reasonable shoveling trajectory for it. Moreover, it demonstrates excellent advantages and potential compared to manually controlled shoveling.
In this study, we consider only the fuel consumption with an optimized shoveling trajectory. However, the shoveling weight is the critical indicator for evaluating the efficiency of wheel loaders. The importance of shoveling weight and fuel consumption varies for different shoveling environments. It is essential to recognize that higher shoveling weights are not better. If the wheel loader is overloaded for a long time, it may lead to greater wear on the wheel loader and reduce its service life. In conclusion, the weighting between shoveling weight and fuel consumption must be determined in actual operation. In the future, we will optimize the shoveling trajectory for the actual shoveling environment to balance fuel consumption and shoveling weight. In the meantime, we have only tested in gravel piles and sand piles. Although these two materials are highly representative, we plan to extend them to other applications, such as large rocks. As the material size and irregularities increase, the bucket will shake significantly during shoveling and may even deviate from the planned shoveling trajectory. We must ensure that this deviation is within an acceptable range. Of course, the control of the shoveling process will also become a new challenge.

6. Conclusions

In this study, the shoveling trajectories of gravel and sand are optimized at different engine speeds. The corresponding optimized trajectories were obtained with the optimization objective of reducing the fuel consumption of shoveling operations. The results show that the optimized shoveling trajectory effectively reduces the fuel consumption of shoveling operation, and the main conclusions are as follows.
  • In this study, the factors with a strong influence on the fuel consumption of shoveling operations are screened by experimental analysis and KPCA. The factors with a strong influence are initial velocity, the wheel loader displacement in the insertion phase, the shoveling weight, the operation time, and the wheel loader displacement in the scooping phase. KPCA results show that the cumulative contribution rate of the above five factors can reach 90%. Meanwhile, the grey relation coefficients between key factors of fuel consumption influence and fuel consumption are all greater than 0.75. It proves that the screening of key factors of fuel consumption influenced by KPCA is effective.
  • In this study, the fuel consumption model is established by SVM, and the penalty factor and kernel function parameters in SVM are optimized by CV. The SVM fuel consumption model has high stability and generalization ability, and the deviation between the predicted and true values of the model is small. In the gravel samples, its ARE is 4.91%, RMSE is 5.91, and R2 is 0.9764. While in the sand samples, the ARE is 3.49%, RMSE is 3.08, and R2 is 0.9494. The deviation between the true values and the predicted values from the SVM fuel consumption model is small.
  • In this study, the optimized shoveling trajectories are obtained by IPSO for shoveling gravel and shoveling sand at three engine speeds. Validation experiments are conducted based on the optimized trajectory and compared with the sample data fuel consumption and manually controlled shoveling fuel consumption. The results show that the optimized trajectory can significantly reduce the fuel consumption of shoveling operations. For shoveling gravel, the average fuel consumption of the validation experiment is reduced by 60.93%, 45.79%, and 49.10%, respectively, compared with the sample average fuel consumption with three engine speeds. For shoveling sand, the average fuel consumption in the validation experiment is reduced by 30.93%, 35.56%, and 28.59%, respectively, compared with the sample average fuel consumption with three engine speeds. Compared with manually controlled shoveling gravel and sand, fuel consumption can be reduced by 27.66% and 24.34%, respectively.

Author Contributions

Conceptualization, Y.C. and G.S.; methodology, Y.C.; software, G.S.; validation, G.S.; formal analysis, Y.C.; investigation, C.T.; resources, G.S.; data curation, G.S.; writing—original draft preparation, G.S.; writing—review and editing, Y.C.; visualization, C.T.; supervision, Y.C.; project administration, Z.W.; funding acquisition, Y.C. and Z.W. All authors have read and agreed to the published version of the manuscript.

Funding

This research was funded by the National Natural Science Foundation of China (61962007), the Key Projects of Guangxi Natural Science Foundation (2018GXNSFDA294001), and the S&T Fund of Guangxi Province (1598021-2).

Institutional Review Board Statement

Not applicable.

Informed Consent Statement

Not applicable.

Data Availability Statement

The data in this study are available from the corresponding authors upon request.

Conflicts of Interest

The authors declare no conflict of interest.

References

  1. Zhang, G.J.; Xiao, C.Y. Dynamic simulation analysis on loader’s working device. Aust. J. Mech. Eng. 2018, 16, 2–8. [Google Scholar]
  2. Xu, J.; Yoon, H.S. A review on mechanical and hydraulic system modeling of excavator manipulator system. J. Constr. Eng. 2016, 2016, 9409370. [Google Scholar] [CrossRef]
  3. Koizumi, T.; Tsujiuchi, N.; Yoshida, T.; Andou, H. Evaluation process of digging performance for hydraulic excavator by bucket tip trace. J. Syst. Des. Dyn. 2011, 5, 1005–1016. [Google Scholar] [CrossRef] [Green Version]
  4. Wang, X.; Sun, W.; Li, E.; Song, X. Energy-minimum optimization of the intelligent excavating process for large cable shovel through trajectory planning. Struct. Multidisc. Optim. 2018, 58, 2219–2237. [Google Scholar] [CrossRef]
  5. Sarata, S.; Koyachi, N.; Sugawara, K. Field test of autonomous loading operation by wheel loader. In Proceedings of the 2008 IEEE/RSJ International Conference on Intelligent Robots and Systems, Nice, France, 22–28 September 2008. [Google Scholar]
  6. Hong, Q.G.; Chen, Y.H.; Huai, Z.P. Experimental Study on Automatic Shovel Loading of Loader. Coal Mine. Mach. 2021, 42, 195–197. [Google Scholar]
  7. Xu, L.C.; Ge, R.H. Optimization design of shovel depth when loader shovelling original raw soil. TELKOMNIKA Indones. J. Electr. Eng. 2013, 11, 4639–4645. [Google Scholar]
  8. Gong, J.; Cui, Y.X. Track planning for a wheel Loader in a digging. J. Mech. Eng. 2009, 45, 29–34. [Google Scholar] [CrossRef]
  9. Zhang, H.; Cao, S.J.; Kazuhiko, S. Test Investigation on Autonomous Scooping Control Strategy of Wheel Loader. Appl. Mech. Mater. 2010, 42, 156–159. [Google Scholar] [CrossRef]
  10. Filla, R.; Frank, B. Towards finding the optimal bucket filling strategy through simulation. In Proceedings of the 15th Scandinavian International Conference on Fluid Power, Linköping, Sweden, 7–9 June 2017. [Google Scholar]
  11. Meng, Y.; Fang, H.Z.; Liang, G.D.; Gu, Q.; Liu, L. Bucket trajectory optimization under the automatic scooping of LHD. Energies 2019, 12, 3919. [Google Scholar] [CrossRef] [Green Version]
  12. Yu, X.J.; Huai, Y.H.; Li, X.F.; Wang, D.W.; Yu, A. Shoveling trajectory planning method for wheel loader based on kriging and particle swarm optimization. J. Jilin Univ. (Eng. Technol. Ed.) 2020, 50, 437–444. [Google Scholar]
  13. Osumi, H.; Uehara, T.; Okada, N. Efficient scooping of rocks by autonomous controlled wheel loader. J. Rob. Mechatron. 2012, 24, 924–932. [Google Scholar] [CrossRef]
  14. Zhang, T.; Fu, T.; Song, X. Multi-objective excavation trajectory optimization for unmanned electric shovels based on pseudospectral method. Autom. Constr. 2022, 136, 104176. [Google Scholar] [CrossRef]
  15. Shen, W.; Jiang, J.; Su, X.; Reza Karimi, H. Control strategy analysis of the hydraulic hybrid excavator. J. Frankl. Inst. Eng. Appl. Math. 2015, 352, 541–561. [Google Scholar] [CrossRef]
  16. Frank, B.; Kleinert, J.; Filla, R. Optimal control of wheel loader actuators in gravel applications. Autom. Construct. 2018, 91, 1–14. [Google Scholar] [CrossRef]
  17. Yao, J.; Edson, C.P.; Yu, S. Bucket Loading Trajectory Optimization for the Automated Wheel Loader. IEEE Trans. Veh. Technol. 2023, 72, 6948–6958. [Google Scholar] [CrossRef]
  18. Liang, G.; Liu, L.; Meng, Y. Dynamic Modeling and Analysis of Loader Working Mechanism Considering Cooperative Motion with the Vehicle Body. Machines 2022, 11, 9. [Google Scholar] [CrossRef]
  19. Brinkschulte, L.; Hafner, J.; Geimer, M. Real-time load determination of wheel loader components. ATZheavy Duty Worldw. 2019, 12, 62–68. [Google Scholar] [CrossRef]
  20. Wang, S.; Yin, Y.; Wu, Y.; Hou, L. Modeling and Verification of an Acquisition Strategy for Wheel Loader’s Working Trajectories and Resistance. Sensors 2022, 22, 5993. [Google Scholar] [CrossRef] [PubMed]
  21. Trani, M.L.; Bossi, B.; Gangolells, M.; Casals, M. Predicting fuel energy consumption during earthworks. J. Clean. Prod. 2016, 112, 3798–3809. [Google Scholar] [CrossRef]
  22. Ma, W.X.; Zhang, Y.B.; Liu, C.B.; Wang, S.L. Prediction method of the fuel consumption of wheel loaders in the V-type loading cycle. Math. Prob. Eng. 2015, 2015, 538176. [Google Scholar] [CrossRef] [Green Version]
  23. Chen, Y.; Jiang, H.; Shi, G.; Zheng, T. Research on the Trajectory and Operational Performance of Wheel Loader Automatic Shoveling. Appl. Sci. 2022, 12, 12919. [Google Scholar] [CrossRef]
  24. Dindarloo, S.R.; Siami-Irdemoosa, E. Determinants of fuel consumption in mining trucks. Energy 2016, 112, 232–240. [Google Scholar] [CrossRef]
  25. Siami-Irdemoosa, E.; Dindarloo, S.R. Prediction of fuel consumption of mining dump trucks: A neural networks approach. Appl. Energy 2015, 151, 77–84. [Google Scholar] [CrossRef]
  26. Alamdari, S.; Basiri, M.H.; Mousavi, A.; Soofastaei, A. Application of machine learning techniques to predict haul truck fuel consumption in open-pit mines. J. Min. Environ. 2022, 13, 69–85. [Google Scholar]
  27. Gong, J.; Shang, J.; Li, L.; Zhang, C.; He, J.; Ma, J. A Comparative Study on Fuel Consumption Prediction Methods of Heavy-Duty Diesel Trucks Considering 21 Influencing Factors. Energies 2021, 14, 8106. [Google Scholar] [CrossRef]
  28. Shen, Y.C.; Song, H.; Li, G.Q.; Cherouat, A. Analysis and Prediction of Excavator Energy Consumption Based on Improved PSO-BP Neural Network. In Proceedings of the 12th International Workshop of Advanced Manufacturing and Automation, Xiamen, China, 11–12 October 2012. [Google Scholar]
  29. Liu, Y.H.; Zhang, Z.D.; Cai, Z.G. Research on the prediction of working fuel consumption for wheel loader based on BP neural network. Constr. Mach. 2018, 503, 81–83. [Google Scholar]
  30. Zhao, Y.; Zhou, M.; Wang, L. Bearing Fault Diagnosis of Single-Channel Data by a 3D DCN with Bilinear LBP and Modified KPCA. J. Electr. Eng. Technol. 2023. [Google Scholar] [CrossRef]
  31. Wang, Y.C.; Yang, S.J.; Guo, Q.P.; Yin, Y. Prediction of Blasting Muckpile Morphology in Throw Blasting of Coal Mine Based on MPA-SVM. Explos. Mater. 2023, 52, 58–64. [Google Scholar]
  32. Yuasa, T.; Ishikawa, M.; Ogawa, S. An Optimal Design Methodology for the Trajectory of Hydraulic Excavators Based on Genetic Algorithm. J. Rob. Mechatron. 2021, 33, 1248–1254. [Google Scholar] [CrossRef]
  33. Bi, Q.; Wang, G.; Wang, Y.; Yao, Z.; Hall, R. Digging Trajectory Optimization for Cable Shovel Robotic Excavation Based on a Multi-Objective Genetic Algorithm. Energies 2020, 13, 3118. [Google Scholar] [CrossRef]
  34. Zhao, X.; Jia, M. A new local-global deep neural network and its application in rotating machinery fault diagnosis. Neurocomputing 2019, 366, 215–233. [Google Scholar] [CrossRef]
  35. Lu, X.; Yang, C.; Wu, Q.; Wang, J.; Lu, Z.; Sun, S.; Liu, K.; Shao, D. Research on Analog Circuit Soft Fault Diagnosis Method Based on Mathematical Morphology Fractal Dimension. Electronics 2023, 12, 184. [Google Scholar] [CrossRef]
  36. Zhou, T.; Lu, H.L.; Wang, W.W.; Yong, X. GA-SVM based feature selection and parameter optimization in hospitalization expense modeling. Appl. Soft Comput. 2019, 75, 323–332. [Google Scholar]
  37. Patange, A.D.; Pardeshi, S.S.; Jegadeeshwaran, R. Augmentation of Decision Tree Model through Hyper-Parameters Tuning for Monitoring of Cutting Tool Faults Based on Vibration Signatures. J. Vib. Eng. Technol. 2022, 10, 1–19. [Google Scholar] [CrossRef]
  38. Bajaj, N.S.; Patange, A.D.; Jegadeeshwaran, R. Application of metaheuristic optimization based support vector machine for milling cutter health monitoring. Intell. Syst. Appl. 2023, 18, 200196. [Google Scholar] [CrossRef]
  39. Jain, M.; Saihjpal, V.; Singh, N.; Singh, S.B. An Overview of Variants and Advancements of PSO Algorithm. Appl. Sci. 2022, 12, 8392. [Google Scholar] [CrossRef]
  40. Han, D.; Yang, X.; Li, G. Highway traffic speed prediction in rainy environment based on APSO-GRU. J. Adv. Transp. 2021, 2021, 4060740. [Google Scholar] [CrossRef]
  41. Lin, J.; Sheng, G.; Yan, Y.; Dai, J.; Jiang, X. Prediction of Dissolved Gas Concentrations in Transformer Oil Based on the KPCA-FFOA-GRNN Model. Energies 2018, 11, 225. [Google Scholar] [CrossRef] [Green Version]
  42. Ahluwalia, R.K.; Wang, X.; Star, A.G. Performance and cost of fuel cells for off-road heavy-duty vehicles. Int. J. Hydrogen Energy 2022, 47, 10990–11006. [Google Scholar] [CrossRef]
  43. Cao, B.; Liu, X.; Chen, W. Intelligent energy-saving operation of wheel loader based on identifiable materials. J. Mech. Sci. Technol. 2020, 34, 1081–1090. [Google Scholar] [CrossRef]
  44. Li, J.; Chen, C.; Li, Y. Difficulty assessment of shoveling stacked materials based on the fusion of neural network and radar chart information. Autom. Constr. 2021, 132, 103966. [Google Scholar] [CrossRef]
  45. Fei, X.; Han, Y.; Wong, S.V. An Overview of and Prospects for Research on Energy Savings in Wheel Loaders. Automot. Exper. 2023, 6, 133–148. [Google Scholar] [CrossRef]
  46. Dong, Z.; Jiang, F.; Tan, Y.; Wang, F.; Ma, R.; Liu, J. Review of the Modeling Methods of Bucket Tooth Wear for Construction Machinery. Lubricants 2023, 11, 253. [Google Scholar] [CrossRef]
  47. Xiao, W.; Liu, M.; Chen, X. Research Status and Development Trend of Underground Intelligent Load-Haul-Dump Vehicle—A Comprehensive Review. Appl. Sci. 2022, 12, 9290. [Google Scholar] [CrossRef]
  48. Dadhich, S.; Bodin, U.; Andersson, U. Key Challenges in Automation of Earth-Moving Machines. Autom. Constr. 2016, 68, 212–222. [Google Scholar] [CrossRef] [Green Version]
  49. Azulay, O.; Shapiro, A. Wheel loader scooping controller using deep reinforcement learning. IEEE Access 2021, 9, 24145–24154. [Google Scholar] [CrossRef]
  50. Dadhich, S.; Sandin, F.; Bodin, U. Field test of neural-network based automatic bucket-filling algorithm for wheel-loaders. Autom. Constr. 2019, 97, 1–12. [Google Scholar] [CrossRef]
  51. Huang, J.; Kong, D.; Gao, G.; Cheng, X.; Chen, J. Data-Driven Reinforcement-Learning-Based Automatic Bucket-Filling for Wheel Loaders. Appl. Sci. 2021, 11, 9191. [Google Scholar] [CrossRef]
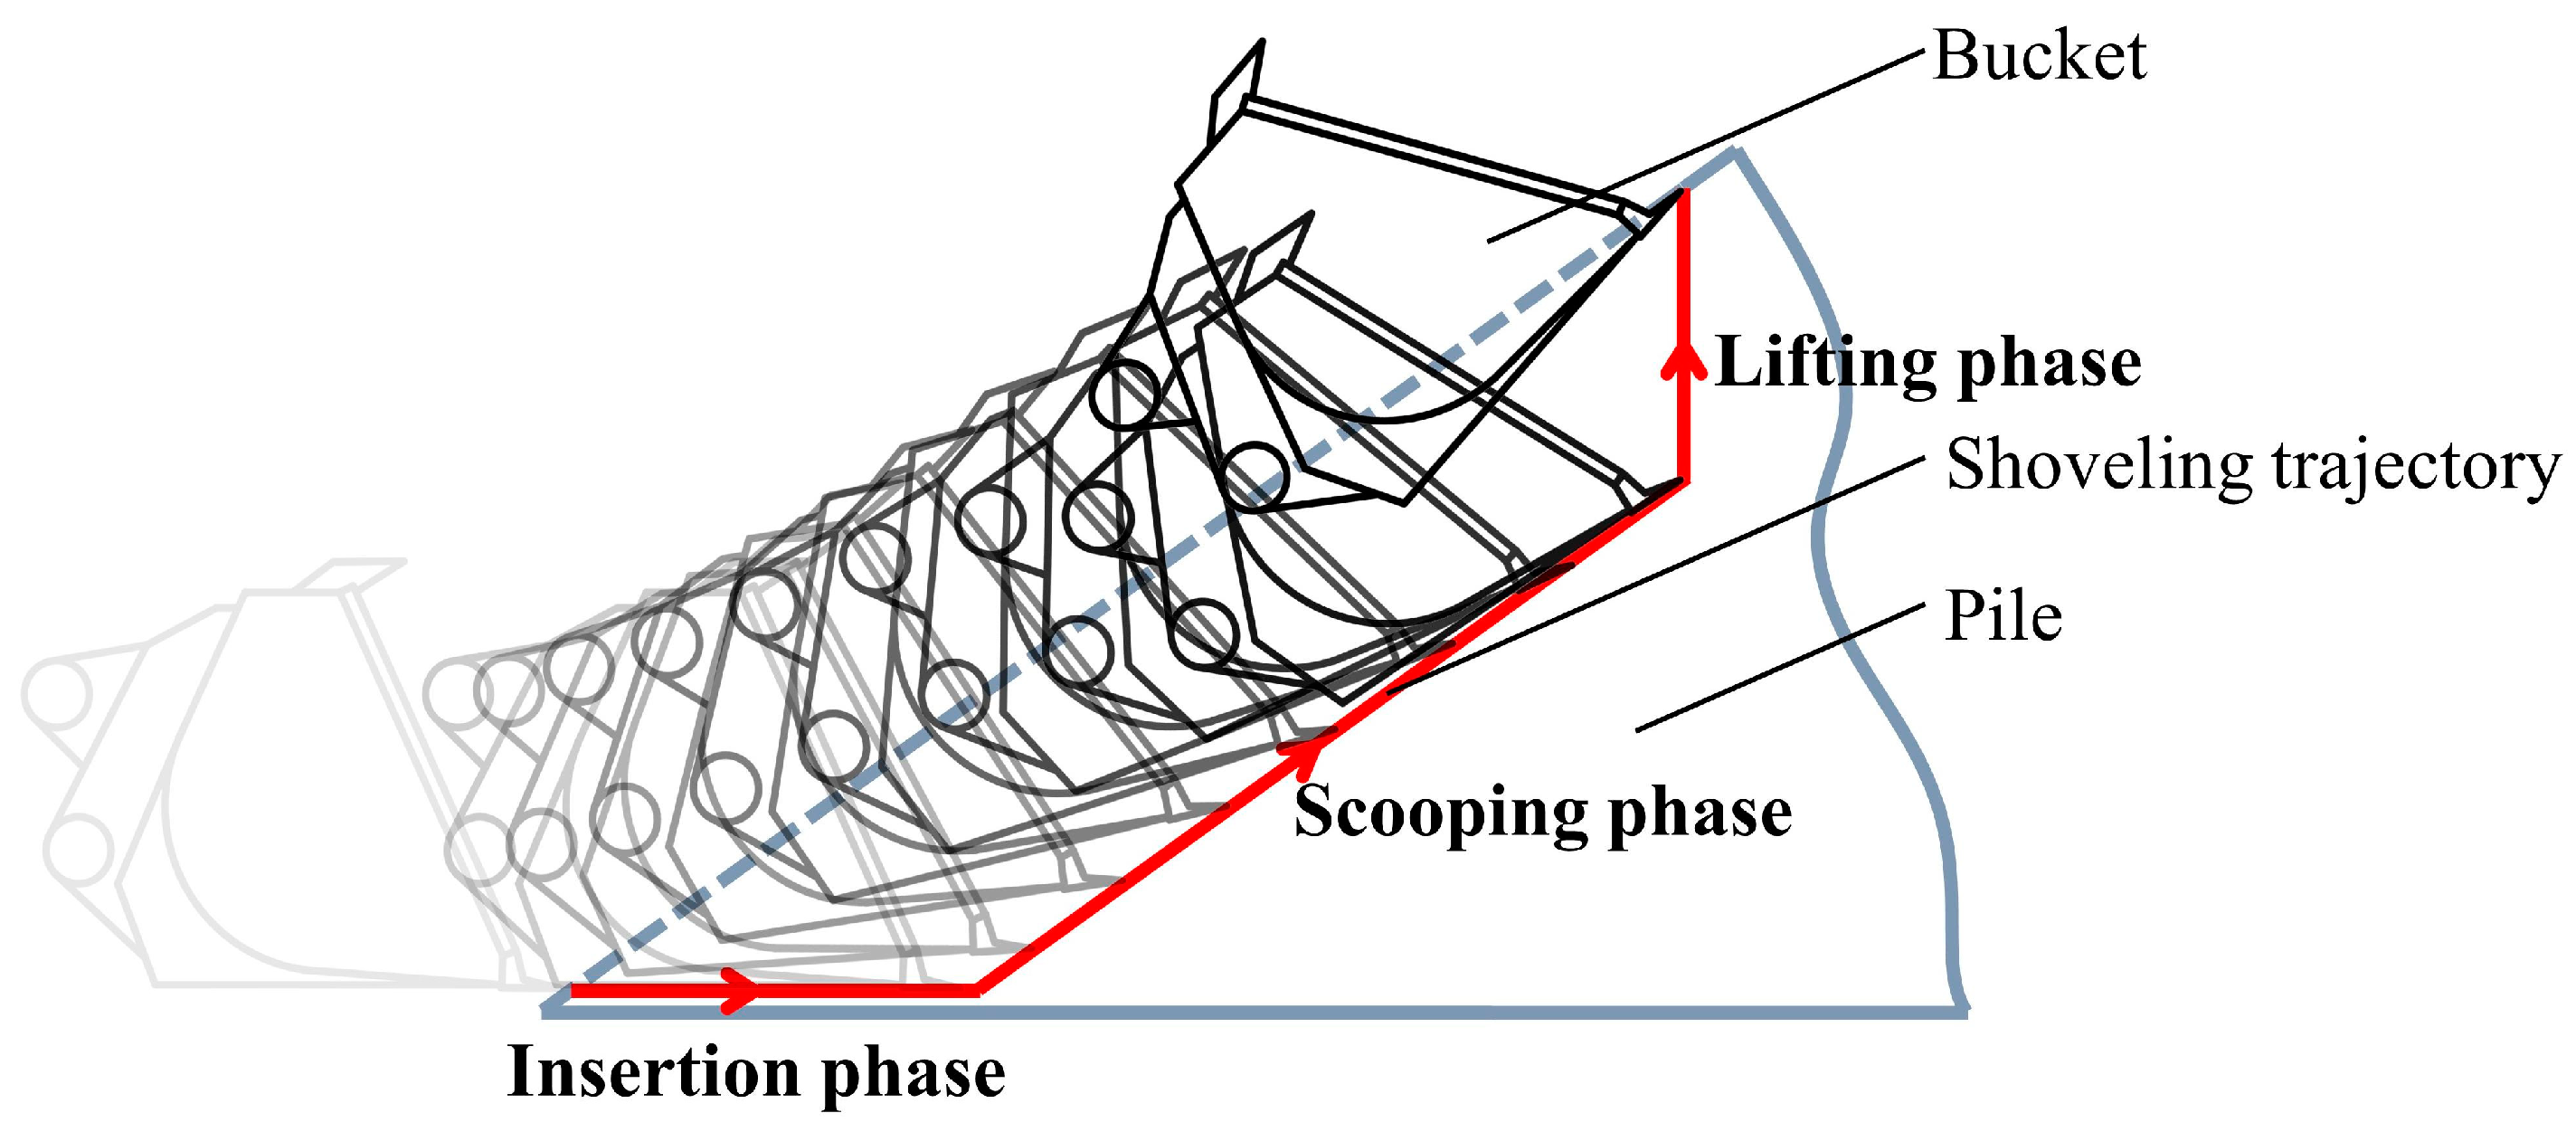
Figure 1. Shoveling trajectory.
Applsci 13 07659 g001
Figure 2. The process of shoveling operation.
Applsci 13 07659 g002
Figure 3. Automatic shoveling platform and sensors. As shown above, 1 fifth wheel gauge, 2 flow sensor, 3 vehicle PC system, 4 fifth wheel gauge control module, 5 signal receiving system, 6 all data acquisition system, 7 lift cylinder displacement sensor, 8 shoveling weight acquisition system, 9 tilt cylinder displacement sensor.
Applsci 13 07659 g003
Figure 4. Range of shoveling depths. (a) Gravel pile; (b) Sand pile.
Applsci 13 07659 g004
Figure 5. Shoveling area.
Applsci 13 07659 g005
Figure 6. Shoveling gravel and shoveling sand.
Applsci 13 07659 g006
Figure 7. Engine speed during the shoveling process. (a) Shoveling gravel; (b) Shoveling sand.
Applsci 13 07659 g007
Figure 8. Fuel consumption during the shoveling process. (a) Shoveling gravel; (b) Shoveling sand.
Applsci 13 07659 g008
Figure 9. Prediction performance of fuel consumption model. (a) Gravel fuel consumption model; (b) Sand fuel consumption model.
Applsci 13 07659 g009
Figure 10. Dimension of fuel consumption influence factors and model accuracy.
Applsci 13 07659 g010
Figure 11. IPSO optimization iterative process. (a) Gravel-900 RPM; (b) Gravel-1200 RPM; (c) Gravel-1500 RPM; (d) Sand-900 RPM; (e) Sand-1200 RPM; (f) Sand-1500 RPM.
Applsci 13 07659 g011
Figure 12. The research line of thought.
Applsci 13 07659 g012
Figure 13. Fuel consumption comparison.
Applsci 13 07659 g013
Figure 14. Parameters of the shoveling process for driver A and driver B. (a) Engine speed; (b) Initial velocity; (c) Displacement of wheel loader in insertion phase; (d) Displacement of wheel loader in scooping phase; (e) Operation time; (f) Shoveling weight.
Applsci 13 07659 g014
Table 1. Pile parameters.
Type of Pile Density (kg/m3) Angle of Repose (°) Particle Diameter (mm)
Gravel267235.020–60
Sand239236.5<1
Table 2. Fuel consumption.
Type of PileParameterInsertion PhaseScooping PhaseStopping PhaseLifting PhaseTotal
GravelFuel consumption (mL)27.1249.274.1015.6196.10
Percentage (%)28.2251.274.2716.24100.00
SandFuel consumption (mL)15.9741.156.4524.6888.26
Percentage (%)20.5152.838.2931.68100.00
Table 3. Part of the sample data.
Type of PileEngine Speed
(RPM)
NumberInitial Velocity
(m·s−1)
Displacement of Wheel LoaderDisplacement of Tilt Cylinder in Scooping Phase
(mm)
Displacement of Lift CylinderOperation Time
(s)
Shoveling Weight
(kg)
Fuel
Consumption (mL)
Insertion Phase
(mm)
Scooping Phase
(mm)
Stopping Phase
(mm)
Lifting Phase
(mm)
Scooping Phase
(mm)
Lifting Phase
(mm)
Gravel90010.4880214312591822730128113.62477173.63
20.497891536105392030726513.31511674.34
30.3599510611341252130427719.044966141.51
400.4278915631342022630327918.584927142.70
120010.8174915084621032030826713.03460962.54
20.8371817381051252830028212.64493463.88
30.757451699771632530227014.995103110.32
400.7977914312491443229625115.794284111.48
150011.1780613341643552829927814.62389473.49
21.098191392240672030925811.73491475.12
31.1873017242024222829927815.96379676.96
401.1672916691733452829827916.573770102.71
Sand90010.4378715213071737126327011.22540955.49
20.5073916511832309324126013.55547468.65
30.486821787395378924422517.72672281.59
400.3774816321732509024327115.87644983.71
120010.867071755192679423727013.08586462.71
20.8376815792211347326127612.11584463.72
30.849601110961052332827516.27544170.59
400.8172916842402116826527514.31687874.78
150011.1668218411922599923326314.16590961.06
21.176701899962509423726512.78611761.33
31.178261418144969423927011.77624163.60
401.2088912341733649123727113.36605264.94
Table 4. Contribution rate and the cumulative contribution rate of each factor.
GravelSand
Parametersγ (%)γ′ (%)Parametersγ (%)γ′ (%)
Initial velocity31.6431.64Initial velocity31.0031.00
Displacement of wheel loader in insertion phase27.0458.68Displacement of wheel loader in insertion phase24.4255.42
Operation time15.3674.03Shoveling weight13.9969.41
Shoveling weight15.3589.39Operation time13.7983.20
Displacement of wheel loader in scooping phase6.5695.95Displacement of wheel loader in scooping phase10.7093.89
Displacement of wheel loader in stopping phase2.6598.60Displacement of wheel loader in stopping phase5.6499.53
Displacement of wheel loader in lifting phase1.1399.73Displacement of wheel loader in lifting phase0.2999.82
Displacement of lift cylinder in scooping phase0.2498.97Displacement of lift cylinder in scooping phase0.1698.99
Displacement of lift cylinder in lifting phase0.0299.98Displacement of lift cylinder in lifting phase0.0199.99
Displacement of tilt cylinder in scooping phase0.01100.00Displacement of tilt cylinder in scooping phase0.01100.00
Table 5. Grey relation coefficients.
Type of PileInitial
Velocity
Displacement of Wheel Loader in Insertion PhaseShoveling WeightOperation TimeDisplacement of Wheel Loader in Scooping Phase
Gravel0.792 0.782 0.834 0.789 0.779
Sand0.762 0.795 0.894 0.846 0.822
Table 6. Fuel consumption model evaluation indicators.
Type of PileARE (%)RMSER2
Gravel4.915.910.9764
Sand3.493.080.9494
Table 7. Optimization intervals for each parameter.
ParametersIntervalGravel ModelSand Model
900 RPM1200 RPM1500 RPM900 RPM1200 RPM1500 RPM
Initial velocity
(m·s−1)
Upper limit0.60.951.30.60.951.3
Lower limit0.30.651.050.30.651.05
Displacement of wheel loader in insertion phase (mm)Upper limit1000
Lower limit600
Shoveling weight (kg)Upper limit552655455558729474417520
Lower limit445946093913540057735519
Operation time (s)Upper limit252321252623
Lower limit121210111210
Displacement of wheel loader in scooping phase (mm)Calculated according to Equation (2)
Table 8. Optimization results.
Type of PileEngine Speed (RPM)Initial
Velocity
(m·s−1)
Displacement of Wheel Loader in Insertion Phase (mm)Displacement of Wheel Loader in Scooping Phase (mm)Fuel
Consumption (mL)
Gravel9000.59704177855.05
12000.86686184359.58
15001.16698179948.59
Sand9000.48839127248.12
12000.79749152048.16
15001.25733156956.87
Table 9. Validation experiment shoveling operation parameters and fuel consumption.
Type of PileEngine Speed (RPM)NumberInitial
Velocity (m·s−1)
Displacement of Wheel Loader in Insertion Phase (mm)Displacement of Wheel loader In Scooping Phase (mm)Operation Time (s)Shoveling Weight (kg)Fuel
Consumption (mL)
Average Fuel Consumption (mL)
Gravel90010.56719169010.99449253.50
20.53713171011.79460251.9154.50
30.49722170311.20457058.09
120010.83702180412.02464167.64
20.81704178512.49471358.6861.97
30.81694174812.55459659.60
150011.1472617378.01438845.09
21.12704184410.56441447.3044.59
31.0972517457.33377041.38
Sand90010.52826143210.52423249.24
20.4785513429.85535750.2349.98
30.4981914369.90520750.48
120010.8174716689.31496649.78
20.77758160110.10455047.5450.00
30.87730164310.39484352.69
150011.14728159410.65651456.50
21.14739160311.12644264.6457.42
31.15749148811.37475851.11
Table 10. Fuel consumption by manually controlled shoveling.
DriverShoveling OperationFuel ConsumptionAverage Fuel
Consumption
Driver AShoveling gravel71.6764.0692.3172.5675.3871.8963.6071.7276.1266.7072.60
Shoveling sand72.6562.3672.0764.7768.6692.6376.1072.3865.5166.1771.33
Driver BShoveling gravel84.8565.7274.5677.7672.1674.0065.7368.7796.2278.5375.83
Shoveling sand61.1757.7667.2861.0574.3466.5769.0074.2668.2374.0967.38
Disclaimer/Publisher’s Note: The statements, opinions and data contained in all publications are solely those of the individual author(s) and contributor(s) and not of MDPI and/or the editor(s). MDPI and/or the editor(s) disclaim responsibility for any injury to people or property resulting from any ideas, methods, instructions or products referred to in the content.