
Double-Skin Façades for Building Retrofitting and Climate Change: A Case Study in Central Italy


Abstract
:Featured Application
Abstract
1. Introduction
2. Double-Skin Façades for New and Retrofitted Buildings
- The ventilation mode (natural, mechanical and hybrid ventilation).
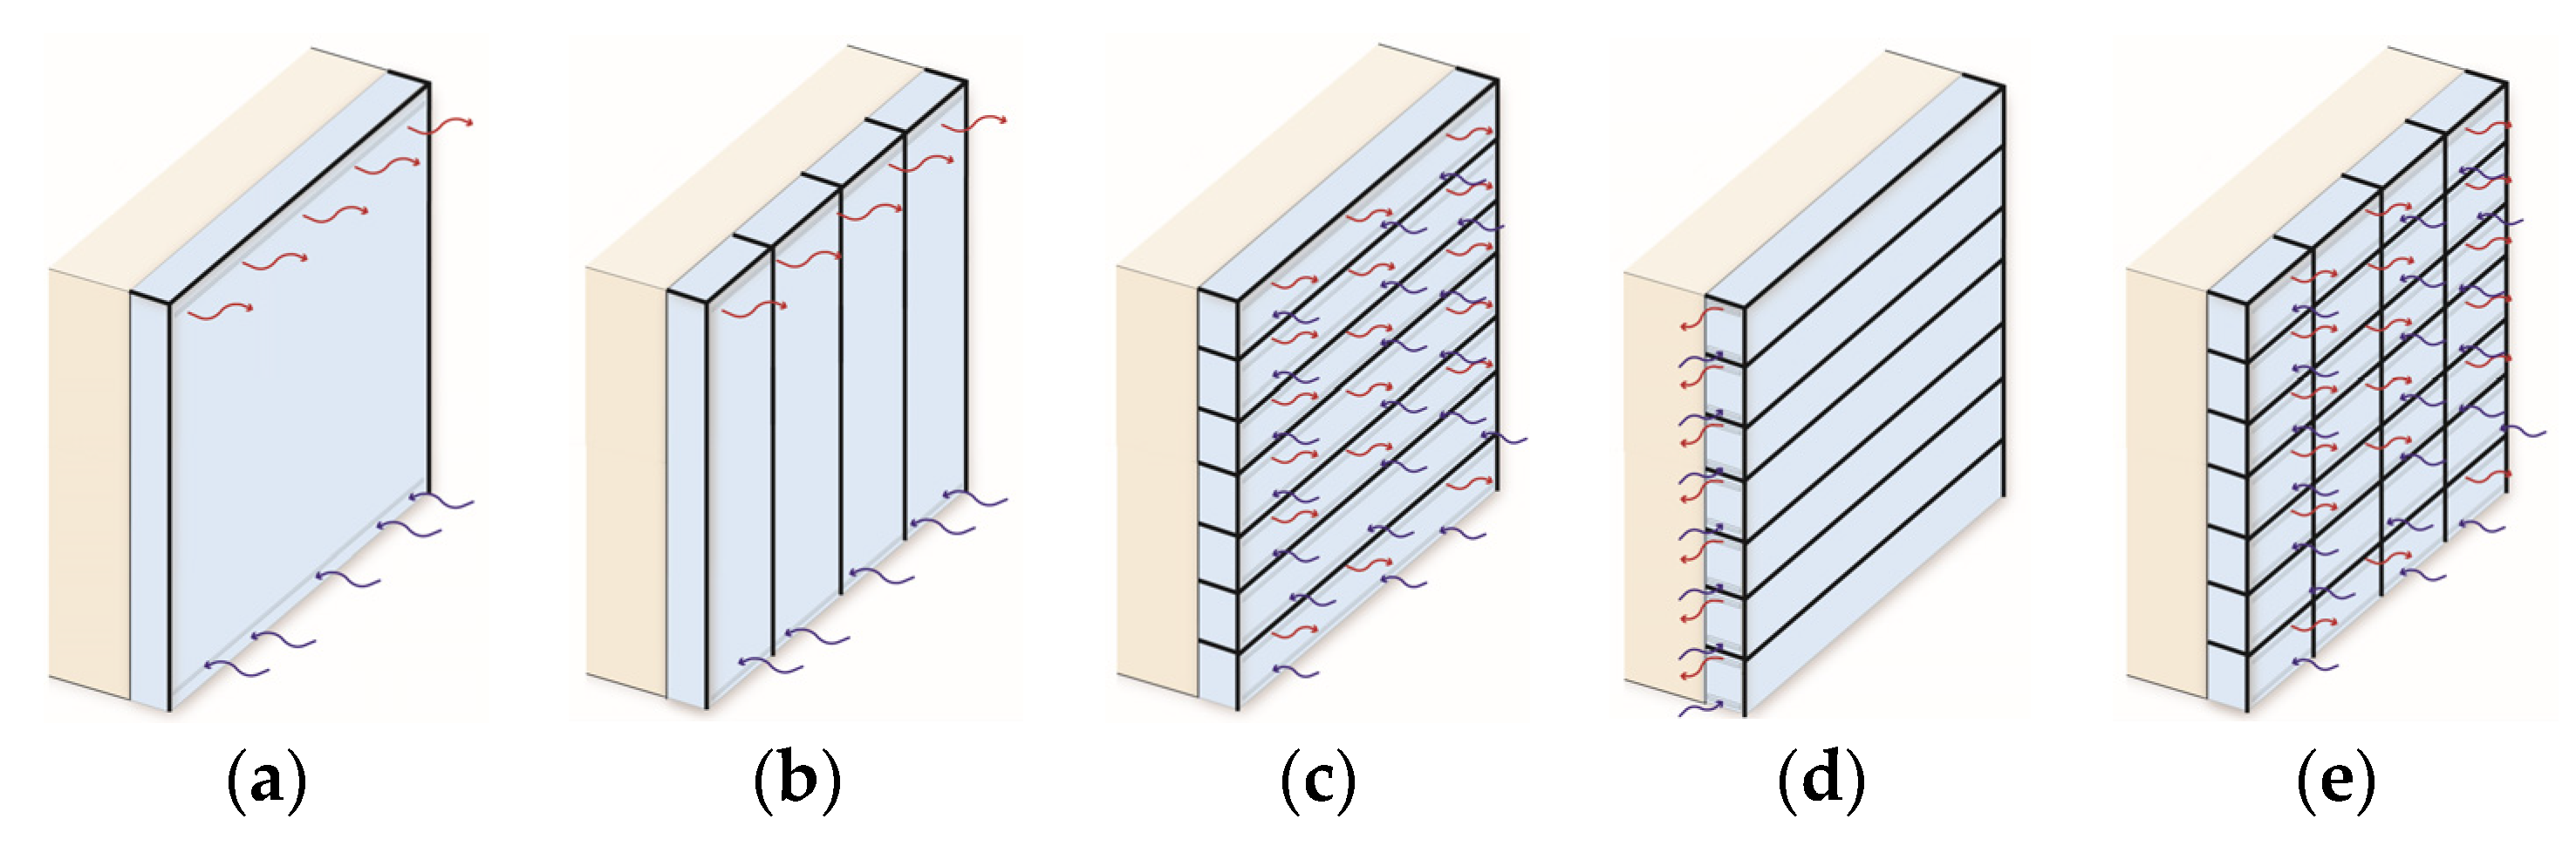
- The compartmentalisation of the façade (Multi-Storey, Shaft-Box, Corridor and Box-Window DSF).
- The airflow type (Exhaust Air, Supply Air, Static Air Buffer, External Air Curtain, Internal Air Curtain.
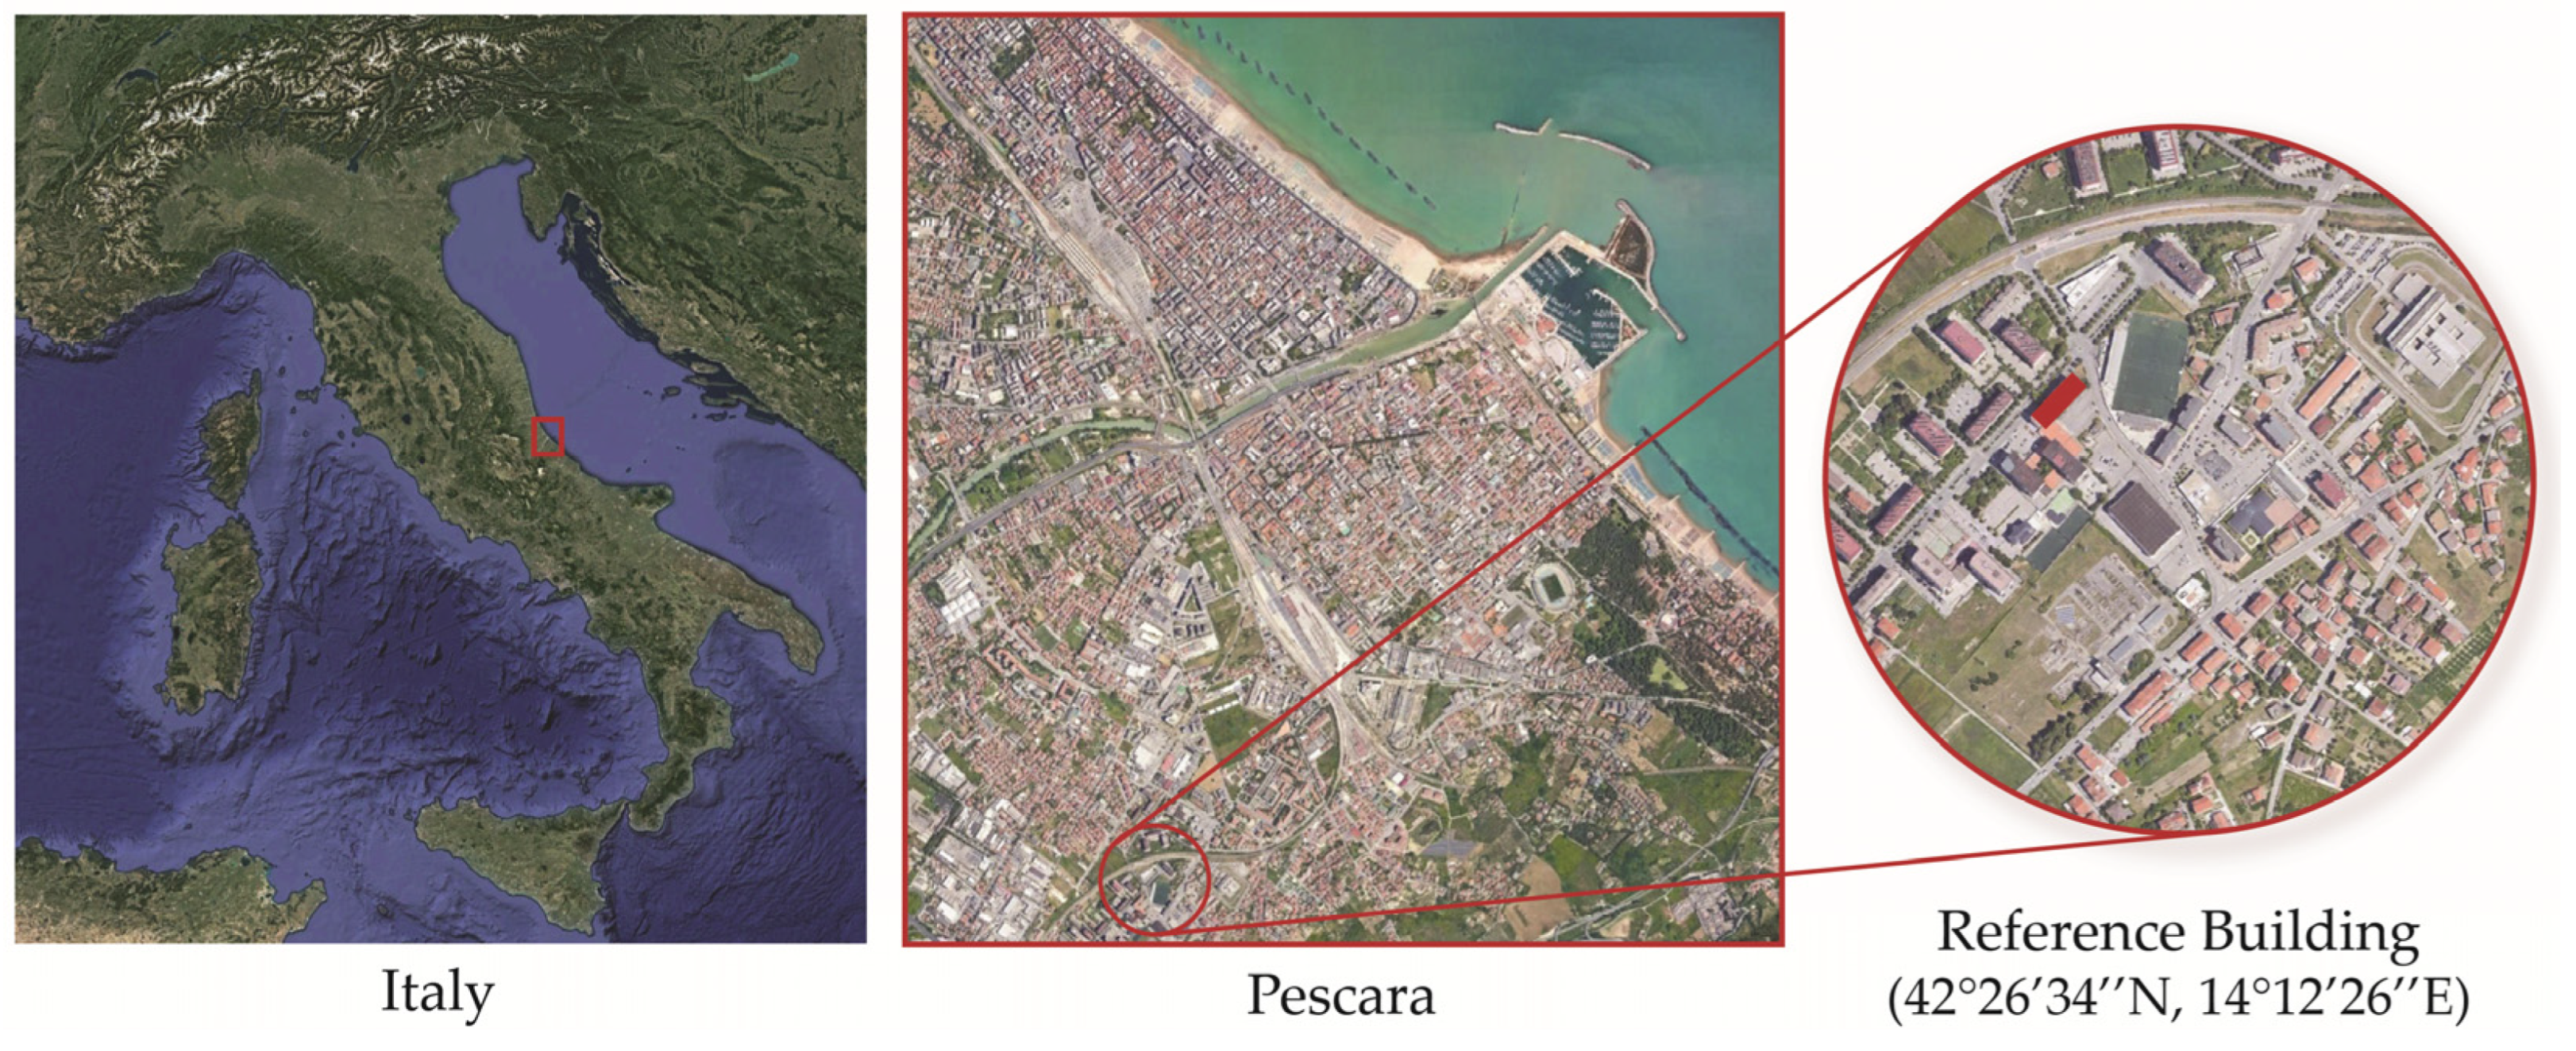
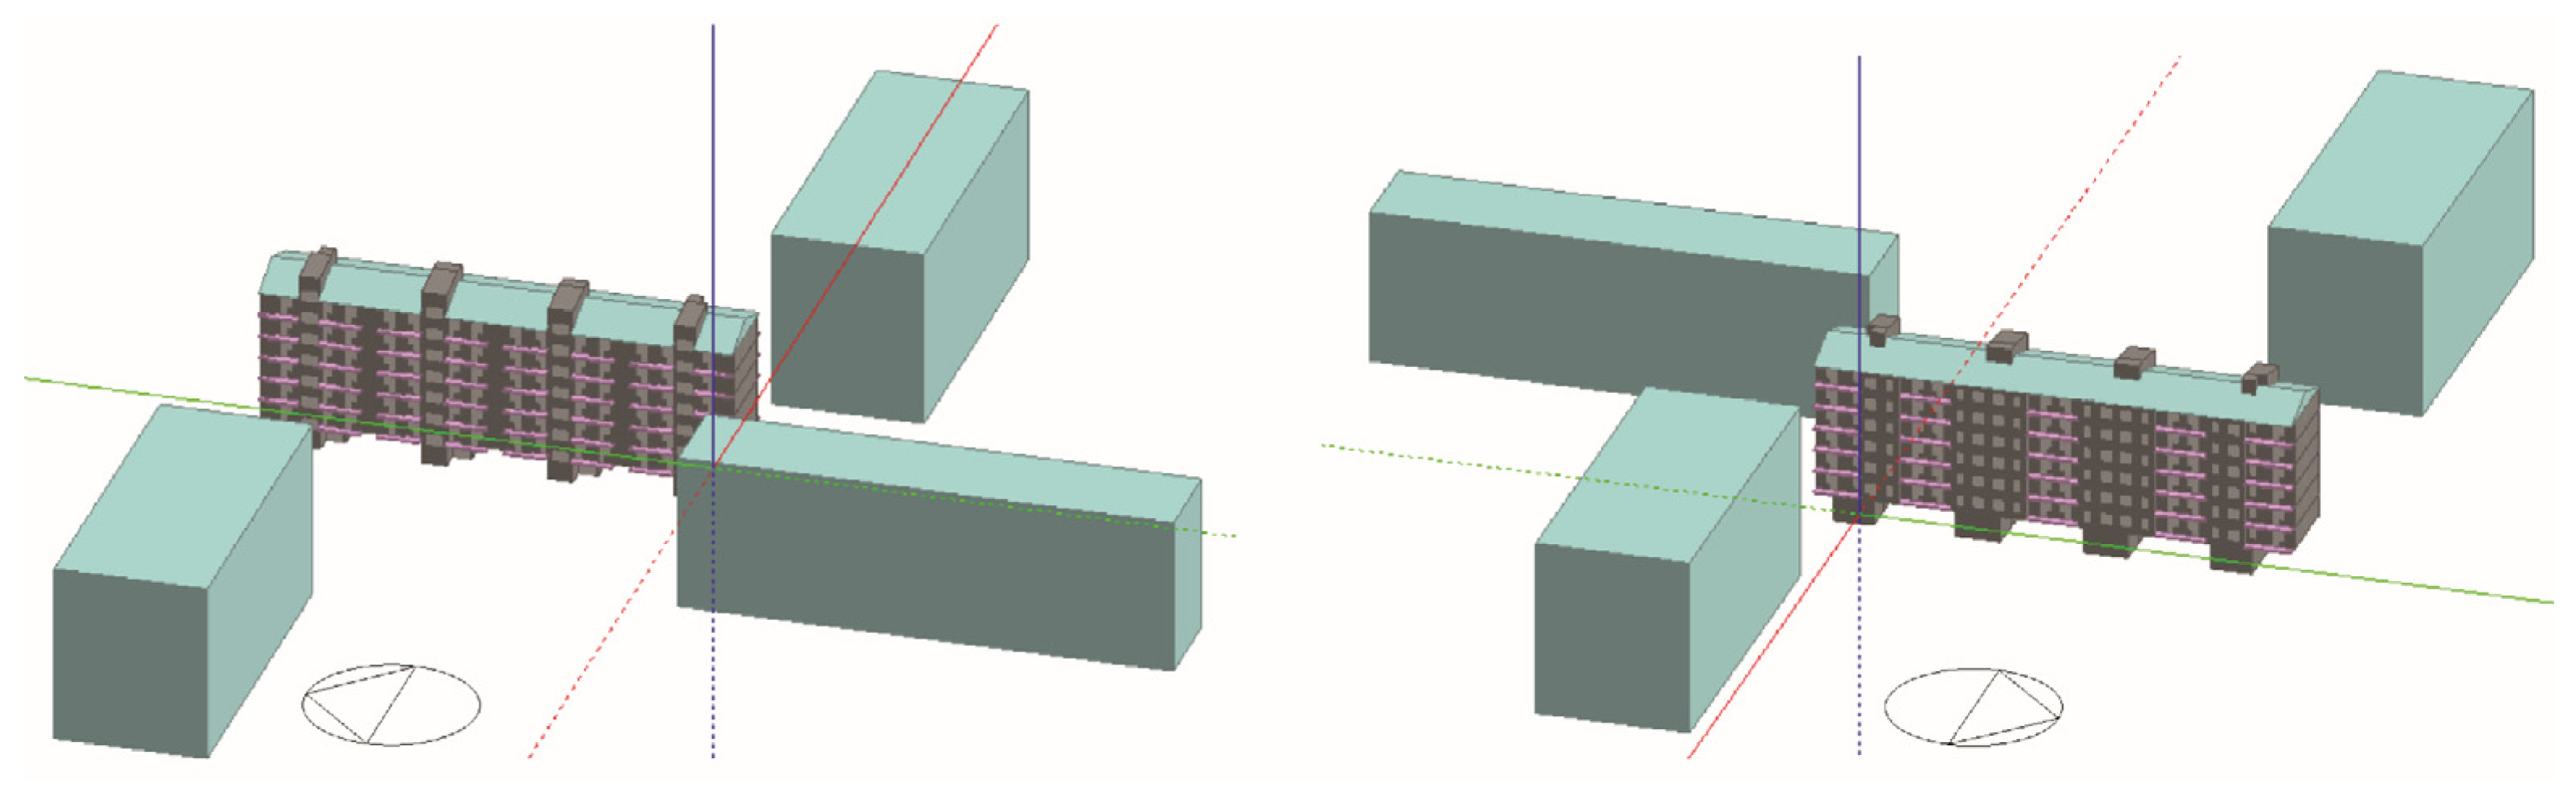
3. The Case Study
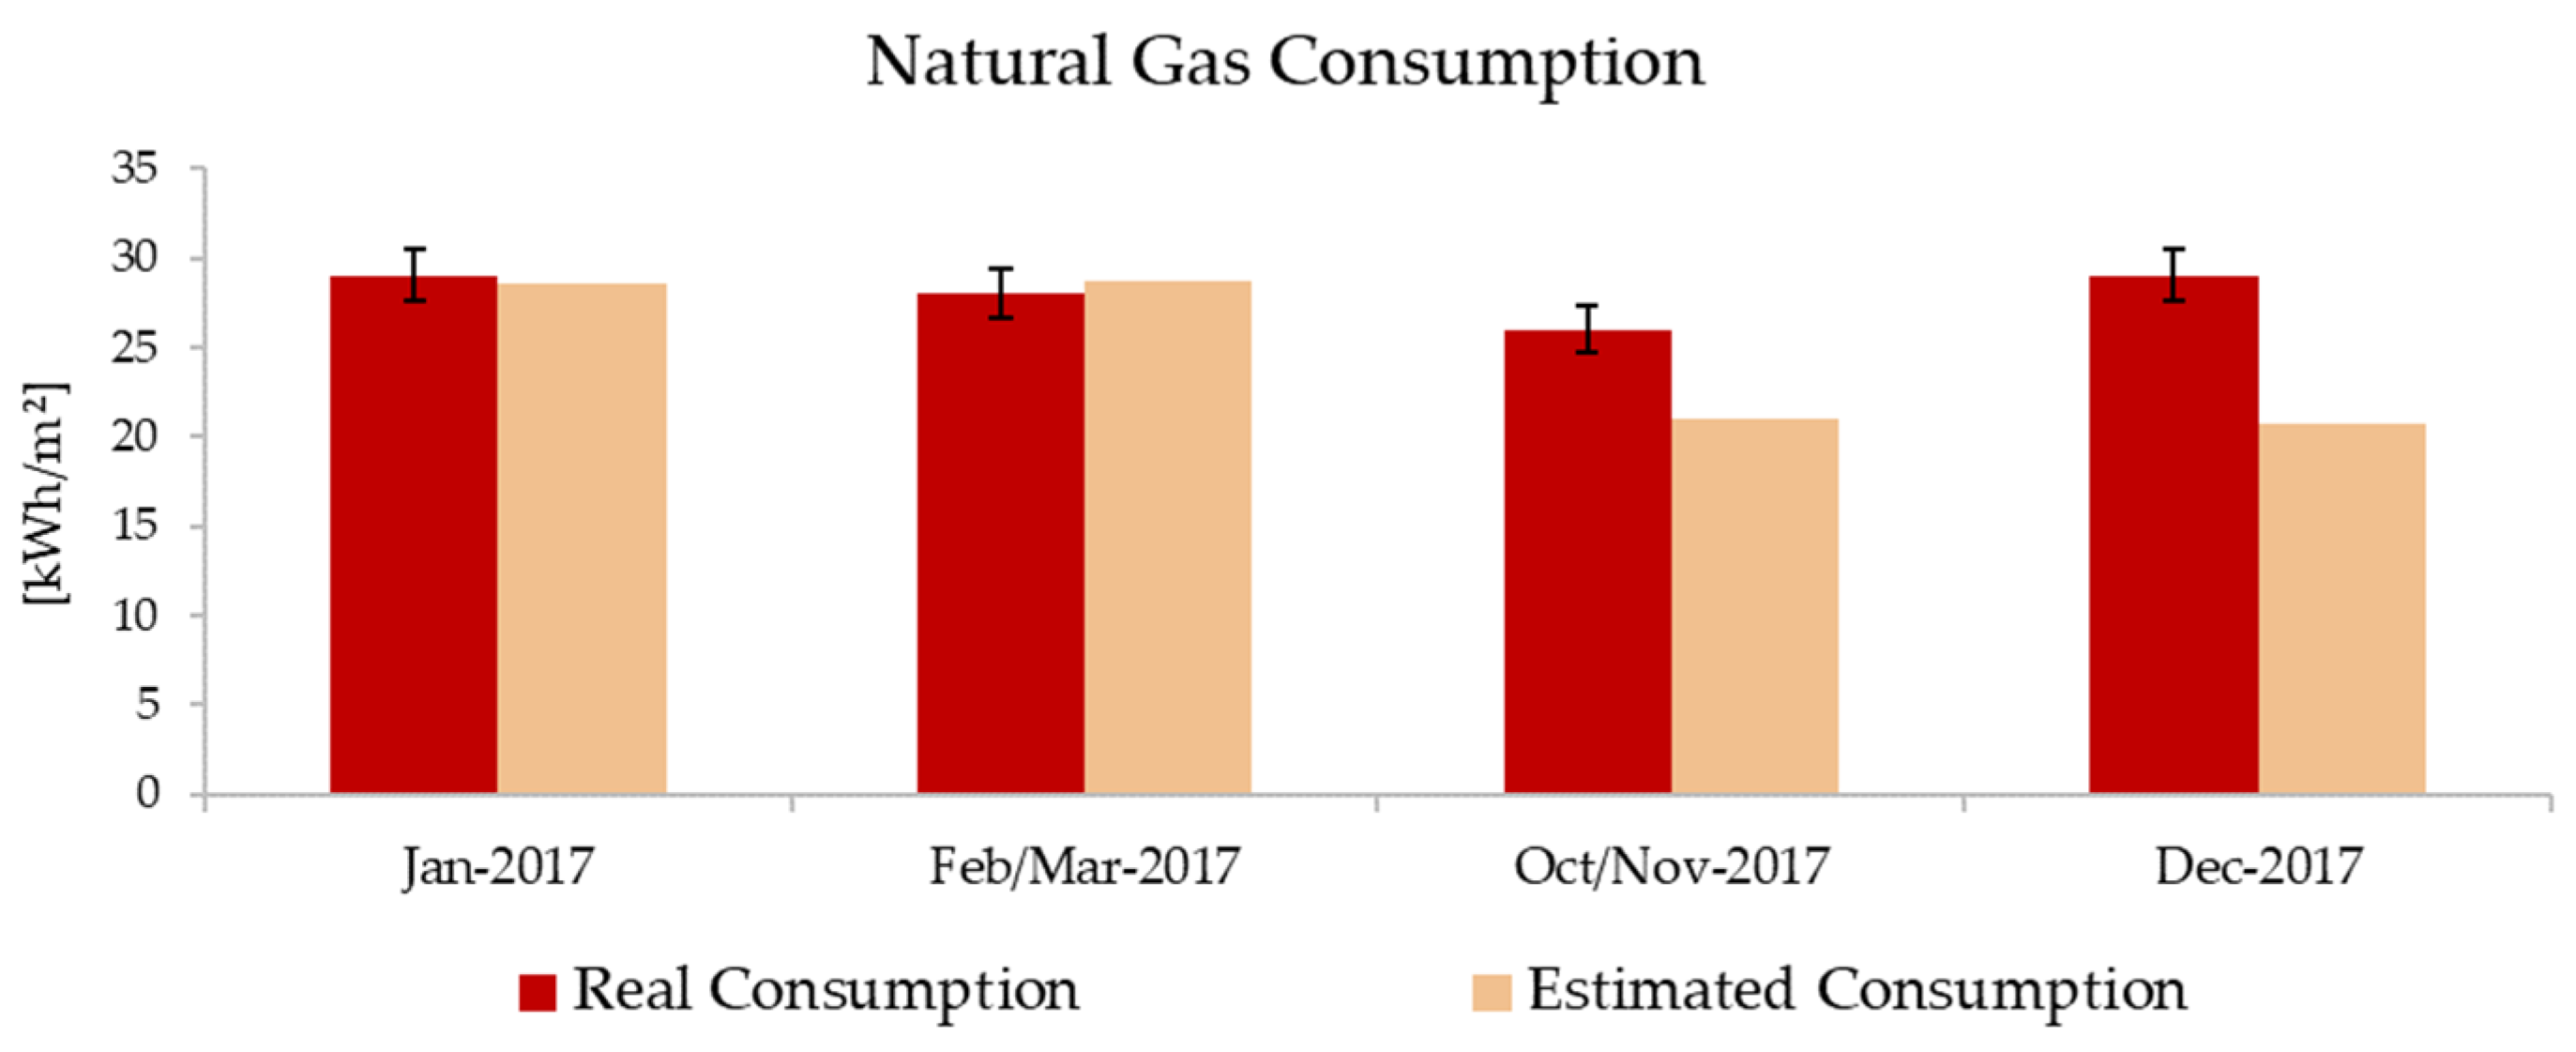
DSF Energy Modelling
4. Dynamic Energy Simulations under Future Climate Conditions
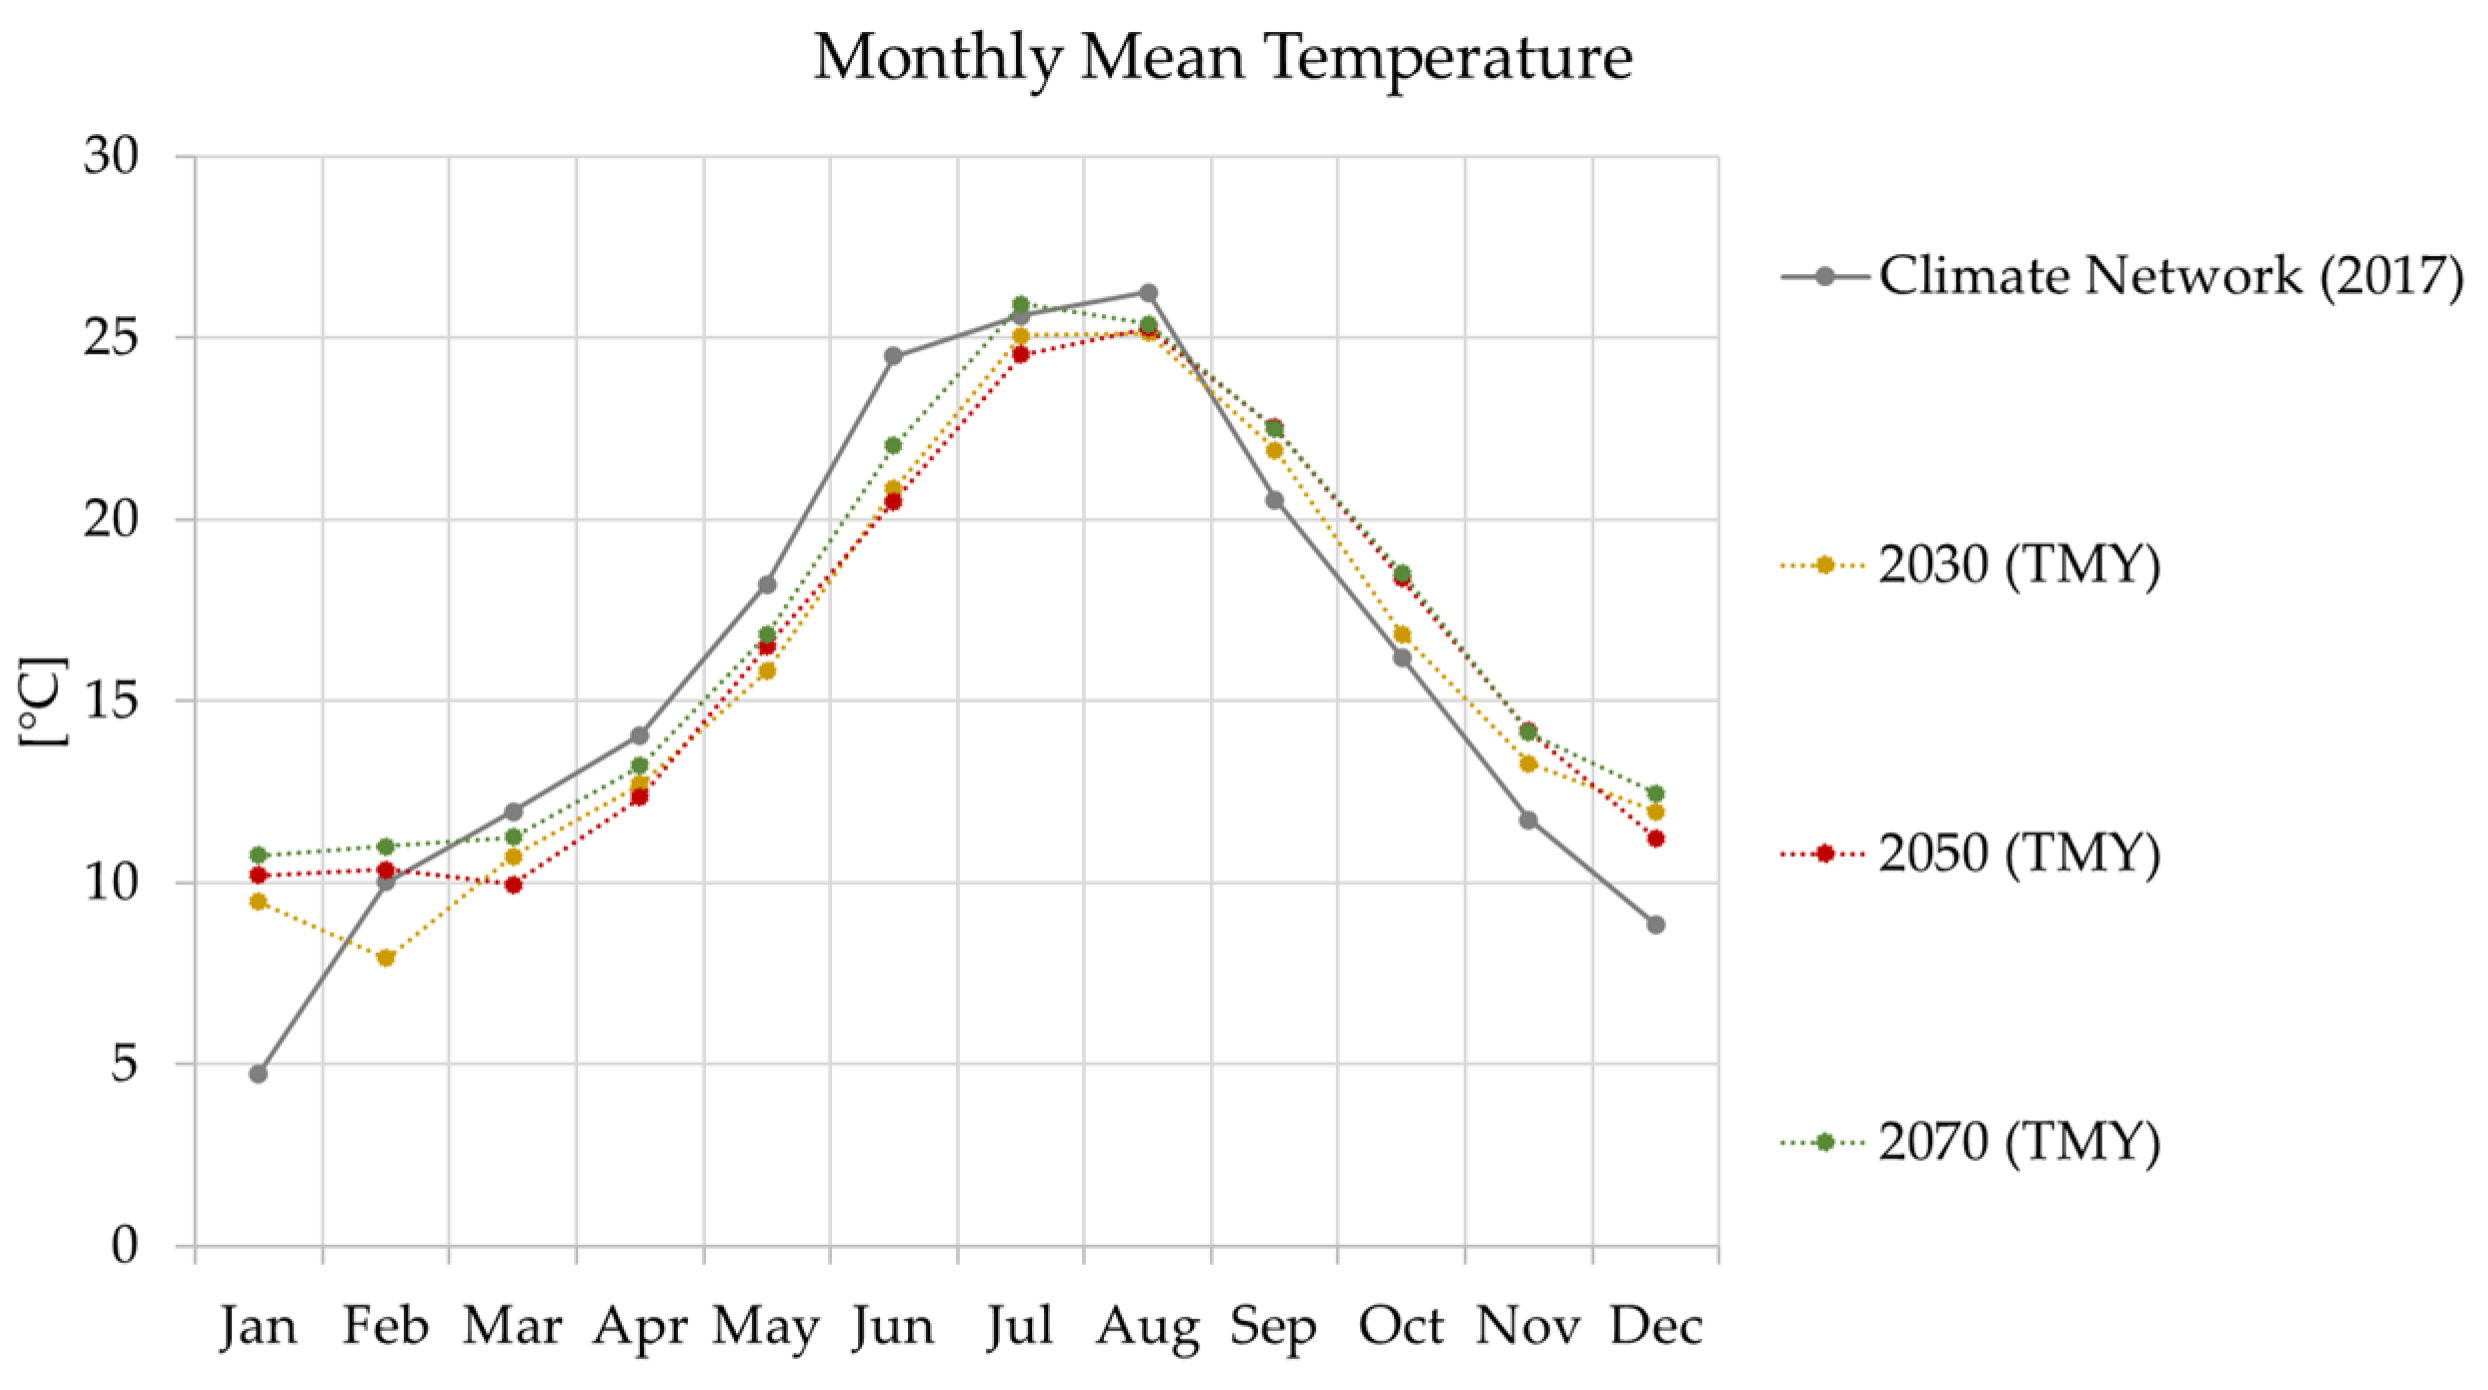
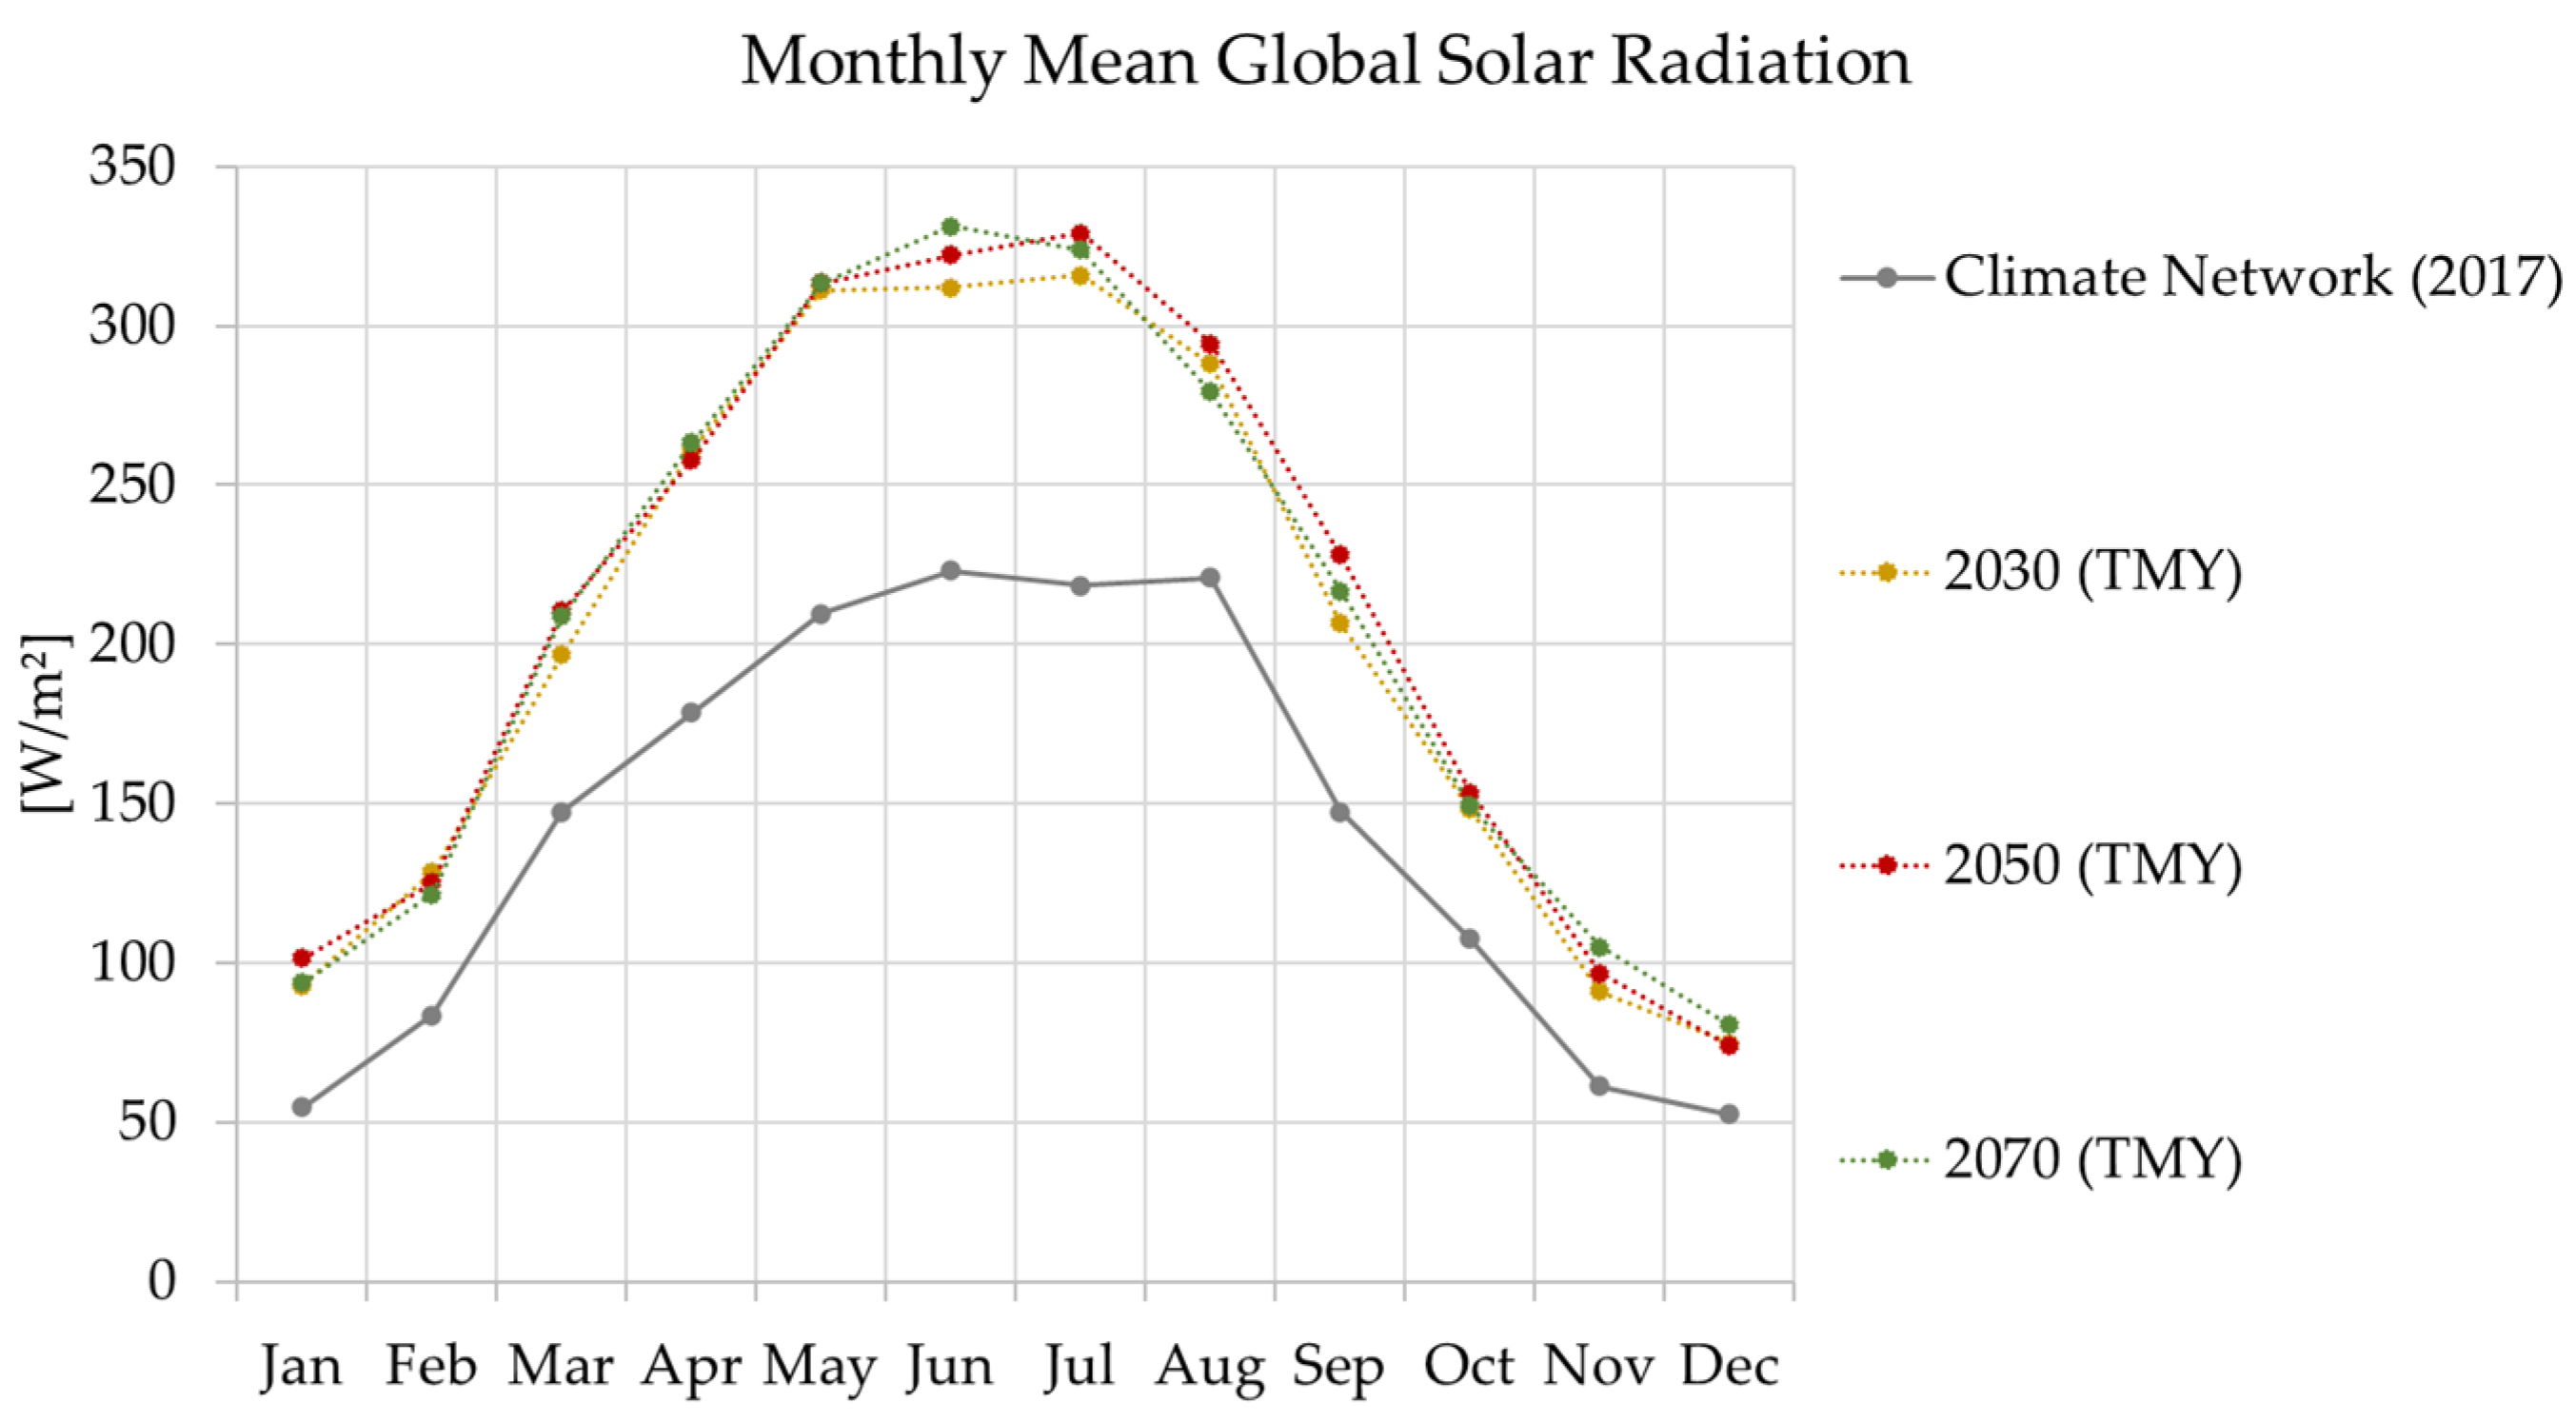
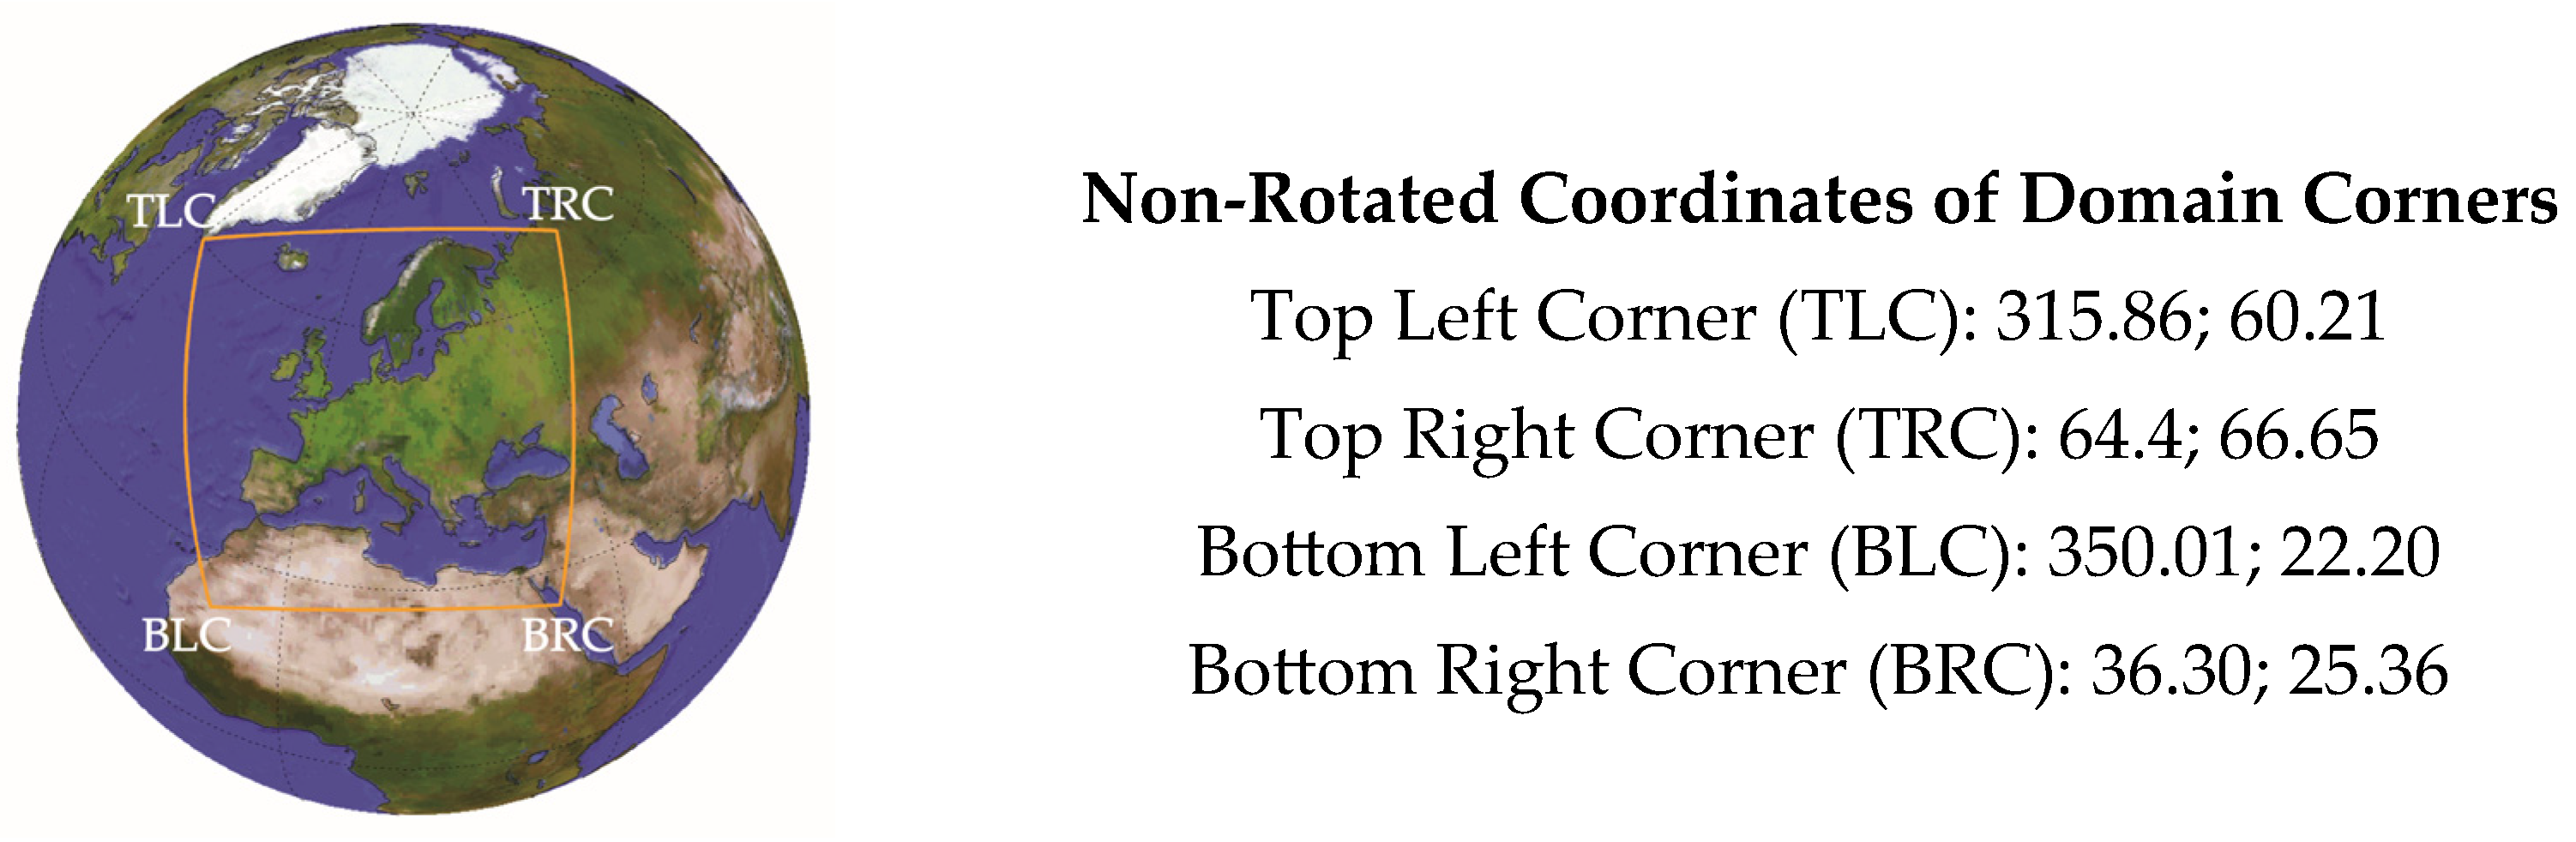
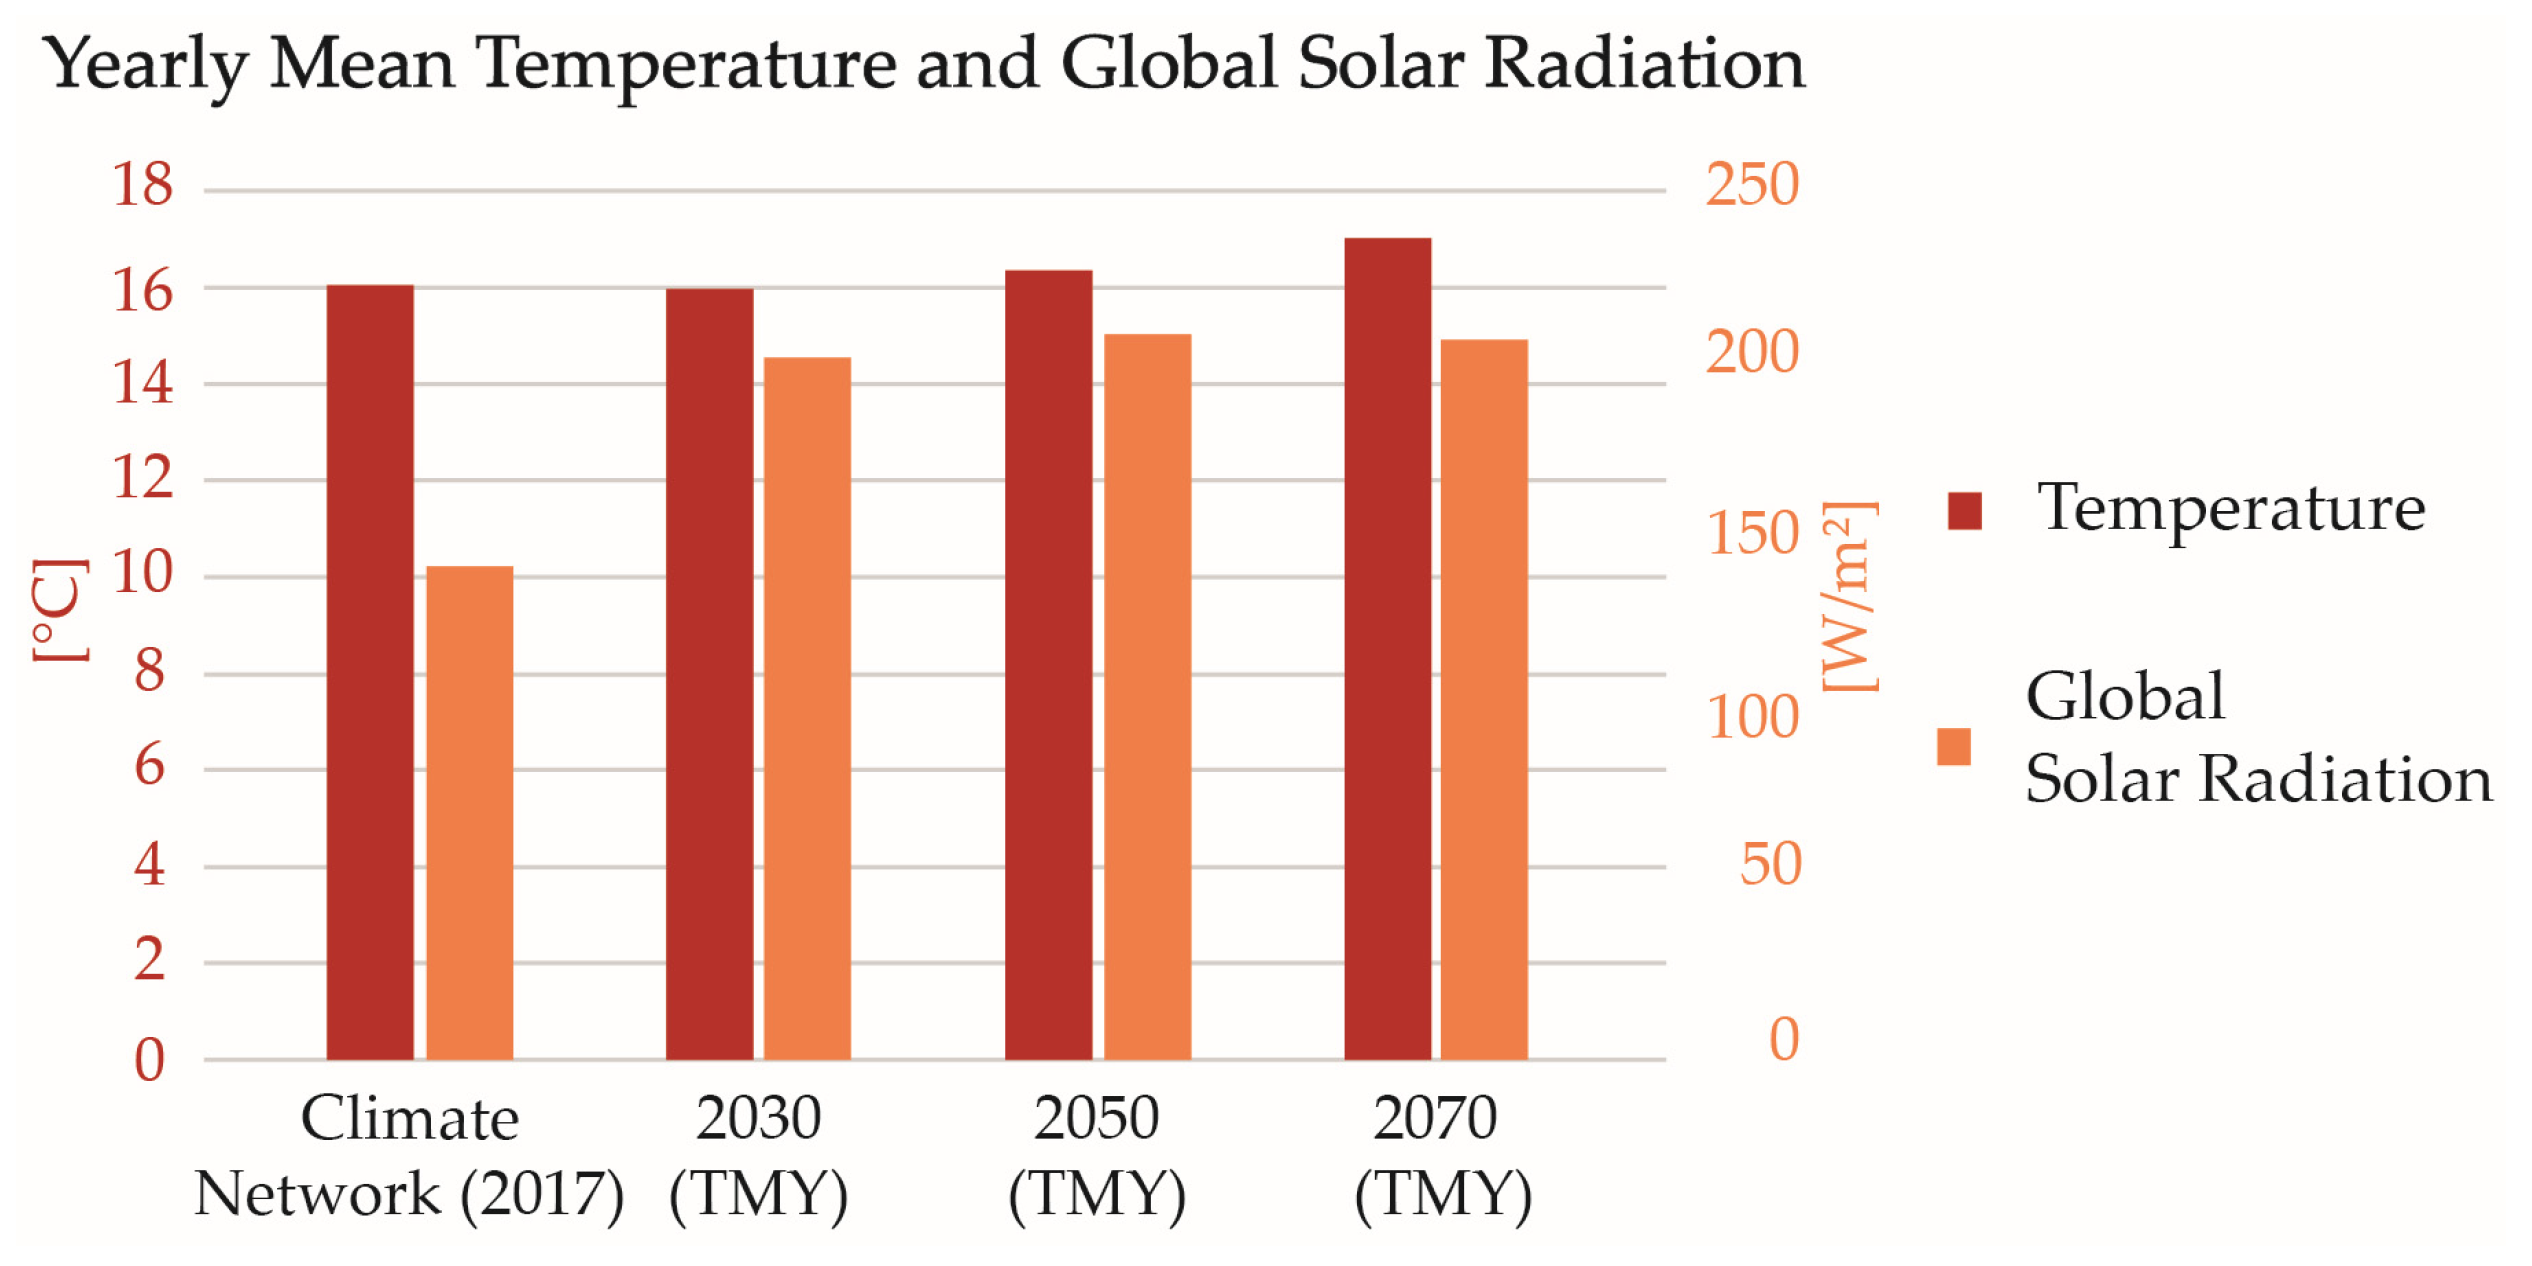
4.1. Generation of Future Climatic Files for Dynamic Energy Simulations
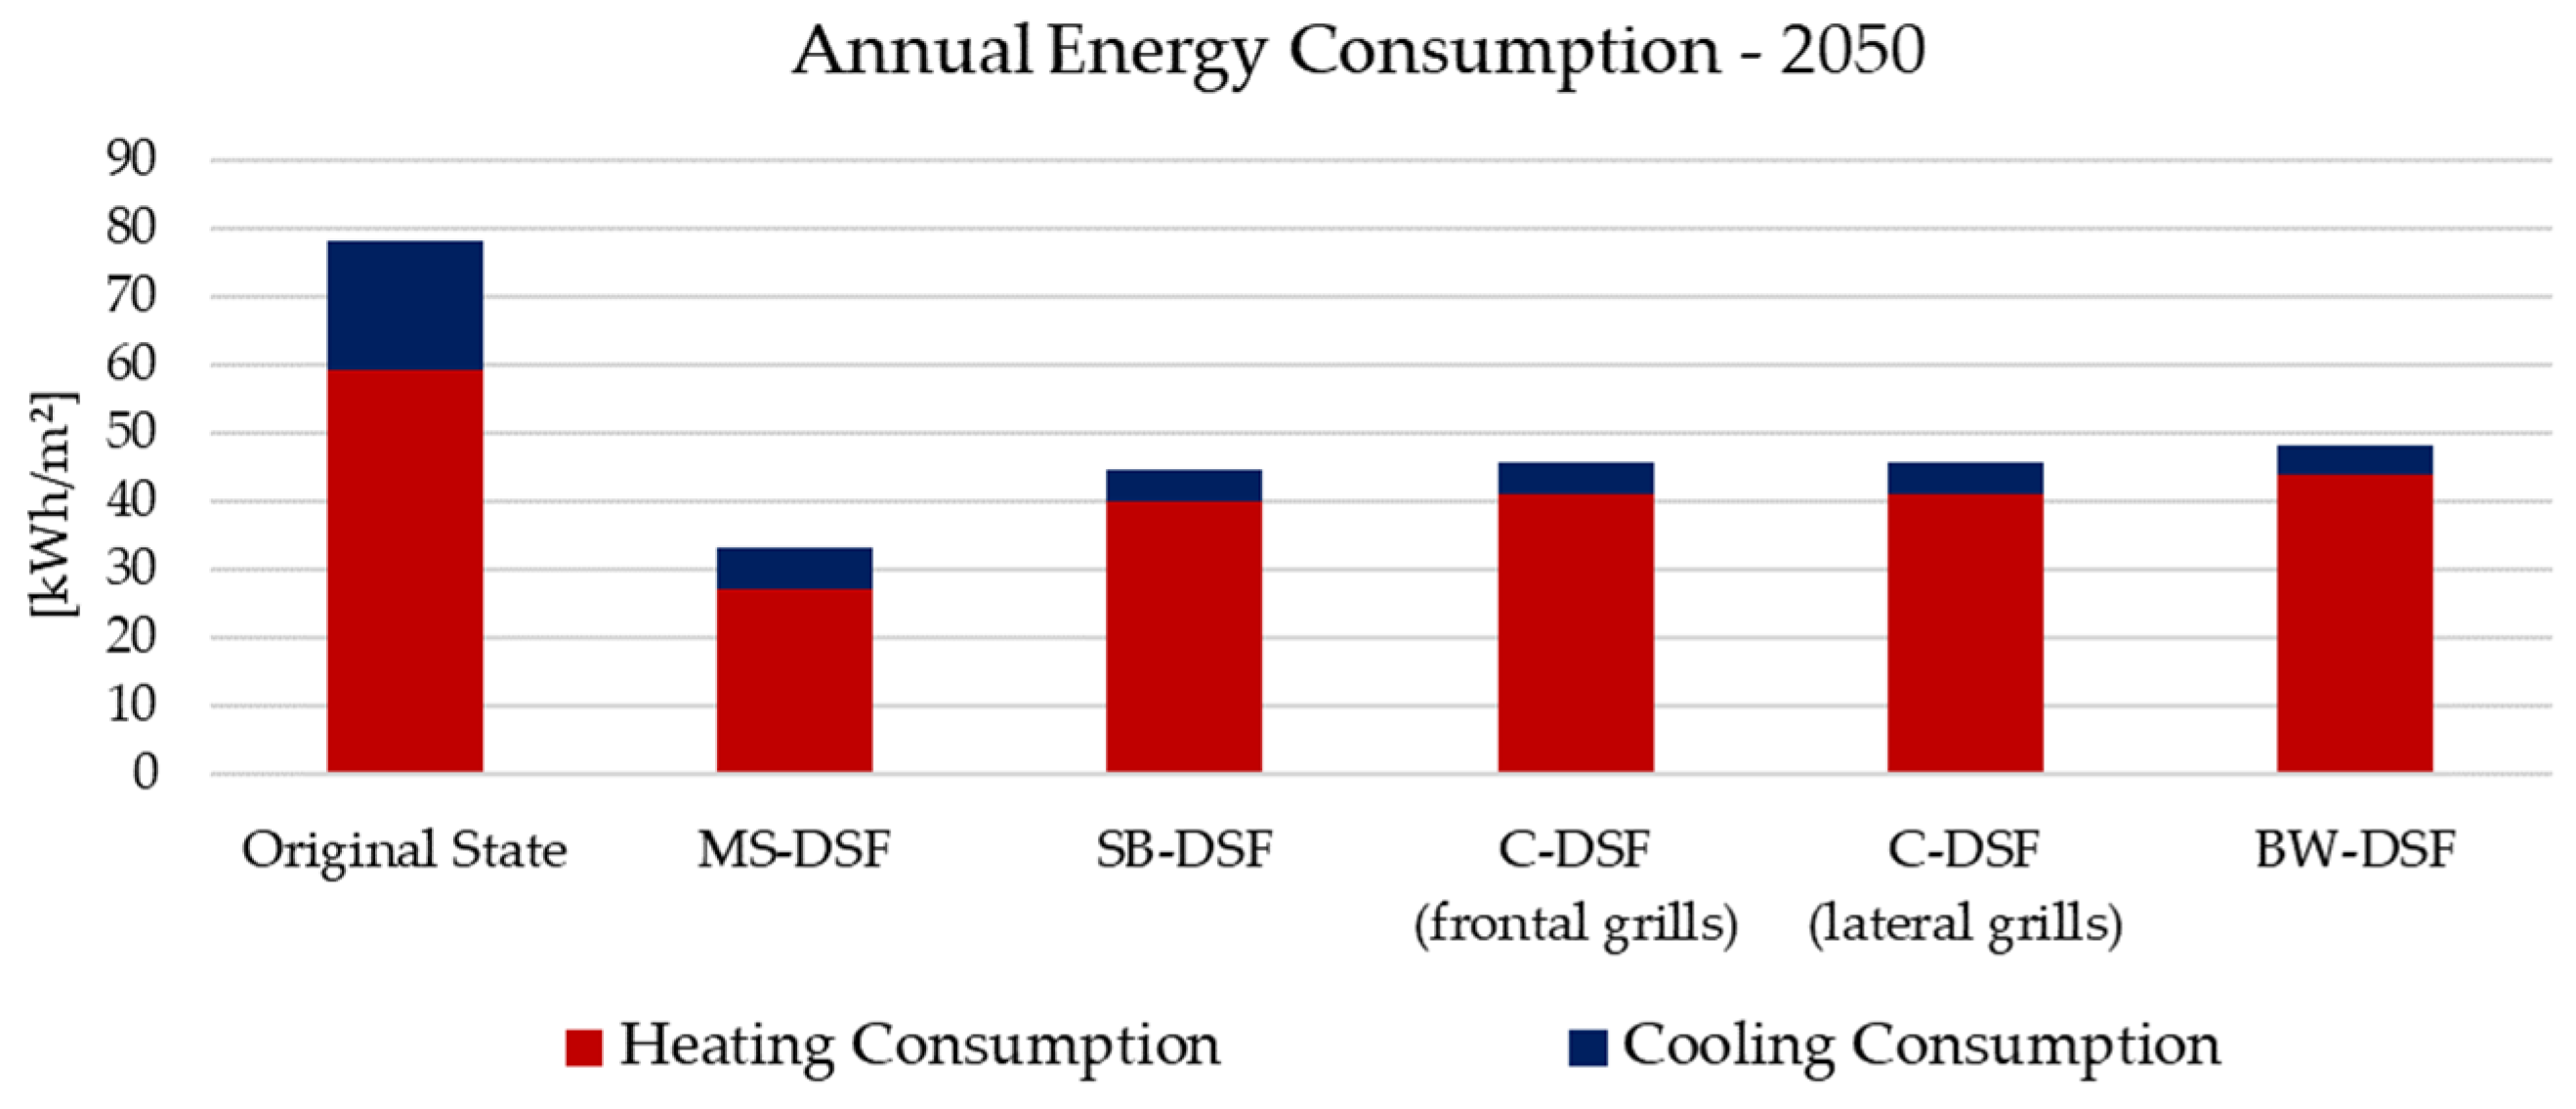
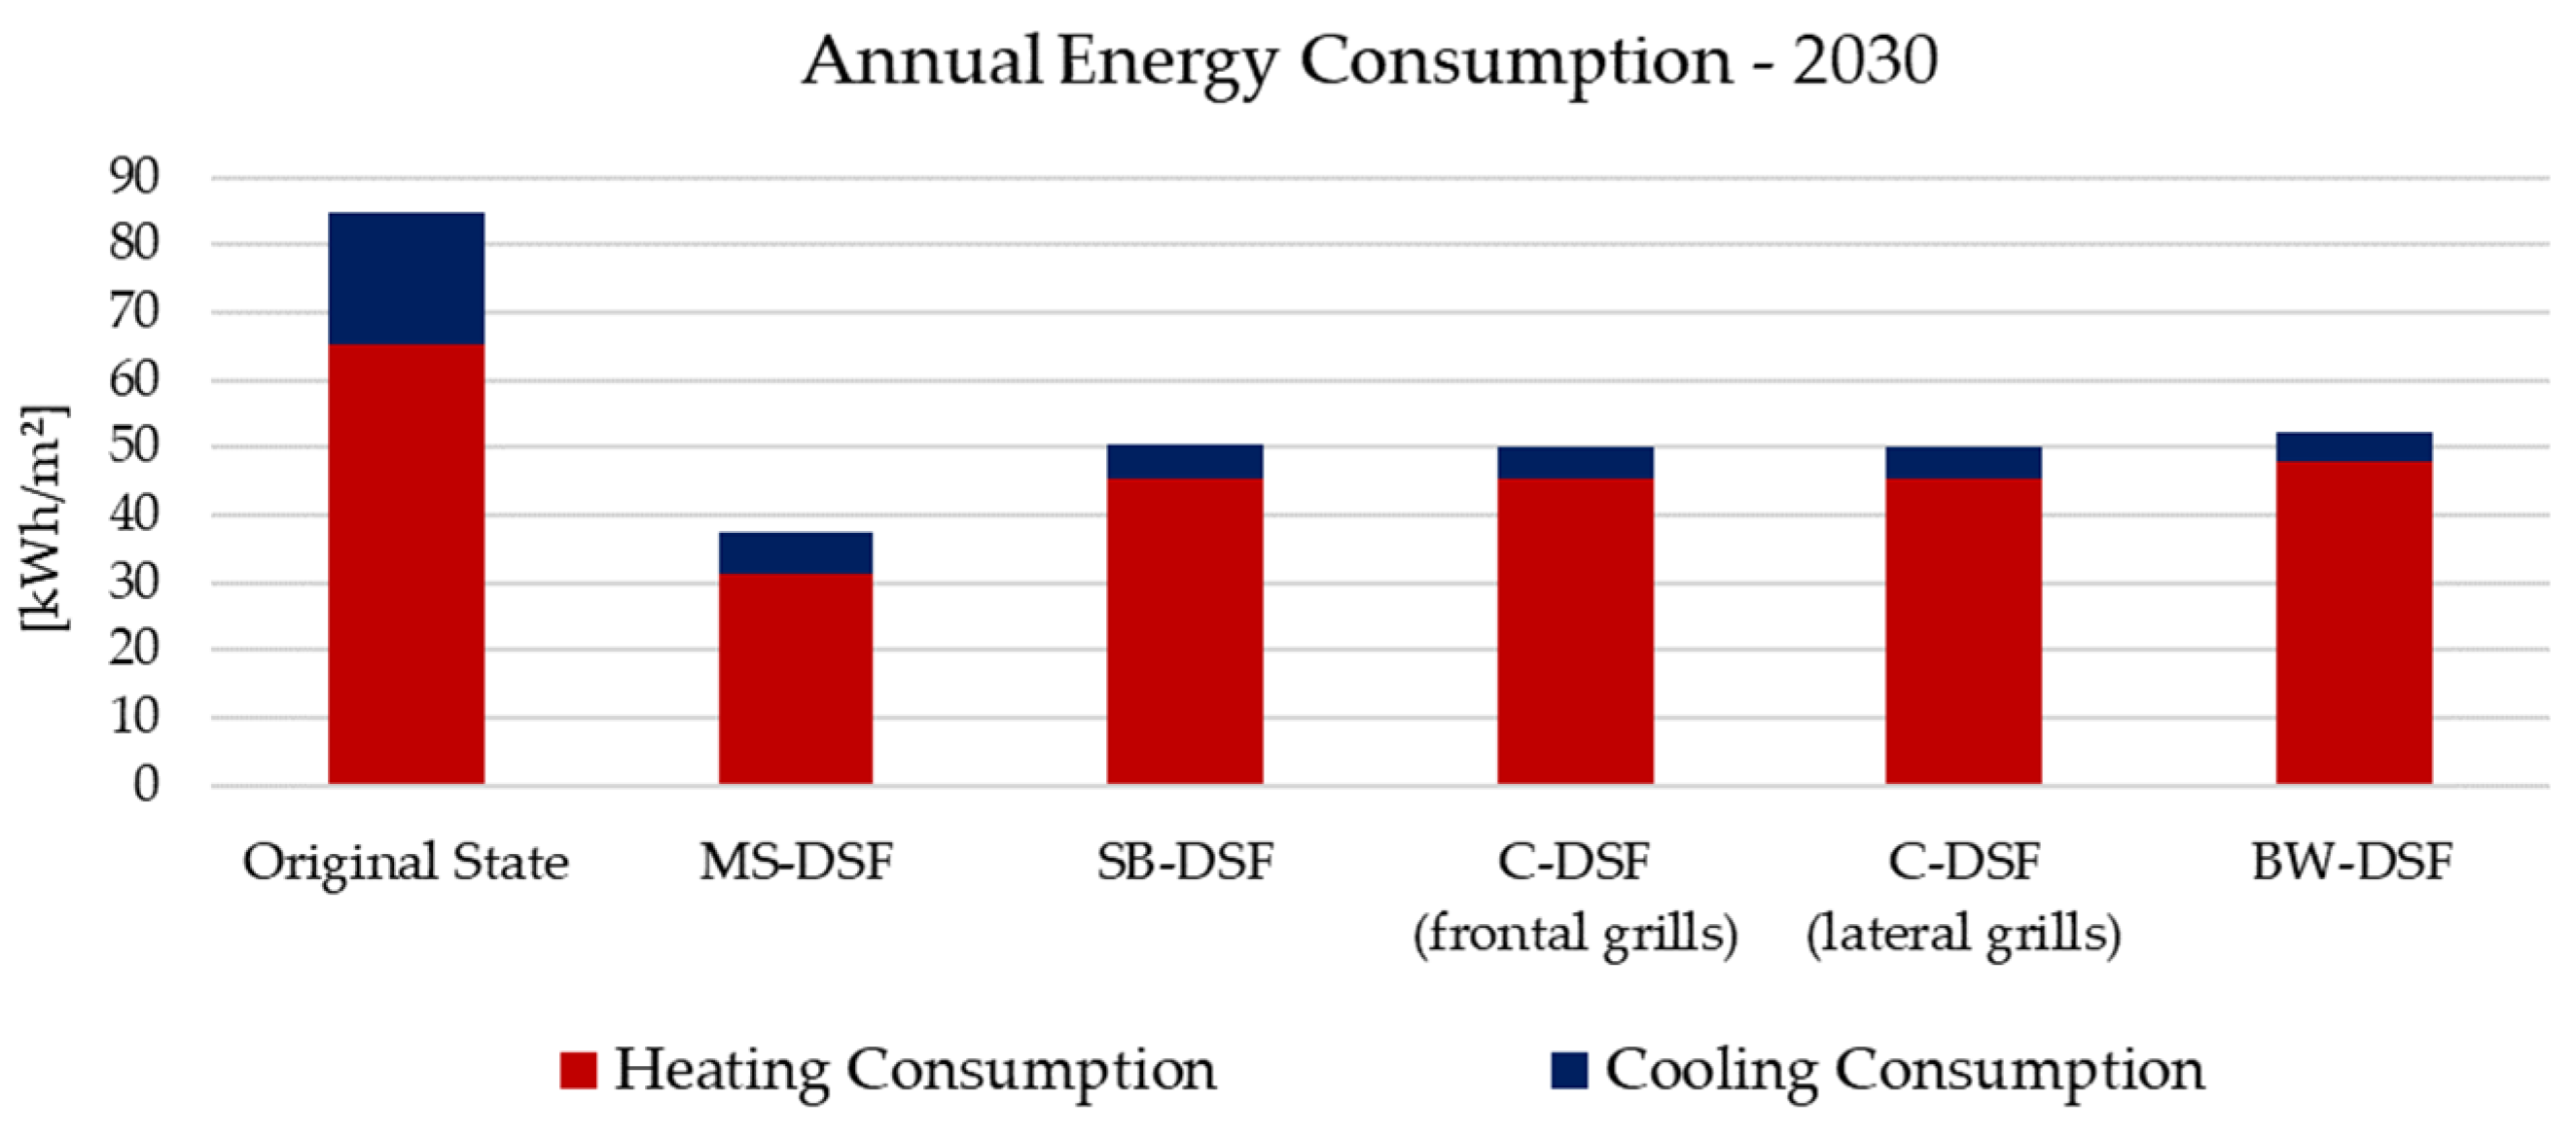
4.2. Building Energy Modelling under Future Climate Conditions


| Configuration | Mean Temperature | Minimum Temperature | Maximum Temperature |
|---|---|---|---|
| Original State | 26.69 | 24.81 | 29.04 |
| MS-DSF | 26.72 (+0.1%) | 25.44 (+2.5%) | 28.00 (−3.6%) |
| SB-DSF | 26.73 (+0.1%) | 25.47(+2.7%) | 27.93 (−3.8%) |
| C-DSF (frontal grills) | 26.74 (+0.2%) | 25.48(+2.7%) | 28.02 (−3.5%) |
| C-DSF (lateral grills) | 26.75 (+0.2%) | 25.48 (+2.7%) | 28.02 (−3.5%) |
| BW-DSF | 26.76 (+0.3%) | 25.52(+2.9%) | 27.95 (−3.8%) |

| Configuration | Mean Temperature | Minimum Temperature | Maximum Temperature |
|---|---|---|---|
| Original State | 26.94 | 26.02 | 28.39 |
| MS-DSF | 27.07 (+0.5%) | 26.54 (+2.0%) | 27.78 (−2.1%) |
| SB-DSF | 27.05 (+0.4%) | 26.54 (+2.0%) | 27.73 (−2.3%) |
| C-DSF (frontal grills) | 27.08 (+0.5%) | 26.58 (+2.2%) | 27.79 (−2.1%) |
| C-DSF (lateral grills) | 27.08 (+0.5%) | 26.57 (+2.1%) | 27.79 (−2.1%) |
| BW-DSF | 27.06 (+0.4%) | 26.57 (+2.1%) | 27.74 (−2.3%) |

| Configuration | Mean Temperature | Minimum Temperature | Maximum Temperature |
|---|---|---|---|
| Original State | 26.36 | 24.53 | 28.37 |
| MS-DSF | 26.41 (+0.2%) | 25.05 (+2.1%) | 27.82 (−1.9%) |
| SB-DSF | 26.41 (+0.2%) | 25.07 (+2.2%) | 27.75 (−2.2%) |
| C-DSF (frontal grills) | 26.43 (+0.3%) | 25.06 (+2.2%) | 27.82 (−1.9%) |
| C-DSF (lateral grills) | 26.42 (+0.2%) | 25.05 (+2.1%) | 27.81 (−2.0%) |
| BW-DSF | 26.44 (+0.3%) | 25.11 (+2.4%) | 27.76 (−2.2%) |

| Configuration | Mean Temperature | Minimum Temperature | Maximum Temperature |
|---|---|---|---|
| Original State | 20.22 | 18.68 | 24.62 |
| MS-DSF | 20.50 (+1.4%) | 18.92 (+1.3%) | 23.83 (−3.2%) |
| SB-DSF | 20.05 (−0.8%) | 18.86 (+1.0%) | 21.67 (−12.0%) |
| C-DSF | 20.21 (+0.0%) | 18.93 (+1.3%) | 21.86 (−11.2%) |
| BW-DSF | 20.05 (−0.8%) | 18.84 (+0.9%) | 21.59 (−12.3%) |
| Configuration | Mean Temperature | Minimum Temperature | Maximum Temperature |
|---|---|---|---|
| Original State | 20.13 | 19.15 | 20.92 |
| MS-DSF | 21.72 (+7.9%) | 19.88 (+3.8%) | 25.61 (+22.4%) |
| SB-DSF | 20.56 (+2.1%) | 19.45 (+1.6%) | 22.11 (+5.7%) |
| C-DSF | 20.86 (+3.6%) | 19.65 (+2.6%) | 22.65 (+8.3%) |
| BW-DSF | 20.59 (+2.3%) | 19.49 (+1.8%) | 21.98 (+5.1%) |
| Configuration | Mean Temperature | Minimum Temperature | Maximum Temperature |
|---|---|---|---|
| Original State | 20.48 | 18.94 | 25.67 |
| MS-DSF | 20.74 (+1.3%) | 19.14 (+1.1%) | 24.27 (−5.5%) |
| SB-DSF | 20.17 (−1.5%) | 19.01 (+0.4%) | 27.72 (+8.0%) |
| C-DSF | 20.36 (−0.6%) | 19.12 (+1.0%) | 21.95 (−14.5%) |
| BW-DSF | 20.18 (−1.5%) | 19.01 (+0.4%) | 21.64 (−15.7%) |
5. Discussion
6. Conclusions
Author Contributions
Funding
Institutional Review Board Statement
Informed Consent Statement
Data Availability Statement
Conflicts of Interest
References
- Mazzarella, L. Energy Retrofit of Historic and Existing Buildings. The legislative and Regularity Point of View. Energy Build 2015, 95, 23–31. [Google Scholar] [CrossRef]
- European Environment Agency. The European Environment—State and Outlook 2020. Knowledge for the Transition to a Sustainable Europe; European Union: Brussel, Belgium, 2019; pp. 1–499. [Google Scholar]
- Buildings Performance Institute Europe (BPIE). Europe’s Building under the Microscope. A Country-by-Country Review of the Energy Performance of Buildings; Buildings Performance Institute: Brussel, Belgium, 2011; pp. 1–132. [Google Scholar]
- UN Environment and International Energy Agency. Towards a Zero-Emission, Efficient, and Resilient Buildings and Construction Sector. Global Status Report 2017; UN Environment: Nairobi, Kenya, 2017; pp. 1–48. [Google Scholar]
- Directive 2002/91/EC of the European Parlament and of the Council of 16 December 2002 on the Energy Performance of Buildings. Off. J. Eur. Communities. 2003. Available online: http://data.europa.eu/eli/dir/2002/91/oj (accessed on 23 January 2023).
- Directive 2010/31/EU of the European Parlament and of the Council of 19 May 2010 on the Energy Performance of Buildings (Recast). Off. J. Eur. Union. 2010. Available online: http://data.europa.eu/eli/dir/2010/31/oj (accessed on 23 January 2023).
- Directive 2012/27/EU of the European Parlament and of the Council of 25 October 2012 on Energy Efficiency, Amending Directives 2009/125/EC and 2010/30/EU and Replaing Directives 2004/8/EC and 2006/32/EC. Off. J. Eur. Union. Available online: http://data.europa.eu/eli/dir/2012/27/oj (accessed on 23 January 2023).
- Buildings Performance Institute Europe (BPIE). State of the Building Stock-Briefing; Buildings Performance Institute: Brussel, Belgium, 2012; pp. 1–2. [Google Scholar]
- Oh, M.; Lee, C.; Park, J.; Lee, K.; Tae, S. Evaluation of Energy and Daylight Performance of Old Office Buildings in South Korea with Curtain Walls Remodeled Using Polymer Dispersed Liquid Crystal (PDLC) Films. Energies 2019, 12, 3679. [Google Scholar] [CrossRef] [Green Version]
- Moreno, Á.; Chemisana, D.; Vaillon, R.; Riverola, A.; Solans, A. Energy and Luminous Performance Investigation of an OPV/ETFE Glazing Element for Building Integration. Energies 2019, 12, 1870. [Google Scholar] [CrossRef] [Green Version]
- Sethi, M.; Lamb, W.; Minx, J.; Creutzig, F. Climate change mitigation in cities: A systematic scoping of case studies. Environ. Res. Lett. 2020, 15, 1748–9326. Available online: https://iopscience.iop.org/article/10.1088/1748-9326/ab99ff (accessed on 27 May 2023). [CrossRef]
- Kabisch, N.; Frantzeskaki, N.; Pauleit, S.; Naumann, S.; McKenna, D.; Artmann, M.; Haase, D.; Knapp, S.; Korn, H.; Stadler, J.; et al. Nature-based solutions to climate change mitigation and adaptation in urban areas: Perspectives on indicators, knowledge gaps, barriers, and opportunities for action. Ecol. Soc. 2016, 21, 239. [Google Scholar] [CrossRef] [Green Version]
- Ricci, R.; Vitali, D.; Montelpare, S. An innovative wind-solar hybrid street light: Development and early testing of a prototype. Int. J. Low-Carbon Technol. 2015, 10, 420–429. [Google Scholar] [CrossRef] [Green Version]
- Kim, D.; Cox, S.J.; Cho, H.; Yoon, J. Comparative investigation on building energy performance of double skin façade (DSF) with interior or exterior slat blinds. J. Build. Eng. 2018, 20, 411–423. [Google Scholar] [CrossRef]
- Lucchino, E.C.; Gennaro, G.; Favoino, F.; Goia, F. Modelling and validation of a single-storey flexible double-skin façade system with a building energy simulation tool. Build. Environ. 2022, 226, 109704. [Google Scholar] [CrossRef]
- Jankovic, A.; Goia, F. Characterization of a naturally ventilated double-skin façade through the design of experiments (DOE) methodology in a controlled environment. Energy Build. 2022, 263, 112024. [Google Scholar] [CrossRef]
- Matour, S.; Garcia-Hansen, V.; Omrani, S.; Hassanli, S.; Drogemuller, R. Thermal performance and airflow analysis of a new type of Double Skin Façade for warm climates: An experimental study. J. Build. Eng. 2022, 62, 105323. [Google Scholar] [CrossRef]
- Bugenings, L.A.; Schaffer, M.; Larsen, O.K.; Zhang, C. A novel solution for school renovations: Combining diffuse ceiling ventilation with double skin façade. J. Build. Eng. 2022, 49, 104026. [Google Scholar] [CrossRef]
- Ballestini, G.; De Carli, M.; Masiero, N.; Tombola, G. Possibilities and limitations of natural ventilation in restored industrial archaeology buildings with a double-skin façade in Mediterranean climates. Build. Environ. 2005, 40, 983–995. [Google Scholar] [CrossRef]
- Catto Lucchino, E.; Gelesz, A.; Skeie, K.; Gennaro, G.; Reith, A.; Serra, V.; Goia, F. Modelling double skin façades (DSFs) in whole-building energy simulation tools: Validation and inter-software comparison of a mechanically ventilated single-story DSF. Build. Environ. 2021, 199, 107906. [Google Scholar] [CrossRef]
- Poirazis, H. Double Skin Façades: A Literature Review; Lund University, Lund Institute of Technology Department of Architecture and Built Environment: Lund, Sweden, 2006; pp. 1–252. [Google Scholar]
- Uuttu, S. Study of Current Structures in Double-Skin Façades; Helsinki University of Technology: Espoo, Finland, 2001. [Google Scholar]
- Heimrath, R.; Hengsberger, H.; Mach, T.; Streicher, W.; Waldner, R.; Flamant, G.; Loncour, X.; Guarracino, G.; Erhorn, H.; Erhorn-Kluttig, H.; et al. BESTFAÇADE. Best Practice for Double Skin Façades. WP 1 Report “State of the Art”. 2005, pp. 1–151. Available online: http://www.bestfacade.com/pdf/downloads/Bestfacade_WP1_Report.pdf (accessed on 27 May 2023).
- Zhai, Z.; Chen, Q.; Haves, P.; Klems, J.H. On Approaches to Couple Energy Simulation and Computational Fluid Dynamics Programs. Build Environ. 2002, 37, 857–864. [Google Scholar] [CrossRef]
- Lops, C.; Germano, N.; Ricciutelli, A.; D’Alessandro, V.; Montelpare, S. Naturally Ventilated Double Skin Façades: Comparisons Between Different CFD Models. Math. Model. Eng. Probl. 2021, 8, 837–846. [Google Scholar] [CrossRef]
- Germano, N.; Lops, C.; Montelpare, S.; Camata, G.; Ricci, R. Determination of Wind Pattern Inside an Urban Area Through a Mesoscale-Microscale Approach. Math. Model. Eng. Probl. 2020, 7, 515–519. [Google Scholar] [CrossRef]
- Chan, A.L.S.; Chow, T.T.; Fong, K.F.; Lin, Z. Investigation on Energy Performance of Double Skin Façade in Hong Kong. Energy Build. 2009, 41, 1135–1142. [Google Scholar] [CrossRef]
- Gratia, E.; De Herde, A. The Most Efficient Position of Shading Devices in a Double-Skin Façade. Energy Build. 2007, 39, 364–373. [Google Scholar] [CrossRef]
- Joe, J.W.; Choi, W.J.; Huh, J.H. Operation Strategies for an Office Building Integrated with Multi-Story Double Skin Façades in the Heating Season. In Proceedings of the Building Simulation 2011: 12th Conference of International Building Performance Simulation Association, Sydney, Austrilia, 14–16 November 2011. [Google Scholar]
- Ding, W.; Hasemi, Y.; Yamada, T. Natural Ventilation Performance of a Double-Skin Façade With a Solar Chimney. Energy Build. 2005, 37, 411–418. [Google Scholar] [CrossRef]
- Gontikaki, M. Optimization of a Solar Chimney Design to Enhance Natural Ventilation in a Multi-Storey Office Building. In Proceedings of the 10th International Conference for Enhanced Building Operations, Kuwait, 26–28 October 2010. [Google Scholar]
- Abraham, S.B.; Ming, T.Z. Numerical Analysis on The Thermal Performance of a Building With Solar Chimney and Double Skin Façade in Tropical Country. IOP Conf. Ser. Mater. Sci. Eng. 2018, 453, 012030. [Google Scholar] [CrossRef]
- Stec, W.J.; van Paassen, A.H.C.; Maziarz, A. Modelling the Double Skin Façade with Plants. Energy Build. 2005, 37, 419–427. [Google Scholar] [CrossRef]
- De Gracia, A.; Navarro, L.; Castell, A.; Cabeza, L.F. Energy Performance of Ventilated Double Skin Façade with PCM Under Different Climates. Energy Build. 2015, 91, 37–42. [Google Scholar] [CrossRef] [Green Version]
- Johny, A.E.; Shanks, K. Optimization of Double-Skin Facades for High-Rise Buildings in Hot Arid Climates. Int. J. Environ. Sustain. 2018, 7, 88–100. [Google Scholar] [CrossRef]
- Gaillard, L.; Giroux-Julien, S.; Ménézo, C.; Pabiou, H. Experimental Evaluation of a Naturally Ventilated PV Double-Skin Building Envelope in Real Operating Conditions. Sol Energy. 2014, 10, 223–241. [Google Scholar] [CrossRef] [Green Version]
- Athienitis, A.K.; Buonomano, A.; Ioannidis, Z.; Kapsis, K.; Stathopoulos, T. Double Skin Façades Integrating Photovoltaics and Active Shadings: A Case Study for Different Climates. In Proceedings of the 1st International Conference on Building Integrated Renewable Energy Systems, Dublin, Ireland, 6–9 March 2017. [Google Scholar]
- Luo, Y.; Zhang, L.; Wang, X.; Xie, L.; Liu, Z.; Wu, J.; Zhang, Y.; He, X. A comparative study on thermal performance evaluation of a new double skin façade system integrated with photovoltaic blinds. Appl. Energy 2017, 199, 281–293. [Google Scholar] [CrossRef]
- Jayathissa, P.; Luzzatto, M.; Schmidli, J.; Hofer, J.; Nagy, Z.; Schlueter, A. Optimising Building Net Energy Demand With Dynamic BIPV Shading. Appl. Energy 2017, 202, 726–735. [Google Scholar] [CrossRef]
- Moon, K.S. Structural Design of Double Skin Facades as Damping Devices for Tall Buildings. Procedia. Eng. 2011, 14, 1351–1358. [Google Scholar] [CrossRef] [Green Version]
- Zhang, R. SMART BUILDINGS: An Integrative Double Skin Façade Damper System For Structural Safety and Energy Efficiency. Ph.D. Dissertation, University of New Hampshire, Durham, UK, 2017. [Google Scholar]
- Takeuchi, T.; Yasuda, K.; Iwata, M. Studies on Integrated Building Facade Engineering with High-Performance Structural Elements. IABSE Symp. Rep. 2006, 92, 33–40. [Google Scholar] [CrossRef]
- Scuderi, G. Adaptative Exoskeleton for the Integrated Retrofit of Social Housing Buildings. Ph.D. Dissertation, University of Trento, Trento, Italy, February 2016. [Google Scholar]
- Passoni, C.; Belleri, A.; Marini, A.; Riva, P. Sustainable Restoration of Post-WWII European Reinforced Concrete Buildings. In Proceedings of the 16th World Conference on Earthquake, Santiago, Chile, 9–13 January 2017. [Google Scholar]
- Labò, S. Holistic Sustainable Renovation of Post-World War II Reinforced Concrete Building Under A Life Cycle Perspective by Means Diagrid Exoskeletons. Ph.D. Dissertation, University of Bergamo, Bergamo, Italy, March 2019. [Google Scholar]
- Khabir, S.; Vakilinezhad, R. Energy and thermal analysis of DSF in the retrofit design of office buildings in hot climates. Archit. Eng. Des. Manag. 2022, 1–23. [Google Scholar] [CrossRef]
- Ascione, F.; Bianco, N.; Iovane, T.; Mastellone, M.; Mauro, G.M. The evolution of building energy retrofit via double-skin and responsive façades: A review. Solar Energy 2021, 224, 703–717. [Google Scholar] [CrossRef]
- Sarihi, S.; Mehdizadeh Saradj, F.; Faizi, M. A Critical Review of Façade Retrofit Measures for Minimizing Heating and Cooling Demand in Existing Buildings. Sustain. Cities Soc. 2021, 64, 102525. [Google Scholar] [CrossRef]
- Montelpare, S.; D’Alessandro, V.; Lops, C.; Costanzo, E.; Ricci, R. A Mesoscale-Microscale approach for the energy analysis of buildings. J. Phys. Conf. Ser. 2019, 1224, 012022. [Google Scholar] [CrossRef]
- Peel, M.C.; Finlayson, B.L.; McMahon, T.A. Updated World Map of the Köppen-Geiger Climate Classification. Hydrol. Earth Syst. Sci. 2007, 11, 1633–1644. [Google Scholar] [CrossRef] [Green Version]
- Fondazione Osservatorio Meteorologico Milano Duomo ETS. Available online: https://www.fondazioneomd.it/climate-network (accessed on 20 January 2019).
- Giorgi, F.; Jones, C.; Asrar, G.R. Addressing climate information needs at the regional level: The CORDEX framework. World Meteorol. Organ. Bull. 2019, 58, 175. [Google Scholar]
- Bubnovà, R. Integration of the Fully Elastic Equations Cast in the Hydrostatic Pressure Terrain-Following Coordinate in the Framework of the ARPAGE/Aladin NWP SYstem. Am. Meteorol. Soc. 1995, 123, 515–535. [Google Scholar] [CrossRef]
- Farda, A.; Déué, M.; Somot, S.; Horányi, A.; Spiridonov, V.; Tóth, H. Model ALADIN as Regional Climate Model for Central and Eastern Europe. Stud. Geophys. Geod. 2010, 54, 313–332. [Google Scholar] [CrossRef]
- Horanyi, A.; Ihasz, I.; Radnoti, G. ARPEGE/ALADIN: A numerical Weather Prediction Model for Central-Europe with the Participation of the Hungarian Meteorological Service. IdoJárás 1996, 100, 277–301. [Google Scholar]
- Huth, R.; Mládek, R.; Metelka, L.; Sedlák, P.; Huthová, Z.; Kliegrová, S.; Kyselý, J.; Pokorna, L.; Helenka, T.; Janoušek, M. On the Integrability of Limited-Area Numerical Weather Prediction Model ALADIN over Extended Time Periods. Stud. Geophys. Geod. 2003, 47, 863–873. [Google Scholar] [CrossRef]
- EN ISO 15927-4:2005; Hygrothermal Performance of Buildings—Calculation and Presentation of Climatic Data—Part 4: Hourly Data for Assessing the Annual Energy Use for Heating and Cooling. ISO: Geneva, Switzerland, 2005.
- Cebecauer, T.; Suri, M. Typical Meteorological Year Data: SolarGIS Approach. Energy Procedia 2015, 69, 1958–1969. [Google Scholar] [CrossRef] [Green Version]
- UNI EN 16798-1:2019; Energy Performance of Buildings–Ventilation for Buildings-Part 1: Indoor Environmental Input Parameters for Design and Assessment of Energy Performance of Buildings Addressing Indoor Air Quality, Thermal Environment, Lighting and Acoustics—Module M1-6. Ente Nazionale Italiano di Unificazione (UNI): Milano, Italy, 2019.


| Building Component | Material (Outer to Inner) | s (m) | l (W/mK) | U (W/m2K) |
|---|---|---|---|---|
 | Lime plaster Brickwork Air gap Brickwork Lime plaster | 0.02 0.13 0.08 0.08 0.02 | 0.80 0.84 0.30 0.62 0.80 | 1.46 |
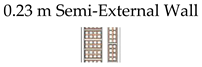 | Lime plaster Brickwork Air gap Brickwork Lime plaster | 0.02 0.13 0.03 0.08 0.02 | 0.80 0.84 0.30 0.62 0.80 | 1.60 |
 | Plaster Plasterboard Plaster | 0.02 0.07 0.02 | 0.16 0.25 0.16 | 1.27 |
 | Single clear glazing | 0.006 | - | 3.78 |
 | Cast concrete Concrete slab Plaster | 0.02 0.16 0.02 | 1.13 0.16 0.16 | 0.78 |
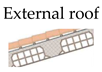 | Ceiling tiles Cast concrete Concrete slab Plaster | 0.02 0.02 0.16 0.02 | 0.06 1.13 0.16 0.16 | 0.61 |
 | Cast concrete Ceramic | 0.02 0.02 | 1.40 1.30 | 3.37 |
| Thermal Zone | Occupation (People/m2) | Fresh Air (l/s per Person) | Illuminance (Lux) | Schedule (-) |
|---|---|---|---|---|
| Bedroom | 0.0229 | 10 | 100 |  |
| Bathroom | 0.0187 | 12 | 150 | 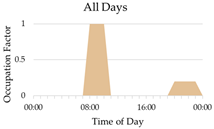 |
| Kitchen | 0.0237 | 12 | 300 | 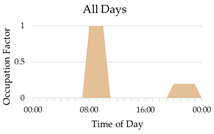 |
| Storage Room | 0.0243 | 12 | 100 |  |
| Dining Room | 0.0169 | 10 | 150 | 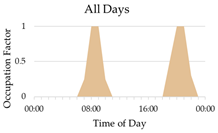 |
| Circulation Area | 0.0196 | 10 | 100 | 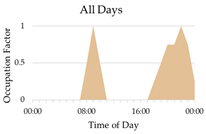 |
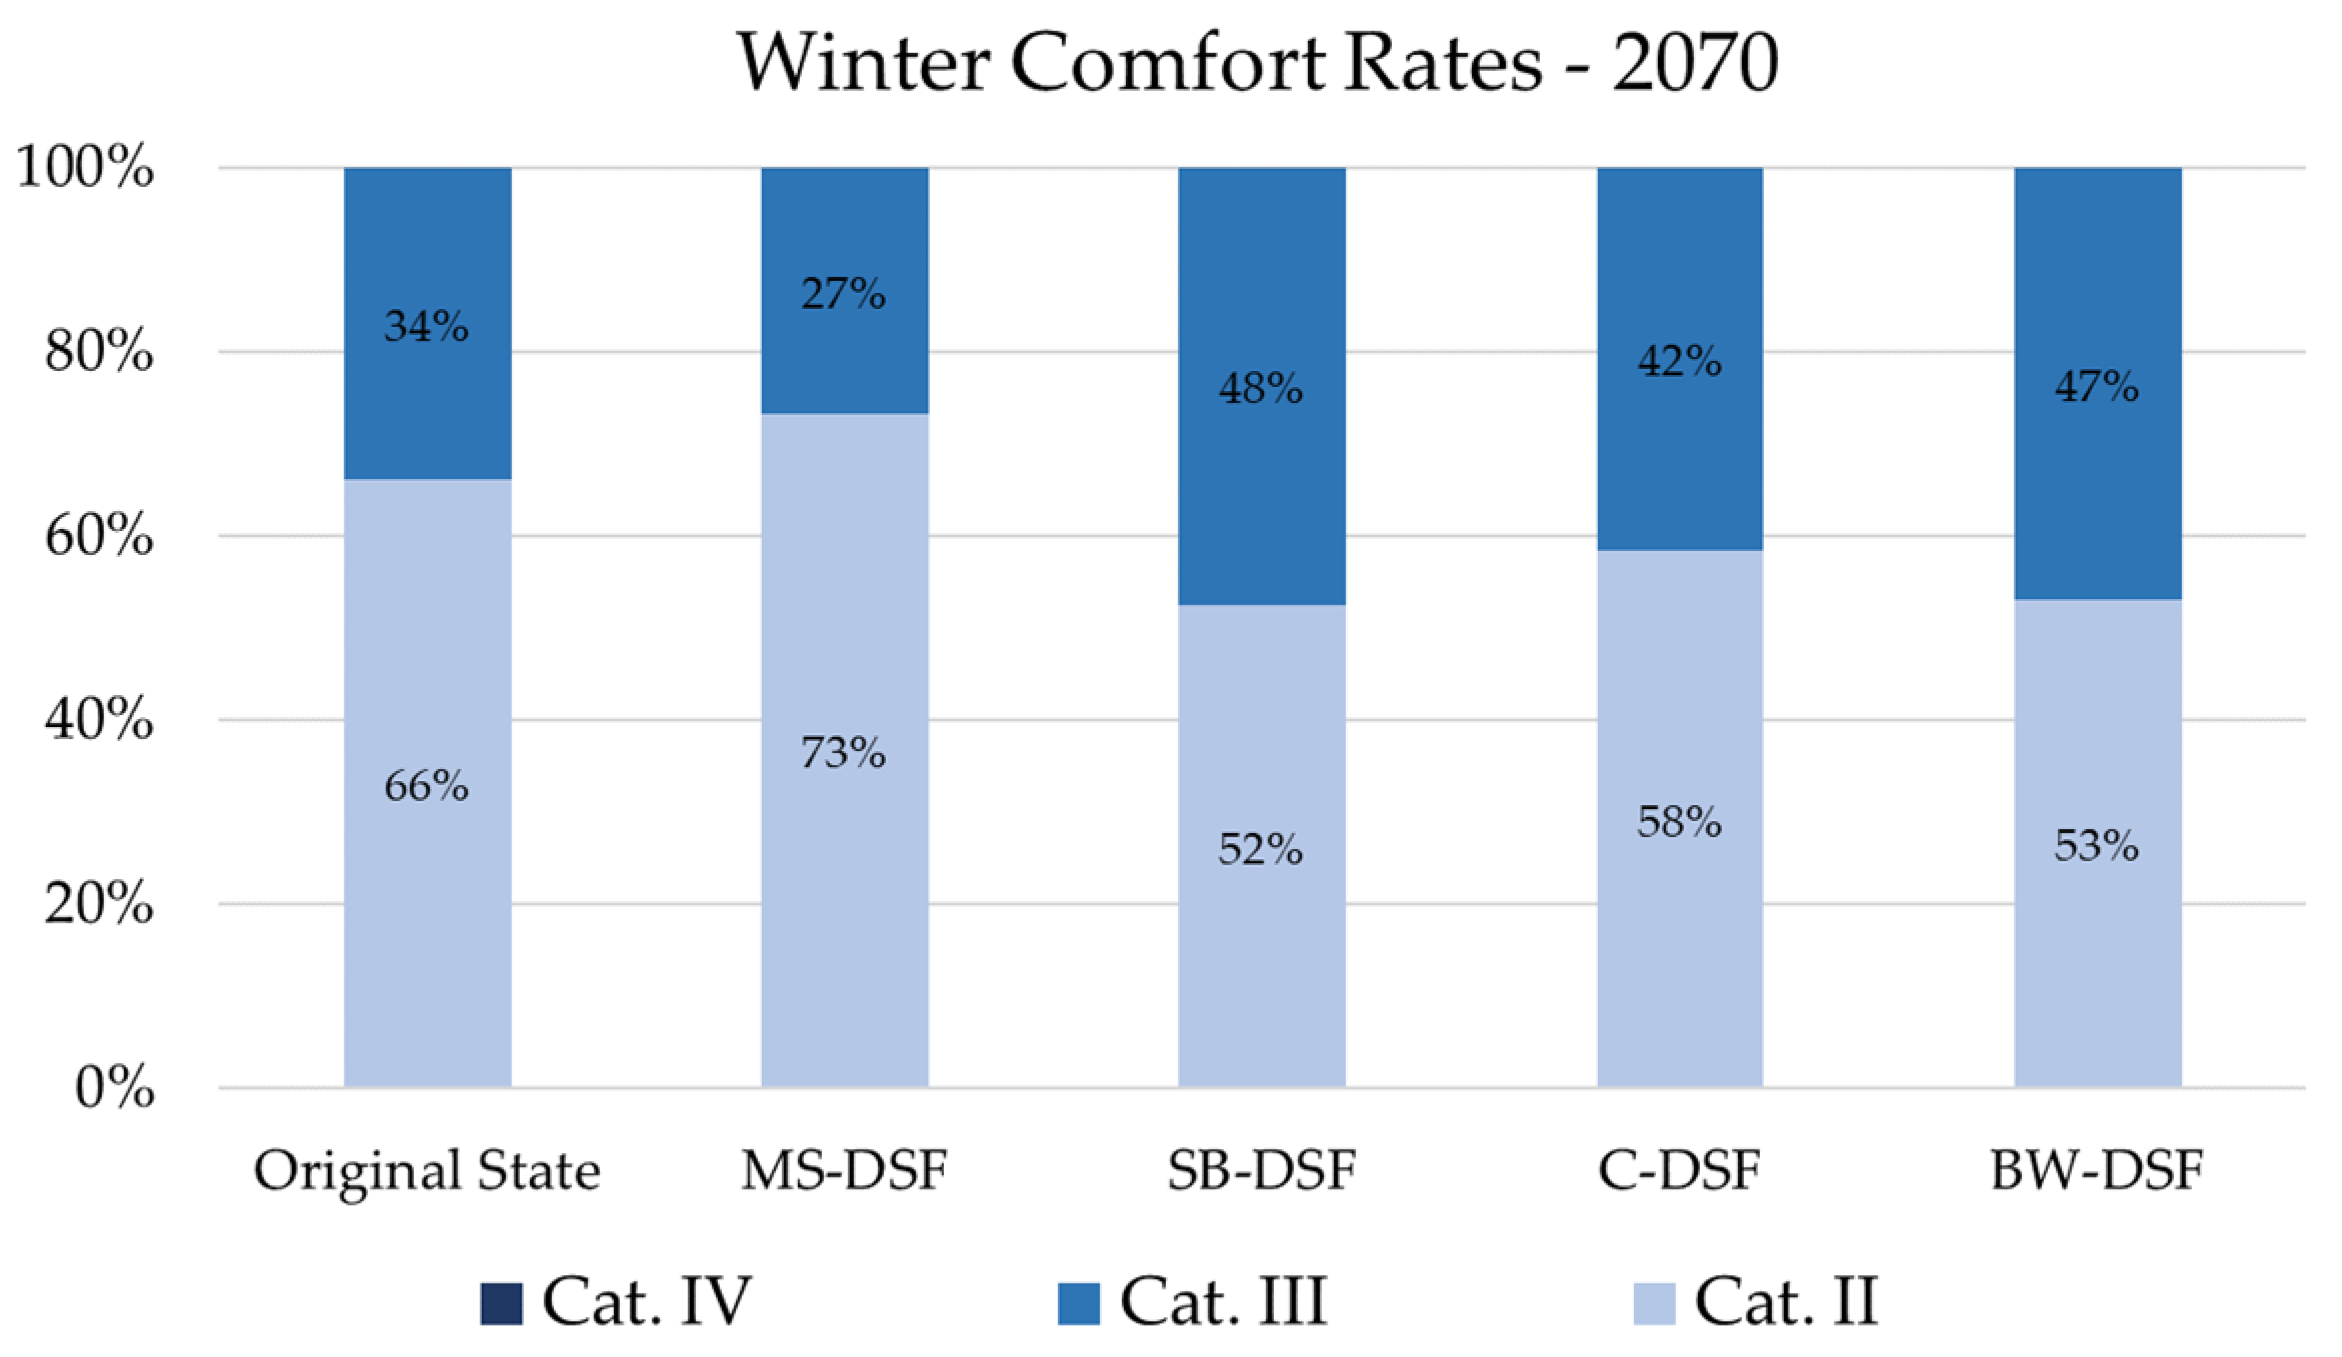
| Category | Winter Operative Temperature Range | Summer Operative Temperature Range |
|---|---|---|
| I | Toperative ≥ 21 °C | Toperative ≤ 25.5 °C |
| II | 20 °C ≤ Toperative < 21 °C | 25.5 °C < Toperative ≤ 26 °C |
| III | 18 °C ≤ Toperative < 20 °C | 26 °C < Toperative ≤ 27 °C |
| IV | Toperative < 18 °C | Toperative > 27 °C |
Disclaimer/Publisher’s Note: The statements, opinions and data contained in all publications are solely those of the individual author(s) and contributor(s) and not of MDPI and/or the editor(s). MDPI and/or the editor(s) disclaim responsibility for any injury to people or property resulting from any ideas, methods, instructions or products referred to in the content. |
© 2023 by the authors. Licensee MDPI, Basel, Switzerland. This article is an open access article distributed under the terms and conditions of the Creative Commons Attribution (CC BY) license (https://creativecommons.org/licenses/by/4.0/).
Share and Cite
Lops, C.; Di Loreto, S.; Pierantozzi, M.; Montelpare, S. Double-Skin Façades for Building Retrofitting and Climate Change: A Case Study in Central Italy. Appl. Sci. 2023, 13, 7629. https://doi.org/10.3390/app13137629
Lops C, Di Loreto S, Pierantozzi M, Montelpare S. Double-Skin Façades for Building Retrofitting and Climate Change: A Case Study in Central Italy. Applied Sciences. 2023; 13(13):7629. https://doi.org/10.3390/app13137629
Chicago/Turabian StyleLops, Camilla, Samantha Di Loreto, Mariano Pierantozzi, and Sergio Montelpare. 2023. "Double-Skin Façades for Building Retrofitting and Climate Change: A Case Study in Central Italy" Applied Sciences 13, no. 13: 7629. https://doi.org/10.3390/app13137629
APA StyleLops, C., Di Loreto, S., Pierantozzi, M., & Montelpare, S. (2023). Double-Skin Façades for Building Retrofitting and Climate Change: A Case Study in Central Italy. Applied Sciences, 13(13), 7629. https://doi.org/10.3390/app13137629