1. Introduction
In Africa, agricultural drought negatively impacts livestock [
1] and agricultural production [
2,
3]. Climate change poses significant threats to livestock production systems, particularly in Sub-Saharan Africa, including South Africa, where farmers often face limited coping mechanisms and resources [
4]. This vulnerability is further exacerbated by the occurrence of agricultural drought [
5,
6]. When faced with agricultural drought, farmers employ a range of coping mechanisms to mitigate its impact [
7]. These coping methods serve as temporary corrective efforts that farmers adopt to ensure their survival in the face of unforeseen agricultural drought events [
8] and their livelihoods are threatened [
9]. According to [
10], coping strategies are the actions and activities carried out inside already-existing structures and systems. Using various coping mechanisms lowers economic, environmental, and social vulnerability [
11]. The proper use of resources during droughts and regular seasons [
12,
13], the efficient use of skills [
14], the investigation of opportunities to counteract the effects of agricultural drought, and so forth are some of these tactics [
15]. According to [
16], characteristics such as education, knowledge, support from social networks, neighbors, and access to community resources help farmers cope more easily. It is important to note that the definition of “agricultural drought” by [
17] as the absence of precipitation throughout the growing season, which generally impacts ecosystem function, provides an understanding of the phenomenon in the broader context of ecosystem dynamics.
Agriculture drought and climate change adaptation depend on local and international organizations that set up incentives for individual and collective action [
18]. These institutions have influenced the way rural residents have responded to environmental challenges in the past in this place [
19], and these institutions are also the key mediating mechanisms that will translate the impact of future external interventions to support adaptation to climate change (agricultural drought) in the region [
20]. Future policy-development-related adaptation must consider historical experience and understanding of adaptation possibilities [
21]. This is because the specifics of climate-change impacts are yet unknown (especially for small territorial units), even though it is clear that the overall effects will be dramatic and long-lasting if current trends continue [
22]. Like in any other country, agricultural productivity in South Africa is impacted by agricultural drought intensity, length, and season in a number of regions, including the Eastern Cape Province [
23]. The year 2015 was deemed to be the driest year on record in South Africa since 1904 [
12]. Long-lasting droughts are one of the most significant natural disasters in terms of the economy, society, and environment and are a regular and recurrent aspect affecting small-holder farmers [
24,
25]. The susceptibility of the populations who are affected by climate effects is related to the dynamics of those impacts in terms of intensity, frequency, regularity, and predictability [
3]. The economic harm brought on by the agricultural drought in South Africa in 2015 was USD 2 billion [
16].
Drought conditions were to blame for an 8.4% decrease in agricultural output in 2015 [
26]. With a 15% decrease in the national herd, the livestock business (cattle and sheep) was one of the industries badly impacted by drought [
7]. Ref. [
21] noted that the agricultural drought caused the number of livestock in South Africa to decrease by 1.21% Compound Annual Growth Rate from 44.4 million in 2012 to 42.3 million in 2016. Given that agriculture is the primary source of income for most small-holder farmers [
27], it is crucial to analyze coping mechanisms to strengthen the agriculture sector’s resilience. Numerous aspects of how small-holder farmers deal with climate stress are the focus of recent international and national studies [
28,
29]. There has been a huge research interest on how small-holder farmers increase and strengthen their capacity for adaptation by adjusting their livestock production to climate variability [
10,
30]. The impact of climate change on cattle, current efforts by government and farmers to adapt, analysis of how climate change affects farmers, development of an activity-based adaptation index, and small-holder farmers’ changing attitudes toward adaptation are all factors that influence the choice of coping strategies [
3,
21,
26]. Understanding farmers’ attitudes and motivations is crucial in developing effective strategies for drought resilience and sustainable farming. While previous research has examined farmers’ adaptation practices, there is a dearth of studies focusing specifically on farmers’ willingness to tackle drought-related issues. This gap hinders the development of targeted strategies to promote proactive approaches and the adoption of adaptive measures. Addressing this knowledge gap is essential for informing evidence-based policies and practices that support drought resilience and sustainable cattle farming in rural communities. By understanding farmers’ attitudes, beliefs, and decision-making processes regarding drought, policymakers and practitioners can design interventions that align with farmers’ needs and priorities. This knowledge can help identify barriers and drivers for adopting drought-resilience measures, as well as the factors that influence farmers’ willingness to engage in proactive practices.
By examining farmers’ attitudes, researchers can gain insights into the social, cultural, economic, and psychological factors that shape farmers’ behaviors and decision-making processes in the face of drought. This understanding can inform the design of targeted education and awareness programs that address farmers’ specific concerns and motivations. Moreover, understanding farmers’ attitudes towards drought resilience and sustainable farming can contribute to the development of social networks and peer-learning opportunities. By promoting knowledge sharing and collaboration among farmers, practices that have been successful in one context can be shared and adapted to suit the needs of other farmers in similar situations. Furthermore, understanding farmers’ attitudes can help identify potential barriers to the adoption of adaptive measures and develop strategies to overcome them. For example, if farmers perceive high costs or lack of access to resources as barriers, interventions can focus on providing financial support, technical assistance, or access to affordable technologies. Overall, addressing the knowledge gap regarding farmers’ attitudes and motivations towards drought resilience is crucial for the development of effective strategies and policies. By involving farmers in the process and tailoring interventions to their needs, it is possible to foster a proactive approach to drought management, promote sustainable farming practices, and enhance the resilience of rural communities in the Eastern Cape, South Africa.
2. Materials and Methods
2.1. Site Description
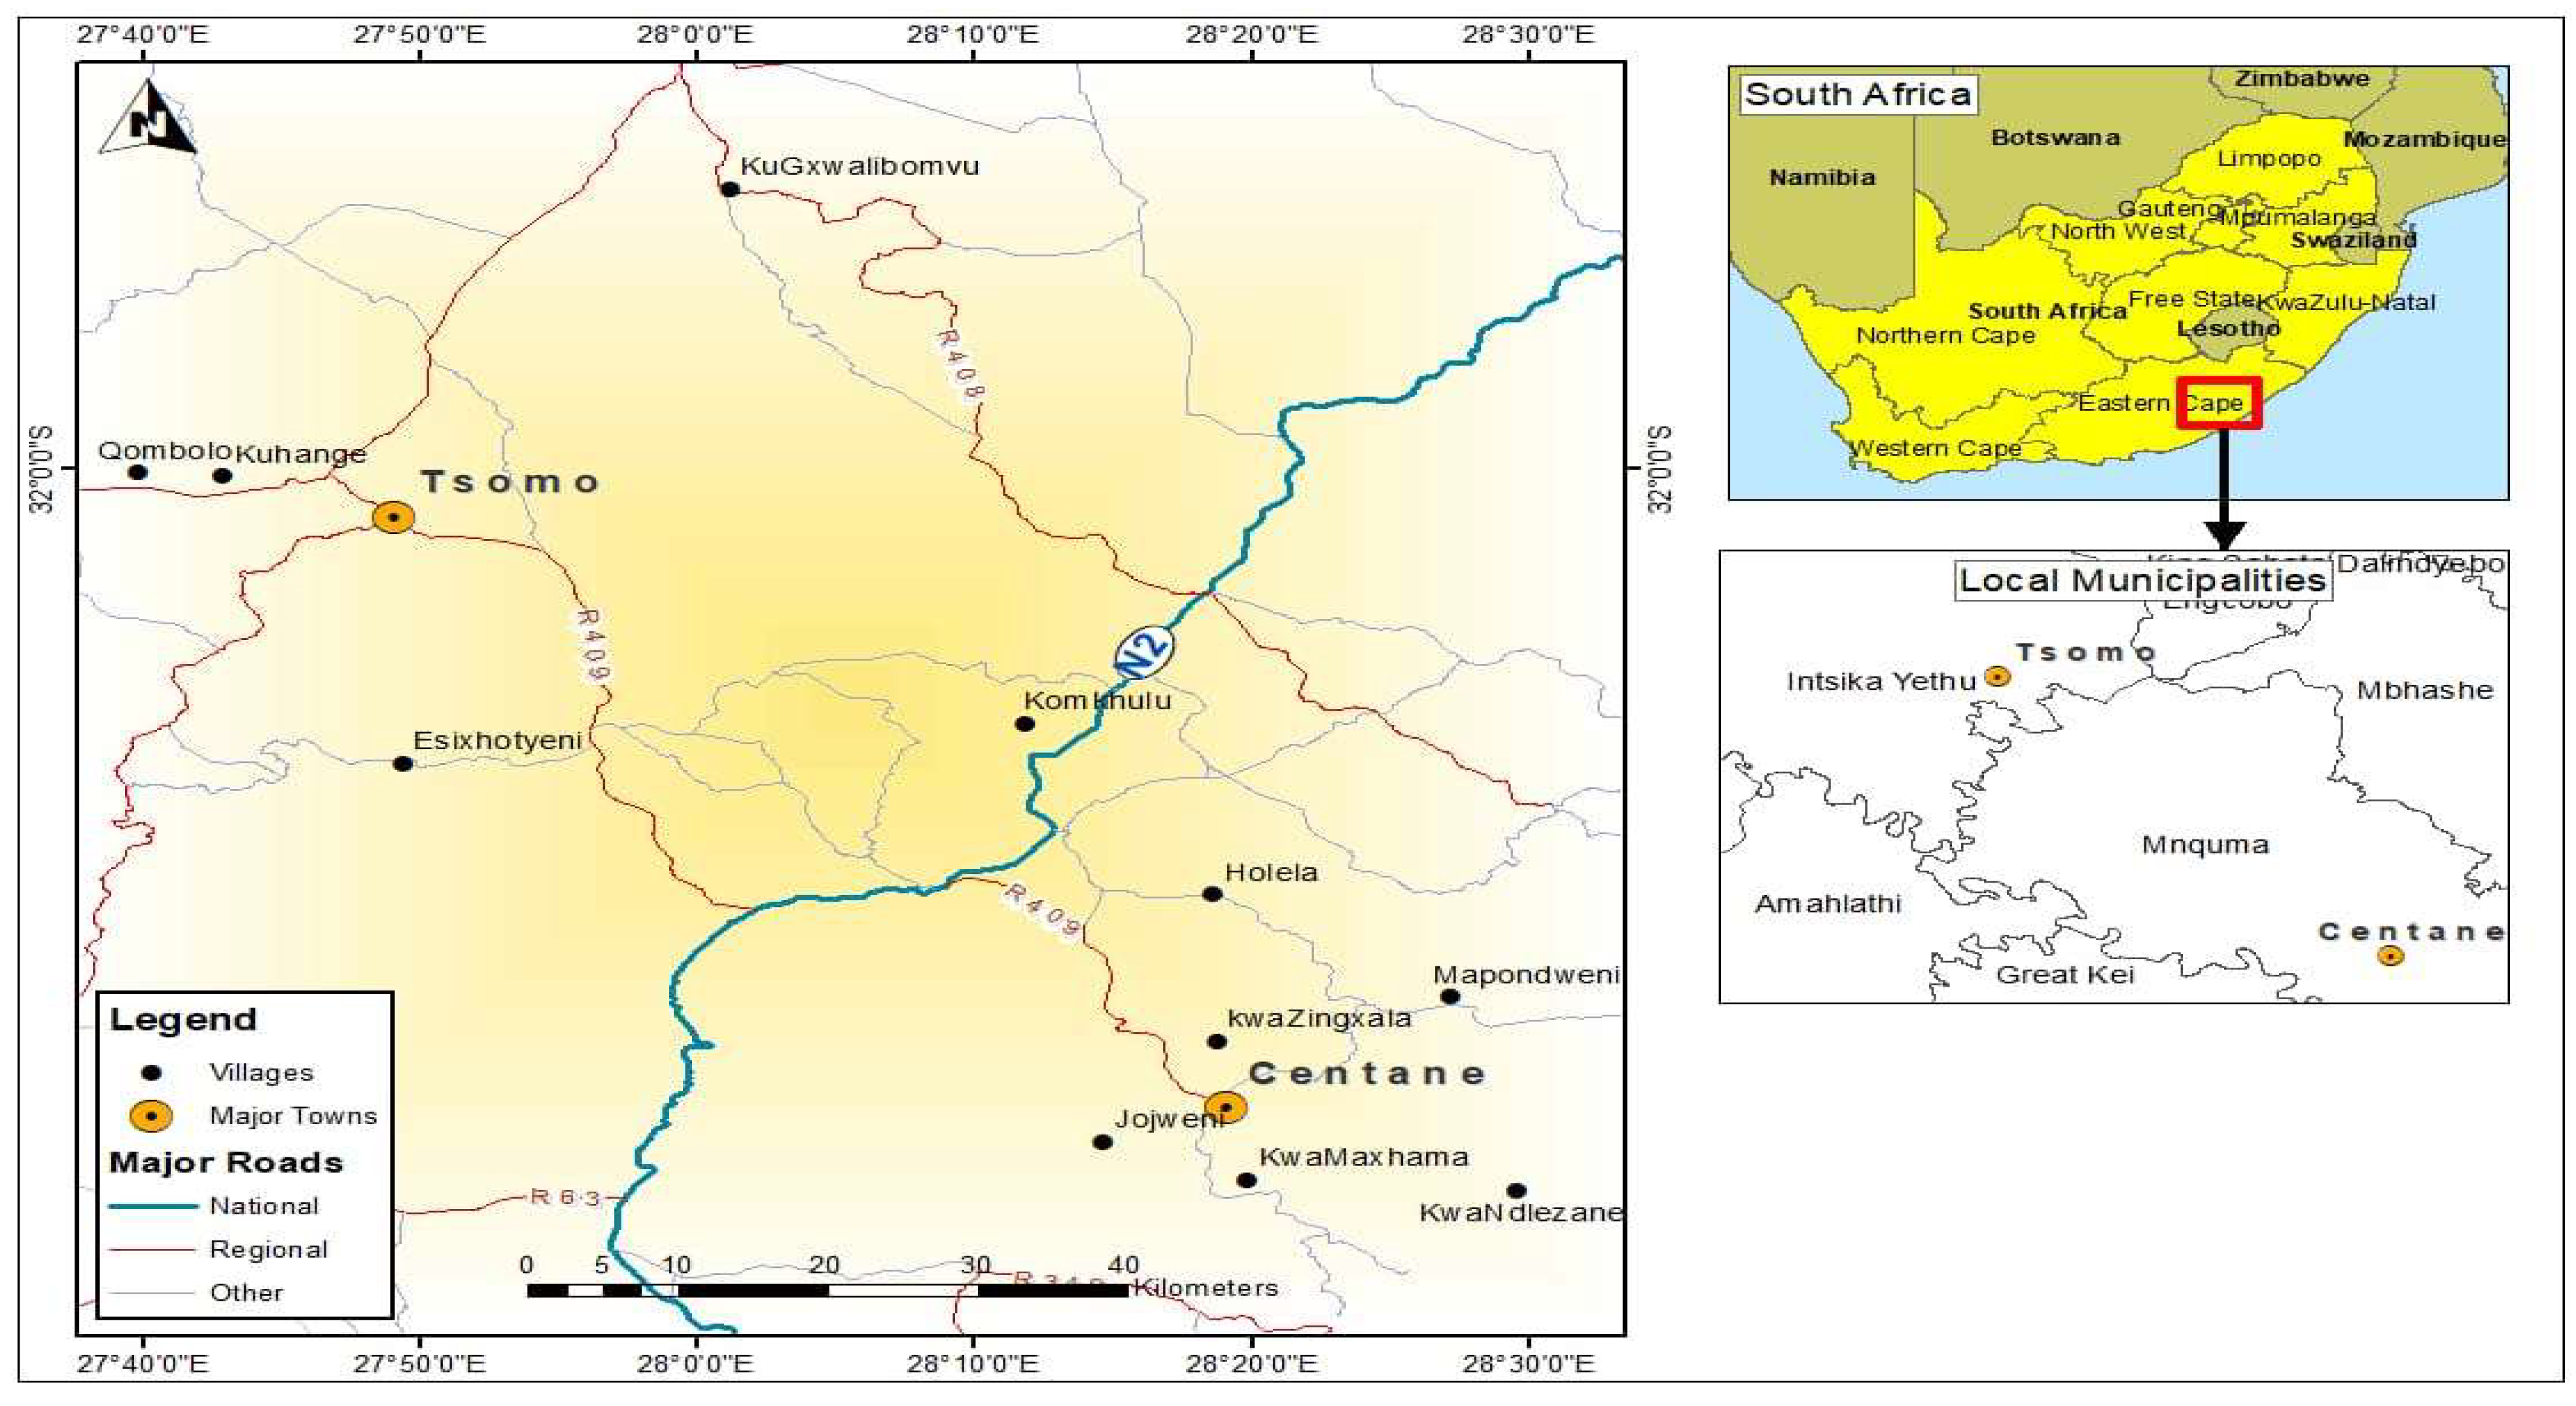
Five villages from Centane (namely Holela, KwaZingxala, Jojweni, Mapondweni, and kwaMaxhama) and five villages (Gxwalibomvu, Qombolo, kuHange, Komkhulu, and esiXhotyeni) in the Tsomo demarcation were selected to participate in the current survey (
Figure 1). The two small towns are situated in the Eastern Cape Province, South Africa. The province is made up of thirty-seven district municipalities. Centane is located within the Mnquma Local Municipality, situated at 32.18 degrees south latitude, 28.02 degrees east longitude. The town has an elevation of approximately 501 m above sea level. With an area of about 4.39 km
2, Centane is home to an average population of 1456 people, resulting in a population density of 330 individuals per square kilometer. The demographic composition of Centane reflects a diverse community. The majority, comprising 96.2% of the population, identifies as Xhosa. Additionally, there is a presence of other ethnic groups, with 0.8% being of colored descent, 0.2% Indian/Asian, 1.1% white, and 1.7% belonging to various other tribes. On the other hand, Tsomo is situated within the Intsika-Yethu Local Municipality, located at 31.93 degrees south latitude and 27.64 degrees east longitude. It is positioned at an elevation of approximately 1083 m above sea level. Tsomo covers an area of about 3.72 km
2 and has an average population of 2108 individuals, resulting in a population density of 570 people per square kilometer. The demographic composition of Tsomo is characterized by a predominantly Black African population, accounting for 94.8% of the residents. There is also a presence of other ethnic groups, including 2.1% colored, 1.7% Indian/Asian, and 1.3% White individuals. Regarding language usage, the majority of the population in Tsomo, comprising 88.7%, speaks Xhosa. Additionally, 3.1% of the residents use English as a primary language, 1.1% speak Afrikaans, and 7.0% communicate in various other languages. The two small towns are known to suffer from several socioeconomic challenges, including a high youth unemployment rate, and most people depend on government social grants and subsistence livestock farming as primary income sources. Whether it is crop, livestock production, or both, farming is the lifeblood of this resource-constrained local population, keeping indigenous cattle breeds and sheep as the most preferred livestock species in both areas. The region is sparsely populated and fragile to climate variability, experiencing extremes of drought and foods. Animals in the study area rely on natural pastures as a source of feed. The climate of the two small towns is commonly characterized by a slightly hot summer; high humidity all the year-round; and inconsistent rainfall (annual average rainfall of 473.2 mm), which is received during November to April. On average, the site recorded a daily maximum temperature of 25.8 °C and a minimum temperature of 11.2 °C. The humidity is high throughout the year, with the average being 72.1%. The study area is located in a hot, humid zone that has four distinct seasons, viz post-rainy (March to May), cold–dry (June to August), hot–dry (September to November), and hot–wet (December to February). The area lies in a lowland characterized by steep, isolated mountains, and the veld type is predominantly Bhisho Thornveld [
31]. Several trees characterize the vegetation in the region, including shrubs and grass species, with Acacia Karoo, Themeda triandra, Panicum maximum, Digitaria eriantha, Eragrostis spp., Cynodon dactylon, and Pennisetum clandestinum being the dominant plant species [
32]. Soils are extremely heterogeneous but are predominantly sedimentary (sand and mudstones) with some variation when intrusions of igneous rock (doleritic dykes and sheets) result in red soils occurring in some areas [
9].
2.2. Ethical Consideration and Lobbying of Farmers
Ethical approval was obtained from the University of Fort Hare research ethics committee to ensure the protection of participants’ rights and confidentiality (JAJ051SMPO01). Informed consent was obtained from all participants, and they were assured of the voluntary nature of their participation. Personal identifiers were removed from the data during analysis to maintain anonymity. The traditional leadership was engaged, and they facilitated meetings with respondents and other key informants within their jurisdiction. This genuine cooperation stipulates clarification and sensitization of the community on the objectives, intentions, and use of possible outcomes of the study.
2.3. Study Design
The study adopted a mixed-methods research design to obtain a comprehensive understanding of farmers’ perceptions and willingness regarding drought-related issues. This approach involved the integration of qualitative and quantitative data collection methods, allowing for triangulation of findings and a more robust analysis. Qualitative data were collected through in-depth interviews and focus-group discussions with farmers. These qualitative methods enabled researchers to explore farmers’ attitudes, beliefs, and motivations in-depth. Open-ended questions and interactive group discussions provided rich insights into the complexities of farmers’ experiences with drought and their perceptions of adaptive measures. The qualitative data were analyzed using thematic analysis techniques to identify key themes and patterns. Quantitative data were collected through structured surveys administered to a larger sample of farmers. The surveys consisted of closed-ended questions that captured farmers’ demographic information, attitudes towards drought, perceived barriers and facilitators of adaptation, and willingness to adopt specific drought-resilience measures. The quantitative data were analyzed using statistical techniques such as descriptive statistics and inferential analysis to examine the relationships between different variables. Integration of the qualitative and quantitative data occurred at multiple stages of the research process. During data collection, insights from the qualitative interviews and discussions informed the development of survey questions and response options. This ensured that the quantitative survey captured relevant dimensions of farmers’ perceptions and willingness. The findings from the qualitative and quantitative analyses were then compared and integrated during the data-interpretation phase. The qualitative themes provided context and nuance to the quantitative results, helping to explain and expand upon the statistical findings. This integration allowed for a more comprehensive understanding of the research topic and increased the validity and reliability of the findings. Triangulation of findings occurred through the comparison and convergence of results from the qualitative and quantitative analyses. Consistent patterns and themes across both data sets provided stronger evidence and increased confidence in the findings. In cases where there were discrepancies or divergent findings, these were carefully examined and discussed to identify potential explanations or explore additional factors that may have influenced the results. Overall, the integration of qualitative and quantitative data in this study provided a more holistic and nuanced understanding of farmers’ perceptions and willingness regarding drought-related issues. The triangulation of findings enhanced the validity and reliability of the study and allowed for more robust conclusions and recommendations.
2.4. Sampling Procedure
Participants for this study were identified using a purposive sampling technique. The researchers specifically targeted small-holder cattle farmers residing in rural communities in the Eastern Cape Province. The use of purposive sampling allowed for the selection of participants who were most relevant to the research objectives and could provide valuable insights into drought-related issues and adaptive measures. The criteria for inclusion in the study were that participants had to be small-holder cattle farmers and residents of rural communities in the Eastern Cape Province. This ensured that the sample represented the target population of interest. The researchers aimed to capture the experiences and perspectives of farmers who were directly involved in cattle farming and were likely to be affected by drought events. To ensure diversity within the sample, farmers from different geographic locations within the Eastern Cape Province were included. This helped to capture variations in environmental conditions, access to resources, and experiences with drought. Additionally, farmers from different socioeconomic backgrounds were selected to account for potential variations in adaptive capacities and perspectives. The sample size for the study was determined based on the principle of data saturation. Data saturation occurs when the researchers have collected sufficient information to address the research objectives and further data collection is unlikely to yield substantially new insights. The researchers continued the sampling and data collection until they felt that they had reached data saturation, ensuring that they obtained a comprehensive understanding of farmers’ perceptions and willingness regarding drought-related issues. By using purposive sampling and including farmers from diverse geographic locations and socioeconomic backgrounds, the study aimed to capture a range of perspectives and experiences. This approach increased the representativeness and richness of the data, enabling a more comprehensive analysis and interpretation of the findings.
2.5. Data Collection
By employing a robust data-collection approach that combined quantitative and qualitative methods, this study aimed to comprehensively understand farmers’ perceptions and willingness to tackle drought-related issues in small-holder cattle production systems. The data collected will serve as a valuable foundation for formulating context-specific interventions and support mechanisms to enhance drought resilience in rural communities in the Eastern Cape, South Africa. The study collected data from 250 farmers, using questionnaire surveys, in-depth interviews, and focus-group discussions.
2.5.1. Questionnaire Survey
The questionnaire surveys were administered to a total of 250 farmers from 10 villages. In other words, twenty-five farmers per village were interviewed. The structured questionnaires contained a range of items to assess farmers’ knowledge, attitudes, and practices related to drought management in cattle farming. Each interview took no more than 20 min depending on the discussion with the farmer.
2.5.2. In-Depth Interviews
In-depth interviews were conducted with a subset of 25 farmers selected from the 250 sample. Five interviews per village were conducted. The interviews followed a semi-structured format, allowing for flexibility and an in-depth exploration of farmers’ perceptions, beliefs, and experiences. Probing questions were used to delve into specific areas of interest, such as barriers and facilitators to adopting drought adaptation measures, and farmers’ perceptions of the effectiveness of existing support mechanisms. The duration of the interviews varied depending on the participants and the depth of the discussion. However, each interview did not exceed 30 min.
2.5.3. Focus-Group Discussions
Focus-group discussions were organized with 25 farmers who were grouped based on their geographical proximity or similar farming practices. Each group comprised 5 farmers. These discussions provided a platform for participants to share their experiences, exchange ideas, and discuss challenges and opportunities related to drought management in their cattle farming systems. The group dynamics encouraged rich discussions and the exploration of diverse perspectives. The duration of the focus group discussions also varied depending on the group size and the extent of the discussions. However, each group discussion did not exceed 45 min.
The integration of quantitative and qualitative methods allowed for a comprehensive understanding of farmers’ perceptions and willingness to tackle drought-related issues. The quantitative data from the questionnaire surveys provided statistical insights and allowed for generalizability to the larger population, while the qualitative data from the in-depth interviews and focus-group discussions offered detailed insights into farmers’ experiences, beliefs, and contextual factors influencing their decision-making processes. The combined analysis of the quantitative and qualitative data provided a robust and triangulated understanding of the research topic, enhancing the validity and reliability of the findings. The integration of different data collection methods also facilitated a more comprehensive exploration of farmers’ perspectives, allowing for a nuanced understanding of the complexities and nuances of their attitudes and motivations towards drought management in small-holder cattle production systems in the Eastern Cape Province.
2.6. Data Analysis
The collected data, including both qualitative and quantitative data, were analyzed using [
33], a statistical software commonly used for data analysis. The analysis incorporated both inductive and deductive thematic analysis approaches to capture a comprehensive understanding of the research topic. For the quantitative data obtained from the questionnaires, statistical software was employed to perform a descriptive analysis. This involved generating summary statistics, such as means, frequencies, and percentages, to examine the distribution of responses and identify patterns and trends in farmers’ knowledge, attitudes, and practices related to drought management in cattle farming. These analyses helped to provide a quantitative overview of the participants’ perspectives. The qualitative data, including interview transcripts and focus-group discussions, underwent a rigorous analysis process. Firstly, the data were transcribed to ensure accurate representation. Then, a coding system was developed, whereby segments of the data were assigned specific codes based on their content. These codes helped to categorize and organize the data for further analysis. A thematic analysis was applied to identify key themes and categories that emerged from the data. This involved examining the coded segments, identifying recurring patterns, and exploring the relationships between different themes. The analysis aimed to capture the nuances and complexities of farmers’ perceptions, beliefs, and experiences related to drought management in their cattle farming systems. By integrating the quantitative and qualitative data, a triangulation approach was adopted to gain a more comprehensive understanding of the research topic. This integration allowed for the validation and convergence of findings from different data sources, enhancing the overall robustness of the study. Additionally, a multiple regression analysis was employed to examine the relationship between the dependent variable—which, in this case, was farmers’ willingness to adopt drought-resistant farming practices—and various independent variables. These independent variables may have included factors such as farmers’ perception of the severity of drought, education level, income level, and other relevant variables. The multiple regression analysis helped us to assess the impact and significance of these independent variables on farmers’ willingness to adopt drought-resistant practices, providing quantitative insights into the factors influencing farmers’ decision-making processes. Overall, the data analysis process involved a combination of statistical analysis for quantitative data and thematic analysis for qualitative data, allowing for a comprehensive exploration of the research objectives and facilitating evidence-based conclusions.
3. Results
3.1. Participants’ Demographic Characteristics and Cattle-Herd Ownership
A total of 250 small-holder cattle farmers participated in the study. The chi-square tests were conducted to examine the relationship between demographic characteristics and cattle-herd ownership in the sample (
Table 1). The results in indicate that the majority of cattle-herd owners are male, accounting for 59.2% of the sample. A significant association was found between gender and cattle-herd ownership (chi-square = 6.21,
p = 0.030), suggesting that gender may play a role in cattle ownership. Regarding age-group distribution, the highest proportion of cattle-herd owners falls within the 46–60-year-old age group, representing 28.8% of the sample. A significant association was observed between age group and cattle-herd ownership (chi-square = 14.61,
p < 0.010), indicating that age group may influence cattle ownership. In terms of educational background, the highest proportion of cattle-herd owners has secondary education, accounting for 28.8% of the sample. A significant association was found between education level and cattle-herd ownership (chi-square = 24.39,
p < 0.01), suggesting that education level may impact cattle ownership. The distribution of income sources among cattle-herd owners varied, with the largest proportion relying on a salary as their income source, representing 36.0% of the sample. A significant association was observed between income source and cattle-herd ownership (chi-square = 18.23,
p < 0.001), indicating that the source of income is associated with cattle ownership.
The duration of involvement in cattle farming was distributed across different time periods. The highest proportion of cattle owners had been engaged in cattle farming for more than 10 years, accounting for 39.2% of the sample. However, the chi-square test did not show a significant association between years in cattle farming and cattle-herd ownership (chi-square = 2.09, p = 0.351). Regarding herd sizes, the majority of cattle owners had a herd size between 10 and 20, representing 38.8% of the sample. A significant association was found between herd size and cattle-herd ownership (chi-square = 7.38, p = 0.025), suggesting that herd size may be related to cattle ownership. In summary, the results indicate that gender, age group, education level, income source, and herd size are associated with cattle-herd ownership among the surveyed population. However, years in cattle farming did not show a significant association with cattle ownership. These findings provide insights into the demographic characteristics of cattle-herd owners and their potential influence on cattle ownership patterns.
3.2. Farmers Perception of Drought-Related Issues in Rural Communities
Figure 2 represents the perceived impact of drought as a crisis requiring urgent intervention in small-holder cattle production. Based on the chi-square test results, the association between participants’ responses and the perceived impact of drought is not statistically significant. The chi-square value of 0.00234 and a
p-value of 0.9581, which is greater than the significance level of 0.05, indicates a very small deviation from the expected frequencies under the assumption of independence. Looking at the distribution of responses, we see that the majority of participants (65%) agreed that drought is perceived as a crisis requiring urgent intervention in small-holder cattle production. This indicates a consensus among the respondents, highlighting their recognition of the severity of drought’s impact on cattle production systems and the need for immediate action. A significant proportion (25%) of participants expressed uncertainty or lack of clarity regarding whether drought should be considered a crisis requiring urgent intervention. This suggests that there is a level of indecisiveness or lack of consensus among this group regarding the severity and urgency of addressing drought-related issues. A smaller proportion (10%) of participants disagreed that drought is a crisis requiring urgent intervention. This minority opinion may reflect the perception that the impact of drought on cattle production is not significant enough to warrant immediate action or that alternative strategies can effectively manage the situation. Overall, while the majority agreement highlights the consensus among the participants regarding the urgency of addressing drought in small-holder cattle production, the lack of statistical significance in the chi-square test suggests that the association between participants’ responses and the perceived impact of drought is not strong. This finding emphasizes the need for further investigation and consideration of additional factors that may influence participants’ perceptions and responses.
Table 2 displays the chi-square test results for farmers’ perceptions of drought-related issues in small-holder cattle production. The analysis reveals a statistically significant difference in the observed and expected frequencies for the perception of “Lack of water for livestock”. The chi-square value of 8.25 exceeds the critical value of 9.49 at a significance level of 0.05. Furthermore, the
p-value of 0.004 is lower than the significance level, indicating a statistically significant difference. For the perceptions of “Reduced quality of pasture” and “Increased cost of feed”, the chi-square values are 3.36 and 2.89, respectively. However, the corresponding
p-values of 0.067 and 0.089 are greater than the significance level of 0.05, suggesting no statistically significant difference between observed and expected frequencies for these perceptions. Similarly, for the perceptions of “Reduced body weight” and “Increased risk of cattle diseases”, the chi-square values are 0.05 and 1.00, respectively. The associated
p-values of 0.823 and 0.317 are much greater than the significance level, indicating no statistically significant difference between observed and expected frequencies for these perceptions. In summary, the results indicate that farmers in the rural communities of the Eastern Cape, South Africa, perceive “Lack of water for livestock” as the most significant drought-related issue in small-holder cattle production systems. This finding underscores the importance of addressing water scarcity and implementing interventions to mitigate its impact on livestock farming.
3.3. Willingness of Farmers to Adopt Recommended Drought Mitigation Strategies
Figure 3 illustrates the proportion of farmers willing to adopt recommended drought mitigation strategies, categorized into “Agree”, “Not sure”, and “Disagree” options. The chi-square test results indicate that there is no statistically significant association between participants’ responses and their perceived willingness to mitigate the effects of drought on cattle production systems. The chi-square value of 0.0724 and a
p-value of 0.9653, which exceeds the significance level of 0.05, suggest a minimal deviation from the expected frequencies, assuming independence. Among the participants, a majority of farmers (71%) expressed their agreement to adopt the recommended drought mitigation strategies. This reflects a positive inclination among them to take proactive measures in safeguarding their livelihoods and addressing the risks posed by drought. Conversely, 23% of respondents were unsure about their willingness to adopt these strategies, potentially due to reservations or uncertainties regarding their effectiveness or feasibility. Addressing their concerns through education, information dissemination, and support is necessary to enhance their confidence in adopting the recommended measures. A smaller proportion, 6% of participants, disagreed with adopting the strategies, likely influenced by factors such as skepticism about their effectiveness or a preference for alternative approaches tailored to their specific circumstances. Overall, the high proportion of farmers (71%) displaying a willingness to adopt recommended drought mitigation strategies is an encouraging finding. It underscores their receptiveness and preparedness to implement measures that can help them cope with and mitigate the impacts of drought on cattle production systems. This emphasizes the importance of providing necessary resources, training, and support to facilitate the adoption of these strategies and enhance farmers’ resilience in the face of drought challenges.
Table 3 shows the results of a chi-square test to analyze the farmers’ willingness to adopt drought mitigation strategies. The observed frequency for conservation agriculture is 38, which is lower than the expected frequency of 44.5. The residual value is −6.5, indicating that fewer participants than expected reported using conservation agriculture as a drought mitigation strategy. The chi-square value is 2.77, and the corresponding
p-value is 0.096, which suggests a borderline significant association between conservation agriculture and drought mitigation. The observed frequency for water harvesting is 28, slightly lower than the expected frequency of 31.5. The residual value is −3.5, indicating a smaller number of participants than expected who reported using water harvesting as a drought mitigation strategy. The chi-square value is 0.89, and the
p-value is 0.345, indicating no significant association between water harvesting and drought mitigation. The observed frequency for drought-tolerant crops is 55, higher than the expected frequency of 47.5. The residual value is 7.5, suggesting that more participants than expected reported using drought-tolerant crops as a drought mitigation strategy. The chi-square value is 3.75, and the
p-value is 0.053, indicating a borderline significant association between drought-tolerant crops and drought mitigation. The observed frequency for feed supplementation is 49, slightly lower than the expected frequency of 52.5. The residual value is −3.5, indicating a slightly lower number of participants than expected who reported using feed supplementation as a drought mitigation strategy. The chi-square value is 0.89, and the
p-value is 0.345, suggesting no significant association between feed supplementation and drought mitigation. The observed frequency for financial planning and risk management is 25, lower than the expected frequency of 29.5. The negative residual of −4.5 indicates that the observed frequency is lower than expected. The chi-square value of 0.97 suggests a small discrepancy between the observed and expected frequencies. The
p-value of 0.382 indicates that this discrepancy is not statistically significant at the 0.05 significance level. This suggests that the observed frequency is not significantly different from the expected frequency for financial planning and risk management. The observed frequency for collaboration and information sharing is 55, which is higher than the expected frequency of 44. The negative residual of −9.5 indicates that the observed frequency is higher than expected. The chi-square value of 2.82 suggests a moderate discrepancy between the observed and expected frequencies. The
p-value of 0.081 indicates that this discrepancy is not statistically significant at the 0.05 significance level. This suggests that the observed frequency is not significantly different from the expected frequency for collaboration and information sharing. The total observed frequency is 250, slightly lower than the expected frequency of 249.5. The negative residual of −1 indicates a small deviation from the expected frequency. The chi-square value of 8.30 suggests a moderate overall discrepancy between the observed and expected frequencies. The
p-value of 0.040 indicates statistical significance at the 0.05 significance level, suggesting that there is evidence to reject the null hypothesis and conclude that there may be an association between the drought mitigation strategies and their observed frequencies as a whole. In summary, the analysis indicates significant or borderline significant associations between some specific drought mitigation strategies, such as conservation agriculture and drought-tolerant crops, and overall drought mitigation practices among the participants. These findings provide insights into the adoption and effectiveness of different strategies and can inform interventions and support mechanisms to enhance drought resilience in small-holder cattle production systems. However, further research and larger sample sizes may be needed to strengthen the statistical significance of these associations.
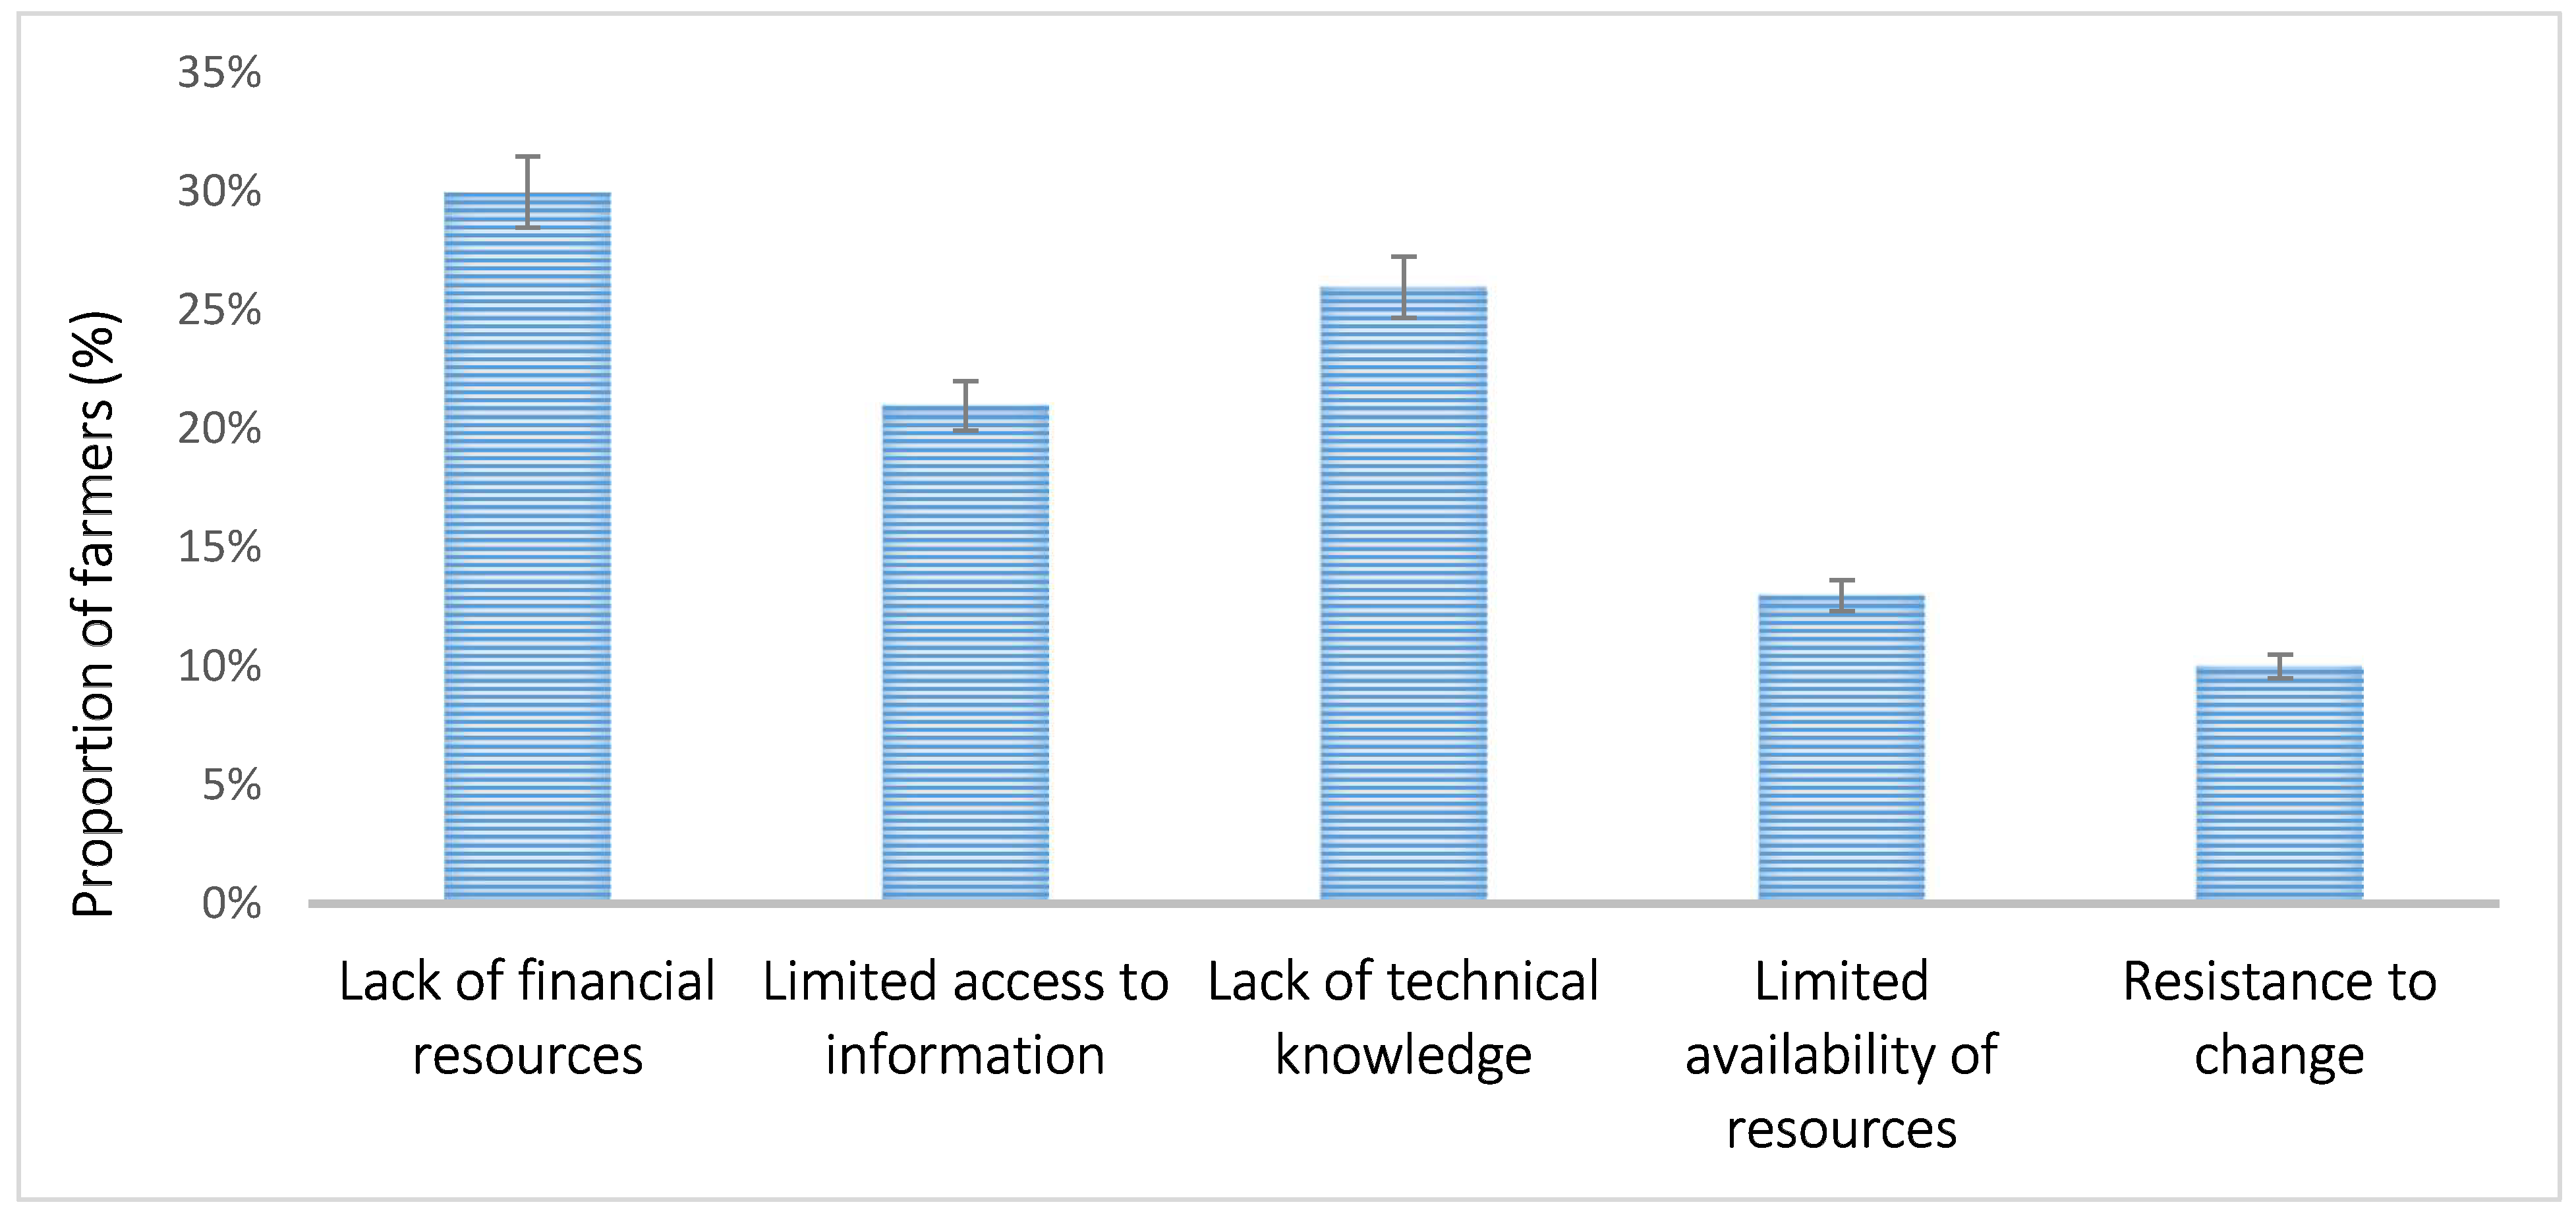
3.4. Barriers to Adopt New Strategies
Figure 4 presents the factors hindering the small-holder farmers from adopting better drought strategies. A lack of financial resources was reported by 40 farmers, accounting for 30% of the respondents. It suggests that a significant portion of farmers face challenges in adopting new strategies due to limited financial resources. The lack of funds may restrict their ability to invest in the necessary infrastructure, technology, or inputs required for effective drought mitigation. Approximately 28 farmers, constituting 21% of the respondents, identified limited access to information as a barrier. This suggests that farmers may not have adequate knowledge about available drought mitigation strategies or may face challenges in accessing relevant information and resources. Improving information dissemination and providing extension services can help overcome this barrier. The lack of technical knowledge was reported by 35 farmers, accounting for 26% of the respondents. This barrier indicates that farmers may lack the necessary skills and expertise to implement drought mitigation strategies effectively. Enhancing technical training, providing workshops or demonstrations, and promoting knowledge-sharing platforms can help address this barrier. Approximately 18 farmers, representing 13% of the respondents, reported limited availability of resources as a barrier. This suggests that farmers may face challenges accessing the required resources, such as water, feed, or infrastructure, to effectively implement drought mitigation strategies. Improving resource availability and ensuring equitable access can help overcome this barrier. The barrier of resistance to change was identified by 14 farmers, accounting for 10% of the respondents. This indicates that some farmers may resist adopting new strategies due to traditional practices, cultural norms, or a reluctance to deviate from established routines. Overcoming this barrier may require targeted awareness campaigns, community engagement, and showcasing the benefits of adopting new approaches. Overall, the barriers identified in this study highlight the challenges small-holder cattle farmers face in adopting new drought mitigation strategies. The findings emphasize the need for targeted interventions and support mechanisms to address these barriers and promote the adoption of effective drought mitigation practices. Strategies such as improving access to financial resources, providing relevant information and technical training, ensuring resource availability, and addressing resistance to change can enhance drought resilience in small-holder cattle production systems.
3.5. Factors Influencing Willingness to Adopt Drought Mitigation Strategies
Regression analysis of factors influencing willingness and adoption of drought mitigation strategies in presented in
Table 4. The regression model was significant (F(10, 29) = 5.21,
p < 0.001), indicating that the selected variables were collectively associated with a willingness to adopt drought mitigation strategies. The model accounted for 58% of the variance in willingness to adopt drought mitigation strategies. Access to information on drought mitigation strategies (β = 0.49,
p < 0.001) and availability of financial support for drought mitigation (β = 0.31,
p < 0.001) were the strongest predictors of willingness to adopt drought mitigation strategies. The cost of implementing drought mitigation strategies (β = −0.34,
p = 0.05) was negatively associated with the willingness to adopt these strategies.
The age of farmer, herd size, social pressure to adopt drought mitigation strategies, severity of past drought events, and perceived susceptibility to future drought events were not significant predictors of the willingness to adopt drought mitigation strategies. In summary, the regression analysis confirms that access to information and financial support are key factors that can influence the willingness of small-holder cattle farmers in rural communities to adopt drought mitigation strategies. Cost remains a barrier that needs to be addressed. These findings can inform policy and practice aimed at improving drought resilience among small-holder cattle farmers in similar contexts.
3.6. Association between the Farmers’ Perceptions and Willingness to Tackle Drought-Related Issues
Table 5 presents the perception of drought-related issues and the willingness of individuals to tackle these issues. The chi-square test is used to assess if there is a significant association between these variables. The
p-value indicates the probability of observing the observed association or a stronger association if there is no true association in the population. Among the respondents, 62 perceived drought as a serious problem and expressed willingness to tackle it. The expected count for this category is 50.24, indicating that the observed count is higher than expected. The residual value is 11.76, which signifies a positive deviation from the expected count.
The chi-square value is 6.23, and the associated p-value is 0.01, suggesting a significant association between perceiving drought as a serious problem and being willing to tackle it. Ninety-four individuals perceived drought as a serious problem but stated that they are unwilling to tackle it. The expected count for this category is 103.76, indicating that the observed count is lower than expected. The residual value is −11.76, which signifies a negative deviation from the expected count. The chi-square value is 6.23, and the associated p-value is 0.01, suggesting a significant association between perceiving drought as a serious problem and not being willing to tackle it. Thirty-seven individuals did not perceive drought as a serious problem yet expressed their willingness to tackle it. The expected count for this category is 48.47, indicating that the observed count is lower than expected. The residual value is −11.47, which signifies a negative deviation from the expected count. The chi-square value is 3.46, and the associated p-value is 0.06, indicating a moderate significance level. However, the result is not statistically significant at the conventional significance level of 0.05. Fifty-seven individuals did not perceive drought as a serious problem and stated that they are unwilling to tackle it. The expected count for this category is 45.53, indicating that the observed count is higher than expected. The residual value is 11.47, which signifies a positive deviation from the expected count. The chi-square value is 3.46, and the associated p-value is 0.06, indicating a moderate level of significance. However, the result is not statistically significant at the conventional significance level of 0.05. In summary, the perception of drought as a serious problem is significantly associated with individuals’ willingness to tackle it. Those who perceive drought as a serious problem are more likely to express their willingness to address it, while those who do not perceive it as a serious problem are less inclined to take action. These findings highlight the importance of addressing perceptions and raising awareness to foster a proactive approach towards drought-related issues.


