Article

Biosignals Monitoring of First Responders for Cognitive Load Estimation in Real-Time Operation

1
ETSI Telecomunicación, Universidad Politécnica de Madrid, Av. Complutense 30, 28040 Madrid, Spain
2
SUMMA 112, Servicio de Urgencias Médicas de la Comunidad de Madrid, C/Antracita 2bis, 28045 Madrid, Spain
3
Department of Electrical and Electronics Engineering, University of West Attica, 250 Thivon Ave., 12241 Egaleo, Greece
4
Vicomtech Foundation, Paseo Mikeletegi 57, 20009 Donostia-San Sebastian, Spain
*
Author to whom correspondence should be addressed.
Appl. Sci. 2023, 13(13), 7368; https://doi.org/10.3390/app13137368
Submission received: 19 May 2023 / Revised: 14 June 2023 / Accepted: 19 June 2023 / Published: 21 June 2023
(This article belongs to the Section Applied Biosciences and Bioengineering)

Abstract

:

Featured Application

The framework presented in this paper allows real-time monitoring of first responders’ vital signs in emergency and disaster operations. Moreover, it will allow inference of first responders’ cognitive load in real time, with the aim of adapting the information provided according to his/her assimilation capabilities under stressful situations.

Abstract

During the last decade, new technological tools have emerged to provide first responders with augmented senses in emergency and disaster situations. Some of these tools focus on providing extra information about their surroundings. However, despite augmenting first responders’ capabilities, the quantity and the way that this information is presented can affect their cognitive load. This manuscript presents an integrated framework that allows real-time biosignals monitoring to analyze physical constants and correlate them with subjective cognitive load tests. Biosignals monitoring allows alarms to be raised related to the physical status while cognitive load values will allow modulation of the amount of information that can be assimilated by the first responder in operation. In-lab and practice experimental tests have been conducted to create a fully functional framework. During the technical validation, a strong dispersion of subjective cognitive load by means of NASA-TLX questionnaires has been found between participants. Nonetheless, the developed framework allows extraction of relationships between biosignals and cognitive load, with special attention to the respiration rate and eye movements.

1. Introduction

Vital signs reflect essential body functions and can detect and monitor punctual or permanent medical problems [1,2,3]. Moreover, the measurement and control of vital signs in real time provide useful indications to identify the state of health and to understand the impact of physical actions performed [4,5,6]. However, despite being an essential indicator, it is not a very common practice outside athletics or clinical environments [7]. In fact, upon analyzing common procedures in emergency and disaster situations, we observe that first responders (FRs), the main agents involved in rescue missions (e.g., firefighters, doctors, nurses) are not typically monitored while in operation [8,9].
Furthermore, biosignals monitoring can facilitate an understanding of the impact of not only physical but also mental activities [10,11]. Recent preliminary studies show that vital signs relate to mental task execution [12,13,14,15]. Moreover, not only the mental resources required in a task are of interest, but also the distractors that surround it. This mental resource has been termed in different ways in the literature, including working memory load, mental workload, or cognitive load, depending on the context used and/or the theoretical influences [16,17]. In this manuscript, we will use the term cognitive load (CL) [18], because of its close association with cognitive load theory.
CL theory emerged in the 1980s as a theory that made predictions about learning and problem solving based on the number of mental resources and effort invested in a tasks’ execution [19,20]. CL theory emphasizes that all novel information is first processed by the working memory with limited capacity and duration; afterwards, it is stored in an unlimited long-term memory for later use. Therefore, when dealing with novel information, it must be presented in a manner that considers the limitations of the working memory [21]. Moreover, CL is increased when unnecessary demands are imposed on the cognitive system. If CL becomes too high, it hampers learning and transfer. Such demands include inadequate instructional methods as well as unnecessary distractions in the environment. Therefore, to promote learning and transfer, CL is best managed in such a way that the cognitive processing irrelevant to learning is minimized within the limits of available cognitive capacity [22].
The concept of CL is also especially relevant in emergency and disaster situations, because of its special characteristics: emergency situations occur suddenly and can change unexpectedly, decisions are made under time pressure [23], there is an increasing amount of information and lack of information at the same time, the tasks performed are complex [24] and they are carried out under personal involvement [25]. Moreover, these situations are physically, mentally, and emotionally demanding [26]. In addition, in an emergency situation, there may be multiple distracting stimuli that can interfere with the aid or rescue task. Cognitive capabilities may vary depending on personal factors like expertise, stress, fatigue, distractions, or other internal psychological states. Research has also confirmed that emotions play a vital role in cognitive processing, such as relationships between anxiety and attention, or emotional state and memory [27]. Thus, CL is an inherent characteristic of emergency situations that can be influenced by personal and situational aspects. Therefore, emergency situations in themselves can present a cognitive overload, due to the saturation of the working memory.
During the last decade, new solutions have been emerging to provide FRs with technological tools and to improve their activities in emergency situations. Some of them focus on replicating activities in simulators or emulators, with the aim of training real activities with computer-based programs [28,29] or virtual reality [30]. Regardless of the technology, as aforementioned, working memory is limited in both capacity and duration when dealing with novel information; but these limitations effectively disappear when working memory deals with information transferred from long-term memory. Thus, in stressful situations, the more information the FR has recorded in long-term memory by means of learning, the more capacity there will be in the working memory to deal with novel information related to the emergency.
Some other approaches not focusing on training provide augmented senses to FRs in operation [31] (e.g., augmented vision, augmented information, real-time locations, auto-positioning, cognitive support, or increased communications between others). Most of these approaches rely on augmented reality (AR), because a lack of situational awareness is identified as one of the major challenges for supporting collaboration in emergencies [32]. However, the use of AR to increase sensations can influence CL in FRs [33]. Some researchers claim that when using AR, the success of a task is increased or made more likely through additional visual information being presented alongside the physical world [34]. However, the influence of AR on cognitive load has not been extensively investigated [35] and there are not many references on the emergency domain [33]. In these studies, the AR is only related to constructivist and learning approaches, not to the cognitive load. Unfortunately, although there has been a debate about whether AR increases CL [36], most studies report higher performance for participants using AR, but no evidence for cognitive overload compared to other conditions.
Therefore, in this paper, under the European project RESCUER (https://rescuerproject.eu/, accessed on 12 June 2023), we designed a biosignals monitoring system to extract FRs’ physical parameters and to infer their cognitive load in real time during operation. The system is designed to be autonomous in terms of communication, without the need to connect to an external server or cloud service. This is mandatory because of restrictions on emergency and disaster situations; the system cannot depend on having an external connection. Moreover, the system adapts to an AR framework that provides augmented information to the FRs and extracts biosignals information. These biosignals values will allow extraction of CL information and adjustment of the amount of information that FRs can safely assimilate, maintaining a compromise between the extra information provided and the capabilities to be acquired.
The manuscript focuses on the design and development of a hardware and software framework, as well as its technical validation that: (i) allows real-time biosignals monitoring of FRs, (ii) analyzes the implication of spatial-temporal information provided in operation, and (iii) extracts information about the capability of information absorption helping or interfering in the tasks’ execution. In the manuscript we perform a technical validation, but a longitudinal clinical study is relegated to a piloting period in real operation that must be synchronized with FRs’ training maneuvers.
The rest of the document is organized as follows. Section 2 describes the theoretical framework of biosignals measurement and cognitive load. Section 3 provides information about the sensors used in the framework and the system integration. Section 4 focuses on the description of experimental tests developed for the technical validation of the framework, while Section 5 provides preliminary results and shows differences between FRs’ characteristics. Finally, Section 6 concludes the manuscript.

2. Theoretical Framework

2.1. Biosignals

In face-to-face situations, users communicate and exchange information enriched with emotional cues such as facial expressions, voice intonations, gestures, or body positions to transmit what respondents want (need, desire, love, etc.) or do not want (afraid, dislike, hate, detest, etc.). In 1988, Ortony et al. [37] identified four sources of evidence, namely: (a) self-report, (b) physiology, (c) behavior, and (d) language. The selection of each tool involves the consideration of different factors [38] such as:
  • Awareness: Relates to the degree of the respondent’s cognizance of his/her emotions being captured. Physiological emotion signals are considered more implicit than self-reporting that is based on the user’s subjective experience.
  • Obtrusiveness: The user’s experience of the medium. Sensors that are attached to the human body (EMG or Electrooculography EOG) have been reported to be obtrusive.
  • Invasiveness: Realistic use in real-life settings. The standard computer equipment (webcams for recording facial expressions, measuring keyboard pressure or mouse clicks from log files) considered non-invasive in contrast with the use of extra equipment (professional cameras or artificial labs) or long questionnaires for self-report.
  • Task relevance: Measurement is applied in parallel with the user’s task (real-time) without interrupting the learning process. Task irrelevance is the main flaw of self-reporting.
Other factors include the possible cost of special equipment or special expertise needed to run the equipment universality (e.g., language and cultural barriers).
Wearables that measure sympathetic autonomous nervous system (SANS) signals (i.e., heart rate, blood pressure, skin conductance), usually obtain measurements from the finger, the chest, or the hand/wrist. These sensors provide an objective measure of physiological signals with high transparency, deploying continuous monitoring of the user state, and usually, are not disruptive to task performance. They are more appropriate to detect states of high arousal like stress, anger, fear, excitement, or panic (and not affective states such as boredom), as the more intense the emotion signal, the more precise is the measurement. Normally, these metrics require special and expensive devices and technical expertise is needed to run the equipment, which is sensitive to confounding factors (e.g., heat, lighting) resulting in noisy data. Popular wearable physiological signals include [39]:
  • Electromyography: measured by the muscle response to a nerve’s stimulation of a certain muscle.
  • Electroencephalography (EEG): brain activity.
  • Galvanic Skin Response (GSR)/Electrodermal Activity/Skin Conductance (EDA or SC): record the electrical activity in the skin.
  • Electrocardiogram (ECG): heart activity (heart rate, inter-beat interval, heart rate variability).
  • Electrooculogram: eye pupil’s size and movement.
  • Blood Volume Pulse (BVP): relative blood in an area.
  • Respiration: measures rate of respiration and depth of breath.

2.2. Cognitive Load

In the 1980s, CL was used as a theoretical approach to explain experimental results with very little attempt to directly measure mental load [40]. The theory was used to predict differential learning using particular instructional designs. The first rating scale was introduced in the early 1990s by Fred Paas, to provide an overall measure of CL [41]. This measure is a subjective scale that has been extensively used showing good psychometric properties. The main advantages of subjective techniques over physiological techniques are their sensitivity and simplicity. Despite the wide use of psychometrically robust tools, there are limitations regarding the concurrent validity of self-report tools [42].
Nowadays, the most used self-report instrument is the NASA Task Load Index (NASA-TLX) [43]. The NASA-TLX is a subjective, multidimensional, and widely used assessment tool [44] that rates perceived workload. The total workload is divided into six subjective subscales: mental demand, physical demand, temporal demand, performance, effort, and frustration. Self-perceived cognitive load is rated from 0 to 100 points. The overall workload is calculated by weighting, adding, and averaging each domain rating.
CL researchers have been using real-time objective and physiological measurements as secondary task techniques. These techniques use performance on a secondary task as an indicator of CL imposed by a primary task, based on the idea of the limited capacity of the working memory. In more recent times, due to advances and availability of new technologies, physiological measurements have become more popular in CL research, specifically [45]:
  • Cardiovascular and respiratory measurements: heart rate, heart rate variability, respiratory measurements, blood volume pulse, inter-beat interval, and other cardiovascular features.
  • Eye activity: pupil dilation, blink rate, fixation, eye-tracking, and other ocular indices. Pupil diameter can be used as an indicator of informational mental strain [46]. Protective eye reflexes at first regulate the incidence of light; increasing mental strain leads to wider pupils; if the parasympathetic system is active, pupil diameter decreases; the action of the sympathetic system leads to an increase in the pupil diameter.
The blinking rate can be also used as an indicator of mental strain. A decreasing blinking rate is connected to the perception of visual information and a high interest. An increasing blinking rate is an indicator of advanced training, little interest, increasing fatigue, or non-relevant information.
  • Electrodermal and temperature measurements: Electrodermal activity (EDA) sensors measure sympathetic nervous system arousal and features related to stress, engagement, and excitement. The infrared thermophile sensor reads body skin temperature.
  • Brain activity: electroencephalography (EEG) measures electrical potential from the cortex, functional magnetic resonance imaging (fMRI) and functional near-infrared spectroscopy (fNIRS) measure changes in blood flow that occurs with brain activity.
Therefore, there is considerable evidence that supports that changes in CL can be detected by physiological measures generated by differences in task complexity. Nonetheless, physiological measurements are more sensitive than others to find CL differences across tasks; the most sensitive physiological measures are blink rates, heart rate, pupil dilations, and alpha waves. Regarding subjective measures, it is found that compared with most physiological measures, subjective measurements have a higher level of variability.

3. Materials and Methods

Unfortunately, some of the physiological measurements presented in Section 2 cannot be easily acquired while in emergency and disaster situations without interfering in FRs’ operation because of limitations of autonomy, noise, or integration with personal protective equipment (PPE). Therefore, this section describes the biosignals monitoring framework developed in accordance with FRs requirements, from the physiological variables selected to the sensors’ integration into the framework.

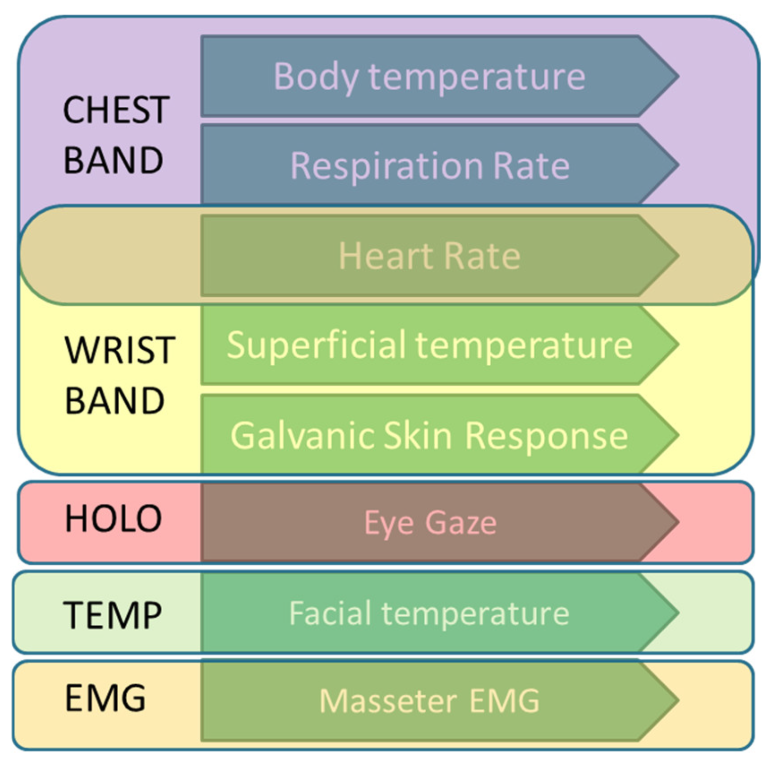
3.1. Physiological Variables Selection
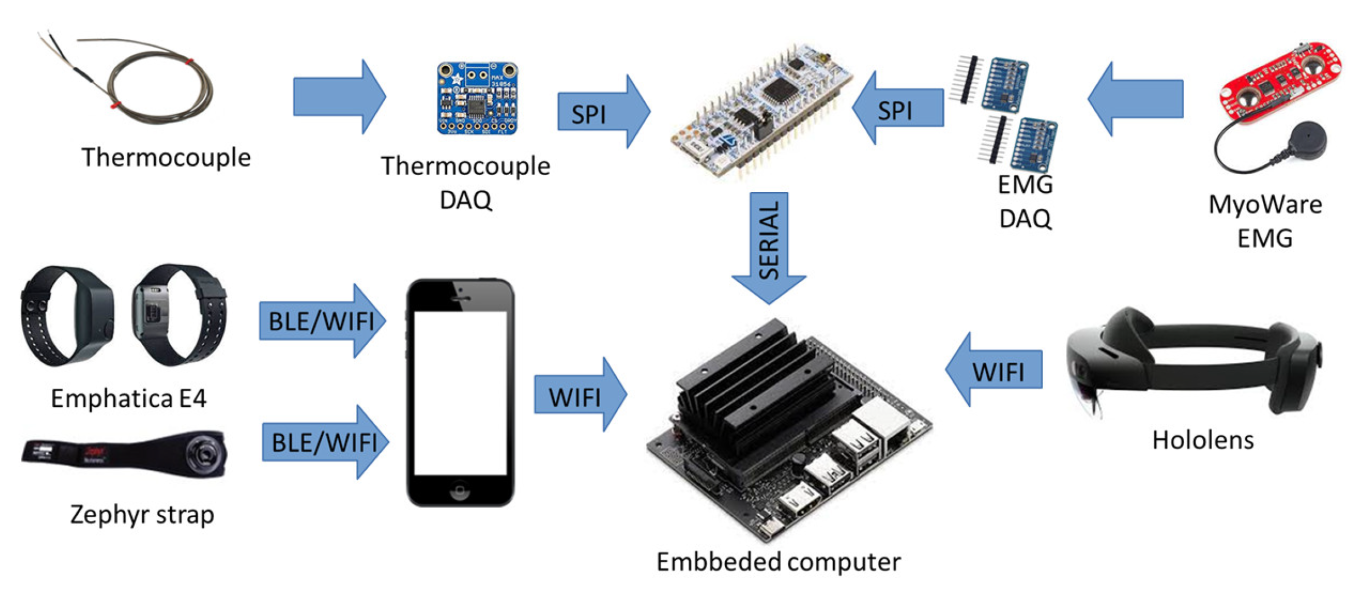
As aforementioned, several biosignals have been identified in the literature with physiological variables that correlate with physical and mental activities. Among them, the following variables are selected for monitoring: electrodermal activity (EDA), heart rate (HR), respiration rate (RR), body temperature, eye gaze, and physiological face changes.
These variables have been selected because of the following reasons. For instance, a person’s temperature is found to have a correlation with their cognitive workload [47,48]. Moreover, EDA can be exploited to predict a person’s cognitive load in real time [49]. It can also be used to ascertain whether or not a person is under stress [50]. The sympathetic nervous system controls the sweating of the skin. Depending on the sweating level, the skin resistance varies. Therefore, by measuring skin conductance, the emotional and sympathetic responses can also be measured. The human body does not have a constant number of sweat glands per cm2. The densest areas are in the hands and feet. Consequently, EDA measurements are typically collected from these areas [51].
In addition, HR is quite sensitive in discriminating mental workload [52,53]. In most modern devices, a heartbeat can be measured by using photoplethysmography (PPG). PPG sensors generally consist of two or more optical emitters which send light waves to the skin. The light is refracted as it enters the skin, and it is captured by the photodetectors. Measuring HR with PPG faces some challenges, with noise in the area where the sensor is placed being the biggest. For example, if the sensor is placed on the wrist, the light from the emitter is also scattered to other parts of the area such as skin, muscles, and tendons. Moreover, the amount of refracted light depends on the person’s skin tone (light or dark). Thus, although two people with different skin tones can have the same blood volume, the readings will be different. In addition to the optical devices, an accelerometer is used for extracting the heartbeat. Motion artifacts are introduced in the PPG measurements. With the use of an accelerometer, the motion noise can be removed from the PPG signal. Accelerometers include a mass attached in a spring. When the mass moves, the spring extracts and compresses. By measuring the spring’s compression, acceleration is measured.
Nonetheless, studies have shown that respiration rate (RR) is directly related to CL [54]. Monitoring respiratory health is possible with several methods including spirometry, full body plethysmography [55], and even arterial blood sampling. These methods work very well in laboratory environments but are difficult to use during other activities. RR can also be measured by attaching optical [56] or strain [57] sensors in the chest area. Therefore, a wearable device that can be attached to the chest is required. The device measures the differential size generated by the expansion and contraction of the thoracic cavity, calculating the RR.
The latest studies have also shown that the movement of the eyes is directly related to the CL [46]. Among them, pupillary movements are the most studied physiological aspects related to CL [58]. Unfortunately, it is not possible to measure pupillary movement on real rescue applications, because wearable sensors are not commercially mature or compatible with personal protection equipment (PPE) needed in real scenarios. Nonetheless, eye tracking is also one physiological measuring technique that has received attention over the last decades [59]. According to [60,61], it should be feasible to differentiate between the mental demands of various interfaces or system designs by depending on eye-tracking-related data.
In this context, we aim to evaluate the potential of eye-gaze as a valuable input (among others) to infer CL on FRs. Inference models would then be grounded on such indirect input to estimate FRs’ cognitive load and present information in the most suitable form. Therefore, we propose to include eye gaze monitoring to complement biosignals measurements.
Finally, the sensitivity of our face to emotions and to systemic changes is well known. Some examples of this behavior are sweat on the forehead or when the face turns red from embarrassment. Indeed, the face is a primary region for the expression of emotional states, and the surface temperature is constantly dependent on changes in the autonomous nervous system [62]. These changes cause variations in the blood perfusion on the facial skin that can be measured through different techniques. One of them is the use of thermal imaging. Another is the use of a contact-based devices, such as thermometers. The first technology poses some advantages as it is non-invasive and the temperature can be easily obtained from a certain distance. However, it also implies some issues when dealing with motion tracking and it is less reliable when trying to measure the temperature of a specific location on the face’s skin, such as the nose or the cheeks. In this regard, the use of thermometers, such as a thermocouple, produces a higher spatial resolution, is able to measure the changes in a very specific area of the face, and also provides higher robustness in dynamic contexts. In this context, there are already some studies that relate the variances in facial temperatures to the cognitive burden [63,64,65], which pose the measurement of the facial temperature of the cheek as a relevant variable for the cognitive load assessment.
On one hand, the measurement of facial temperature as a variable that can be correlated with CL has already been studied and reported in the literature [66]. The approach proposed in this paper is to measure the temperature on the cheek’s skin using a contact-based sensor. Following that approach, the temperature of the cheek’s skin can be continuously tracked.
On the other hand, the hypothesis that the electrical activity of the masseter muscle—one of the most relevant muscles involved in the movement of the jaw—may significantly change during stressful or especially cognitive-demanding situations has been already posed in the literature [63]. Therefore, as a second source of facial information, the electrical activity of the masseter muscle was proposed to be measured using superficial EMG (sEMG) sensing techniques. sEMG provides insightful information on the behavior and activation of the muscle under measurement.

3.2. Sensors

Once the more representative physiological variables have been defined, a selection of wearable devices is made. Figure 1 shows the integration of the different physiological variables defined with the wearable sensors selected.

3.2.1. Chest Band

Measurement of RR is performed by a compact physiological monitoring device, Zephyr BioModule 3 (https://www.zephyranywhere.com/system/components, accessed on 12 June 2023), which can be attached to a strap that incorporates respiration detection sensors. The strap has a pressure sensor pad that detects the expansion of the rib cage measuring the BR. Moreover, the chest band also acquires HR and body temperature. The BioModule’s battery can last about 20 h on average. The sensor data are processed internally in the device and are available to a connected device via Bluetooth. RR range is between 0 and 120 breaths per minute. HR is assumed to be stabilized by a proprietary algorithm that provides a maximum deviation of 10 bpm with ±3 bpm accuracy while running. The data from the chest band are sent to mobile phone and relayed to an embedded computer for its data integration. Although the different sensors involved provide different sampling rates (i.e., ECG at 250 Hz, 25 Hz for RR, and 1 Hz for temperature), the transmission frequency to the framework for each value is 1 Hz (see Table 1).

3.2.2. Wristband

A wristband device, Empatica E4 (https://www.empatica.com/research/e4h, accessed on 12 June 2023), has been selected to extract physiological measurements by using an EDA sensor, a PPG sensor, a temperature sensor, and a 3-axis accelerometer. Its battery lasts for more than 20 hours in streaming mode (i.e., sending data over Bluetooth). The same mobile application used for receiving data from the chest band is used for receiving data from the wristband. The EDA sensor measures the galvanic skin response (GSR) in microsiemens, and data are acquired four times per second. Wrist temperature is measured with an infrared thermometer in degrees Celsius. The accelerometer acquires the data 32 times per second. The PPG has a 64 Hz sampling frequency and measures the difference of light between oxygenated and non-oxygenated peaks. The HR is inferred from the data from the PPG sensor and the accelerometer using the deep learning model provided in [67]. HR is stabilized by the algorithm that provides 4.03 bpm as mean absolute error (MAE). Finally, HR is transmitted to the framework at 0.5 Hz and temperature and GSR at 1 Hz (see Table 1).

3.2.3. HoloLens

To extract the eye gaze position and derived features (movement and speed), the Microsoft HoloLens 2 (https://www.microsoft.com/en-us/hololens, accessed on 12 June 2023) has been selected. The glasses are already included in the RESCUER framework to provide AR capabilities to FRs [68]. Nonetheless, it also includes user’s eye gaze and dwell information for interaction purposes. Eye gaze is extracted at a 30 Hz frame rate, stored in the HoloLens temporarily and relayed to the embedded computer every 10 s to avoid sending the information continuously and prevent bandwidth limitations (see Table 1).

3.2.4. Facial Information

Facial temperature and masseter-tone activation are obtained by means of a thermocouple and a sEMG sensor, respectively. A thermocouple continuously tracks the temperature of the face by means of an acquisition board and amplifier (https://learn.adafruit.com/adafruit-max31856-thermocouple-amplifier/, accessed on 12 June 2023). The end of the thermocouple wire is positioned on the cheek and fixed with sticky tape. A Myoware sEMG (https://learn.sparkfun.com/tutorials/myoware-muscle-sensor-kit/all, accessed on 12 June 2023) sensor will record the sEMG signals at masseter’s skin surface and output it as an analog signal. Finally, a microcontroller is used to obtain both signals, at 10 Hz and 1 KHz, respectively (see Table 1), process and send them to the embedded computer.

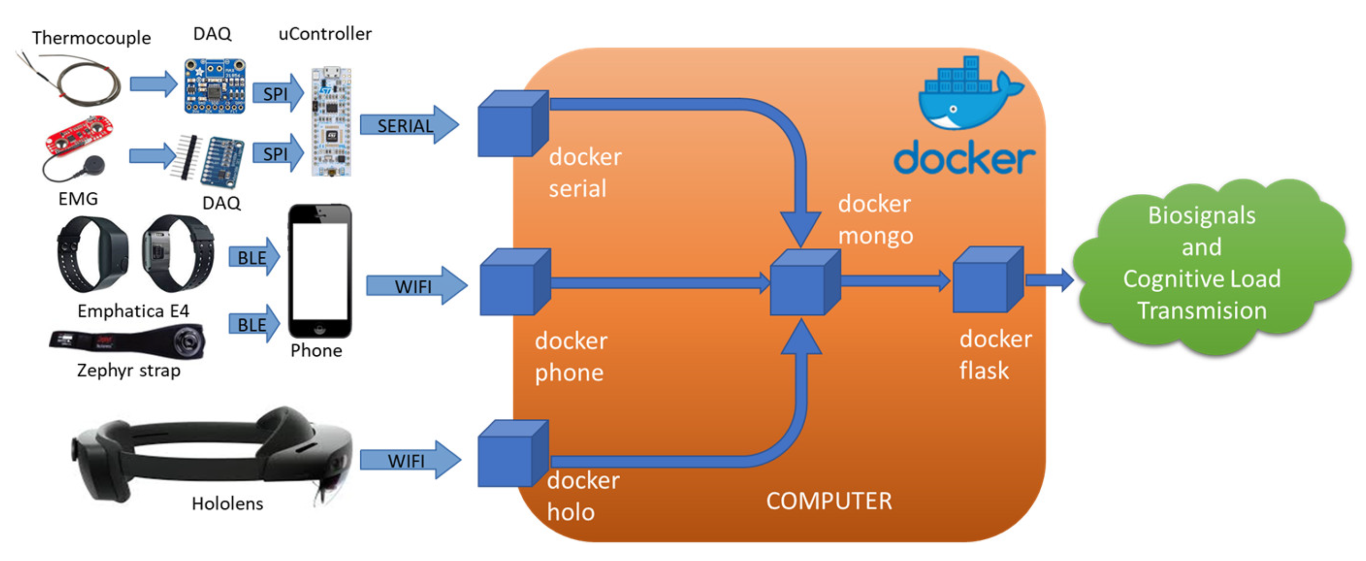
3.3. System Integration

As previously stated, the biosignals acquisition module consists of all the chosen wearable devices that collect the data from the user (i.e., E4 wristband, Zephyr chest band, HoloLens glasses, Myoware muscle sensor and a thermocouple) along with a mobile phone that connects with the wristband and chest strap, and a microcontroller that obtains information from the muscle sensor and the thermocouple (see Figure 2).
Therefore, the biosignals monitoring system is made up of three main parts. Firstly, the biosignals acquisition, where the biosignals data are collected by the wearable devices and sent to the computer following different protocols. Secondly, the control interface, where the user identifier and a control variable, that subsequently, allows or denies the data collection of all the biosignals, are inserted into the database. Finally, the actual storage of biosignals data into a database.
Once the data are extracted, the microcontroller, phone and HoloLens are the devices responsible for sending the biosignals data to the embedded computer following different protocols: serial, MQTT, and HTTP, respectively. Figure 3 shows a diagram of the architecture.
To integrate the reception of the biosignals data in the computer as independently as possible, the system is completely dockerized [69]. The control interface and the database modules are also running in separate docker containers inside the computer. Therefore, five different docker containers are created:
  • Docker-phone receives the data of the wristband and chest band sent by the phone.
  • Docker-holo receives the data sent by the HoloLens.
  • Docker-serial receives the data of the facial information sent by the microcontroller.
  • Docker-mongo runs the MongoDB database where all the incoming data are stored.
  • Docker-flask is a flask web interface to externally monitor all the processes.
Finally, the processing of the data and the assessment of the cognitive load will be carried out in a high-end computer using the database that is stored in an external docker volume during the tests.

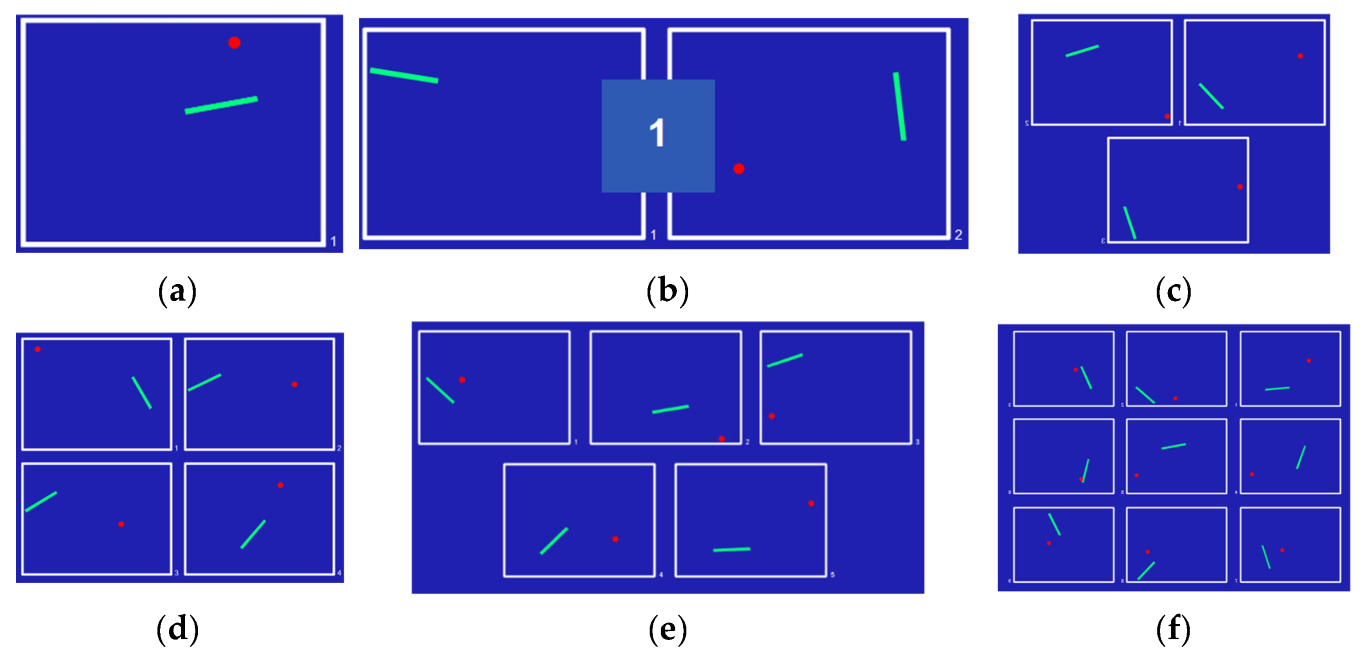
4. Experimental Tests

Two scenarios (i.e., in-lab and practice scenarios) have been designed: (i) to check the correct functioning of real-time biosignals acquisition, and (ii) to correlate biosignals monitoring with the NASA-TLX subjective questionnaires. For both scenarios, the biosignals tools described in Section 3 have been used.
The first scenario, named in-lab scenario, is devoted to divided attention tests, where users perform some exercises in front of a computer and their biosignals are recorded and monitored. Moreover, NASA-TLX questionnaires are provided at different stages to extract the biosignals of users.
The second scenario, named practice scenario, focuses on outdoor tasks to be performed in a controlled but real environment, where users must navigate through collapsing structures with visual and auditive divided attention exercises.

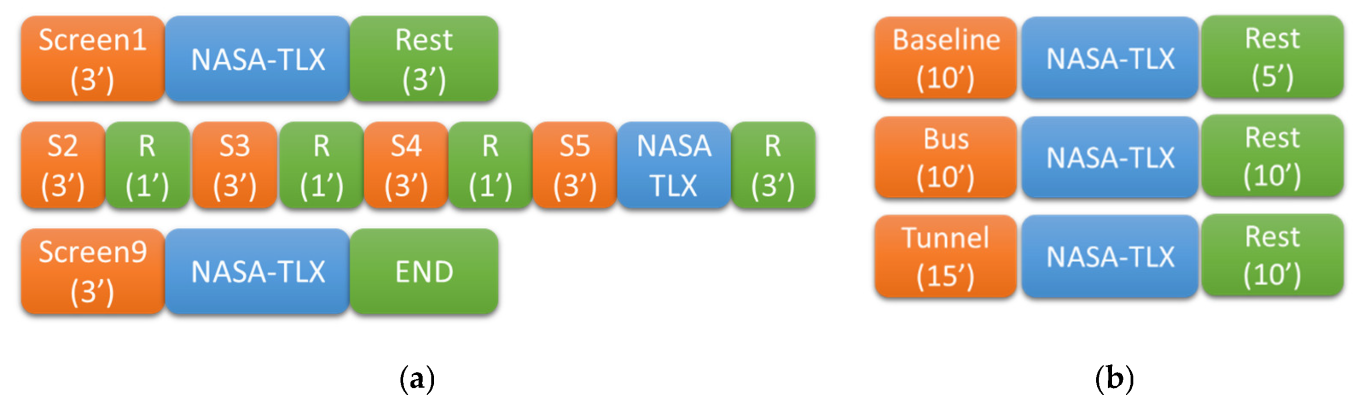
4.1. In-Lab Scenario

A total of 80 FRs (24 doctors, 29 nurses, 22 technicians, and 5 firefighters) were selected for the in-lab tests (see Table 2). They performed a CL test based on The Sky Test ATCO (https://www.skytest.com/, accessed on 12 June 2023). The Sky Test ATCO is a software tool that provides several tests aimed at improving the concentration and performance, specifically designed for air traffic controllers. One of the tests consists of a divided attention exercise that has been selected for its CL implications.
This test consists of one to nine boxes (see Figure 4) with a ball and a stick inside moving randomly. Each of the boxes has a number on its lower right corner. When the ball and the stick get in touch in a box, the volunteer must press the number of the box. The users sit in front of a computer for around 30 min with a specific sequence in three trials (see Figure 5a). The first trial is devoted to the basal approach to the divided attention test, where the user performs the experiment with one box for 3 min, fills up the NASA-TLX for the trial and rests for 3 min. This trial allows the system to obtain basal and rest information from biosignals, as well as calculating the user’s performance of the computer-based program. The second trial focuses on a sequence of four levels of difficulties with two, three, four, and five boxes with 1 min rest in between. After it, a NASA-TLX questionnaire is filled up followed by a three-minute rest. In the last trial, a three-minute test of nine boxes is performed followed by the completion of the last NASA-TLX test.

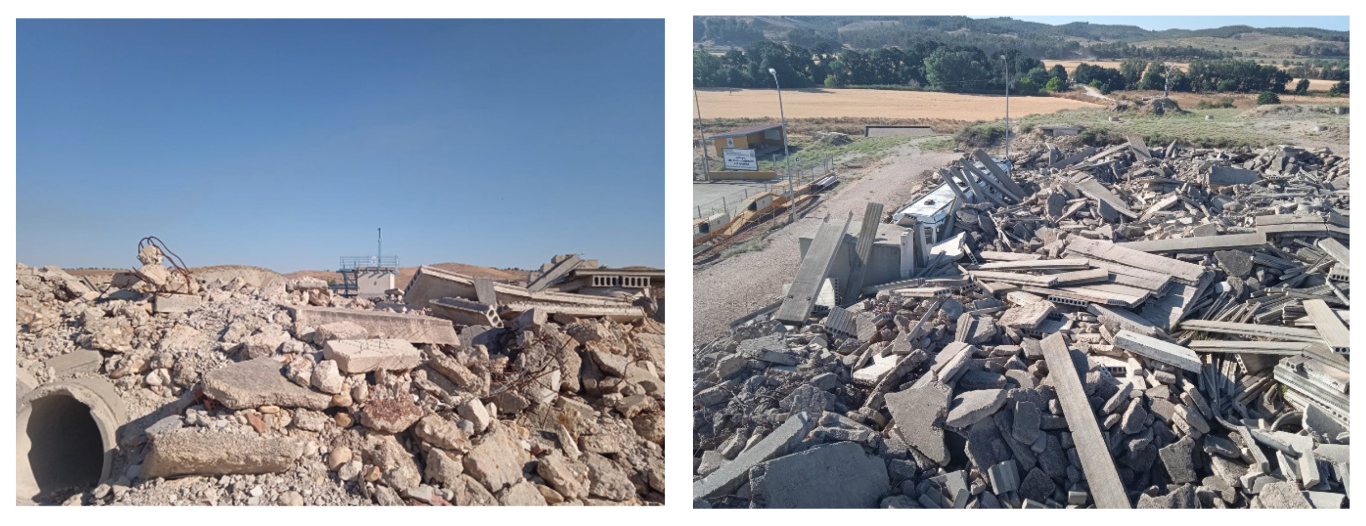
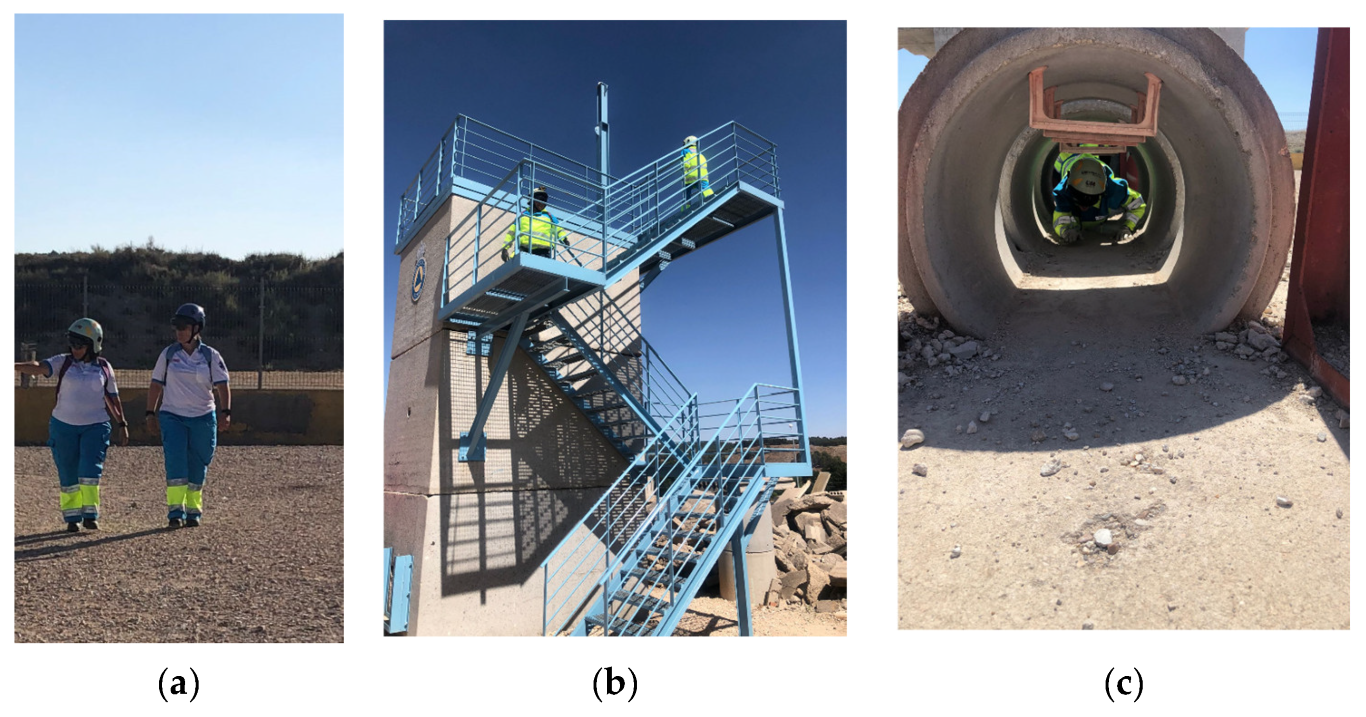
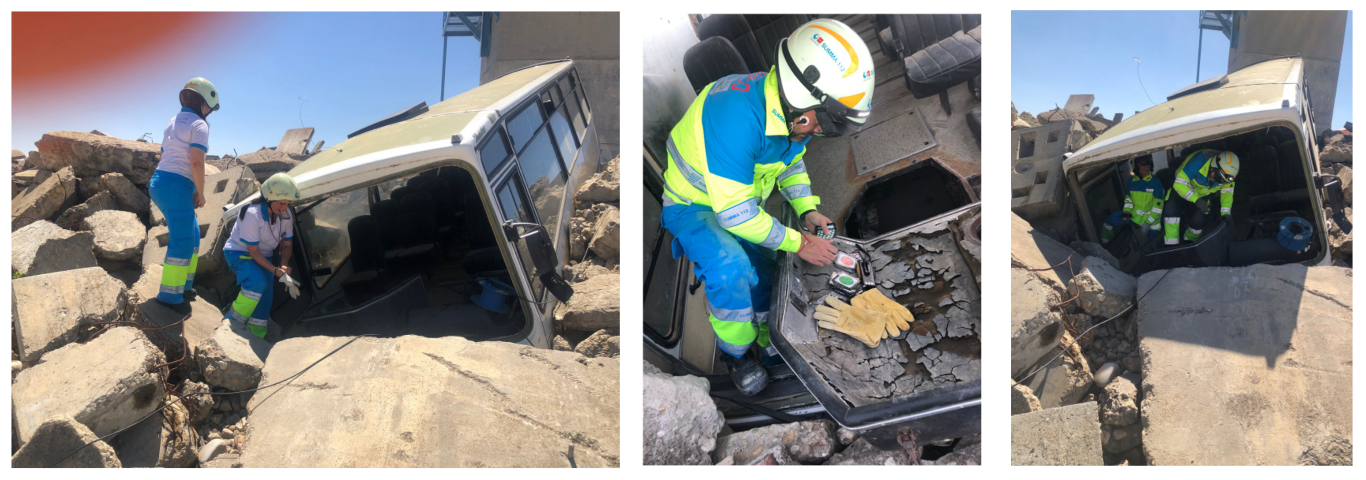
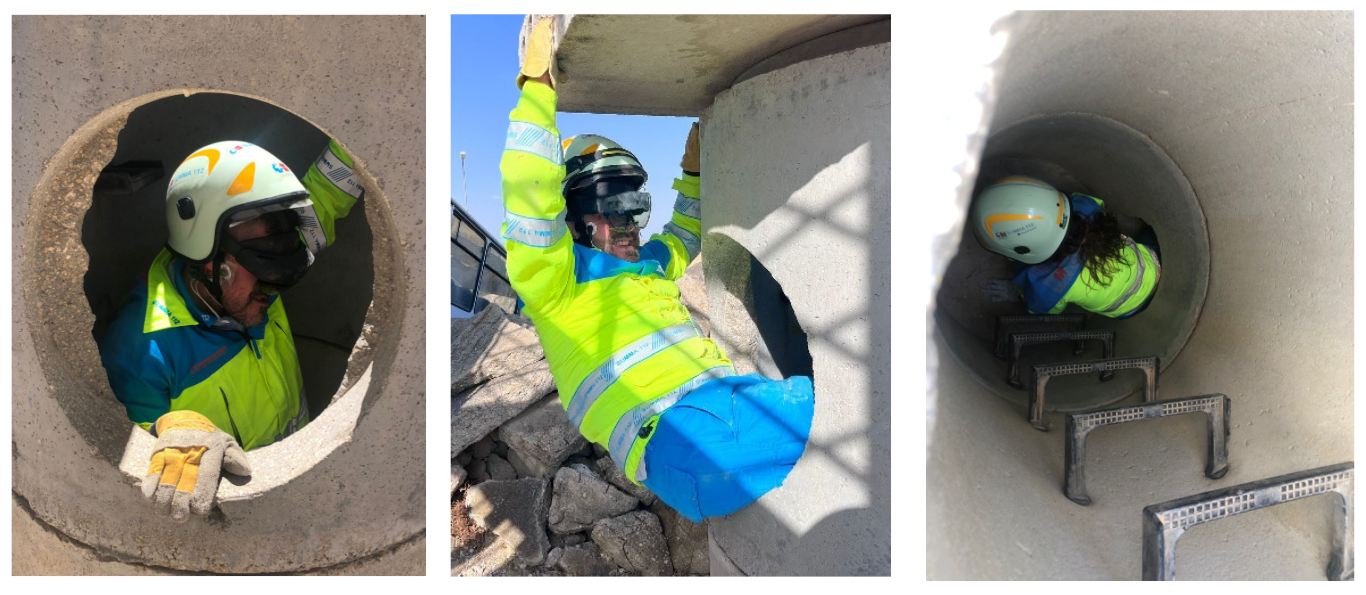
4.2. Practice Scenario

Using the same tools as in the in-lab scenario, the practice scenario simulates real operations in a collapsed structure environment (see Figure 6). A total of 24 FRs (3 doctors, 9 nurses, 10 technicians, and 2 firefighters) were selected (see Table 2). They performed a single exercise task to check biosignals baseline and then two different multi-objective tasks in a collapsed structure field.
The baseline task was a walk with the PPE (helmet, boots, intervention jacket, and trousers) and technical material (see Figure 7a), crawling in a 4 m open stretch tunnel (see Figure 7b), and climbing up and down a 6 m tower (see Figure 7c). The helmet was the same for all users to avoid differences in the HoloLens’ measurements. The rest of the elements were the ones used by the FRs in their daily activities. After the exercise, the volunteer performed a NASA TLX test to establish the biosignals baseline (see Figure 5b).
The second task was related to visual attention. The FR had to remember and find different images with shapes and colors as they enter and search a crushed and tilted bus (see Figure 8). While performing the search, each time the volunteer found a specific color card, he/she had to inform the command post about the total number of cards and how many of them were of that color. The volunteer had ten minutes to complete the task. Every two minutes he/she was informed about the time left. All the communication was made through walkie talkie. After the exercise, the volunteer performed a NASA TLX test (see Figure 5b).
The third task focused on hearing acuity and mental operations while crawling through a narrow tunnel (see Figure 9). Before the exercise, each volunteer memorized a four-digit number. The FRs were getting different instructions from the command post through the walkie talkie while they were crawling in the tunnel. In the first part of the tunnel, they were provided with a sum of two numbers of two digits each together with the result. The FR had to confirm whether or not the sum was correct. If correct, he/she continued with the exercise; if incorrect, he/she would have to go back three steps. In the second part of the tunnel, the researcher was narrating through the walkie talkie different four-digit numbers. When the number was the same as the number he/she memorized before the start, the volunteer had to say: “everything is correct, I continue with the exercise”. After the exercise, the volunteer performed a NASA TLX test (see Figure 5b).

5. Results

5.1. In-Lab Tests

At the end of the exercise, three NASA-TLX and a temporal series of six periods together with the exercise performance were recorded for every FR. Figure 10 shows an example of the HR and RR temporal series for the complete experiment, where six monitored (blue) and five rest (yellow) periods are presented.
Related to the subjective perception of the NASA-TLX, a similar pattern is followed by the 80 users. All users had a low CL on Screen 1 and a higher CL on Screen 5 (see Figure 11). However, no significant CL increase is found from Screen 5 to Screen 9. Moreover, it is quite clear that there is a big dispersion (e.g., up to 75 points out of 100 for doctors on Screen 5) in the subjective perception of the exercise, which will clearly impact the modeling of generic CL models during future FRs’ operation.
From the objective measurements, all the biosignals acquired are compared and correlated with the NASA-TLX and test performance. From the biosignals values, we processed HR, GSR, wrist temperature, respiration rate, facial temperature, EMG activation, and eye gaze speed. For every screen, the framework extracts the maximum, average, and peak-to-peak values of all biosignals’ time series. No specific information is found in the maximum and peak-to-peak values at this stage of the validation, so average values are presented hereafter. Moreover, facial temperature and EMG activation did not show any relationship with either NASA-TLX or performance of the game.
Several average tendencies have been found between the increase in complexity of the task and the biosignals acquired; between them, eye gaze speed and respiration rate vs. NASA-TLX and performance stand out. These relationships are shown in Figure 12, where the respiration rate and eye gaze speed increase in most of the groups while the divided attention test increases in complexity (see Table 3). However, these tendencies do not provide statistical differences (p > 0.05) in any FRs group or biosignals, either grouped or divided by profession.

5.2. Practice Tests

The practice scenario took place in the National School of Civil Protection (Madrid, Spain) for one week. The objective was to validate all hardware and software in a real (although practice) scenario prior to real operation with FRs. In the practice tests, there is also a strong NASA-TLX score dispersion between FRs (see Figure 13), although a bit smaller than in the in-lab test, attributed to the reduced number of the sample, especially for doctors and firefighters.
Unfortunately, no new tendencies have been found (see Table 4). Similar relationships between the RR and the eye gaze are found with regard the NASA-TLX questionnaires. As in the in-lab tests, these tendencies do not provide statistical differences (p > 0.05).
Nevertheless, it was detected during the tunnel scenario that all users need to stop crawling to verify or deny the calculations. The same applies for the bus scenario when the users had to communicate with the command post reporting the number of cards collected. This produces an increase of GSR and body temperature that correlates with the task difficulty.

6. Conclusions

This manuscript has addressed the definition of a monitoring architecture for real time biosignals acquisition and CL correlation for FRs to be used in future emergency and disaster situations. The hardware selection, software integration, and database creation have been implemented to obtain a fully functional monitoring framework that has been tested both in-lab and in field exercises.
For the biosignals hardware acquisition systems, connectivity and accuracy were the two main goals of the design. It was mandatory to obtain real-time measurements than can be acquired in isolated scenarios without connection to any cloud or server, given emergency and disaster requirements. Moreover, all elements provided different connection protocols (e.g., WiFi, Bluetooth, and USB) based on dockerized applications. However, all these applications converge to a common point, a dockerized database that stores all real-time measurements, both for its future communication to command center and FRs CL estimation.
For the cognitive load estimation, a set of in-lab and practice scenarios were planned. The trials allowed testing of the correct functioning of the biosignals monitoring hardware, software, and integration. Together with the biosignals monitoring, a set of NASA-TLX questionnaires were requested from the users. Upon technical validation, several tendencies were found between the NASA-TLX questionnaires provided by the FRs and some biosignals, especially respiration rate and eye gaze. However, this relationship does not show any statistical difference, provided the reduced number of samples in each FRs’ group. Nonetheless, this tendency envisions the usage of the framework proposed for a longer clinical trial to extract more information of FRs in operation and analyze whether CL quantification can be inferred.
Moreover, the need to stop performing the primary activity in the real practice scenario should be an important input variable for CL estimation. This variable should be acquired by the accelerometer included in the wristband or the inertial movement estimation included in the RESCUER framework, which will surely provide new lines of research.
Given the framework acquisition rate of the biosignals provided to the framework (see Table 1), it is estimated that a software running every 15 s could handle CL inference where at least five samples of the slower biosignals acquisition are collected (i.e., E4 wristband) and once the eye gaze batch is received (i.e., 10 s). Therefore, no computation problems are expected to extract the data, process it, and provide feedback to the FR to reduce the amount of information provided. Nonetheless, a longitudinal study must be planned to obtain a bigger amount of data from in-lab and real operation, where cognitive load is increased to infer a real-time model that could help modulate the information provided to FRs in operation. This modulation will allow increasing or decreasing the augmented senses (i.e., AR, augmented hearing, etc.) information that is provided to the FRs in operation, with the aim of adjusting its cognitive capabilities.

Author Contributions

Conceptualization, Á.G. and P.B.; methodology, Á.G., P.B., M.Á. and M.F.; software, V.R., C.C., X.O., I.A. and P.K.; validation, P.B., S.N., M.Á., G.I., Á.G. and V.R.; formal analysis, Á.G., P.B., S.N. and M.Á.; investigation, Á.G., P.B., V.R., C.C., X.O., M.Á., S.N., M.F., I.A., G.I., B.L.-G., P.K., I.G.O. and F.Á.; resources, F.Á., I.G.O., P.B. and M.F.; data curation, V.R. and Á.G.; writing—original draft preparation, Á.G., B.L.-G. and P.B.; writing—review and editing, Á.G., P.B., V.R., C.C., X.O., M.Á., S.N., M.F., I.A., G.I., B.L.-G., P.K., I.G.O. and F.Á.; visualization, V.R., Á.G., I.A. and X.O.; supervision, Á.G., P.B., M.F. and I.G.O.; project administration, F.Á. and Á.G.; funding acquisition, F.Á., P.B., I.G.O. and M.F. All authors have read and agreed to the published version of the manuscript.

Funding

This research has been supported by the European Commission within the context of the project RESCUER, funded under EU H2020 Grant Agreement 101021836.

Institutional Review Board Statement

The study was conducted in accordance with the Declaration of Helsinki and approved by the Research Ethics Committee of University of West Attica (protocol code 50150, 28th June 2021).

Informed Consent Statement

Informed consent was obtained from all subjects involved in the study.

Data Availability Statement

Data are unavailable due to privacy and ethical restrictions.

Conflicts of Interest

The authors declare no conflict of interest.

References

  1. Lv, Z.; Li, Y. Wearable Sensors for Vital Signs Measurement: A Survey. J. Sens. Actuator Netw. 2022, 11, 19. [Google Scholar] [CrossRef]
  2. Lucke, J.A.; De Gelder, J.; Blomaard, L.C.; Heringhaus, C.; Alsma, J.; Schuit, S.C.E.K.N.; Brink, A.; Anten, S.; Blauw, G.J.; De Groot, B.; et al. Vital signs and impaired cognition in older emergency department patients: The APOP study. PLoS ONE 2019, 14, e0218596. [Google Scholar] [CrossRef] [PubMed]
  3. Kebe, M.; Gadhafi, R.; Mohammad, B.; Sanduleanu, M.; Saleh, H.; Al-Qutayri, M. Human vital signs detection methods and potential using radars: A Review. Sensors 2020, 20, 1454. [Google Scholar] [CrossRef] [PubMed] [Green Version]
  4. Stuart, T.; Hanna, J.; Gutruf, P. Wearable devices for continuous monitoring of biosignals: Challenges and opportunities. APL Bioeng. 2022, 6, 021502. [Google Scholar] [CrossRef] [PubMed]
  5. Leenen, J.P.; Leerentveld, C.; van Dijk, J.D.; van Westreenen, H.L.; Schoonhoven, L.; Patijn, G.A. Current evidence for continuous vital signs monitoring by wearable wireless devices in hospitalized adults: Systematic Review. J. Med. Internet Res. 2020, 22, e18636. [Google Scholar] [CrossRef] [PubMed]
  6. Ray, T.; Choi, J.; Reeder, J.; Lee, S.P.; Aranyosi, A.J.; Ghaffari, R.; Rogers, J.A. Soft, skin-interfaced wearable systems for sports science and analytics. Curr. Opin. Biomed. Eng. 2019, 9, 47–56. [Google Scholar] [CrossRef]
  7. Dunn, J.; Kidzinski, L.; Runge, R.; Witt, D.; Hicks, J.L.; Rose, S.M.S.-F.; Li, X.; Bahmani, A.; Delp, S.L.; Hastie, T.; et al. Wearable sensors enable personalized predictions of clinical laboratory measurements. Nat. Med. 2021, 27, 1105–1112. [Google Scholar] [CrossRef]
  8. Grothe, J.; Tucker, S.; Blake, A.; Achutan, C.; Medcalf, S.; Suwondo, T.; Fruhling, A.; Yoder, A. Exploring First Responders’ Use and Perceptions on Continuous Health and Environmental Monitoring. Int. J. Environ. Res. Public Health 2023, 20, 4787. [Google Scholar] [CrossRef]
  9. Prabhu, M.; Sai Shibu, N.B.; Rao, S.N. Rescutrack: An edge computing-enabled Vitals Monitoring System for first responders. In Proceedings of the 2022 IEEE 3rd Global Conference for Advancement in Technology (GCAT), Bangalore, India, 7–9 October 2022. [Google Scholar] [CrossRef]
  10. Katiyar, K.; Kumari, P.; Srivastava, A. Interpretation of Biosignals and Application in Healthcare. In Information and Communication Technology (ICT) Frameworks in Telehealth; Mittal, M., Battineni, G., Eds.; TELe-Health; Springer: Cham, Switzerland, 2022. [Google Scholar] [CrossRef]
  11. Pluntke, U.; Gerke, S.; Sridhar, A.; Weiss, J.; Michel, B. Evaluation and classification of physical and psychological stress in firefighters using heart rate variability. In Proceedings of the 2019 41st Annual International Conference of the IEEE Engineering in Medicine and Biology Society (EMBC), Berlin, Germany, 23–27 July 2019. [Google Scholar] [CrossRef]
  12. Longo, L.; Wickens, C.D.; Hancock, G.; Hancock, P.A. Human Mental Workload: A Survey and a Novel Inclusive Definition. Front. Psychol. 2022, 13, 883321. [Google Scholar] [CrossRef]
  13. Reimer, B.; Mehler, B. The impact of cognitive workload on physiological arousal in young adult drivers: A field study and simulation validation. Ergonomics 2011, 54, 932–942. [Google Scholar] [CrossRef]
  14. Picard, R.W.; Vyzas, E.; Healey, J. Toward machine emotional intelligence: Analysis of affective physiological state. IEEE Trans. Pattern Anal. Mach. Intell. 2001, 23, 1175–1191. [Google Scholar] [CrossRef] [Green Version]
  15. Chen, S.; Epps, J. Automatic classification of eye activity for cognitive load measurement with emotion interference. Comput. Methods Programs Biomed. 2013, 110, 111–124. [Google Scholar] [CrossRef] [PubMed]
  16. Greenberg, K.; Zheng, R. Cognitive load theory and its measurement: A study of secondary tasks in relation to working memory. J. Cogn. Psychol. 2022, 34, 497–515. [Google Scholar] [CrossRef]
  17. Rai, A.A.; Ahirwal, M.K. Electroencephalogram-Based Cognitive Load Classification during Mental Arithmetic Task; Lecture Notes in Electrical Engineering; Springer: Singapore, 2022; pp. 479–487. [Google Scholar] [CrossRef]
  18. Ayres, P.; Lee, J.Y.; Paas, F.; van Merrienboer, J.J.G. The Validity of Physiological Measures to Identify Differences in Intrinsic Cognitive Load. Front. Psychol. 2021, 12, 702538. [Google Scholar] [CrossRef] [PubMed]
  19. Cooper, G. Cognitive load theory as an aid for instructional design. Australas. J. Educ. Technol. 1990, 6, 108–113. [Google Scholar] [CrossRef] [Green Version]
  20. Biondi, F.N.; Saberi, B.; Graf, F.; Cort, J.; Pillai, P.; Balasingam, B. Distracted worker: Using pupil size and blink rate to detect cognitive load during manufacturing tasks. Appl. Ergon. 2023, 106, 103867. [Google Scholar] [CrossRef]
  21. Sweller, J.; van Merriënboer, J.J.G.; Paas, F. Cognitive Architecture and Instructional Design: 20 Years Later. Educ. Psychol. Rev. 2019, 31, 261–292. [Google Scholar] [CrossRef] [Green Version]
  22. Van Merriënboer, J.J.G.; Kirschner, P.A. Ten Steps to Complex Learning: A Systematic Approach to Four-Component Instructional Design, 3rd ed.; Routledge: New York, NY, USA, 2018. [Google Scholar]
  23. Workman, M. Cognitive styles and the effects of stress from cognitive load and time pressures on judgemental decision making with learning simulations: Implications for HRD. Int. J. Hum. Resour. Dev. Manag. 2016, 16, 30–46. [Google Scholar] [CrossRef]
  24. Lyell, D.; Magrabi, F.; Coiera, E. The Effect of Cognitive Load and Task Complexity on Automation Bias in Electronic Prescribing. Hum. Factors J. Hum. Factors Ergon. Soc. 2018, 60, 1008–1021. [Google Scholar] [CrossRef]
  25. Schaefer, M.; Rumpel, F.; Sadrieh, A.; Reimann, M.; Denke, C. Personal involvement is related to increased search motivation and associated with activity in left BA44—A pilot study. Front. Hum. Neurosci. 2015, 9, 144. [Google Scholar] [CrossRef] [Green Version]
  26. Fruhling, A.; Reisher, E. Assessing Decision Makers’ cognitive Load for a First Responder Health Monitoring System. SAIS Proceedings, 30. 2022. Available online: https://aisel.aisnet.org/cgi/viewcontent.cgi?article=1029&context=sais2022 (accessed on 18 June 2023).
  27. Hudlicka, E. To feel or not to feel: The role of affect in human–computer interaction. Int. J. Hum. Comput. Stud. 2003, 59, 1–32. [Google Scholar] [CrossRef]
  28. Larraga-García, B.; Quintana-Díaz, M.; Gutiérrez, Á. Simulation-Based Education in Trauma Management: A Scoping Review. Int. J. Environ. Res. Public Health 2022, 19, 13546. [Google Scholar] [CrossRef] [PubMed]
  29. Lillywhite, B.; Wolbring, G. Emergency and Disaster Management, Preparedness, and Planning (EDMPP) and the ‘Social’: A Scoping Review. Sustainability 2022, 14, 13519. [Google Scholar] [CrossRef]
  30. Khanal, S.; Medasetti, U.S.; Mashal, M.; Savage, B.; Khadka, R. Virtual and Augmented Reality in the Disaster Management Technology: A Literature Review of the Past 11 years. Front. Virtual Real. 2022, 3, 843195. [Google Scholar] [CrossRef]
  31. Regal, G.; Murtinger, M.; Schrom-Feiertag, H. Augmented CBRNE Responder-Directions for Future Research. In Proceedings of the 13th Augmented Human International Conference (AH2022), Winnipeg, MB, Canada, 26–27 May 2022; Association for Computing Machinery: New York, NY, USA, 2022; Article 10; pp. 1–4. [Google Scholar] [CrossRef]
  32. Reuter, C.; Ludwig, T.; Pipek, V. Ad Hoc Participation in Situation Assessment: Supporting Mobile Collaboration in Emergencies. ACM Trans. Comput.-Hum. Interact. 2014, 21, 1–26. [Google Scholar] [CrossRef]
  33. Buchner, J.; Buntins, K.; Kerres, M. The impact of augmented reality on cognitive load and performance: A systematic review. J. Comput. Assist. Learn. 2021, 38, 285–303. [Google Scholar] [CrossRef]
  34. Steffen, J.H.; Gaskin, J.E.; Meservy, T.O.; Jenkins, J.L. The Missing Framework for Virtually Assisted Activities. In Proceedings of the International Conference on Information Systems, Seoul, Republic of Korea, 10–13 December 2017; Available online: https://dblp.org/rec/conf/icis/SteffenGMJ17 (accessed on 18 June 2023).
  35. Mirbabaie, M.; Fromm, J. Reducing the Cognitive Load of Decision-Makers in Emergency Management through Augmented Reality. In Proceedings of the 27th European Conference on Information Systems (ECIS), Stockholm & Uppsala, Sweden, 8–14 June 2019; Available online: https://aisel.aisnet.org/ecis2019_rip/50 (accessed on 18 June 2023).
  36. Mayer, R.E.; Fiorella, L. Principles for Reducing Extraneous Processing in Multimedia Learning: Coherence, Signaling, Redundancy, Spatial Contiguity, and Temporal Contiguity Principles. In The Cambridge Handbook of Multimedia Learning, 2nd ed.; Mayer, R.E., Ed.; Cambridge University Press: Cambridge, UK, 2014; pp. 279–315. [Google Scholar] [CrossRef]
  37. Ortony, A.; Clore, G.L.; Collins, A. The Cognitive Structure of Emotions; Cambridge University Press: Cambridge, UK, 1988. [Google Scholar] [CrossRef] [Green Version]
  38. Feidakis, M. A Review of Emotion-Aware Systems for e-Learning in Virtual Environments. In Formative Assessment, Learning Data Analytics and Gamification; Elsevier: Amsterdam, The Netherlands, 2016; pp. 217–242. [Google Scholar] [CrossRef]
  39. Feidakis, M.; Rangoussi, M.; Kasnesis, P.; Patrikakis, C.; Kogias, D.; Charitopoulos, A. Affective Assessment in Distance Learning: A Semi-explicit Approach. Int. J. Technol. Learn. 2019, 26, 19–34. [Google Scholar] [CrossRef]
  40. Owen, E.; Sweller, J. What do students learn while solving mathematics problems? J. Educ. Psychol. 1985, 77, 272–284. [Google Scholar] [CrossRef]
  41. Paas, F.G.W.C. Training strategies for attaining transfer of problem-solving skill in statistics: A cognitive-load approach. J. Educ. Psychol. 1992, 84, 429–434. [Google Scholar] [CrossRef]
  42. Naismith, L.M.; Cheung, J.J.H.; Ringsted, C.; Cavalcanti, R.B. Limitations of subjective cognitive load measures in simulation-based procedural training. Med. Educ. 2015, 49, 805–814. [Google Scholar] [CrossRef]
  43. Brian Gore. NASA-TLX—Task Load Index. Available online: https://humansystems.arc.nasa.gov/groups/TLX/ (accessed on 15 December 2020).
  44. Galy, E.; Cariou, M.; Mélan, C. What is the relationship between mental workload factors and cognitive load types? Int. J. Psychophysiol. 2012, 83, 269–275. [Google Scholar] [CrossRef] [PubMed]
  45. Ayres, P. Something old, something new from cognitive load theory. Comput. Human Behav. 2020, 113, 106503. [Google Scholar] [CrossRef]
  46. Chen, S.; Epps, J. Using Task-Induced Pupil Diameter and Blink Rate to Infer Cognitive Load. Human Comput. Interact. 2014, 29, 390–413. [Google Scholar] [CrossRef]
  47. Kimura, T.; Takemura, N.; Nakashima, Y.; Kobori, H.; Nagahara, H.; Numao, M.; Shinohara, K. Warmer Environments Increase Implicit Mental Workload Even If Learning Efficiency Is Enhanced. Front. Psychol. 2020, 11, 568. [Google Scholar] [CrossRef]
  48. Ashworth, E.T.; Cotter, J.D.; Kilding, A.E. Impact of elevated core temperature on cognition in hot environments within a military context. Eur. J. Appl. Physiol. 2021, 121, 1061–1071. [Google Scholar] [CrossRef]
  49. Saitis, C.; Parvez, M.Z.; Kalimeri, K. Cognitive Load Assessment from EEG and Peripheral Biosignals for the Design of Visually Impaired Mobility Aids. Wirel. Commun. Mob. Comput. 2018, 2018, 8971206. [Google Scholar] [CrossRef] [Green Version]
  50. Setz, C.; Arnrich, B.; Schumm, J.; La Marca, R.; Tröster, G.; Ehlert, U. Discriminating Stress From Cognitive Load Using a Wearable EDA Device. IEEE Trans. Inf. Technol. Biomed. 2009, 14, 410–417. [Google Scholar] [CrossRef]
  51. Boucsein, W. Electrodermal Activity; Springer: Boston, MA, USA, 2012. [Google Scholar] [CrossRef]
  52. Trutschel, U.; Heinze, C.; Sirois, B.; Golz, M.; Sommer, D.; Edwards, D. Heart Rate Measures Reflect the Interaction of Low Mental Workload and Fatigue during Driving Simulation. In Proceedings of the 4th International Conference on Automotive User Interfaces and Interactive Vehicular Applications, Portsmouth, UK, 17–19 October 2012; pp. 261–264. [Google Scholar] [CrossRef]
  53. Solhjoo, S.; Haigney, M.C.; McBee, E.; van Merrienboer, J.J.G.; Schuwirth, L.; Artino, A.R., Jr.; Battista, A.; Ratcliffe, T.A.; Lee, H.D.; Durning, S.J. Heart Rate and Heart Rate Variability Correlate with Clinical Reasoning Performance and Self-Reported Measures of Cognitive Load. Sci. Rep. 2019, 9, 14668. [Google Scholar] [CrossRef]
  54. Hidalgo-Muñoz, A.R.; Béquet, A.J.; Astier-Juvenon, M.; Pépin, G.; Fort, A.; Jallais, C.; Tattegrain, H.; Gabaude, C. Respiration and Heart Rate Modulation Due to Competing Cognitive Tasks While Driving. Front. Hum. Neurosci. 2019, 12, 525. [Google Scholar] [CrossRef]
  55. Criée, C.; Sorichter, S.; Smith, H.; Kardos, P.; Merget, R.; Heise, D.; Berdel, D.; Köhler, D.; Magnussen, H.; Marek, W.; et al. Body plethysmography—Its principles and clinical use. Respir. Med. 2011, 105, 959–971. [Google Scholar] [CrossRef]
  56. Singh, G.; Tee, A.; Trakoolwilaiwan, T.; Taha, A.; Olivo, M. Method of respiratory rate measurement using a unique wearable platform and an adaptive optical-based approach. Intensiv. Care Med. Exp. 2020, 8, 15. [Google Scholar] [CrossRef]
  57. Chu, M.; Nguyen, T.; Pandey, V.; Zhou, Y.; Pham, H.N.; Bar-Yoseph, R.; Radom-Aizik, S.; Jain, R.; Cooper, D.M.; Khine, M. Respiration rate and volume measurements using wearable strain sensors. NPJ Digit. Med. 2019, 2, 8. [Google Scholar] [CrossRef] [Green Version]
  58. Brunken, R.; Plass, J.L.; Leutner, D. Direct Measurement of Cognitive Load in Multimedia Learning. Educ. Psychol. 2003, 38, 53–61. [Google Scholar] [CrossRef]
  59. Lallé, S.; Conati, C.; Carenini, G. Prediction of individual learning curves across information visualizations. User Model. User-Adapt. Interact. 2016, 26, 307–345. [Google Scholar] [CrossRef]
  60. Anderson, E.W.; Potter, K.C.; Matzen, L.E.; Shepherd, J.F.; Preston, G.A.; Silva, C.T. A User Study of Visualization Effectiveness Using EEG and Cognitive Load. Comput. Graph. Forum 2011, 30, 791–800. [Google Scholar] [CrossRef]
  61. Cole, M.J.; Gwizdka, J.; Liu, C.; Belkin, N.J.; Zhang, X. Inferring user knowledge level from eye movement patterns. Inf. Process. Manag. 2013, 49, 1075–1091. [Google Scholar] [CrossRef] [Green Version]
  62. Sonkusare, S.; Ahmedt-Aristizabal, D.; Aburn, M.J.; Nguyen, V.T.; Pang, T.; Frydman, S.; Denman, S.; Fookes, C.; Breakspear, M.; Guo, C.C. Detecting changes in facial temperature induced by a sudden auditory stimulus based on deep learning-assisted face tracking. Sci. Rep. 2019, 9, 4729. [Google Scholar] [CrossRef] [PubMed] [Green Version]
  63. Dias, R.D.; Ngo-Howard, M.C.; Boskovski, M.T.; Zenati, M.; Yule, S.J. Systematic review of measurement tools to assess surgeons’ intraoperative cognitive workload. Br. J. Surg. 2018, 105, 491–501. [Google Scholar] [CrossRef]
  64. Cardone, D.; Perpetuini, D.; Filippini, C.; Mancini, L.; Nocco, S.; Tritto, M.; Rinella, S.; Giacobbe, A.; Fallica, G.; Ricci, F.; et al. Classification of Drivers’ Mental Workload Levels: Comparison of Machine Learning Methods Based on ECG and Infrared Thermal Signals. Sensors 2022, 22, 7300. [Google Scholar] [CrossRef] [PubMed]
  65. Perpetuini, D.; Filippini, C.; Nocco, S.; Tritto, M.; Cardone, D.; Merla, A. A Machine Learning Approach to Classify Driver Mental Workload as Assessed by Electroencephalography through Infrared Thermal Imaging. In Proceedings of the 2022 E-Health and Bioengineering Conference (EHB), Iasi, Romania, 17–18 November 2022; pp. 1–4. [Google Scholar] [CrossRef]
  66. Lin, C.J.; Lukodono, R.P. Classification of mental workload in Human-robot collaboration using machine learning based on physiological feedback. J. Manuf. Syst. 2022, 65, 673–685. [Google Scholar] [CrossRef]
  67. Kasnesis, P.; Toumanidis, L.; Burrello, A.; Chatzigeorgiou, C.; Patrikakis, C.Z. Multi-Head Cross-Attentional PPG and Motion Signal Fusion for Heart Rate Estimation. In Proceedings of the IEEE International Conference on Acoustics, Speech and Signal Processing, Rhodes Island, Greece, 4–10 June 2023. [Google Scholar]
  68. Palumbo, A. Microsoft HoloLens 2 in Medical and Healthcare Context: State of the Art and Future Prospects. Sensors 2022, 22, 7709. [Google Scholar] [CrossRef] [PubMed]
  69. Swani, L.; Tyagi, P. Dockerization (Replacement of VMs). Int. Res. J. Eng. Technol. 2017. Available online: www.irjet.net (accessed on 4 January 2023).
Figure 1. Sensor selections related to the physiological variables.
Applsci 13 07368 g001
Figure 2. Sensors’ architecture and connection to the embedded computer.
Applsci 13 07368 g002
Figure 3. Biosignals monitoring software architecture.
Applsci 13 07368 g003
Figure 4. Divided attention in-lab scenario screens. (a) 1 screen, (b) 2 screens, (c) 3 screens, (d) 4 screens, (e) 5 screens, and (f) 9 screens.
Applsci 13 07368 g004
Figure 5. Protocol established for the (a) in-lab tests and (b) practice scenario.
Applsci 13 07368 g005
Figure 6. Images of the collapsed structures for the practice scenario.
Applsci 13 07368 g006
Figure 7. (a) Walk, (b) tower structure climb, and (c) open tunnel crawl exercises of the practice scenario.
Applsci 13 07368 g007
Figure 8. Tilted bus visual test images.
Applsci 13 07368 g008
Figure 9. Narrow tunnel for practice scenario.
Applsci 13 07368 g009
Figure 10. In-lab test. Time series example acquisition for a complete task performed by a random user.
Applsci 13 07368 g010
Figure 11. In-lab test. NASA-TLX score comparison along the different in-lab screens divided by occupation group. Outliers are represented as diamonds.
Applsci 13 07368 g011
Figure 12. In-lab test. Biosignals values evolution between screens divided by occupation group: (a) respiration rate and (b) eye gaze speed. Outliers are represented as diamonds.
Applsci 13 07368 g012
Figure 13. In-lab test. NASA-TLX score comparison along the different practice tasks divided by occupation group. Outliers are represented as diamonds.
Applsci 13 07368 g013
Table 1. Sensors’ data acquisition frequency and data sample rate sent to the framework.
SensorFramework
MeasurementFrequency (Hz)MeasurementFrequency (Hz)
Chest BandTemperature1Temperature1
Respiration Rate25Respiration Rate1
ECG250Heart Rate1
WristbandAccelerometer32Heart Rate0.5
PPG64Temperature1
EDA4GSR1
HoloLensEye Gaze30Eye Gaze30
FacialTemperature10Temperature10
EMG1000EMG1000
Table 2. Profession, gender, age, and years of experience of the FRs involved in the in-lab and practice scenarios.
ProfessionNumberAge (Years)Experience (Years)
MaleFemale(Mean ± Std)(Mean ± Std)
In-Lab
Scenario
Doctors61847.50 ± 7.3320.38 ± 7.67
Nurses92045.34 ± 4.9422.14 ± 5.40
Technicians2646.59 ± 7.6319.32 ± 7.53
Firefighters5039.40 ± 7.919.60 ± 9.85
Practice
Scenario
Doctors1241.67 ± 5.7315.00 ± 7.12
Nurses3642.33 ± 6.8618.89 ± 6.23
Technicians8040.75 ± 10.4913.88 ± 8.18
Firefighters5033.33 ± 2.871.67 ± 0.47
Table 3. In-lab test. Biosignals correlation with NASA-TLX and performance.
RRHRGSRBody TemperatureEye Gaze
NASA-TLX0.82520.72480.53340.31950.7605
Performance0.53440.67410.63560.59680.5344
Table 4. Practice test. Biosignals correlation with NASA-TLX.
RRHRGSRBody TemperatureEye Gaze
NASA-TLX0.89760.50200.64650.66510.8608
Disclaimer/Publisher’s Note: The statements, opinions and data contained in all publications are solely those of the individual author(s) and contributor(s) and not of MDPI and/or the editor(s). MDPI and/or the editor(s) disclaim responsibility for any injury to people or property resulting from any ideas, methods, instructions or products referred to in the content.

