Abstract
Background: Simulated microgravity (SMG) has not been well characterized in terms of its impact on cell division structures. This research aimed to assess the changes in cell division in Chang liver cells (CCL-13 cells) under SMG conditions. Methods: CCL-13 cells were exposed to SMG conditions via a 3D clinostat for 72 h. The cells from the control group were kept under the same conditions, without exposure to SMG. The changes in cell division were assessed via cell cycle progression analysis, the transcript expression of the genes associated with the cell cycle, and the appearance of the contractile ring, microvilli, and spindle in CCL-13 cells. Results: The CCL-13 cells from both the control group and the SMG group exhibited a typical epithelial-like shape. The CCL-13 cells of both groups displayed normal nuclear morphologies and were devoid of fragmentation and condensation, which are signs of apoptosis. There were changes in the cell cycle of CCL-13 cells in the SMG condition, which were shown via an increase in the cell percentage in the G0/G1 phase and a decrease in the S phase and G2/M phase. The cell area of the SMG-exposed CCl-13 cells increased, while their nuclear area decreased, which led to a reduction in the nuclear/cytoplasmic ratio. Moreover, the transcript expression of cyclin b1, cyclin d1, cdk2, and cdk6 was downregulated in CCL-13 cells under SMG conditions compared to the control group. Interestingly, SMG-exposed CCL-13 cells exhibited a decreased appearance of microvilli, changes in the formation of the contractile ring, and polar spindle microtubules during cytokinesis. Conclusions: SMG attenuated the cell division of CCL-13 cells by driving cells into the arrest phase and altering the cell division structures.
1. Introduction
Throughout the evolution of life on Earth, both physical and biological processes have been influenced by gravity [1]. Over time, gravity affects natural selection by limiting the size of an organism to an acceptable range. In order to cope with gravity, living organisms must develop support systems such as properly supported motor structures, rigid cell membranes, and the regulation of fluid flow in the body [2]. Many devices have been developed and used on Earth to simulate microgravity conditions, such as rotating wall vessels, clinostats, and random positioning machines [3].
Microgravity also acts on many different types of cells. It can alter proliferation [4] and differentiation [5], or change the composition of the extracellular matrix [6], adhesions, and the migration of cells [7]. SMG has been reported to reduce the movement and invasion of several cancer cell lines, especially inhibiting the proliferation of lymphocytes [8]. The proliferation of L-540 and HDLM-2 cell lines was inhibited by SMG conditions [9]. Proliferative inhibition was also observed in HepG2 exposed to SMG [10]. The alteration of cell division is one of the significant reasons for proliferative changes in cells. Earlier research has shown that the reduced rotation in microgravity results in a reduction in apoptosis, with only minor alterations in the growth factors regulating cell division [11]. Cancer cell lines exposed to microgravity display severe disruption of the cell cycle and the microRNA gene networks, according to expression profiling research [12]. The implications of SMG for cell division, however, have not been thoroughly studied. The effects of SMG on the formation of the contractile ring, the polar spindle microtubules, and spindle formation have not been well described during cytokinesis. Cytokinesis is the process by which the cytoplasm is divided once the genetic material is equally divided among the daughter cells [13]. Malfunctions of cytokinesis can lead to abnormalities in cell division, such as the positioning of the division plane, cleavage furrow ingression, midbody formation, and abscission [14]. Cells are very sensitive to changes in simulated microgravity [15,16], especially in the cytoskeletal structure and the orientation of cell division [17,18,19]. This research was conducted to determine how CCL-13 cell division changes under SMG, demonstrated by the alteration in the cell cycle, changes in the cell area and nuclear area, changes in the nuclear/cytoplasmic ratio, and changes in the transcript expression of genes associated with the cell cycle. Moreover, this study also assessed the morphology of divided cells, such as cell shape and microvilli appearance, and assessed cleavage furrow formation and the polar spindle microtubules that contribute to cell division during cytokinesis.
2. Materials and Methods
2.1. Cell Thawing
DMEM/Ham’s F-12 medium (DMEM-12-A, Capricorn Scientific, Ebsdorfergrund, Germany) containing 15% fetal bovine serum (FBS-HI-22B, Capricorn Scientific, Ebsdorfergrund, Germany) and 1% penicillin/streptomycin (PS-B, Capricorn Scientific, Ebsdorfergrund, Germany) was used to cultivate CCL-13 cells. The frozen CCL-13 cells were rapidly taken out of liquid nitrogen and incubated at 37 °C in a water bath for 30 s. One mL of frozen cells was mixed with 4 mL cell culture medium in a 15 mL tube; then, the cells were centrifuged at 1500 rpm (revolutions per minute) for 5 min. The medium was removed and the cell pellet was mixed with 1 mL cell culture medium. The cells were transferred into T-25 tissue culture flasks and cultured at 37 °C, 5% CO2, in a CO2 incubator. Cell passaging was applied when they reached 80–90% confluence of the surface area.
2.2. SMG Induction of CCL-13 Cells
For the microgravity test, we seeded CCL-13 cells in T-25 tissue culture flasks and 96-well microplates at predetermined densities of 1 × 10⁵ cells per flask and 2 × 10³ cells per well, respectively. To prevent the shearing of fluid, the T-25 tissue culture flasks and 96-well plates were then meticulously filled with cell culture media, avoiding bubbles [20]. Before being put into a CO2 incubator, the plates and flasks were fixed to the inner frame stage of a 3D clinostat (MiGra-ITB, Institute of Tropical Biology, Ho Chi Minh City, Vietnam), which was placed in a CO2 incubator. In the 3D clinostat, SMG was applied to the CCL-13 cells for 72 h. The same CO2 incubator was used to treat the CCL-13 cells of the control group at 1 G.
2.3. Cell Cycle Analysis
CCL-13 cell seeding was performed in 96-well microplates with a density of 2 × 10³ cells per well. The cells were cultured at 37 °C, 5% CO2, and we then induced SMG for 72 h in a CO2 incubator. The cells from the control group were cultured under the same conditions in a CO2 incubator without SMG exposure. After 72 h, the culture medium was removed and the CCL-13 cells were washed three times with PBS solution for 5 min. The CCL-13 cells were treated with 4% paraformaldehyde in PBS (Nacalai, Kyoto, Japan) for 30 min and were washed three times with PBS solution. We permeabilized pGCs with 0.1% Triton X-100 in PBS at 4 °C overnight. Hoechst 33342 (14533, Sigma-Aldrich, St. Louis, MO, USA) was used for staining the nucleus in a dark place for 30 min. The pGCs were washed three times with PBS for 5 min. Cell cycle progression and nuclear intensity were measured using a Cytell microscope (GE Healthcare, Chicago, IL, USA) and the Cell Cycle app. To evaluate the nuclear characteristics of the CCL-13 cells, the parameter of Nuc. Area (µm2) was adjusted to 150 and the parameter of Sensitivity (%) was adjusted to 50 (according to the manual of the Cytell microscope).
2.4. Quantitative Real-Time PCR Analysis
2.4.1. Total RNA Extraction
CCL-13 cells were seeded into T-25 tissue culture flasks with a density of 1 × 10⁵ cells per flask. The cells were cultured at 37 °C, 5% CO2, and we then induced SMG for 72 h in a CO2 incubator. The cells from the control group were cultured under the same conditions in a CO2 incubator without SMG treatment. After 72 h, the CCL-13 cells were collected and washed with PBS. A ReliaPrepTM RNA Cell Miniprep System (Z6011, Promega, Madison, WI, USA) was used to extract total RNA. The cells were harvested and lysed with 250 µL BL and TG solution in 1.5 mL tubes, before 85 µL isopropanol was added to the tubes and inverted for 5 s. The solution was subsequently transferred to a minicolumn tube and centrifuged at 11,000 rpm for 30 s. The liquid from the collection tube was discarded, and 500 µL RNA wash solution was added to the column tube and centrifuged at 11,000 rpm for 30 s. The liquid from the collection tube was discarded. The column was then incubated with 30 µL DNase I incubation mix for 15 min and subsequently washed with 500 µL RNA wash solution by centrifuging at 11,000 rpm for 30 s. The minicolumn was transferred to a new collection tube, and 50 µL RNA wash solution was added to the column and incubated at room temperature for 2 min. The column was centrifuged at 11,000 rpm for 1 min. The total mRNA was kept at −80 °C and used for downstream examination.
2.4.2. Real-Time RT-PCR Performance
Each PCR reaction contained 1 µL of template RNA, 2 µL of primers, 10 µL of Mix Ro-Lox, and 1 µL of RTAse in a total volume of 20 µL. The thermal cycles were performed as follows: 1 cycle at 45 °C for 15 min; initial denaturation at 95 °C for 2 min; 40 cycles at 95 °C for 10 s; 62 °C for 15 s; and examination of the melting curve from 60 °C to 95 °C with 0.5 °C increases every 15 s. The following primers were used: CDK2-F: 5′-CAG GAG TTA CTT CTA TGC CTG A-3′ and CDK2-R: 5′-TTC ATC CAG GGG AGG TAC AAC-3′; CDK6-F: TCT TCA TTC ACA CCG AGT AGT GC-3′ and CDK6-R: TGA GGT TAG AGC CAT CTG GAA A-3′ [21]; Cyclin B1-F: AAT GAA ATT CAG GTT GTT GCA GGA G and Cyclin B1-R: CAT GGC AGT GAC ACC AAC CAG; Cyclin D1-F: ATG TTC GTG GCC TCT AAG ATG A and Cyclin D1-R: CAG GTT CCA CTT GAG CTT GTT C [22]; GAPDH-F: 5′-CAT GAG AAG TAT GAC AAC AGC CT-3′ and GAPDH-R: 5′-AGT CCT TTC CAC GAT ACC AAA GT-3′ [23]. The comparative Ct approach was used to examine the quantitative data [24].
2.5. Western Blot
Cells were collected and disrupted using LDS sample buffer (ab119196; Abcam, Waltham, MA, USA). The proteins were resolved via SDS-PAGE and transferred to PVDF membranes (ab133411; Abcam). The membranes were blocked overnight at 4 °C with a blocking buffer (ab126587; Abcam). Each membrane was then incubated with primary antibodies, including anti-cyclin A antibodies (ab185619; Abcam), anti-cdk2 antibodies (ab32147; Abcam), and anti-cdk6 antibodies (ab124821; Abcam). Anti-GAPDH antibodies (ab181602; Abcam) were used as the control. Goat anti-rabbit IgG (ab6721; Abcam) was used against the primary antibodies. Target proteins were visualized using an ECL Kit (ab65623; Abcam).
2.6. Microtubule Staining
In 96-well microplates with culture media in each well, 2 × 10³ CCL-13 cells were cultured per well, and 50 nM SiR-tubulin/well was used to label the microtubules of the CCL-13 cells (CY-SC002, Cytoskeleton, Inc., Denver, CO, USA). The cells were cultured at 37 °C, 5% CO2, and we then induced SMG for 72 h in a CO2 incubator. The cells from the control group were cultured under the same conditions in a CO2 incubator without SMG treatment. SMG was applied to CCL-13 cells for 72 h, and a Cytell microscope was used to examine the structure and the organization of the microtubule bundles (GE Healthcare).
2.7. Microfilament Staining
SMG was induced in CCL-13 cells within 72 h at a density of 2 × 10³ cells per well after they had been grown in 96-well microplates. CCL-13 cells were washed three times with PBS solution for 5 min. CCL-13 cells were fixed for 30 min in 4% paraformaldehyde (Nacalai, Japan). The cells were then permeabilized with 0.1% Triton X-100 (Merck, Darmstadt, Germany) overnight at 4 °C and were washed three times with PBS solution for 5 min. Actin filaments were stained for 1 h using Phalloidin CruzFluorTM 488 Conjugate (sc-363791, Santa Cruz Biotechnology, Santa Cruz, CA, USA). CCL-13 cells were stained using Hoechst 33342 (14533, Sigma-Aldrich, St. Louis, MO, USA) for 15 min. PBS (Gibco, Thermo Fisher Scientific, Inc., Waltham, MA, USA) was applied to the cells three times for a total of 10 min of washing. A Cytell microscope was used to examine the microfilament bundle structures. The intensity of the microfilaments was determined using Image J (National Institutes of Health, Bethesda, MD, USA). To eliminate background noise and auto-fluorescence, photos were converted to grayscale (type 8 bit) and then applied to the threshold function using the same threshold for all images; then, the measurements of microfilament intensity were performed.
2.8. Statistical Analysis
All experiments were repeated at least three times. All data are expressed as the mean ± standard deviation. Sigma Plot version 11.0, Systat, San Jose, CA, USA was used for statistical analysis. Statistical differences were assessed via the Holm–Sidak test, and a p-value < 0.05 was considered to be statistically significant.
3. Results
3.1. The Workflow of Cell Division Analysis
In this study, the cell division alteration of CCL-13 cells under SMG conditions was estimated based on changes in cell cycle progression and the expression of cell-cycle-related genes. The modification of the contractile ring and the spindle was associated with cell division (Figure 1).
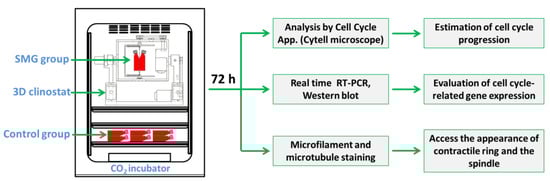
Figure 1.
Schematic representation of the experimental design. CCL-13 cells were subjected to SMG conditions using a 3D clinostat for 72 h. The cell cycle progression was estimated via the Cell Cycle app, and the expression of cell-cycle-related genes was evaluated via real-time RT-PCR and Western blot. The appearance of the contractile ring and the spindle was assessed via microfilament and microtubule staining.
3.2. Effects of SMG Exposure on the Cell Cycle of CCL-13 Cells
Figure 2A demonstrates the normal epithelial-like morphology of CCL-13 cells from the control group and the SMG group. The analysis of the cell cycle showed the alteration to the cell cycle progression of the CCL-13 cells (Figure 2B,C; Supplementary Table S1). The SMG cells had a higher percentage in the G0/G1 phase than the control cells (46.05 ± 0.22% vs. 37.44 ± 1.93%). The percentages of SMG cells in the S phase and G2/M phase were lower than those of the control cells (12.26 ± 0.25% vs. 14.16 ± 0.34%, and 34.90 ± 0.23% vs. 40.71 ± 0.79%, respectively). The results indicated that SMG exposure induced an increase in CCL-13 cells in the G0/G1 phase and a decrease in the S phase and G2/M phase, suggesting that SMG caused the CCL-13 cells to enter the arrest phase of cell cycle progression.
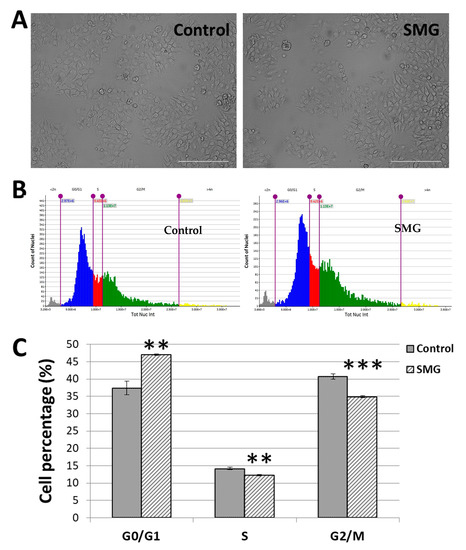
Figure 2.
Cell cycle progression analysis: (A) CCL-13 cell morphology from the control group and SMG condition; (B) the cell cycle of CCL-13 cells from the control group, whereby SMG group was evaluated using the Cell Cycle app. The gray indicates the percentage of nuclei < 2n, the blue indicates the percentage of nuclei in the G0/G1 phase, the red indicates the percentage of nuclei in the S phase, the green indicates the percentage of nuclei in the G2/M phase, and the yellow indicates the percentage of nuclei > 4n. (C) The proportion of CCL-13 cells in various cell cycle stages. *** indicates a significant difference in the SMG group compared to the control group (p < 0.001); ** indicates a significant difference in the SMG group compared to the control group (p < 0.01).
3.3. The Morphological Changes in CCL-13 under SMG Conditions
The present study also estimated the cytoplasm and nuclear changes in CCL-13 under SMG conditions. CCL-13 cells in the SMG group had a larger cell zone than cells in the control group (1209.00 ± 81.12 µm2 vs. 1000.42 ± 56.14 µm2) (Figure 3A; Supplementary Table S2). The CCL-13 cells’ nuclear zone in the SMG group was smaller compared to the control cells (244.45 ± 3.80 µm2 vs. 254.75 ± 2.95 µm2) (Figure 3B; Supplementary Table S3). This resulted in a decrease in the nuclear/cytoplasmic ratio in CCL-13 cells under SMG conditions compared to the control cells (23.29 ± 1.46% vs. 29.15 ± 1.80%) (Figure 3C).
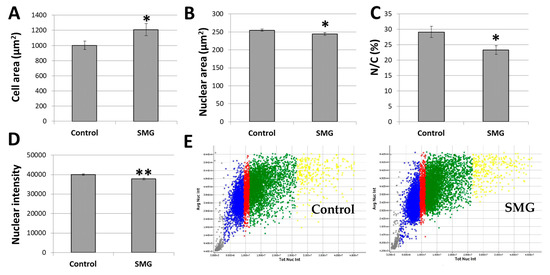
Figure 3.
CCL-13 morphology analysis: (A) CCL-13 cell area; (B) CCL-13 nuclear area; (C) nuclear/cytoplasmic ratio in CCL-13 cells; (D) nuclear intensity; (E) the CCL-13 nuclear intensity distribution between the control group and SMG group. The gray indicates the percentage of nuclei < 2n, the blue indicates the percentage of nuclei in the G0/G1 phase, the red indicates the percentage of nuclei in the S phase, the green indicates the percentage of nuclei in the G2/M phase, and the yellow indicates the percentage of nuclei > 4n. ** denotes a significant difference between the SMG group compared to the control group (p < 0.01); * denotes a significant difference between the SMG group compared to the control group (p < 0.05).
Chromatin condensation, a crucial mitotic event, is necessary for cell division. One of the important nuclear characteristics during cell division is nuclear intensity, which was also evaluated in CCL-13 cells under SMG conditions. Hoechst 33342 staining for nuclei, which generates nuclear intensity, was used to detect chromatin condensation. As seen in Figure 3D,E, the SMG cells had lower intensities than the control cells (37766 ± 458 vs. 39,985 ± 366) (Supplementary Table S4). As a result, less chromatin condensation reduced the division of CCL-13 cells.
3.4. The Alteration of Cell-Cycle-Related Transcript Expression in CCL-13 Cells
The measurement of transcript expression of the gene associated with the cell-cycle-related genes was used to further examine the impact of SMG conditions on CCL-13 cell division (Supplementary Table S5). In comparison with the control group cells, the SMG group CCL-13 cells had reduced transcript expression levels of cyclin B1 and cyclin D1, according to real-time RT-PCR analysis (Figure 4A). The expression of cyclin B1 and cyclin D1 in CCL-13 cells treated with SMG was 39.8% and 54.2% lower than the control group. Moreover, the decrease in CDK2 and CDK6 transcript expression was also observed in CCL-13 cells from the SMG group. The expression of CDK2 and CDK6 in CCL-13 cells treated with SMG was 44.6% and 57.2% lower than the control group. These findings demonstrated that SMG conditions induced the transcript downregulation of the major cell-cycle-related genes in CCL-13 cells. Western blot analysis showed that CCL-13 cells from the SMG groups exhibited a lower expression of cyclin A, CDK2, and CDK6 than the control group (Figure 4B).
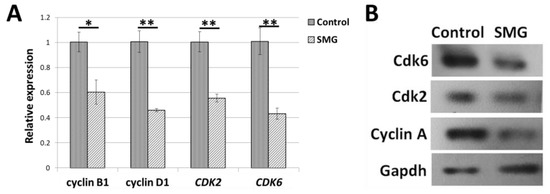
Figure 4.
Comparing the relative transcript gene expression associated with the cell cycle in the SMG and control groups using real-time RT-PCR (A) and Western blot (B). ** denotes a significant difference between the SMG group compared to the control group (p < 0.01); * denotes a significant difference between the SMG group compared to the control group (p < 0.05).
3.5. Effects of SMG on Morphological Changes during Cell Division
Microfilament and microtubule staining were applied to assess the effects of SMG conditions on two structures related to cell division: the contractile ring and spindle. As shown in Figure 5a, the morphology of CCL-13 cells from the control group changed in an apical shape during mitosis and exposed the abundant microvilli. In the last step of cell division, the CCL-13 cells exhibited contractile ring formation, which generates a constricting force to separate one cell into two sister cells (Figure 5b). The microvilli were also detected in the CCL-13 cells from the SMG group in mitosis (Figure 5c), and so was contractile ring formation during cytokinesis (Figure 5d). However, the SMG-treated CCL-13 cells showed a lower intensity of microfilaments in these structures compared to the control cells. The CCL-13 cells from both groups showed similar normal morphologies without fragmentation and condensation, which are characteristics of apoptosis.
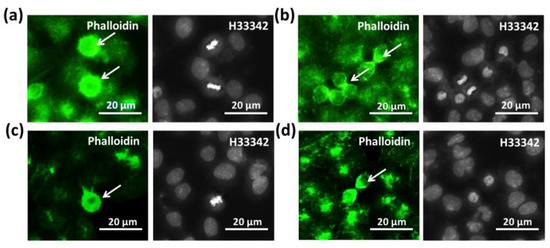
Figure 5.
Microfilament staining of CCL-13 cells: (a,b) the appearance of the contractile ring and microvilli in the control CCL-13 cells (white arrows); (c,d) the appearance of the contractile ring and microvilli in CCL-13 cells under SMG conditions (white arrows). Microfilaments and nuclei were counterstained using Phalloidin (green) and H33342, respectively.
The microtubule staining indicated that the CCL-13 cells in the control group and SMG group showed normal spindle formation during mitosis (Figure 6a–c,g–i). During cytokinesis, the control CCL-13 cells displayed a normal structure of polar spindle microtubules (Figure 6d–f), while an irregular form of this structure was discovered in the SMG CCL-13 cells (Figure 6j–l). The results showed that SMG affected the structure formation of polar spindle microtubules during sister cell separation.
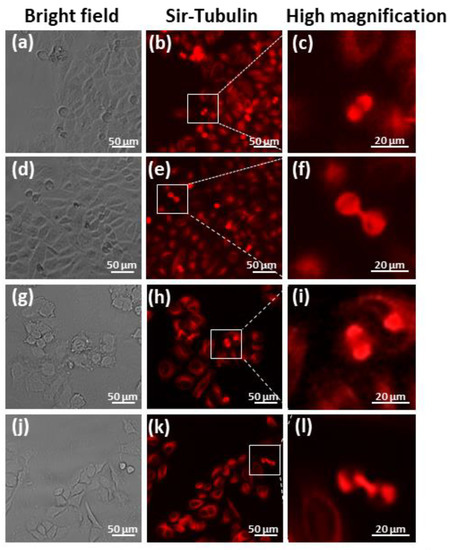
Figure 6.
Microtubule staining of CCL-13 cells: (a–f). The appearance of the spindle in the control CCL-13 cells (g–l). The appearance of the spindle in the CCL-13 cells in the SMG group.
4. Discussion
Previous studies have demonstrated changes in mammalian cells under SMG conditions. Wang and colleagues studied the biological effects (including the proliferation of cells, cell cycle progression, the differentiation and adhesion of cells, apoptosis, and the integrity of the genome) of SMG on mouse embryonic cells. The results showed that mouse embryonic cells are very sensitive to microgravity and can rapidly adjust to adapt to the conditions of microgravity [25]. Sokolovskaya and colleagues used a random positioning machine (RPM) to study the effect of simulated microgravity on Jurkat cells. The results showed that the viability of Jurkat cells decreased after microgravity simulation [26]. The liver is a very important organ of essential metabolic processes; it interacts with almost every tissue in the human body. Previous studies have shown that the liver of rodents is very sensitive and susceptible to physical conditions during spaceflight or experiments on the ground using a microgravity simulator [27]. Long-term spaceflight should be thoroughly studied for liver metabolic processes and the gut–liver axis to help enhance and maintain metabolic equilibrium [27]. Long-term cultures of human liver cells can be established in simulated microgravity conditions, which will also make it possible to study how the liver regenerates and how cells interact in a way that is similar to processes in the body [28]. Chen and colleagues demonstrated that SMG treatment also induces changes in Loureirin B metabolism and the expression of primary cytochrome P450 in the rat liver [29]. Beheshti A. and colleagues showed that microgravity causes the dysregulation of lipids in the liver of mice [30]. SMG could be useful for creating hepatic devices developed from human hepatic cells and progenitor cells. SMG promotes the development of 3D cultures of human hepatic cells and progenitor cells, as well as the preservation of stemness over cell differentiation; these effects were linked to the stimulation of glycolytic metabolism [31].
Together with cellular development and division, cells move through the cell cycle. A cell spends the majority of its time in the interphase, a phase where it develops and gets ready to divide. The cell completes both mitosis and division after overcoming the interphase [32]. In the initiation of mitosis, cells get ready to divide in the G1 phase. After that, they move into the S phase, and during which the cell replicates its whole DNA. The cell moves into the G2 phase, where it begins to arrange and condense the genetic material in preparation for division. The M phase follows. At this time, sister chromatids are separated from each other, and one copy of the chromosome is given to each daughter cell. [33]. The present study found that the CCL-13 cells in the SMG group showed an increase in the cell percentage in the G0/G1 phase and reduced cells in the S phase and G2/M phase. SMG exposure induces a delay of CCL-13 cells in the G0/G1 phase and slows down the process of cells entering the division phase, which drives these cells into the arrest phase of the cell cycle, and reduces the division of the cells.
During mitosis, cells exhibit morphological changes in the cytoplasm and nucleus [34,35]. A previous study reported that a high nuclear/cytoplasmic ratio starts the intracellular processes that get the cell ready for division, and cytoplasmic expansion continues until the moment of division [36]. In this investigation, SMG-induced CCL-13 cells showed cell area expansion and nuclear area reduction, leading to a reduction in the nuclear/cytoplasmic ratio. This revealed that a low nuclear/cytoplasmic ratio is correlated with a delay in entering the division phase for CCL-13 cells under SMG conditions. For cell division, nuclear reconstruction is necessary, as this increases the rate of DNA replication and other cellular component production. Chromatin condensation, a process that increases nuclear intensity, is necessary for mitosis to occur [37]. This study revealed a lower nuclear intensity of SMG cells compared to the control, suggesting that the changes in nuclear reconstruction and/or DNA replication were initiated by SMG conditions.
Cyclins work with the cyclin-dependent kinase family to regulate the cell cycle’s activities, including transitioning from quiescence into the cycle of the cell, the transition of the G1/S phase, the replication of DNA, the condensation and segregation of chromosomes, and cytokinesis [38,39,40]. The activation of cdk4 and cdk6 via cyclin D binding is necessary for cell-cycle entrance into the early G1 phase, while cdk2 activation via cyclin E binding is necessary for advancement through G1 and entrance to the S phase [41]. Moreover, the transition through the S phase is also governed by cyclin A/cdk2 [42]. Cyclin B1 is a crucial factor in regulating the transition from the G2 phase to the M phase [43,44]. This investigation found that the expression of cell-cycle-related genes was downregulated in CCL13 cells under SMG conditions. This hindered cells moving into the S phase and G2/M phase and kept the cells in the arrest phase.
Animal cells become round and spherical when they go through mitosis [45]. Cells appeared in apical form during the anaphase, and the number of microvilli was noticeably enhanced [46]. The emergence of microvilli and the contractile ring showed that the process of cell division occurred in CCL-13 cells under SMG conditions. However, their appearance suggested that SMG induces an alteration of these structures in CCL-13 cells. Moreover, an irregular form of the polar spindle microtubules was noted in SMG-treated CCL-13 cells. The outcome of this work showed that SMG treatment results in changes in the structure of the contractile ring and polar spindle microtubules, which contribute to cytokinesis.
5. Conclusions
SMG reduced the ratio of CCL-13 cell division by downregulating cell-cycle-related transcript expression and bringing cells into the arrest phase. Moreover, alterations in the structure of the contractile ring and polar spindle microtubules were brought on by SMG, which plays important roles in cytokinesis.
Supplementary Materials
The following supporting information can be downloaded at: https://www.mdpi.com/article/10.3390/app13137351/s1, Table S1: Cell cycle; Table S2: Cell area; Table S3: Nuclear area; Table S4: Nuclear intensity; Table S5: Real time RT-PCR; Video S1: Supplementary video_3D Clinostat.
Author Contributions
Conceptualization: M.T.T., C.N.Q.H. and L.T.L.; methodology: M.T.T., C.C.D., C.N.Q.H. and L.T.L.; investigation and data curation: M.T.T., C.N.Q.H., S.N.H., C.N.L., M.T.P.N., Q.M.T., N.H.T. and L.T.L.; writing—original draft: M.T.T., C.N.Q.H. and L.T.L.; writing—review and editing: M.T.T., C.N.Q.H. and L.T.L. All authors have read and agreed to the published version of the manuscript.
Funding
This study was supported by the VLU_Grant 2023 of Van Lang University, Vietnam (grant number: VLU.03/23).
Institutional Review Board Statement
Not applicable.
Informed Consent Statement
Not applicable.
Data Availability Statement
All data sets obtained and analyzed during the current study are available in the manuscript.
Conflicts of Interest
The authors declare no conflict of interest. The funders had no role in the design of the study; in the collection, analyses, or interpretation of data; in the writing of the manuscript; or in the decision to publish the results.
References
- Bizzarri, M.; Monici, M.; van Loon, J.J.W.A. How Microgravity Affects the Biology of Living Systems. BioMed Res. Int. 2015, 2015, 863075. [Google Scholar] [CrossRef] [PubMed]
- Blaber, E.; Sato, K.; Almeida, E.A.C. Stem Cell Health and Tissue Regeneration in Microgravity. Stem. Cells. Dev. 2014, 23, 73–78. [Google Scholar] [CrossRef]
- Grimm, D.; Wehland, M.; Corydon, T.J.; Richter, P.; Prasad, B.; Bauer, J.; Egli, M.; Kopp, S.; Lebert, M.; Krüger, M. The effects of microgravity on differentiation and cell growth in stem cells and cancer stem cells. Stem Cells Transl. Med. 2020, 9, 882–894. [Google Scholar] [CrossRef]
- Wang, P.; Tian, H.; Zhang, J.; Qian, J.; Li, L.; Shi, L.; Zhao, Y. Spaceflight/microgravity inhibits the proliferation of hematopoietic stem cells by decreasing kitRas/cAMP-CREB pathway networks as evidenced by RNA-Seq assays. FASEB J. 2019, 33, 5903–5913. [Google Scholar] [CrossRef] [PubMed]
- Ma, X.; Pietsch, J.; Wehland, M.; Schulz, H.; Saar, K.; Hübner, N.; Bauer, J.; Braun, M.; Schwarzwälder, A.; Segerer, J.; et al. Differential gene expression profile and altered cytokine secretion of thyroid cancer cells in space. FASEB J. 2014, 28, 813–835. [Google Scholar] [CrossRef] [PubMed]
- Krüger, M.; Pietsch, J.; Bauer, J.; Kopp, S.; Carvalho, D.T.O.; Baatout, S.; Moreels, M.; Melnik, D.; Wehland, M.; Egli, M.; et al. Growth of endothelial cells in space and in simulated microgravity—A comparison on the secretory level. Cell Physiol. Biochem. 2019, 52, 1039–1060. [Google Scholar] [CrossRef]
- Nassef, M.Z.; Kopp, S.; Wehland, M.; Melnik, D.; Sahana, J.; Krüger, M.; Corydon, T.J.; Oltmann, H.; Schmitz, B.; Schütte, A.; et al. Real microgravity influences the cytoskeleton and focal adhesions in human breast cancer cells. Int. J. Mol. Sci. 2019, 20, 3156. [Google Scholar] [CrossRef]
- Sahebi, R.; Aghaei, M.; Halvaei, S.; Alizadeh, A. The Role of Microgravity in Cancer: A Dual-edge Sword. Multidiscip. Cancer Investig. 2017, 1, 1–5. [Google Scholar] [CrossRef]
- Kim, Y.J.; Jeong, A.J.; Kim, M.; Lee, C.; Ye, S.K.; Kim, S. Time-averaged simulated microgravity (taSMG) inhibits proliferation of lymphoma cells, L-540 and HDLM-2, using a 3D clinostat. BioMed Eng. Online 2017, 16, 48. [Google Scholar] [CrossRef]
- Fukazawa, T.; Tanimoto, K.; Shrestha, L.; Imura, T.; Takahashi, S.; Sueda, T.; Hirohashi, N.; Hiyama, E.; Yuge, L. Simulated microgravity enhances CDDP-induced apoptosis signal via p53-independent mechanisms in cancer cells. PLoS ONE 2019, 14, e0219363. [Google Scholar] [CrossRef]
- Jessup, J.M.; Frantz, M.; Sonmez-Alpan, E.; Locker, J.; Skena, K.; Waller, H.; Battle, P.; Nachman, A.; Weber, M.E.; Thomas, D.A.; et al. Microgravity culture reduces apoptosis and increases the differentiation of a human colorectal carcinoma cell line. In Vitro Cell. Dev. Biol. Anim. 2000, 36, 367–373. [Google Scholar] [CrossRef]
- Vidyasekar, P.; Shyamsunder, P.; Arun, R.; Santhakumar, R.; Kapadia, N.K.; Kumar, R.; Verma, R.S. Genome Wide Expression Profiling of Cancer Cell Lines Cultured in Microgravity Reveals Significant Dysregulation of Cell Cycle and MicroRNA Gene Networks. PLoS ONE 2015, 10, e0135958. [Google Scholar] [CrossRef]
- Balasubramanian, M.K.; McCollum, D. Regulation of Cytokinesis. In The Molecular Biology of Schizosaccharomyces Pombe; Egel, R., Ed.; Springer: Berlin/Heidelberg, Germany, 2004; Chapter 15; pp. 243–254. [Google Scholar] [CrossRef]
- Normand, G.; King, R.W. Understanding Cytokinesis Failure. Adv. Exp. Med. Biol. 2010, 676, 27–55. [Google Scholar] [CrossRef]
- Cogoli, A.; Tschopp, A.; Fuchs-Bislin, P. Cell Sensitivity to Gravity. Science 1984, 225, 228–230. [Google Scholar] [CrossRef]
- Sokolovskaya, A.A.; Ignashkova, T.I.; Bochenkova, A.V.; Moskovtsev, A.A.; Baranov, V.M.; Kubatiev, A.A. Effects of simulated microgravity on cell cycle in human endothelial cells. Acta Astronaut. 2014, 99, 16–23. [Google Scholar] [CrossRef]
- Helmstetter, C.E. Gravity and the orientation of cell division. Proc. Natl. Acad. Sci. USA 1997, 94, 10195–10198. [Google Scholar] [CrossRef] [PubMed]
- Vorselen, D.; Roos, W.H.; MacKintosh, F.C.; Wuite, G.J.; van Loon, J.J. The role of the cytoskeleton in sensing changes in gravity by nonspecialized cells. FASEB J. 2014, 28, 536–547. [Google Scholar] [CrossRef]
- Chi, H.N.Q.; Son, H.N.; Chung, D.C.; Huan, L.D.; Diem, T.H.; Long, L.T. Simulated microgravity reduces proliferation and reorganizes the cytoskeleton of human umbilical cord mesenchymal stem cells. Physiol. Res. 2020, 69, 897–906. [Google Scholar] [CrossRef] [PubMed]
- Leguy, C.A.D.; Delfos, R.; Pourquie, M.J.B.M.; Poelma, C.; Krooneman, J.; Westerweel, J.; van Loon, J.J.W.A. Fluid dynamics during Random Positioning Machine micro-gravity experiments. Adv. Space Res. 2017, 59, 3045–3057. [Google Scholar] [CrossRef]
- Ren, Y.; Qiu, L.; Lü, F.; Ru, X.; Li, S.; Xiang, Y.; Yu, S.; Zhang, Y. TALENs-directed knockout of the full-length transcription factor Nrf1α that represses malignant behaviour of human hepatocellular carcinoma (HepG2) cells. Sci. Rep. 2016, 6, 23775. [Google Scholar] [CrossRef] [PubMed]
- Tian, T.; Guo, T.; Zhen, W.; Zou, J.; Li, F. BET degrader inhibits tumor progression and stem-like cell growth via Wnt/β-catenin signaling repression in glioma cells. Cell Death Dis. 2020, 11, 900. [Google Scholar] [CrossRef] [PubMed]
- Gorgogietas, V.; Tsialtas, I.; Sotiriou, N.; Laschou, V.C.; Karra, A.G.; Leonidas, D.D.; Chrousos, G.P.; Protopapa, E.; Psarra, A.-M.G. Potential interference of aluminum chlorohydrate with estrogen receptor signaling in breast cancer, cells. J. Mol. Biochem. 2018, 7, 1–13. [Google Scholar] [PubMed]
- Livak, K.J.; Schmittgen, T.D. Analysis of relative gene expression data using Real-Time Quantitative PCR and the 2−∆∆Ct Method. Methods 2001, 25, 402–408. [Google Scholar] [CrossRef] [PubMed]
- Wang, Y.; An, L.; Jiang, Y.; Hang, H. Effects of simulated microgravity on embryonic stem cells. PLoS ONE 2011, 6, e29214. [Google Scholar] [CrossRef]
- Sokolovskaya, A.; Korneeva, E.; Zaichenko, D.; Virus, E.; Kolesov, D.; Moskovtsev, A.; Kubatiev, A. Changes in the Surface Expression of Intercellular Adhesion Molecule 3, the Induction of Apoptosis, and the Inhibition of Cell-Cycle Progression of Human Multidrug-Resistant Jurkat/A4 Cells Exposed to a Random Positioning Machine. Int. J. Mol. Sci. 2020, 21, 855. [Google Scholar] [CrossRef]
- Zong, B.; Wang, Y.; Wang, J.; Zhang, P.; Kan, G.; Li, M.; Feng, J.; Wang, Y.; Chen, X.; Jin, R.; et al. Effects of long-term simulated microgravity on liver metabolism in rhesus macaques. FASEB J. 2022, 36, e22536. [Google Scholar] [CrossRef]
- Yoffe, B.; Darlington, G.J.; Soriano, H.E.; Krishnan, B.; Risin, D.; Pellis, N.R.; Khaoustov, V.I. Cultures of human liver cells in simulated microgravity environment. Adv. Space Res. 1999, 24, 829–836. [Google Scholar] [CrossRef]
- Chen, B.; Guo, J.; Wang, S.; Kang, L.; Deng, Y.; Li, Y. Simulated Microgravity Altered the Metabolism of Loureirin B and the Expression of Major Cytochrome P450 in Liver of Rats. Front. Pharmacol. 2018, 9, 1130. [Google Scholar] [CrossRef]
- Beheshti, A.; Chakravarty, K.; Fogle, H.; Fazelinia, H.; Silveira, W.A.D.; Boyko, V.; Polo, S.L.; Saravia-Butler, A.M.; Hardiman, G.; Taylor, D.; et al. Multi-omics analysis of multiple missions to space reveal a theme of lipid dysregulation in mouse liver. Sci. Rep. 2019, 9, 19195. [Google Scholar] [CrossRef]
- Costantini, D.; Overi, D.; Casadei, L.; Cardinale, V.; Nevi, L.; Carpino, G.; Di Matteo, S.; Safarikia, S.; Valerio, M.; Melandro, F.; et al. Simulated microgravity promotes the formation of tridimensional cultures and stimulates pluripotency and a glycolytic metabolism in human hepatic and biliary tree stem/progenitor cells. Sci. Rep. 2019, 9, 5559. [Google Scholar] [CrossRef]
- Matthews, H.K.; Bertoli, C.; de Bruin, R.A.M. Cell cycle control in cancer. Nat. Rev. Mol. Cell Biol. 2022, 23, 74–88. [Google Scholar] [CrossRef]
- Tan, E.P.; Duncan, F.E.; Slawson, C. The sweet side of the cell cycle. Biochem. Soc. Trans. 2017, 45, 313–322. [Google Scholar] [CrossRef]
- Miettinen, T.P.; Kang, J.H.; Yang, L.F.; Manalis, S.R. Mammalian cell growth dynamics in mitosis. Elife 2019, 8, e44700. [Google Scholar] [CrossRef]
- Way, G.P.; Kost-Alimova, M.; Shibue, T.; Harrington, W.F.; Gill, S.; Piccioni, F.; Becker, T.; Shafqat-Abbasi, H.; Hahn, W.C.; Carpenter, A.E.; et al. Predicting cell health phenotypes using image-based morphology profiling. Mol. Biol. Cell 2021, 32, 995–1005. [Google Scholar] [CrossRef]
- Worthington, D.H.; Salamone, M.; Nachtwey, D.S. Nucleocytoplasmic ratio requirements for the initiation of DNA replication and fission in Tetrahymena. Cell Tissue Kinet. 1976, 9, 119–130. [Google Scholar] [CrossRef]
- Habela, C.W.; Sontheimer, H. Cytoplasmic volume condensation is an integral part of mitosis. Cell Cycle 2007, 6, 1613–1620. [Google Scholar] [CrossRef]
- Diril, M.K.; Ratnacaram, C.K.; Padmakumar, V.C.; Du, T.; Wasser, M.; Coppola, V.; Tessarollo, L.; Kaldis, P. Cyclin-dependent kinase 1 (Cdk1) is essential for cell division and suppression of DNA re-replication but not for liver regeneration. Proc. Natl. Acad. Sci. USA 2012, 109, 3826–3831. [Google Scholar] [CrossRef]
- Szmyd, R.; Niska-Blakie, J.; Diril, M.K.; Nunes, P.R.; Tzelepis, K.; Lacroix, A.; van Hul, N.; Deng, L.W.; Matos, J.; Dreesen, O.; et al. Premature activation of Cdk1 leads to mitotic events in S phase and embryonic lethality. Oncogen 2019, 38, 998–1018. [Google Scholar] [CrossRef] [PubMed]
- Caldez, M.J.; Bjorklund, M.; Kaldis, P. Cell cycle regulation in NAFLD: When imbalanced metabolism limits cell division. Hepatol. Int. 2020, 14, 463–474. [Google Scholar] [CrossRef] [PubMed]
- Pack, L.R.; Daigh, L.H.; Chung, M.; Meyer, T. Clinical CDK4/6 inhibitors induce selective and immediate dissociation of p21 from cyclin D-CDK4 to inhibit CDK2. Nat. Commun. 2021, 12, 3356. [Google Scholar] [CrossRef] [PubMed]
- De Boer, L.; Oakes, V.; Beamish, H.; Giles, N.; Stevens, F.; Somodevilla-Torres, M.; Desouza, C.; Gabrielli, B. Cyclin A/cdk2 coordinates centrosomal and nuclear mitotic events. Oncogene 2008, 27, 4261–4268. [Google Scholar] [CrossRef] [PubMed]
- Zhan, Q.M.; Wang, L.H.; Song, Y.M.; Ou, Y.W.; Jiang, J.; Fan, J.; Wang, J.B.; Shen, J. Chapter 18—Esophageal Carcinoma. In Recent Advances in Cancer Research and Therapy, 1st ed.; Liu, X.Y., Pestka, S., Shi, Y.F., Eds.; Elsevier: Amsterdam, The Netherlands, 2012; pp. 493–534. [Google Scholar]
- Pollard, T.D.; Earnshaw, W.C.; Lippincott-Schwartz, J.; Johnson, G.T. Chapter 43—G2 Phase, Responses to DNA Damage, and Control of Entry into Mitosis. In Cell Biology, 3rd ed.; Pollard, T.D., Earnshaw, W.C., Lippincott-Schwartz, J., Johnson, G.T., Eds.; Elsevier: Amsterdam, The Netherlands, 2017; pp. 743–754. [Google Scholar]
- Taubenberger, A.V.; Baum, B.; Matthews, H.K. The Mechanics of Mitotic Cell Rounding. Front Cell Dev. Biol. 2020, 8, 687. [Google Scholar] [CrossRef] [PubMed]
- Sanger, J.M.; Reingold, A.M.; Sanger, J.W. Cell surface changes during mitosis and cytokinesis of epithelial cells. Cell Tissue Res. 1984, 237, 409–417. [Google Scholar] [CrossRef] [PubMed]


Disclaimer/Publisher’s Note: The statements, opinions and data contained in all publications are solely those of the individual author(s) and contributor(s) and not of MDPI and/or the editor(s). MDPI and/or the editor(s) disclaim responsibility for any injury to people or property resulting from any ideas, methods, instructions or products referred to in the content. |
© 2023 by the authors. Licensee MDPI, Basel, Switzerland. This article is an open access article distributed under the terms and conditions of the Creative Commons Attribution (CC BY) license (https://creativecommons.org/licenses/by/4.0/).