Abstract
The scientific aim of this work is to encourage energy conservation. This article offers a fresh perspective on renewable energy in the air conditioning sector, the country’s economic growth, and environment-friendly techniques to overcome global warming challenges. In this research, a solar vapor absorption refrigeration (SVAR) system was combined with a conventional vapor compression refrigeration (VCR) system to analyze their combined performance, employing a compound parabolic collector (CPC). The goal was to assess the performance of a solar hybrid cooling system using this non-tracking solar collector. CPC was validated for heat output with 2.9% uncertainty by utilizing an engineering equation solver (EES). Other system components were also validated with EES and then extended to a larger-capacity solar hybrid cooling system. The results of this research indicate that CPC is effective in providing the required heat to SVAR throughout the year without any tracking, and the integration of SVAR in series with the VCR condenser produces 83% higher COP than the system that integrates VCR with the condenser of the SVAR system for Riyadh. The configuration results in high values of exergy COP and an efficiency of 88% and 84%, respectively, increases the cooling capacity of the VCR by 68%, and decreases the carbon emission by 166.4%.
1. Introduction
While evolution in science and technology undoubtedly contributes to the economic growth of the country, in the long term it might exercise an adverse effect on sustainability if its future impact is overlooked. The excessive emission of global greenhouse gases (GHG) when fossil fuels are utilized for power generation and the utilization of hydrofluorocarbons (HFCs) and hydrochlorofluorocarbons (HCFCs) for cooling and heating applications have harmful effects. The Kingdom of Saudi Arabia’s (KSA) commitment to Saudi Vision 2030 to use cost-effective and efficient energy-producing technologies makes solar energy a sourceof interest [1].
The causes of climate change include generating power, manufacturing goods, cutting down trees, using transportation, producing food, powering buildings, and unsustainable depletion of resources. The temperature of the atmosphere has already increased more than one degree Celsius, 1.1 °C with an average increase of 0.18 °C per decade for the last 40 years [2]. The Paris Agreement pledged that the participants would reach net zero by 2050, the greatest challenge humankind has ever faced. The dependency on fossil fuels has to be minimized to maintain a balanced ecosystem, and this brings renewable energy into the limelight.
The KSA is a petro-rich country with more than 60% of its national budget, 75% of export revenues, and 40% of its gross domestic product (GDP) comingfrom oil exports [3]. The KSA produces nearly 12 million barrels per day of oil, of which 4 million barrels (34%) are consumed locally. The electricity demand in the kingdom is increasing dramatically every year by 4–7% despite the relatively small population. Saudi Arabia uses 16% of its total energy production to generate electricity, a consumption largely influenced by the use of air conditioning systems. Air conditioning in the KSA uses 70% of its electricity production [4]. The price for one barrel of oil in the international market is around Saudi Riyal (SR) 300 as of June 2023 [5]. The KSA is spending almost SR40 billion/per year on air conditioning, which is a huge amount. An enhancement in the performance of the air conditioning system and the implementation of an inexpensive source of heat can help in utilizing this amount to support the kingdom economically and reduce the emission of environmentally polluting gases from conventional air conditioning systems.
The KSA is presently the fifth largest consumer of oil but in 47th position in terms of population. The KSA generates more than 99% of its electricity from fossil fuels [6]. It is considered one of the important contributors to global climate change in several ways, such as producing, supplying, and subsidizing fossil fuel. The KSA witnesses early climate change since it has an arid geography and seasonal factors [7]. Other factors include the increase in prices for local electricity consumption due to heavy usage, etc. As the average temperatures of the earth’s atmosphere go up globally and countries continue to develop, the global demand for air conditioning is projected to triple by 2050 [8]. A report by the Ministry of Energy, KSA, specifies that building energy in the KSA’s residential, commercial, and government sectors uses 73% of the generated power; of this total, 70% is used for air conditioning [9].
Air conditioning has become not just a luxury and comfort but an important part of healthy survival. The use of air conditioning is growing faster than any other energy-consuming technology globally and contributes to over 10% of greenhouse gas emission [8]. Energy from renewable sources creates far lower emissions than conventional fossil fuels [10]. The term hybrid refers to the combination of two or more systems integrated for increasing the efficiency of the whole system. The use of renewable energy has attracted more and more attention globally [11]. The evolution toward solar air conditioning has emerged in recent years to alleviate energy consumption and environmental problems [12]. Solar energy is the green and free form of energy available to the world and can be utilized as an alternative to energy from conventional resources. In recent years, solar energy has become one of the research hotspots for building applications [13]. The solar photovoltaic using phase-change material for panel cooling decreases the panel temperature by 10 °C and increases the power output [14]. The average solar radiation received in Riyadh at coordinates 24.7° N and 46.6° E is around 5.8 kWh/m2/day [15]. Analysis shows that among many cities in the KSA, Riyadh receives the maximum solar radiation, whereas the minimum is at Yanbu (24.0° N and 38.19° E) [16]. During the summer months of May-August, Riyadh receives a high intensity of solar radiation: 7.15 kWh/m2/day to 7.87 kWh/m2/day [17]. The average daily global radiation varies from minimum values of 4493 Wh/m2 at Tabuk (28.3° N and 36.5° E) to a maximum of 7014 Wh/m2 at Bisha (19.9° N and 42.5° E) [18]. The demand for air conditioning is rapidly increasing due to the increase in the social lifestyle and increasing global warming [19]. Solar air conditioning is vital to reduce electricity consumption and CO2 emission [20]. Complete evaluation and design methods to achieve the maximum benefits of solar air conditioning are crucial [21]. Although the performance of various solar hybrid cooling systems has been evaluated from various viewpoints such as energy, exergy, exergoenvironment, and economics, there is often conflict concerning the cost and efficiency of a solar air conditioning system [22].
A hybrid cooling system is a combined system of VCR and VAR. The experimental results of a hybrid cooling system using the evaporator of VAR to cool the condenser of the VCR system resulted in the increased exergy and energy efficiency of the conventional VCR system [23]. The number of conventional vapor compression refrigeration air conditioning systems is gradually increasing with 2 billion air conditioning units in operation globally, which contributes directly to greenhouse gases [24]. Analysis reveals that the coefficient of the performance of a solar-assisted cascade refrigeration system in series brings about 44.7% of savings in energy during peak load demands in the KSA [25]. Thermally driven solar cooling systems are considered sustainable because they have no moving parts and are driven by renewable energy sources [26]. The analysis of a hybrid system using LiBr-H2O in VAR and R74 in VCR results in a 28.6% and 26.9% increase in COP and exergetic efficiency, respectively, when compared to a conventional VCR system. With a payback period of 1.8 years, this is 17.8% less than for the conventional VCR system [27]. The experimental results lead to the conclusion that liquid desiccant (LiBr) is effective for high latent heat cooling loads with an inlet temperature of 24–32 °C and a concentration of 30–42% [28]. The investigation of a VCR-VAR configuration with LiBr-H2O as a working fluid in the VAR and R410A as a refrigerant in the VCR for a cooling load of 170 kW observed reductions of 50%, 76.8%, and 88.3% in the compressor power consumption respectively by using parallel, series, and combined configurations [27]. The performance of a 66.67 kW cascade VCR-VAR was evaluated, where R22, R407C, R410A, and R134A were the refrigerants in the VCR and LiBr/H2O/in the VAR. The results indicated that the electric power consumption was reduced by 61% and the COP increased by 155% compared with the stand-alone VCR [29]. Solar collectors are heat exchangers specially designed to transform solar radiation energy into the internal energy of the transport medium [30]. Machine-learning algorithms can mitigate the challenges of intricate mathematical modeling and costly experiments and enhance the performance of the heat exchanger [31]. Artificial intelligence (AI) techniques in the evaluation of the solar potential, fault detection, and optimization have shown superiority over physical models [32]. The flat plate collector (FPC) is the most efficient and simple solar collector for converting solar energy into heat [33]. The heating capacity of the FPC is 80 °C [34]. The solar concentrator is used to focus solar radiation, increasing the temperature up to 2000 °C by using parabolic reflectors, mirrors, and dish systems [35]. The solar concentrator increases the optical energy flux density on the receiver, hence increasing the temperature of the receiver [36].
Non-tracking solar collectors are stationary and usually have concentration ratio less than 5, which makes them suitable for operating temperatures of about 150 °C [37]. A CPC is capable of delivering all the solar radiation falling within its aperture and limits the requirement for moving the collector to capture the solar radiation [38]. The solar-assisted hybrid cooling system costs 60–120% more than traditional systems. It reduces energy consumption by 45–75% and carbon dioxide emission by 40–70% [39]. A solar-powered absorption cooling system using LiBr-H2O was simulated and optimized for a residential block in the United Arab Emirates (UAE); the COP was found to be 0.79 when an evacuated-tube solar collector with an area of 40 m2 was utilized. The results show that the system cost 43%, consumes energy 8%, and emits CO2 of 8.5% of the cost, energy consumed, and carbon production of a single VCR system, respectively [40]. The experimental behavior of a solar absorption chiller with LiBr-H2O as the working fluid was efficient in meeting the cooling demand of 13,255 kWh/ year with an FPC in Spain [41]. The experimental results of a 4.5 kW LiBr-H2O absorption cooling system with a vacuum FPC of 42.2 m2 area resulted in a COP of 0.53 [40]. The theoretical analysis of a solar hybrid cooling system in Egypt resulted in alleviating the electricity consumption by 63% when compared to aVCR [42]. The present investigation focuses on apparent, technological, and numerical tools to study the performance of the system in determining COP and power consumption. However, the literature review also supports the evidence of high solar flux in the KSA, which employs a large amount of its produced energy for air conditioning. The literature review also clearly shows that almost all the cooling in the KSA utilizes a conventional vapor compression system. The integration of a hybrid system using solar heat from a stationary CPC with a double-glazed flat plate absorber for the SVAR generator distinguishes our proposed system from others. Adopting such a system in the KSA is ideal because the country receives a high intensity of solar flux. The first solar absorption cooling system was established in Riyadh, and the it was effective in meeting the required cooling load [43]. The KSA has pledged to reduce CO2 emissions by 278 million tons annually by 2030 through the use of renewable energy resources [44]. The Saudi Vision 2030 aims at adopting cost-effective and efficient energy-producing technologies with the goal of producing 50% of its total required energy through renewable resources [45].
2. Experimental Setup
The experimental setup was installed on the terrace of the Mechanical Engineering Department at King Saud University, Riyadh, KSA. The experimental setup was divided into five main parts as follows:Setup of Test Room
- Setup of Solar Radiation
- Setup of Vapor Compression Refrigeration System
- Setup of Vapor Absorption System
- Setup of Compound Parabolic Collector
2.1. Experimental Procedure
The experimental procedure performed to analyze the system performance variable included:
2.1.1. Setup of the Test Room
The test room was constructed with a total surface area of 32 m2 with dimensions 3 2 2 i.e., length, width, and height, respectively. The design specifications are given in Table 1. The room was free from any kind of shading. The three layers of different materials used are shown in Figure 1b.

Table 1.
Specifications of test room materials.
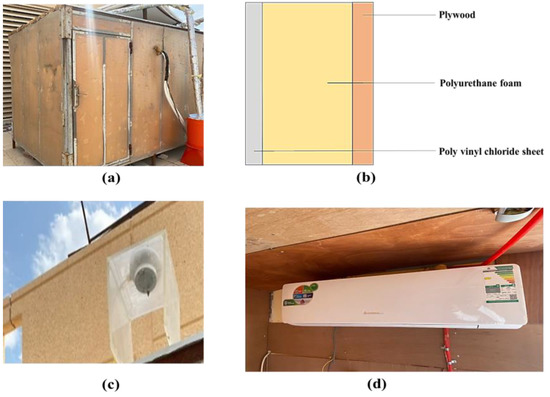
Figure 1.
(a) Test room (b) Wall design (c) Pyranometer (d) VAR system.
2.1.2. Solar Radiation Measurement
The solar pyranometer from the Kipp&Zonen model CMP3 was installed on a horizontal surface on the roof of the test room by mounting it on the frame 2 m above the floor as shown in Figure 1. The detailed specification of the pyranometer is shown in Table 2. The actual solar radiation intensity is calculated using Equation (1).
Table 2.
Specification of pyranometer.
2.1.3. Vapor Compression Refrigeration System
A vapor compression system was used for removing heat from the space. This system works on a refrigeration cycle ideal for air conditioning, refrigeration, and the heat pump. Figure 1d shows the VCR system. The vapor compression system of 2 TR was installed in the test room to cool the space. The VAR system employed was a split air conditioning R410A unit with a maximum and minimum working pressure of 4300 and 1300 Kpa, respectively.
2.1.4. Compound Parabolic Collector (CPC)
The CPC with a flat plate absorber was installed at the experimental site. The transporting fluid used in the CPC is air; hence the solar collector is called a solar air heater with CPC as a concentrator. The design specifications of the CPC are given in Table 3. The experimental setup of the CPC is shown in Figure 2.
Table 3.
Design specifications of the flat plate absorber and CPC.
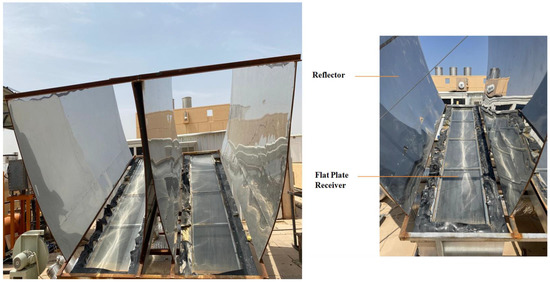
Figure 2.
CPC collector.
2.2. Description of Experiment
With the above setup, various experiments were performed to support the proposed solar hybrid cooling model. The experimental analysis included:
- Determining the global solar radiation
- Determining the COP of the VCR system
- Determining the FR and UL value for the CPC
- Determining the Efficiency of the CPC
In this research work multiple configurations of the solar hybrid model’s performance were analyzed. The one type of configuration used is shown in Figure 3. The SVAR system is integrated into a series with the VCR to enhance the performance of the total system and minimize the conventional VCR’s high-grade energy use. The reduction of high-grade energy also minimizes the use of electricity, hence reducing the impact on the environment due to the release of CO2, HCFs, and CFCs. The solar energy for this system is supplied through the compound parabolic collectors (CPC). The CPC with a concentration ratio of 3 is designed for increasing the solar flux on the absorber plate. The absorber is a double-glazed flat plate. The glazing admits the incoming solar radiation but is opaque to long-wave radiation. It limits the force convection by air stagnation between the glass cover and absorber plate [46]. However, absorption of longwave radiation increases the glass temperature, thus increasing the top losses of the collector. The double glass decreases the top loss coefficient of the collector and hence increases the efficiency of the solar system [47]. The glass is low iron and transmits a value of 90% for long-wave radiation and almost zero for short-wave radiation (5.0–50 µm). The surface of the absorber plate has a black matte coating to increase the absorptivity of the absorber and increase the heat transfer rate between the plate and fluid. The most economical absorber coating is the black matte plate [37]. The CPC is mounted east-west with a southward tilt angle of 24°. To analyze the performance of the solar hybrid cooling system, a conventional VCR model was initially analyzed for a cooling load of the installed test room, and then the simulation of the various modeled configurations was analyzed. LiBr-H2o was selected as a working fluid in the SVAR and R410A as a refrigerant for the VCR system. The pair of solutions in the SVAR system was chosen to enable air conditioning for a temperature above 0 °C. The solution of LiBr-water is eco-friendly and has no impact on the environment. The required thermal energy is supplied by a series of CPC collectors based on the SVAR generator’s requirements. The collector was selected based on the optimum temperature required for the efficient working of the SVAR. The temperature required is 80–120 °C for the efficient working of the SVAR. The heat load for which the SVAR and VCR are designed is based on the cooling load for the test room. The air as the transport medium is pushed along by means of a centrifugal blower to meet the required flow rate and pressure drop across the CPC and SVAR generator.
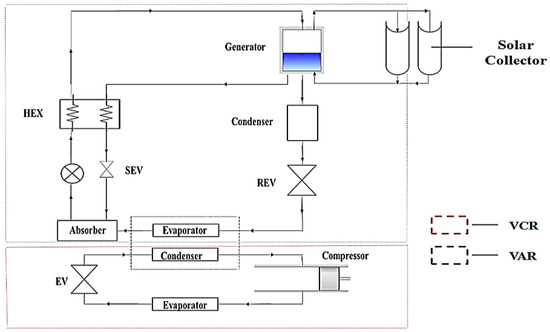
Figure 3.
Solar hybrid system.
Since solar energy varies with the time of day, the solar hybrid cooling system varies continuously; hence, it is called a dynamic system. This study is thus a performance analysis of solar hybrid cooling configuration models using CPC as the solar collector.
3. Model Development and Analysis
3.1. Global Solar Radiation
A surface can be irradiated by the following three sources:
- Direct irradiation (GD)
- Diffuse irradiation (Gdϴ)
- Irradiation reflected from the ground (GR)
The total irradiation on a surface is therefore given by
To calculate the beam energy falling on a surface of any orientation, it is necessary to convert the incoming beam flux from the direction of the sun to the direction normal to the surface.
Direct irradiation on a surface of any orientation can be deduced from the direct irradiation on a surface normal to the sun’s rays called direct normal irradiance (DNI) denoted by ().
A: apparent solar irradiation at air mass equal to zero (W/m2)
B: atmospheric extinction coefficient, the radiant energy absorption by the particles and gases in the sky.
: Solar elevation (altitude) angle
= Diffuse irradiation on a horizontal surface
The amount of radiation received due to reflection from the ground,
A, B, and C are constants whose values keep changing every month, as shown in Table 4. These values depend on the dust and water-vapor content of the atmosphere and on the changing in the earth—sun distance during the year. As the earth’s axis is tilted relative to its orbital plane by 23.45°, the positive angle indicates the earth is tilted towards the north, whereas the negative indicates towards the south, and zero when the axis is not tilted relative to its reference plane.
Table 4.
Values of solar constants for clear sky [48].
3.2. Cooling Load Temperature Difference (CLTD) Method for Cooling Load
To estimate the cooling load for the test room, the CLTD method was used. The CLTD initially calculates the sensible cooling load required based on the transfer function method (TFM). The manual procedure was adopted to estimate the cooling load for two occupants inside the room.
- The CLTD is used to calculate the sensible cooling load for the exterior walls and roofs.
- The solar cooling load (SCL) factor is added to represent the solar heat gain at that hour and also reflects the thermal storage effect due to various types of material used for building construction and for floor covering.
- The cooling load factor (CLF) is used to calculate the internal sensible cooling load.
- The following is the detailed procedure for calculating the cooling load method using CLTD [40].
Space cooling load due to heat gain through exterior walls, roofs, and transparent glass is calculated using Equation (11) [49].
where
Space cooling load due to heat gain through electric lights is calculated using Equation (12) [49].
Space cooling load due to heat gain through equipment and appliances is calculated using Equation (13) [40].
Space cooling load due to heat gain from occupants and people is calculated using Equation (14) [49].
3.3. Performance Analysis of CPC
Let us consider a CPC having aperture width W, length L, and acceptance angle . Assume that the CPC collects both diffuse and beam radiation having a large acceptance angle. Then the beam radiation falling on the aperture plane is given by
The diffuse radiation within the acceptance angle is given by
Then solar flux entering the aperture is given by [50]
The useful heat gain is given by [41]
Similarly, the heat gain from the collector by the fluid with a certain mass flow rate is given by [50]
From Equations (15) and (16), we get
The instantaneous efficiency is given by [50]
3.4. Thermodynamic Analysis of VCR and SVAR
The performance of each system component is analyzed using the first and second laws of thermodynamics. The first law of thermodynamics is used for energy analysis, whereas the second law of thermodynamics is for exergy analysis, which considers the losses incurred in the system with the introduction to entropy generation. Figure 4 shows two different systems, VCR and SVAR, whereas Table 5 shows the energy and exergy at different state points.
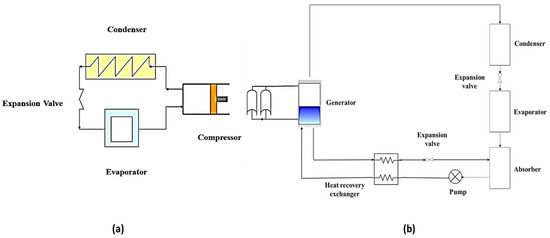
Figure 4.
(a) VCR system (b) SVAR system.
Table 5.
Energy and exergy of the VCR and SVAR components.
3.4.1. Coefficient of Performance (COP)
The COP of VCR is given by [51]
The COP of SVCR is given by [18]
3.4.2. Exergy COP
Exergy COP of VCR [51]
The exergy for the absorber system is given by [18]
3.4.3. Exergy Efficiency
The exergy efficiency of VCR is given by [51]
The exergy efficiency of SVAR on the theoretical formulation, given as [18]
3.5. Model Configuration
This section deals with the modeling of solar hybrid cooling. Based on the experimental setup, the solar hybrid cooling system was modeled into five configurations using the EES as shown in Figure 5.
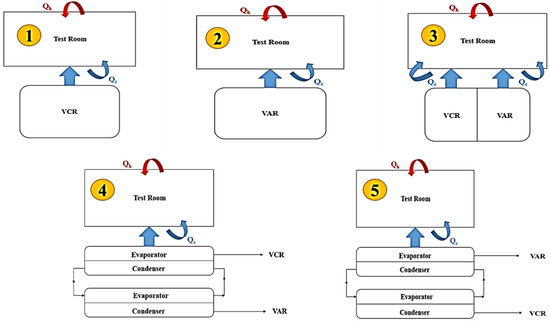
Figure 5.
Cooling models configuration.
Configurations 1 and 2, where VCR and SVAR are directly used for cooling the room, are shown in Figure 5; in configuration 3, the cooling load to the test room is partially supplied by the VCR and partially by SVAR. The modeling was performed on the assumption that both the systems connected in parallel contribute equally to the cooling load of the test room.
Assumption 1
- 50% of the cooling load supplied by VCR
- 50% of the cooling load supplied by SVAR
The performance of individual systems was calculated using the equations prescribed in Table 5; the combined performance is given by
The combined exergy COP was calculated using the equation
The combined exergy efficiency was calculated using the equation
In configuration 4 as shown in Figure 5, the VCR and VAR are connected in series. The cooling from the evaporator of the VAR is used to cool the condenser of the VCR system, which is connected in series.
Assumption 2
- The condenser of VCR and evaporator of VAR are considered a lumped system.
- The condenser of VCR and evaporator of VAR are considered heat exchangers.
- The total cooling load from the evaporator of VAR is supplied to the condenser of the VCR.
Inonfiguration 5 as shown in Figure 5, the VAR and VCR are connected in series. The cooling from the evaporator of the VCR is used to cool the condenser of the VAR system, which is connected in series.
Assumption 3
- The condenser of VAR and evaporator of VCR are considered lumped systems.
- The condenser of VAR and evaporator of VCR are considered heat exchangers.
The total cooling load from the evaporator of the VCR is supplied to the condenser of the VAR.
4. Results and Discussion
In this section, the proposed system components’ performance is analyzed, validated, and estimated. The simulation of various configurations is also analyzed. Figure 6 shows the specific approach for modeling and analyzing the system performance. To enrich the understanding of the proposed system, the parametric analysis of the system components is considered in conjunction with the important design parameters. Several performance analyses have been discussed to support the design and performance of the proposed model based on the existing designs. The performance analysis of the solar hybrid cooling system includes the energy utilized under various design conditions. The discussion also includes the performance of various solar hybrid cooling configuration models possible to enhance the performance of the solar hybrid cooling technology. Finally, with the obtained performance analysis, the effect of the proposed models on the environment is discussed.
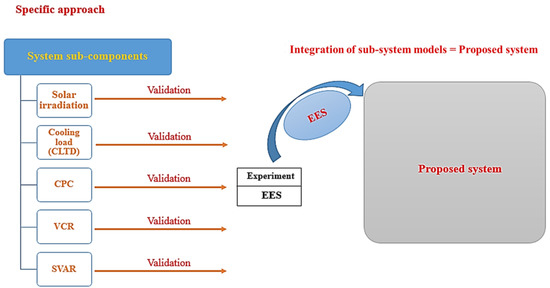
Figure 6.
Performance analysis approach.
4.1. Estimation of Cooling Load Using CLTD and HAP
Steady-state modeling was done for the room space. The cooling load was calculated using the cooling load temperature difference (CLTD) method, which is one of the family members of the transfer function method (TFM).
King Saud University is located in Riyadh at a latitude of 24.6° N and longitude of 46.7° E. The internal designed temperature for the room was 20 °C, and the external maximum temperature was 48 °C with a daily range of 21 °C. The relative humidity inside the room is assumed to be 50% RH with an electrical light of 20 Watts and a computer of 0.17 HP rater power. The same input conditions are used for estimating the cooling load HAP. Table 6 describes the test room building envelope, and Table 7 gives the results obtained for the cooling load using CLTD and HAP.
Table 6.
Overall heat transfer coefficient of the wall.
Table 7.
Calculated cooling load using CLTD.
The equivalent thermal conductivity (k) and overall heat transfer coefficient (UL) of the building wall are 0.081 W/mK and 48.09525495 W/m2K, respectively.
4.2. Validation of Solar Radiation
To support the EES simulation model, the solar model was compared with the experimental data collected using the pyranometer on the roof. The data were collected for 21 March 2022. Figure 7 shows the flow chart of the simulation obtained using EES for the specified date. The maximum intensity of global radiation recorded was 850.62 W/m2 at 12:10 p.m. with an overall average of 509.19 W/m2. Figure 8 shows the variation of experimental and EES solar radiation models, whereas Table 8 shows the maximum values obtained.
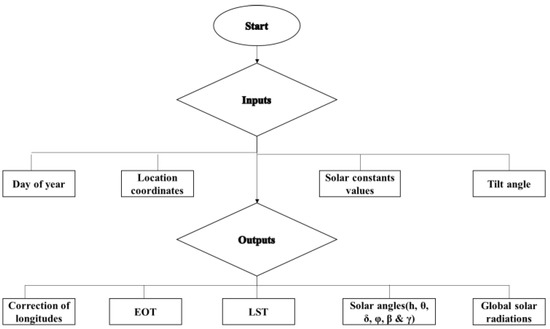
Figure 7.
Flow chart for EES simulation.
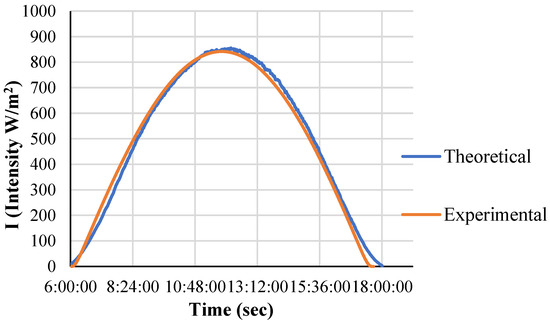
Figure 8.
Comparison of EES and experimental solar radiations, 21 March.
Table 8.
Results obtained for solar radiations from the EES and Experiment for 21 March.
4.3. Validation of CPC
4.3.1. Experimental Determination of Efficiency, FR, and UL Values of the CPC
The experimental procedure was based on the testing procedure for collectors prescribed in the (ASHRAE). Figure 9 shows the experimental setup. The experiment was carried out on 19 May–22 May 2022. The CPC and blower were connected in series with the exit of the blower to the inlet of the CPC, and inlet suction to the exit of the CPC, making it a closed loop system with a steady mass flow rate. The pressure drop was measured using the digital manometer across the orifice plate positioned at the inlet and exit of the collector. The K-type thermocouples were positioned for recording the inlet, exit, and ambient temperatures. The data were recorded at an interval of 30 min from 11:30 a.m. to 13:30 for specific mass flow rates for four consecutive days as mentioned in Table 9, after bringing the system to a steady-state condition. Table 9 shows the average values of each variable recorded, with a specific mass flow rate for each day for four consecutive days. Figure 10 shows the curve obtained against and efficiency (). The efficiency of the collector was calculated using Equation (18).
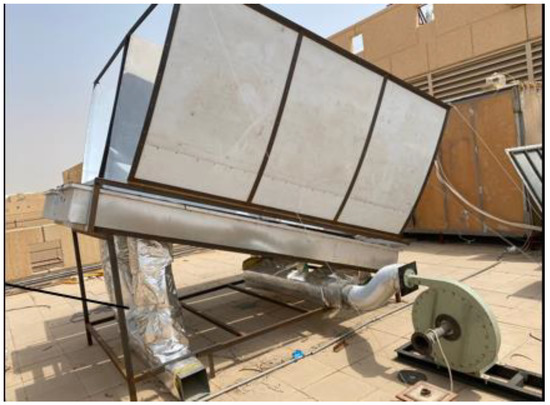
Figure 9.
Experimental setup for solar air testing.
Table 9.
CPC performance data.
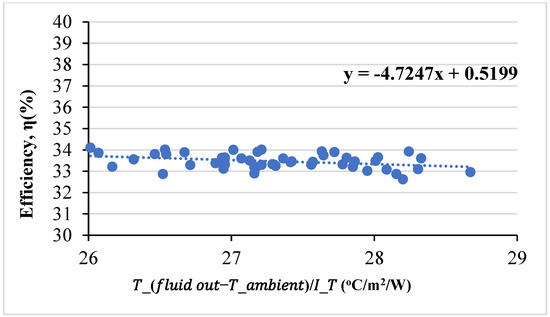
Figure 10.
Efficiency curve for CPC with double glazing.
The above line is in the form of y = mx + c, Compared with Equation (17), we wet
The maximum efficiency is recorded as 0.58 with a mass flow rate of 0.36 kg/s at 12:40 p.m., while the minimum efficiency is recorded as 0.32 with a mass flow rate of 0.17 kg/s at 12:40 p.m. as shown in Table 9.
4.3.2. CPC Validation Approach
The CPC is modeled using the actual tilt angle of 25° for the experimental date of 21 May. Table 10 shows the results obtained, whereas Figure 11 shows the flow chart for the CPC validation approach.
Table 10.
Results of CPC for experimental values for 21 May.
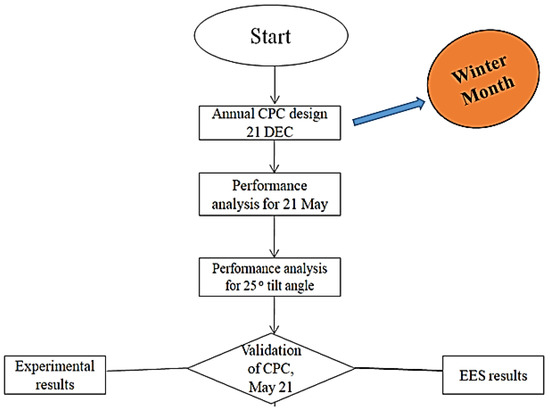
Figure 11.
Flow chart for CPC validation using EES.
The above model is based on the experimental tilt angle of 25° towards the south. The possible heat output obtained is 10.81 kW with a fluid outlet temperature of 91.96 °C. From Table 11, it can be seen that for the concentration ratio of 3.1, the aperture area and useful heat are 16.71 m2 and 5.99 kW, respectively. Table 12 shows the performance results obtained for the CPC utilizing the EES and experiment as shown in Section 4.3.
Table 11.
Parametric analysis of CPC using EES for 21 May.
Table 12.
Comparison of EES and experimental results.
From the experimental results of CPC performance detailed in this section, the efficiency of the CPC is 0.40 with an aperture area of 9.6 m2 for the heat output of 4.72 kW, whereas the efficiency obtained by EES analysis is 0.39 with an aperture area of 16.4 m2 for 5.99 kW under the same ambient conditions.
The parametric analysis of the EES model from Table 11 shows that with the increase in the area of the CPC, the fluid outlet temperature increases. As the concentration ratio is constant, the width of the CPC is also constant; hence the area changes with the change in the length of the CPC, as shown in Table 13.
Table 13.
Effect of aperture area on the useful heat gained from the CPC for 21 May.
The parametric analysis as shown in Table 13 demonstrates that with every 1 m2 decrease in the aperture area, the heat output decreases by 3.5%. The experimental aperture area is 9.6 m2, which is almost 6.8 m2 (23.94%) less than 16.4 m2 obtained through the EES model for the same concentration ratio as shown in Table 11, and consequently, the calculated EES heat output is 4.56 kW. Table 14 shows the experimental and theoretical values of the heat output and efficiency for 21 May.
Table 14.
Comparison of theoretical and experimental value models for 21 May.
4.4. Validation of Solar Vapor Absorption System (SVAR)
The solar VAR (Libr-H2O) system for the cooling load of 1.96 TR is designed using the EES. The thermal energy required for the VAR was provided through a solar air collector (SAH). The design was based on the thermodynamics analysis and the thermodynamics properties found for the states 7, 8, 9, and 10 using the steam. However, for the binary mixture at the state, 1, 2, 3, 4, 5, and 6, the thermodynamics properties of LiBr-H2O were used. The validation of the SVAR model is shown in Table 15,which demonstrates the good agreement of results obtained between the present EES model and the results obtained by Jasim Abdulateef et al. [52].
Table 15.
Comparison of SVAR models.
4.5. Modeling of SVAR for Experimental Data
The solar cooling system is modeled and the simulation of performance is performed utilizing the recorded data for 21 March for the condenser temperature of 40 °C.
The input data are shown in Table 16, whereas the result is shown in Table 17. From Table 17, it can be seen that the COP of energy and exergy obtained is 0.73 and 0.44, respectively.
Table 16.
Input experimental values utilized for the CPC analysis for 21 March.
Table 17.
Analysis result of the SVAR for 21 March.
4.5.1. Effect of Generator Temperature on COP of SVAR and Efficiency of Solar Collector
Figure 12 shows the variation of the SVAR COP and the efficiency of the CPC collector for a range of specified SVAR generator temperatures. From the above figure, it is clear that the COP of the SVAR system increases with the increase in the generator temperature, and the efficiency of the solar CPC collector decreases with an increase in the generator temperature. The maximum COP of 0.72 is obtained at the generator temperature of 99.55 °C, whereas the minimum of 0.22 is obtained at the generator temperature of 80.78 °C. The minimum CPC collector efficiency of 0.29 is obtained at the generator temperature of 99.55 °C, and the maximum is recorded at 0.31 with a generator temperature of 80.78 °C.
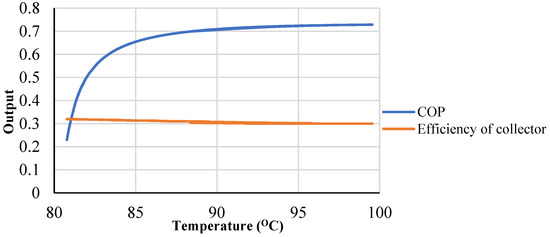
Figure 12.
Variation of COP and efficiency of SVAR and CPC, respectively, with generator temperature for 21 May.
4.5.2. Effect of Generator Temperature on COP and Energy of SVAR
Figure 13 shows the variation of energy consumed and efficiency of the SVAR system with varying generator temperatures. The figure shows that both the energy and efficiency of the SVAR increase with an increase in the generator temperature. The maximum and minimum energy values of 7.12 kWh and 2.24 kWh and maximum and minimum COP values of 0.72 and 0.22 are obtained at generator temperatures of 99.55 °C and 80.78 °C, respectively.
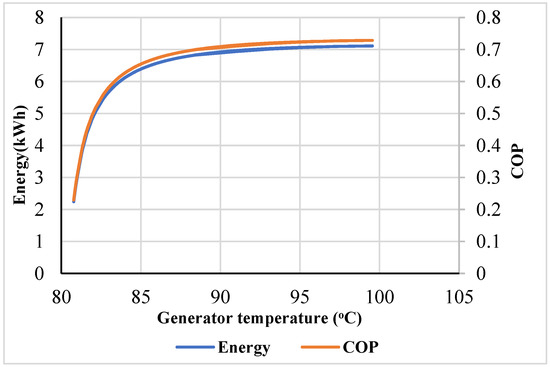
Figure 13.
Variation of energy and COP of SVAR with generator temperature for 21 May.
4.5.3. Effect of Time on the SVAR Performance
Figure 14 shows the variation of SVAR system performance with time for a designed heat load. From the figure it is seen that SVAR performance increases with time from 8 a.m. to 12 a.m. and then decreases with an increase in the time from 12 a.m. to 4 p.m. The maximum heat load produced by the SVAR is 99.96% at 12 a.m., whereas the minimum heat load produced is 12.41% at 8 a.m. followed by 13.41% at 4 p.m.
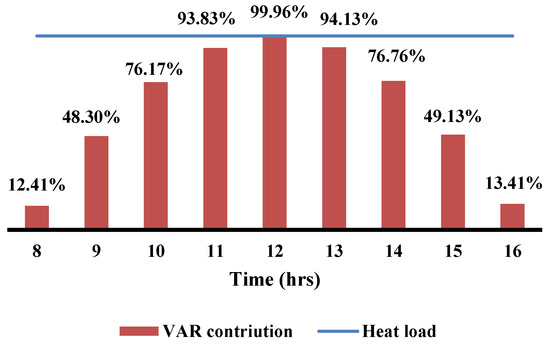
Figure 14.
Contribution of VAR to the designed cooling load with variation in time.
4.5.4. Effect of Day of the Year on the Energy of SVAR
Figure 15 shows the energy of cooling produced by the SVAR system for the 21st of every month during the year for the standard-designed model. The maximum energy obtained for 21 December is 7.50 kWh while the minimum is 7.23 kWh obtained for 21 June.
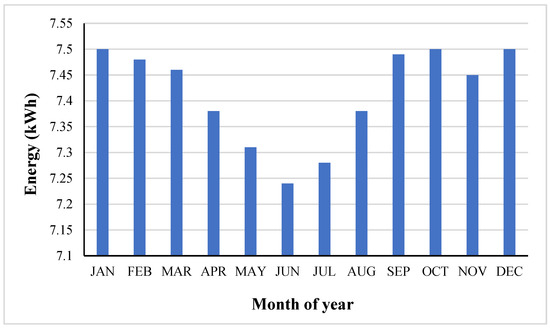
Figure 15.
SVAR annual energy.
4.5.5. Effect of SVAR on Environment Pollution
Figure 16 shows the SVAR effect on the environment with the reduction in the carbon dioxide produced using the conventional energy-producing technologies for the 21st of every month during the year for the standard-designed model. The maximum reduction obtained for 21 December is 653.96 kg while the minimum is 610 kg obtained for 21 June. The annual reduction from the SVAR obtained is 7630.58 kg of CO2
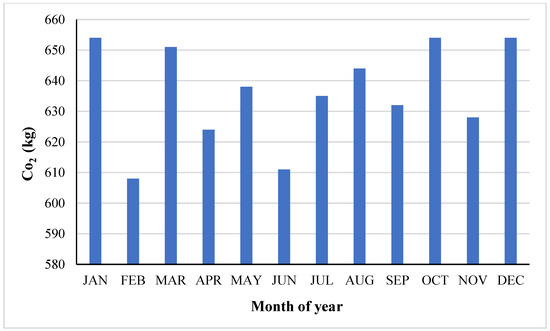
Figure 16.
Effect of SVAR on the Environment.
4.6. Modeling of the Solar Hybrid Cooling System Using EES
The five different solar hybrid cooling models as detailed in Section 3.5 are analyzed using EES. Table 18 shows the different configurations of models and types of arrangement.
Table 18.
Cooling models configuration.
Figure 17 shows the performance of various models analyzed. It is clear that model 4 has the maximum value of COP and exergy efficiency with 4.41 and 3.78, respectively, whereas model 1 has the maximum COP of exergy with 7.83 because the system uses electrical energy. The COP of energy and exergy of a single-stage VCR system are 77% and 96.6% higher than the single-effect SVAR system. However, the exergy efficiency is 69.7% higher than for SVAR.
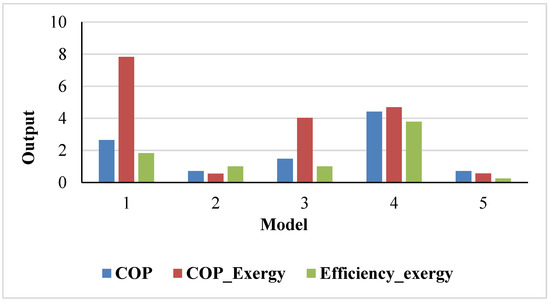
Figure 17.
Performance of configuration models.
Among the solar hybrid cooling models discussed, the series configuration of a hybrid system, SVAR integrated with the condenser of VCR, produces higher values with COP energy of 4.41, 40% higher than with the conventional VCR system. However, the same model has the equivalent amount of a 40% decrease in the COP of exergy and only 26.7% of exergy efficiency as compared with a conventional VCR system. Table 19 indicates the evolution of the thermodynamic properties of Model 4, whereas Table 20 indicates the performance result.
Table 19.
Thermodynamic data of VCR in the hybrid system Model 4.
Table 20.
Performance results of the figure.
5. Conclusions
The CPC is effective in providing the required temperature and heat to the SVAR generator during the peak cooling load. The performance and contribution of SVAR increase with time from 10 a.m. to 1p.m., decreasing the use of high-grade energy from VCR. The reason for the lower fluid outlet temperature of 63.5 °C is due to the higher value of UL. The proposed model is effective in providing the required energy to SVAR for annual use.
The energy and exergy of COP related to the vapor compression system is higher than in other hybrid cooling models because the former uses high-grade energy for its operation, which strongly agrees with the results of our preliminary research work. The configuration integrating VCR to the condenser of the SVAR has less effect on the performance of the hybrid system. The SVAR integrated in series with the VCR condenser system produces 83% higher COP than the system with VCR integrated with the condenser of the SVAR system. Similarly, they have 88% and 84% higher values of exergy COP and exergy efficiency respectively.
From the analysis of solar hybrid cooling models as detailed in model 4, the integration of SVAR to the condenser of the VCR can be used as an alternative to the individual VCR system, which comes with high-grade energy. The higher exergy efficiency of 3.84 in model 4 also leads to the conclusion that the system is more sustainable and the exergy destruction is minimal.
The integration of SVAR to the condenser of the VCR as a hybrid model increases the cooling capacity of the VCR by 68% and also increases the exergy efficiency by 51.6%, thus increasing the performance of the system and decreasing the exergy destruction. The integration of SVAR by utilizing the CPC to the condenser of the VCR as a hybrid model increases the cooling capacity of the VCR by 68% and decreases the carbon emission by 166.4%.
Considering system performance, the temperature of the SVAR generator is limited to the concentration of the LiBr in the Libr-H2O mixture. The losses in the CPC are one of the important parameters to be considered, for the losses increase the CPC, and the system efficiency decreases.
In the future, a SVAR absorber and condenser could provide a low-grade, high quantity of energy for suitable applications such as drying. Analyzing the cost of the power from the proposed module and comparing the results to those of a photovoltaic module would demonstrate how quickly such a module would pay back. As the world is evolving toward AI, the integration of the proposed system could be an effective approach to increase the performance of the solar hybrid cooling system.
Author Contributions
Experimental analysis: Z.K. and A.S.; Methodology: Z.K.; Theoretical model: A.S.; Writing and original draft: Z.K. and A.S.; Review & editing: A.S. All authors have read and agreed to the published version of the manuscript.
Funding
The authors extend their appreciation to the Deputyship for Research and Innovation, Ministry of Education in Saudi Arabia for funding this research work through the project no. IFKSUOR3–546.
Institutional Review Board Statement
Not applicable.
Informed Consent Statement
Not applicable.
Data Availability Statement
Not applicable.
Conflicts of Interest
The authors declare no conflict of interest. The funders had no role in the design of the study; in the collection, analyses, or interpretation of data; in the writing of the manuscript; or in the decision to publish the results.
Nomenclature
| A = area of the sun (m2) | = global solar radiation (W/m2) | S = entropy (KJ/kg K) |
| = area of CPC (m2) | L = length of the collector (m) | = sensible heat gain of each person (J/s) |
| = aperture area of the collector (m2) | LL = longitude at the given location | T = temperature (°C) |
| = area of the receiver/Absorber (m2) | LS=longitude at the standard meridian for the time zone | = ambient temperature (°C) |
| A1 = area of the sphere containing Earth (m2) | = Latent heat gain of a person, 120 (J/s) | = fluid inlet temperature (°C) |
| B = width of the absorber (m) | m = mass flow rate (kg/s) | = fluid outlet temperature (°C) |
| = flat roof, 62(ASHRAE handbook) | = mass of air flow rate (kg/s) | Ts = source temperature (K) |
| E = Energy (kWh) | N = day of year | Tr = receiver temperature (K) |
| EER = energy efficiency ratio | = no. of occupants inside the room. | TM =mean outdoor temperature, 306.15 K |
| = allowance factor for light fixtures | P = pressure (Pascal) | TR = indoor room temperature, 295.15 K |
| = load factor, a ratio of actual to required power | Php = rated machine horsepower, 186.5 (W) | UL = overall heat transfer coefficient (W/m2K) |
| = use factor indicating ratio of actually used equipment and appliance to total installed. | ΔP = pressure head (Pascal) | W = width of the collector (m) |
| = heat removal factor | Q = energy radiated from the sun (watts) | = light Watts inside room, 2603 (W) |
| Fsur-g = view factor of the surface concerning ground | = condenser heat (kW) | = work done by pump (watts) |
| Fsur-sky = view factor of the surface concerning the sky | = compressor heat (kW) | X = concentration (%) |
| G = solar constant (W/m2) | = evaporator heat (kW) | = absorbitivity |
| GD = direct irradiation (W/m2) | = generator heat (Kw) | = emissivity of glass |
| Gdϴ = diffuse irradiation (W/m2) | R = thermal resistance (k/W) | β = solar elevation angle |
| = direct normal irradiance (W/m2) | r = radius of the sun (m) | γ = the surface solar azimuth angle |
| GR = irradiation reflected from the ground (W/m2) | r1 = distance between the Sun and Earth (m) | ψ = surface azimuth angle |
| Gth=total irradiance received by the ground from the sun (W/m2) | = sensible heat gain of each person, 143 (J/s) | σ = stephan Boltzmann constant (W/m2 k4) |
| h = enthalpy (KJ/kg) | = mechanical efficiency 0.90% | ρg = reflectance from the ground |
| = mechanical efficiency, 0.85% |
Acronyms
| COP = Coefficient of performance | SAH = Solar air heater |
| CPC = Compound parabolic collector | SVAR = Solar vapor absorption system |
| EOT = Equation of time | VAR = Vapor absorption system |
| HAP = Hourly analysis program | VCR = Vapor compression system |
| LST = Local solar time |
References
- Hajimineh, R.; Moghani, A.M. The important factors of Saudi Arabian policy-making in renewable energy resources. Future Energy 2023, 2, 29–38. [Google Scholar] [CrossRef]
- Worrall, F.; Howden, N.J.; Burt, T.P.; Hannah, D.M. River water temperature demonstrates resistance to long-term air temperature change. Hydrol. Process. 2022, 36, e14732. [Google Scholar] [CrossRef]
- Behar, A.; Ritz, R.A. OPEC vs. US shale: Analyzing the shift to a market-share strategy. Energy Econ. 2017, 63, 185–198. [Google Scholar] [CrossRef]
- Howarth, N.; Odnoletkova, N.; Alshehri, T.; Almadani, A.; Lanza, A.; Patzek, T. Staying cool in A warming climate: Temperature, electricity and air conditioning in Saudi Arabia. Climate 2020, 8, 4. [Google Scholar] [CrossRef]
- Al-Ismail, F.S.; Alam, M.S.; Shafiullah, M.; Hossain, M.I.; Rahman, S.M. Impacts of Renewable Energy Generation on Greenhouse Gas Emissions in Saudi Arabia: A Comprehensive Review. Sustainability 2023, 15, 5069. [Google Scholar] [CrossRef]
- Rahman, S.M.; Khondaker, A. Mitigation measures to reduce greenhouse gas emissions and enhance carbon capture and storage in Saudi Arabia. Renew. Sustain. Energy Rev. 2012, 16, 2446–2460. [Google Scholar] [CrossRef]
- Al-Munqedhi, B.M.; El-Sheikh, M.A.; Alfarhan, A.H.; Alkahtani, A.M.; Arif, I.A.; Rajagopal, R.; Alharthi, S.T. Climate change and hydrological regime in arid lands: Impacts of dams on the plant diversity, vegetation structure and soil in Saudi Arabia. Saudi J. Biol. Sci. 2022, 29, 3194–3206. [Google Scholar] [CrossRef]
- Dong, Y.; Coleman, M.; Miller, S.A. Greenhouse gas emissions from air conditioning and refrigeration service expansion in developing countries. Annu. Rev. Environ. Resour. 2021, 46, 59–83. [Google Scholar] [CrossRef]
- Al-Homoud, M.S.; Krarti, M. Energy efficiency of residential buildings in the kingdom of Saudi Arabia: Review of status and future roadmap. J. Build. Eng. 2021, 36, 102143. [Google Scholar] [CrossRef]
- Leng, Y.-J.; Zhang, H. Comprehensive evaluation of renewable energy development level based on game theory and TOPSIS. Comput. Ind. Eng. 2023, 175, 108873. [Google Scholar] [CrossRef]
- Ahmadi, M.H.; Sayyaadi, H.; Mohammadi, A.H.; Barranco-Jimenez, M.A. Thermo-economic multi-objective optimization of solar dish-Stirling engine by implementing evolutionary algorithm. Energy Convers. Manag. 2013, 73, 370–380. [Google Scholar] [CrossRef]
- Bi, Y.; Zang, G.; Qin, L.; Li, H.; Wang, H. Study on the characteristics of charging/discharging processes in three-phase energy storage coupling in solar air conditioning system. Energy Build. 2019, 204, 109456. [Google Scholar] [CrossRef]
- Pintaldi, S.; Li, J.; Sethuvenkatraman, S.; White, S.; Rosengarten, G. Model predictive control of a high efficiency solar thermal cooling system with thermal storage. Energy Build. 2019, 196, 214–226. [Google Scholar] [CrossRef]
- Kaneesamkandi, Z.; Almalki, M.J.; Sayeed, A.; Haidar, Z.A. Passive Cooling of PV Modules Using Heat Pipe Thermosiphon with Acetone: Experimental and Theoretical Study. Appl. Sci. 2023, 13, 1457. [Google Scholar] [CrossRef]
- Khan, M.A.; Rehman, S.; Al-Sulaiman, F.A. A hybrid renewable energy system as a potential energy source for water desalination using reverse osmosis: A review. Renew. Sustain. Energy Rev. 2018, 97, 456–477. [Google Scholar] [CrossRef]
- Farahat, A.; Kambezidis, H.D.; Almazroui, M.; Al Otaibi, M. Solar Potential in Saudi Arabia for Inclined Flat-Plate Surfaces of Constant Tilt Tracking the Sun. Appl. Sci. 2021, 11, 7105. [Google Scholar] [CrossRef]
- Melhem, R.; Shaker, Y. Optimum Tilt Angle and Solar Radiation of Photovoltaic Modules for Gulf Collaboration Council Countries. Int. J. Energy Res. 2023, 2023, 8381696. [Google Scholar] [CrossRef]
- Mohandes, M.; Rehman, S. Global solar radiation maps of Saudi Arabia. J. Energy Power Eng. 2010, 4, 57–63. [Google Scholar]
- IEA, O. Energy and climate change, world energy outlook special report. Int. Energy Agency 2015, 200, 63. [Google Scholar]
- Prasartkaew, B.; Kumar, S. Design of a renewable energy based air-conditioning system. Energy Build. 2014, 68, 156–164. [Google Scholar] [CrossRef]
- N’tsoukpoe, K.E.; Le Pierrès, N.; Luo, L. Numerical dynamic simulation and analysis of a lithium bromide/water long-term solar heat storage system. Energy 2012, 37, 346–358. [Google Scholar] [CrossRef]
- N’Tsoukpoe, K.; Le Pierrès, N.; Luo, L. Experimentation of a LiBr–H2O absorption process for long-term solar thermal storage: Prototype design and first results. Energy 2013, 53, 179–198. [Google Scholar] [CrossRef]
- Kadam, S.T.; Kyriakides, A.-S.; Khan, M.S.; Shehabi, M.; Papadopoulos, A.I.; Hassan, I.; Rahman, M.A.; Seferlis, P. Thermo-economic and environmental assessment of hybrid vapor compression-absorption refrigeration systems for district cooling. Energy 2022, 243, 122991. [Google Scholar] [CrossRef]
- Romero, R.; Cerezo, J.; Martínez, A.R.; Luna, G.H.; Montiel-González, M. On the Dimensionless Absorption Heat Pump Widespread. J. Adv. Therm. Sci. Res. 2021, 8, 10–20. [Google Scholar] [CrossRef]
- Sadiq Munfath Khan, M.; Orfi, J. Cooling performance and energy saving analysis of cascade refrigeration system powered by solar energy for Riyadh region (Saudi Arabia). Int. J. Sustain. Build. Technol. Urban Dev. 2014, 5, 44–52. [Google Scholar] [CrossRef]
- Allouhi, A. A novel grid-connected solar PV-thermal/wind integrated system for simultaneous electricity and heat generation in single family buildings. J. Clean. Prod. 2021, 320, 128518. [Google Scholar] [CrossRef]
- Jain, V.; Colorado, D. Thermoeconomic and feasibility analysis of novel transcritical vapor compression-absorption integrated refrigeration system. Energy Convers. Manag. 2020, 224, 113344. [Google Scholar] [CrossRef]
- Ghosh, K.K.; Sonawane, C.R.; Pandey, A.; Panchal, H.; El-Shafay, A.; Ibrahim, A.M.M.; Alsoufi, M.S.; Elsheikh, A. Experimental investigations on indirect contact type liquid desiccant cooling systems for high latent heat load application. Case Stud. Therm. Eng. 2022, 31, 101814. [Google Scholar] [CrossRef]
- Jain, V.; Kachhwaha, S.; Sachdeva, G. Thermodynamic performance analysis of a vapor compression–absorption cascaded refrigeration system. Energy Convers. Manag. 2013, 75, 685–700. [Google Scholar] [CrossRef]
- Hussein, A.K.; Li, D.; Kolsi, L.; Kata, S.; Sahoo, B. A review of nano fluid role to improve the performance of the heat pipe solar collectors. Energy Procedia 2017, 109, 417–424. [Google Scholar] [CrossRef]
- El-Said, E.M.; Abd Elaziz, M.; Elsheikh, A.H. Machine learning algorithms for improving the prediction of air injection effect on the thermohydraulic performance of shell and tube heat exchanger. Appl. Therm. Eng. 2021, 185, 116471. [Google Scholar] [CrossRef]
- Zhou, Y. Artificial intelligence in renewable systems for transformation towards intelligent buildings. Energy AI 2022, 10, 100182. [Google Scholar] [CrossRef]
- Fathabadi, H. Novel low-cost parabolic trough solar collector with TPCT heat pipe and solar tracker: Performance and comparing with commercial flat-plate and evacuated tube solar collectors. Sol. Energy 2020, 195, 210–222. [Google Scholar] [CrossRef]
- Tchinda, R. A review of the mathematical models for predicting solar air heaters systems. Renew. Sustain. Energy Rev. 2009, 13, 1734–1759. [Google Scholar] [CrossRef]
- Ashitha, S.; George, S.C. Splitting of Water: Biological and Non-Biological Approaches. In Handbook of Biofuels; Elsevier: Amsterdam, The Netherlands, 2022; pp. 453–469. [Google Scholar]
- Avargani, V.M.; Norton, B.; Rahimi, A. An open-aperture partially-evacuated receiver for more uniform reflected solar flux in circular-trough reflectors: Comparative performance in air heating applications. Renew. Energy 2021, 176, 11–24. [Google Scholar] [CrossRef]
- Kalogirou, S. Nontracking Solar Collection Technologies for Solar Heating and Cooling Systems. In Advances in Solar Heating and Cooling; Elsevier: Amsterdam, The Netherlands, 2016; pp. 63–80. [Google Scholar]
- Winston, R. Principles of solar concentrators of a novel design. Sol. Energy 1974, 16, 89–95. [Google Scholar] [CrossRef]
- Khan, M.M.A.; Ibrahim, N.I.; Saidur, R.; Mahbubul, I.; Al-Sulaiman, F.A. Performance assessment of a solar powered ammonia–water absorption refrigeration system with storage units. Energy Convers. Manag. 2016, 126, 316–328. [Google Scholar] [CrossRef]
- Salameh, T.; Alkhalidi, A.; Rabaia, M.K.H.; Al Swailmeen, Y.; Alroujmah, W.; Ibrahim, M.; Abdelkareem, M.A. Optimization and life cycle analysis of solar-powered absorption chiller designed for a small house in the United Arab Emirates using evacuated tube technology. Renew. Energy 2022, 198, 200–212. [Google Scholar] [CrossRef]
- Rosiek, S.; Batlles, F. Integration of the solar thermal energy in the construction: Analysis of the solar-assisted air-conditioning system installed in CIESOL building. Renew. Energy 2009, 34, 1423–1431. [Google Scholar] [CrossRef]
- Gado, M.G.; Megahed, T.F.; Ookawara, S.; Nada, S.; El-Sharkawy, I.I. Performance and economic analysis of solar-powered adsorption-based hybrid cooling systems. Energy Convers. Manag. 2021, 238, 114134. [Google Scholar] [CrossRef]
- Aljuhani, Y.; Dayem, A.A. Thermal analysis of a solar-powered absorption air-conditioning system: Case study for a tent in Mina zone, Saudi Arabia. Clean. Eng. Technol. 2022, 8, 100472. [Google Scholar] [CrossRef]
- Hamieh, A.; Rowaihy, F.; Al-Juaied, M.; Abo-Khatwa, A.N.; Afifi, A.M.; Hoteit, H. Quantification and analysis of CO2 footprint from industrial facilities in Saudi Arabia. Energy Convers. Manag. X 2022, 16, 100299. [Google Scholar] [CrossRef]
- Amran, Y.A.; Amran, Y.M.; Alyousef, R.; Alabduljabbar, H. Renewable and sustainable energy production in Saudi Arabia according to Saudi Vision 2030; Current status and future prospects. J. Clean. Prod. 2020, 247, 119602. [Google Scholar] [CrossRef]
- Kalogirou, S.A. Solar thermal collectors and applications. Prog. Energy Combust. Sci. 2004, 30, 231–295. [Google Scholar] [CrossRef]
- Kalogirou, S.A.; Mathioulakis, E.; Belessiotis, V. Artificial neural networks for the performance prediction of large solar systems. Renew. Energy 2014, 63, 90–97. [Google Scholar] [CrossRef]
- Al-Sanea, S.A.; Zedan, M.; Al-Ajlan, S.A. Adjustment factors for the ASHRAE clear-sky model based on solar-radiation measurements in Riyadh. Appl. Energy 2004, 79, 215–237. [Google Scholar] [CrossRef]
- Edition, S. Ashrae Handbook; Stephen Comstock: Atlanta, GA, USA, 1993. [Google Scholar]
- Sukhatme, S. A Textbook on Heat Transfer; Universities Press: Hyderabad, India, 2005. [Google Scholar]
- Yumrutaş, R.; Kunduz, M.; Kanoğlu, M. Exergy analysis of vapor compression refrigeration systems. Exergy Int. J. 2002, 2, 266–272. [Google Scholar] [CrossRef]
- Abdulateef, J.; Ali, S.D.; Mahdi, M.S. Thermodynamic analysis of solar absorption cooling system. J. Adv. Res. Fluid Mech. Therm. Sci. 2019, 60, 233–246. [Google Scholar]
Disclaimer/Publisher’s Note: The statements, opinions and data contained in all publications are solely those of the individual author(s) and contributor(s) and not of MDPI and/or the editor(s). MDPI and/or the editor(s) disclaim responsibility for any injury to people or property resulting from any ideas, methods, instructions or products referred to in the content. |
© 2023 by the authors. Licensee MDPI, Basel, Switzerland. This article is an open access article distributed under the terms and conditions of the Creative Commons Attribution (CC BY) license (https://creativecommons.org/licenses/by/4.0/).