Abstract
In order to expand the zero-energy building, it is necessary to evaluate the economic feasibility of the passive and active elements applied to achieve the zero-energy building. The purpose of this study is to verify the final energy consumption and investment cost of a building according to the change of passive and active elements. In this study, the final energy consumption was calculated by region for the passive element S/V ratio (surface-to-volume ratio), the building’s orientation, and the active element (building-integrated photovoltaic) for the Department of Energy reference building type using simulations. In addition, the change in investment cost according to changes in energy consumption and production was calculated. As a result of the study, it was reasonable to invest in passive elements rather than active elements in the central region of Korea, and it was confirmed that investment in active elements was highly economical in the southern region of Korea. It is expected that the results of this study can be used as a guideline to enable the economic analysis of design elements in the design of zero-energy buildings.
1. Introduction
In the 29 member countries of the International Energy Agency, energy consumption in the building sector accounts for about 40% of the total energy consumption, which raises an urgent need to reduce energy consumption in the building sector. A zero-energy building is a building that minimizes the energy load by maximizing insulation performance and minimizes energy consumption by producing renewable energy such as solar power, as shown in Figure 1 [1,2,3]. The dictionary meaning of a zero-energy building is that the sum of energy production and consumption should be zero; however, a building that minimizes energy consumption is considered a zero-energy building based on the economic feasibility and the current level of technology. In this case, an integrated design method considering the efficiency of energy production and consumption is required [4]. It is expected that zero-energy buildings will be generalized in the future, and this is being made mandatory in stages through various policies [5]. Therefore, in this study, the design factors that were considered in the design process of a zero-energy building are divided into a passive factor to reduce energy consumption and an active factor to increase energy production, and the budget of a limited project is divided into each design factor. We derived a method that can efficiently distribute energy.
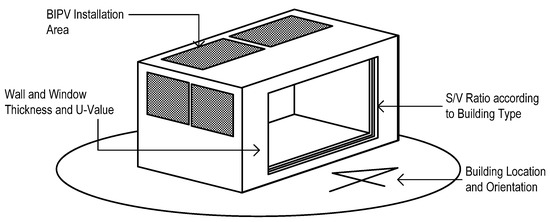
Figure 1.
Passive and active elements of zero-energy buildings.
To achieve a zero-energy building, energy consumption and production should be economically balanced. We conducted an economic evaluation by comparing the energy consumption and production of buildings according to the design factors of zero-energy buildings. In this study, the S/V ratio and windows among the passive elements and the solar system installation boundary condition among the active elements were selected as representative zero-energy building design elements. For these design factors, the final energy consumption was derived according to the orientation and location of the building. In addition, the change in energy consumption and production compared to the same cost was analyzed through the investment cost analysis of windows and photovoltaic systems (Figure 2).
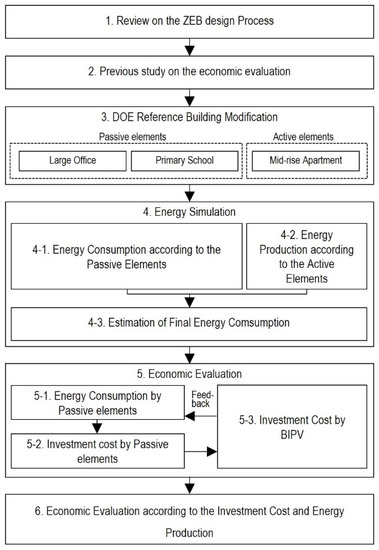
Figure 2.
Research method.
2. Preliminary Review
2.1. Review of the ZEB Design Process
Design elements of ZEBs can be divided into passive elements (S/V) to reduce energy consumption and active elements to increase energy production. In the study of Choi, various types of buildings composed of 16 modules were analyzed to derive energy consumption according to the building S/V ratio [6]. As a result, as the adjacent area between modules increased, the energy consumption decreased, and it was confirmed that the square shape had the smallest energy consumption. According to a previous study, an active element was applied to buildings, and it was verified that the solar module can be applied to the building wall in the form of BIPV to reduce heating energy in winter and to produce hot water in summer. In the study of Lee [7] on optimal design of passive and active elements, a design process for a zero-energy building was derived. Through simulation, they verified that passive elements (S/V ratio of the same volume building, thermal transmittance rate of the building envelope) and active elements (solar panel installation capacity) should be applied integrally in the design stage. Lee [8,9] and Lee [10] established a zero-energy building design process according to the design elements by analyzing the design elements in consideration of the shape of the building, the area where the building is located, and the orientation of the building [11]. UBC (University of British Columbia) also considered the passive and active design elements for energy consumption analysis [12]. Energy consumption and energy production are not in a trade-off relationship, and it is necessary to adopt both in an interconnected method.
2.2. Previous Studies on Economic Evaluation
Studies have been conducted to understand the effect of changes in design elements on the economic feasibility of a zero-energy building. Yoon calculated the change in the heating and cooling load according to the thermal transmittance of the windows in an apartment house [13]. If the thermal transmittance rate of windows is reduced by about 26%, it takes about 14 years to recover the cost of construction increase to reduce heating and cooling costs. In addition, when applying the photovoltaic system, there was a difference of up to 2.1 times in the amount of photovoltaic power generation per month depending on the boundary conditions of the building. Due to this, the payback period for each generation varied from a minimum of 5 years to a maximum of 23 years [14].
As such, in the design process of a zero-energy building, the design element is directly related to the cost, and the economic feasibility according to the design factor change must be considered. Therefore, in this study, we evaluated the economic feasibility of each design element by calculating the energy consumption according to the change of the design element of a zero-energy building.
3. Energy and Economic Analysis Model
3.1. Reference Model for Economic Evaluation of ZEB Design Elements
The Korean Building Act includes the standard design for buildings. The standard design induces the standardization of construction and materials for the various building types. Similarly, the DOE presents 16 reference building models as a standard for energy analysis, as shown in Table 1.

Table 1.
DOE Reference Buildings.
The building types presented in Table 1 are models representing various building types. In particular, the reference building model of DOE complies with ASHRAE Standard 90.1-2004, making it is suitable for use as a reference model for energy simulation in this study [15]. In this study, to facilitate comparison by design elements, large offices and elementary schools were selected as models for comparing passive elements of zero-energy building design elements because of their suitability for rooftop solar and building-integrated photovoltaic module installation, and midrise apartment houses were selected as the target models for economic analysis. The midrise apartment house is a type that accounts for about 64.7% of Korean buildings, includes both passive and active elements, and is a model advantageous for economic analysis because its form is relatively standardized.
3.2. Simulation Model for Energy and Economic Analysis
In this study, DOE reference buildings of large office and primary school, a simulation model for passive elements analysis, were modified, as shown in Table 2, so that the S/V ratio can have different characteristics within the same volume [6,16].

Table 2.
Modified properties of DOE Reference Buildings for simulation.
The midrise apartment building has the form shown in Figure 3, in which 88.24 m2 of households are distributed on 4 floors with a total of 32 households. The window area ratio of the exterior wall is about 15%, and the model presented by the DOE was used without modification (Table 3).
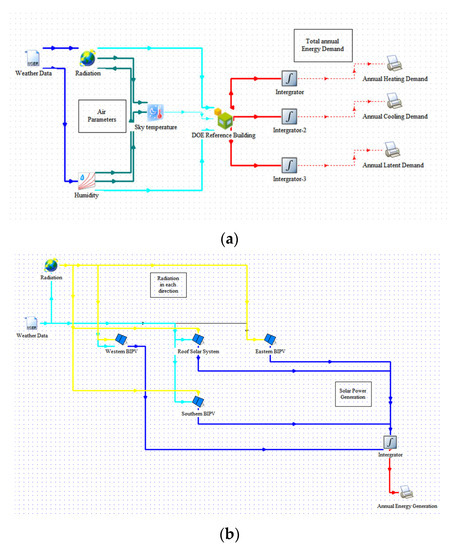
Figure 3.
Simulation model by TRNSYS: (a) energy consumption model; (b) energy production model.

Table 3.
Midrise apartment building model of DOE.
3.3. Specification of Solar System for Simulation
This study used solar system as the active element because of its simplicity to install in new buildings. It is assumed that the rooftop solar module is installed so that sunlight is vertically incident on the panel, facing south from the building. It was also assumed that the building-integrated photovoltaic module was attached to the outer wall of the building and installed so as to form a vertical angle with the ground (Table 4). For solar power generation conditions, Reference Insolation 1000 W/m2 and NOCT (Nominal Operating Solar Cell Temperature) Insolation 800 W/m2 were applied.

Table 4.
Conditions for application of solar panels.
3.4. Simulation Concept
Energy consumption and production were evaluated using TRNSYS (Figure 3) [17,18]. TRNSYS can dynamically analyze unsteady state and is suitable for this simulation as it is a commercial program that meets ANSI/ASHRAE Standard 140-2001. We chose two areas for building locations, Seoul and Busan, so that the climatic zones could be different, and the average value of the meteorological data for 30 years was applied. The heating set-point temperature is 20 °C and cooling set-point temperature is 26 °C. The air change rate is set as 0.5 per hour [19,20].
For the calculation of energy consumption, the thermal properties of envelopes for large office and primary school were applied as shown in Table 5. To calculate the energy consumption according to the direction of the building, the annual energy consumption was calculated for each of the 36 directions [21].

Table 5.
Thermal properties of walls and windows.
In the midrise apartment building, three types of panels, 260 W, 300 W, and 346 W, were used and increased in increments of 10% from 30% to 90% of the roof area in order to calculate the energy production due to the application of the photovoltaic system [22]. For economic analysis, we performed the simulations by analyzing the performance and unit price of two manufacturers for the passive and active elements, the window, and the solar system in the midrise apartment building [23,24]. The simulation model is shown in Figure 4.
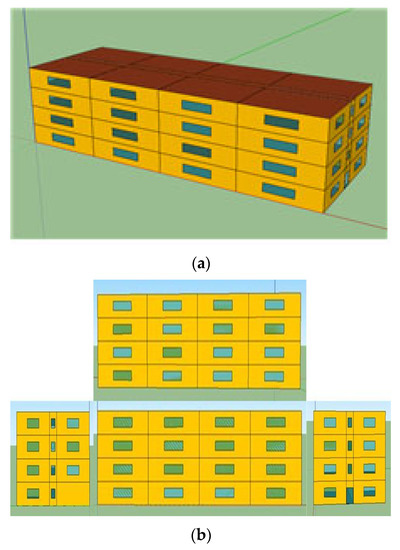
Figure 4.
Simulation model of midrise apartment building: (a) perspective view; (b) elevation.
4. Energy Consumption Analysis
4.1. Energy Consumption According to the Passive Elements
The energy consumption in Seoul and Busan for large offices and elementary schools was analyzed by building direction. In both Seoul and Busan, elementary schools with S/V ratios of 0.46, had a higher energy consumption than that of large offices with S/V ratios of 0.25. Additionally, the difference in energy consumption between the two building types is larger in Seoul than in Busan (Table 6). This means that in buildings with the same volume, the larger the area of cooling and heating energy, the greater the influence on the change in energy consumption according to the S/V ratio [25].

Table 6.
Comparison of average energy demand (year sum, kJ/h).
As for the energy consumption according to the direction of the building, for both building types, the direction with the highest energy consumption is northeast, and the direction with the lowest energy consumption is south (Figure 5).
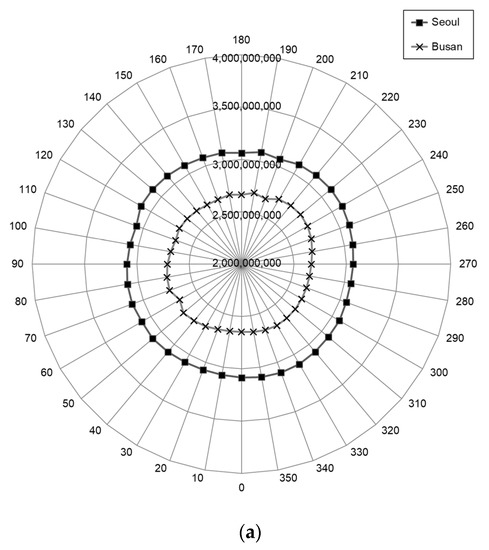
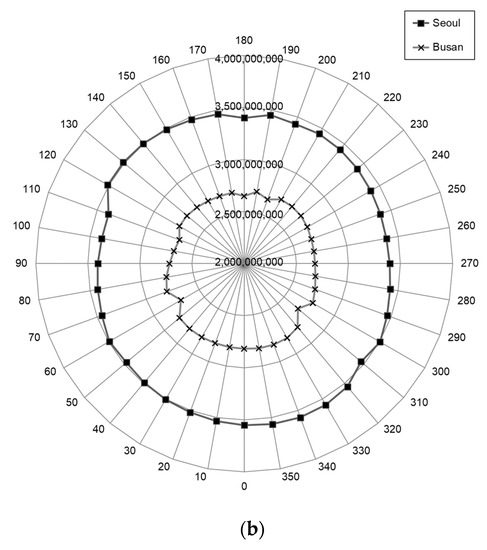
Figure 5.
Energy consumption at each orientation: (a) large office; (b) primary school.
4.2. Energy Production According to the Active Elements
The energy production is greater in elementary schools than in large offices located in the same area. This is because, even in buildings with the same volume, the determination of the solar installation capacity is dominated by the size of the roof area (Figure 6).
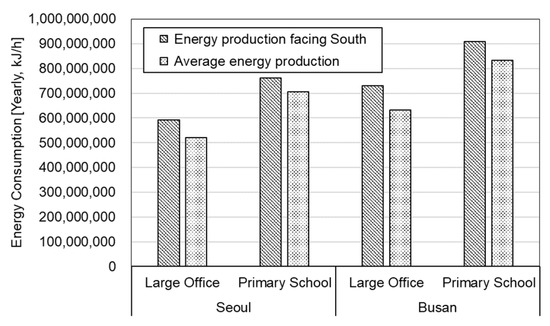
Figure 6.
Energy production of each building type according to the location.
Depending on the building location, the energy production in Busan is greater than that in Seoul because the amount of insolation in Busan is higher than in Seoul. Therefore, in the design of zero-energy buildings, differences in production by region should be considered.
As for the energy production according to the orientation of the building, as shown in Table 7, the energy production is largest in the west and least in the northeast. This result is due to the installation of a building-integrated photovoltaic module, and assuming that the rooftop solar power is designed to face south, the power generation amount is the highest when the module installed on the side of a square building is a west-facing building that receives maximum sunlight hours. As a result, west-facing buildings produce more electricity in the afternoon when the sun sets than south-facing buildings, which can reduce dependence on external electricity during peak hours at 3 p.m.

Table 7.
Energy production according to the orientation (year sum, kJ/h).
4.3. Final Energy Consumption
The final energy requirements for both building types can be obtained by subtracting the energy production from the energy consumption. The energy consumption reduction rate was higher in elementary schools than in large offices because 617.5 kW of solar power was produced due to the large rooftop area of elementary schools compared to 402.8 kW produced in large offices. In addition, while the difference in energy production due to the active element by region is not large, the difference in energy consumption by the passive element is large, so the regional variation in the final energy consumption occurs. As a result, the final energy consumption in Busan, the southern region, is significantly reduced compared to Seoul in the central region, and the smaller the energy consumption, the higher the probability of achieving a zero-energy building (Figure 7).
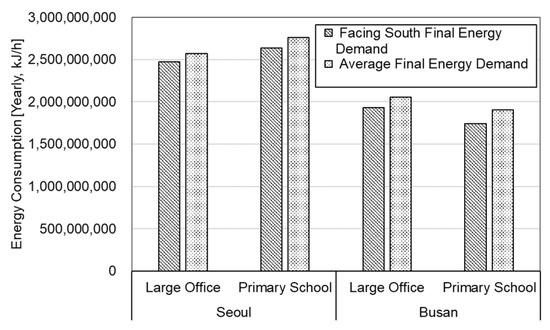
Figure 7.
Final energy consumption of each building type according to the location.
Summarizing the results of this chapter, elementary schools in Seoul and Busan are at least 2% to 11% larger than large offices, and energy production is about 24% to 26% higher in elementary schools than large offices. As a result, the final energy consumption of elementary schools in Seoul is 7% higher than that of large offices, but in Busan, energy consumption of elementary schools is 7% lower than that of large offices (Table 8).

Table 8.
Sum of energy demand and generation (year sum, kJ/h).
5. Economic Evaluation
5.1. Energy Consumption According to Window Replacement
Among the passive elements applied to midrise apartment houses, the change in energy consumption was derived by changing the thermal transmittance of windows. The change in energy consumption by windows and doors changes in proportion to the thermal transmittance rate of windows (Table 9). This trend is further intensified in the central region of Republic of Korea.

Table 9.
Energy demand according to the thermal properties of windows and doors.
5.2. Changes in Investment Costs Due to Window Changes
By examining the price change of windows according to the change of the thermal transmittance of the windows, the energy saving effect of investment in passive elements was identified. The window model suitable for the thermal transmittance rate used in this simulation was selected from among the products reported by the Energy Consumption Efficiency Rating System of the Korea Energy Agency. The unit price of the window model was investigated by the Public Procurement Service’s Nara Marketplace and the manufacturer’s estimate. As a result of the investigation, the thermal transmittance rate and window cost are inversely proportional to the windows and doors of the same manufacturer and the same product family (synthetic resin frame, Miseogi) as shown in Table 10. As shown in Figure 8, there is a high correlation between the cost invested in windows and energy increase.

Table 10.
Window product cost by U-value.
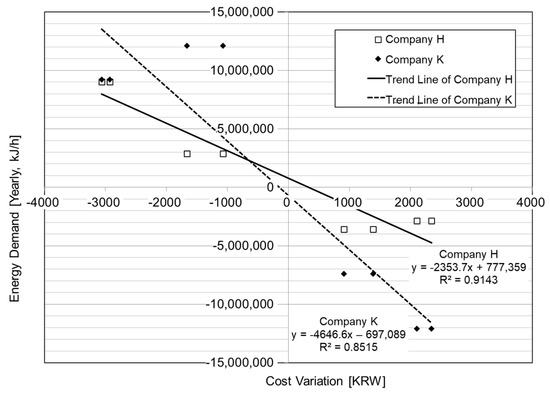
Figure 8.
Coefficient of determination between window cost and energy demand variation.
5.3. Changes in Investment Cost According to Solar Power Generation Equipment
The price of photovoltaic power generation devices was investigated in order to understand the energy increase and decrease effect on the investment of active elements. First, we selected the photovoltaic module among the photovoltaic power generation devices of the National Public Procurement Service. Next, we derived the standard unit price of the investment cost by converting the photovoltaic power generation device composed of the inverter and the connection panel to the unit price by capacity. As a result of examining the two manufacturers, the price of photovoltaic power generation equipment is similar to the unit price per kW. Like the passive element, the active element shows a very high correlation between investment cost and energy increase (Figure 9 and Table 11). The coefficients of determination of the product of manufacturer S and the product of manufacturer B were 0.9185 and 0.9925, respectively.
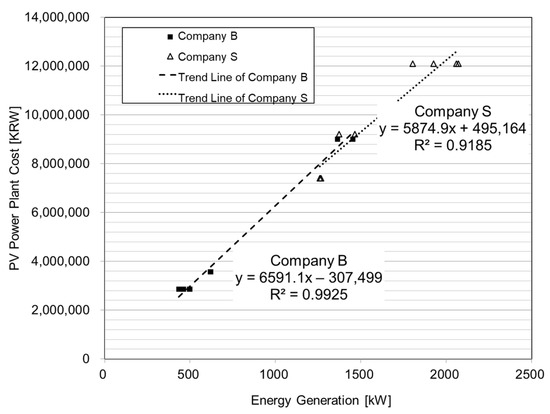
Figure 9.
Coefficient of determination between PV power plant cost and energy generation variation.

Table 11.
PV product cost by capacity.
5.4. Changes in the Amount of Electricity Generated by Solar Power Investment in Window Investment Costs
Finally, we performed the economic feasibility analysis based on regions by synthesizing the change in energy consumption and investment cost due to the change of windows and the increase in energy production due to the investment in solar power generation equipment (Table 12). In Seoul, as the thermal transmittance rate of windows decreases from 1.000 W/m2K to 0.880 W/m2K, the cost increases by about KRW 9,211,815, and the energy consumption decreases by 3063 kWh/y. If the same cost is invested in a photovoltaic device, an additional 3.4 kW of capacity can be secured, which can produce 1373 kWh/y of energy. In this case, it makes economic sense to invest in passive elements because the decrease in energy consumption is 123% greater than the increase in energy production. In Busan, if the thermal transmittance of a window is reduced from 1.150 W/m2K to 1.000 W/m2K, the cost increases by about KRW 12,103,977, and the energy consumption decreases by 1074 kWh/y. A solar power unit for that cost is about 4.5 kW, which can produce 2060 kWh/y of energy. In this case, based on the same cost, investing in an increase in energy production rather than a decrease in energy consumption is 92% larger; therefore, investment in active elements is more economical.

Table 12.
Correlation between window U-value, energy demand, and cost.
6. Conclusions
When planning a zero-energy building, it is necessary to analyze design elements so that the final energy consumption considers not only the energy consumption of the building but also the energy production. In this study, we analyzed the S/V ratio of the building and the energy consumption according to the installation of windows and solar systems and performed economic evaluation. The results were as follows:
- (1)
- The variation in roof area, contingent upon the building type, directly impacts the energy production of the solar system. Consequently, elementary schools exhibit a higher rate of energy consumption reduction compared to large offices.
- (2)
- Although there is a small disparity in energy production among regions, the variation in energy consumption due to passive factors is substantial. Consequently, the final energy consumption of buildings located in the southern region of Republic of Korea is further reduced compared to those situated in the central region.
- (3)
- In regions with lower average temperatures such as the central region, changes in energy consumption are more pronounced in response to alterations in window heat transmittance. Hence, in the case of the central region, it has been verified that investing in passive elements such as windows is more justified than investing in active elements like solar systems.
- (4)
- Solar energy production is directly influenced by regional insolation levels and building orientation. Simulation results confirm that in regions with high solar radiation, such as the southern region, investing in active elements proves to be more cost-effective than investing in passive elements.
In the future, research should be carried out on design methods that consider various passive and active design elements and economic evaluation so that efficient designs can be made from the life cycle assessment (LCA) for a zero-energy building.
Author Contributions
Conceptualization, S.P.; methodology, S.P.; software, S.L.; validation, S.L. and S.P.; investigation, S.L.; data curation, S.L.; writing—original draft preparation, S.L.; writing—review and editing, S.L. And S.P.; visualization, S.L.; supervision, S.P.; project administration, S.P.; funding acquisition, S.P. All authors have read and agreed to the published version of the manuscript.
Funding
This work was supported by the National Research Foundation of Korea (NRF) grant funded by the Korean government (MSIT) (No. 2021R1I1A3050403).
Institutional Review Board Statement
Not applicable.
Informed Consent Statement
Not applicable.
Data Availability Statement
Not applicable.
Conflicts of Interest
The authors declare no conflict of interest.
References
- Kim, M.G.; Kang, H.S. A Study on Design Application of Eco-Friendly Integrated Design Process. J. Korea Inst. Ecol. Archit. Environ. 2013, 132, 87–94. [Google Scholar]
- Tae, Y.R. Architectural Design Process by the Changes of Sustainable Design Guidelines of Public Project. J. Korean Sol. Energy Soc. 2010, 30, 63–70. [Google Scholar]
- Kim, S.H. A Study for Building Design Process Using Ecological Approach. Master’s Dissertation, Graduate School of Sungkyunkwan University, Seoul, Republic of Korea, 2002. [Google Scholar]
- International Energy Agency. Integrated Design Process: A Guideline for Sustainable and Solar-Optimized Building Design; International Energy Agency: Paris, France, 2003. [Google Scholar]
- Sahib, Y. Modernizing Building Energy Codes 2013. In The International Energy Agency Policy Pathway Series; International Energy Agency: Paris, France, 2013; pp. 24–28. [Google Scholar]
- Choi, W.K.; Kim, H.J.; Suh, S.J. A Study on the Analysis of Energy Consumption Patterns According to the Building Shapes with the Same Volume. J. Korean Sol. Energy Soc. 2007, 27, 103–109. [Google Scholar]
- Lee, B.Y.; Kim, K.H. A Study on the Integrated Design Process for Sustainable Architecture. J. Archit. Inst. Korea 2009, 25, 55–62. [Google Scholar]
- Lee, S.M.; Lee, T.K.; Kim, J.U. A Study on the Design Method of Zero Energy Building considering Energy Demand and Energy Generation by Region. J. Archit. Inst. Korea 2018, 34, 13–22. [Google Scholar]
- Lee, S.M.; Park, S.H. Zero-Energy Building Integrated Planning Methodology and Verification Considering Passive and Active Environmental Control Method. Appl. Sci. 2021, 11, 3686. [Google Scholar] [CrossRef]
- Lee, H.J. A Study on the Energy Self-Sufficient House. Master’s Dissertation, Graduate School of Semyung University Graduate School, Chungbuk, Republic of Korea, 2016. [Google Scholar]
- Rodriguez-Ubinas, E.; Rodriguez, S.; Voss, K.; Todorovic, M.S. Energy efficiency evaluation of zero energy houses. Energy Build. 2014, 83, 23–35. [Google Scholar] [CrossRef]
- University of British Columbia. UBC Integrated Design Process. 2020. Available online: https://planning.ubc.ca/sustainability/sustainability-action-plans/green-building-action-plan/institutional-building-requirements/ubc-integrated-design-process (accessed on 1 April 2023).
- Yoon, S.H.; Song, S.B.; Kim, Y.T.; Yum, S.K. Energy Saving Effects according to the Window Performance for an Apartment House and Estimation of the Window Economical Efficiency. J. Archit. Inst. Korea 2008, 24, 321–330. [Google Scholar]
- Lee, H.S.; Park, J.W.; Yoon, J.H.; Shin, W.C. A Study on the Economic Evaluation of Photovoltaic System in the Greenhome. J. Korean Sol. Energy Soc. 2013, 33, 47–52. [Google Scholar]
- Illuminating Engineering Society of North America. Energy Standard for Buildings Except Low-Rise Residential Buildings; American National Standards Institute/American Society of Heating, Refrigerating and Air-Conditioning Engineers: Atlanta, GA, USA, 2019. [Google Scholar]
- Chang, W.S.; Shin, H.C.; Choi, W.K. Energy Sensitivity Analysis According to the Design Variables with the Same Volume Building. J. Korean Inst. Archit. Sustain. Environ. Build. Syst. 2014, 8, 104–110. [Google Scholar]
- Wang, R.; Lam, C.M.; Alvarado, V.; Hsu, S. A modeling framework to examine photovoltaic rooftop peak shaving with varying roof availability: A case of office building in Hong Kong. J. Build. Eng. 2021, 44, 103349. [Google Scholar] [CrossRef]
- Peres Suzano e Silva, A.C.; Calili, R.F. New building simulation method to measure the impact of window-integrated organic photovoltaic cells on energy demand. Energy Build. 2021, 252, 111490. [Google Scholar] [CrossRef]
- Lee, M.J.; Kim, W.S.; Lee, W.J.; Lee, W.T. A Study about Reduction Rates of Building Energy Demand for a Detached House according to Building Energy Efficient Methods. J. Archit. Inst. Korea 2012, 28, 275–283. [Google Scholar]
- Hong, W.P. Economic Analysis and Energy Saving Evaluation for Smart Grid System of Hospital Building. J. Korean Inst. Illum. Electr. Install. Eng. 2010, 24, 129–139. [Google Scholar]
- Jang, H.J.; Park, J.C. A Study on the Energy Efficiency Evaluation of Zero Energy Building. J. Korean Inst. Archit. Sustain. Environ. Build. Syst. 2010, 4, 149–156. [Google Scholar]
- Hoseinzadeh, P.; Assadi, M.K.; Heidari, S.; Khalatbari, M.; Saidur, R.; Sangin, H. Energy performance of building integrated photovoltaic high-rise building: Case study, Tehran, Iran. Energy Build. 2021, 235, 110707. [Google Scholar] [CrossRef]
- Peippo, K.; Lund, P. Multivariate optimization of design trade-offs for solar low energy buildings. Energy Build. 1999, 29, 189–205. [Google Scholar] [CrossRef]
- Zogou, O.; Stapountzis, H. Energy analysis of an improved concept of integrated PV panels in an office building in central Greece. Appl. Energy 2011, 88, 853–866. [Google Scholar] [CrossRef]
- Azami, A.; Sevinç, H. The energy performance of building integrated photovoltaics (BIPV) by determination of optimal building envelope. Build. Environ. 2021, 199, 107856. [Google Scholar] [CrossRef]
Disclaimer/Publisher’s Note: The statements, opinions and data contained in all publications are solely those of the individual author(s) and contributor(s) and not of MDPI and/or the editor(s). MDPI and/or the editor(s) disclaim responsibility for any injury to people or property resulting from any ideas, methods, instructions or products referred to in the content. |
© 2023 by the authors. Licensee MDPI, Basel, Switzerland. This article is an open access article distributed under the terms and conditions of the Creative Commons Attribution (CC BY) license (https://creativecommons.org/licenses/by/4.0/).