1. Introduction
The scientific literature is a unique source that can be exploited to generate new knowledge, to analyse the body of knowledge to develop critical thinking capability, and to justify research challenges and opportunities. Researchers worldwide need access to this trusted body of knowledge and should be aware of influential scholars’ latest contributions.
Within this context, developing trustworthy mechanisms to identify high-quality and influential research contributions is a key challenge of our times for bibliometrics and sustainability of research. This research problem has distinct and diverse facets. First, the clustering of knowledge in scientific disciplines, domains, topics, and areas demands a systematic ontological agreement on the attributes of classification. Next, the accessibility and the searchability of the vast scientific content must be organized through meaningful methods and flexible, customized services. Developing sophisticated value-assessment processes that can be trusted by researchers worldwide can facilitate the usage of scientific knowledge and support its translation knowledge into innovation and sustainability.
The current provision of open-access or commercial platforms constitutes data lakes of scientific knowledge, allowing scientific experiments to be designed to justify new reference mechanisms for access to and exploitation of the relevant content. Google Scholar (GS) is a key service that offers a systematic classification of research publications and scholars’ research profiles [
1].
GS and other research databases give users access to scholarly literature. GS’s wide range of sources, citation metrics, multilingual capability, and open-access features make it a unique and powerful tool for researchers. Since its inception, it has been compared to other research databases, including Web of Science (WOS) and Scopus. Several studies have explored their differences and similarities and the characteristics of GS behind its massive impact compared to others [
2,
3]. These research databases assist the research community in measuring the impact of the scholarly literature and knowledge flows.
GS applies a variety of algorithms to extract keywords from the publications indexed on the database, then clusters the publications around these keywords. The algorithms use a diverse set of techniques, including natural language processing (NLP) and information retrieval (IR) practices, to configure important keywords. This enables the search engine to classify the indexed publications on the basis of the extracted keywords, ultimately helping the research community to gain rapid access to publications. In contrast to automatic keyword extraction, GS allows the manual use of research labels in GS profiles, and authors add them to indicate their area of research. Since it involves manual appending it may be subject to discrepancies. The significance of manual versus automatic keyword extraction is also presented as a comparison in this paper.
The study is formulated as follows:
Section 2 provides an insight into the existing studies pertaining to the use of GS for scholarly literature and knowledge flows.
Section 3 refers to the proposed methodology applied to identify the leading researchers in the area of learning analytics.
Section 4 presents some experimental work and the data analysis. Lastly,
Section 5 concludes by discussing the results, dividing the identified researcher profiles according to the defined metrics, and proposing future directions.
2. Related Work
GS allows users to search for scholarly literature such as articles, books, theses, conference proceedings, and more. It is a valuable resource for researchers, students, and educators, as it allows users to easily find and access a wide range of academic materials. In addition to searching for publications by keyword, GS allows the filtering of the search results in several ways, such as by date of publication, language, and type of publication (e.g., a journal article or conference proceedings). Advanced search options may also be used to refine the search results further.
Researchers and practitioners have long been interested in learning the structure of knowledge and monitoring the evolution of various research topics, key issues for analysing the dynamics of scientific research, and exploring the knowledge structure of disciplines. Three types of research methodologies, content analysis, model-based approach and bibliometrics, have extensively investigated the dynamic distribution of research topics. GS is considered one of the most commonly used tools for extracting scholarly literature works and tracking the publication citations [
2,
4]. Diverse aspects of GS have been explored in depth in the existing literature.
One of the most widely applicable areas of research is identifying much cited publications through GS. Halevi et al. [
5] conducted a study to evaluate the effectiveness of GS as a metric for assessing its scientific evaluation. Multiple databases pertaining to publication evidence were explored and compared to GS to identify its effectiveness in various subdisciplines to find out whether in some disciplines GS might surpass comparable databases, such as WOS and Scopus. Their findings demonstrated that despite GS’s increasing use and adoption by the research community, some incurring challenges remained regarding index quality, which could be easily manipulated. Therefore, GS cannot be considered as a standard metric for citation counts [
2]. Many studies consider GS as an additional source when measuring scientific flows and evaluations [
6,
7].
Martin et al. [
7,
8] conducted a study to evaluate citations of much-cited documents in various databases, Web of Science (WOS) and Scopus, comparing it with GS. An overlap of these citations was found in the three databases, GS being the superset and encompassing the majority of those citations. They demonstrated the supremacy and generality of GS by including citations from the most cited documents in 256 subject areas. Further, a longitudinal study was conducted to compare the three databases and evaluate their coverage in terms of publications and citations. Five major disciplines were covered in this study to highlight GS’s significance [
9]. Unlike previous studies, which considered GS to be stronger than other databases, this study found the citation and publication coverage of the three databases (GS, Scopus, and WOS) to be similar.
GS has revolutionized the search criteria of academic knowledge, emerging as the largest search engine of scholarly data. It covers nearly 87% of all scholarly publications [
10]. More recently, Martin-Martin et al. (2018, 2021) presented a comprehensive study on Google Scholars Classic Papers Product (GSCP) to measure the data overlap between GS, Web of Sciences and Scopus [
7,
8]. In terms of data coverage, GS was the leader in academic data searches, beyond WOS and Scopus. Of a total of 2,448,055 papers, 46.9% were covered by all academic sources, while the remaining 36.9% were indexed only by GS.
Overall, GS is a powerful tool for finding research papers on specific keywords or topics. It allows an easy search for papers from a wide range of sources and disciplines and provides advanced search options to refine the results.
3. Research Methodology
Our research on data-mining-driven sustainable research, education, and innovation has a firm starting point. Millions of researchers, educators, students, and consultants exploit scientific knowledge through scientific repositories such as GS, Scopus, and WoS. Researchers in specific research domains usually attach research labels to their profiles manually, and thus develop reference indexes to their own work and to their peers in the same research domain. These research labels allow a simple yet efficient way to filter available scientific knowledge from many other researchers and knowledge users.
Based on this assumption, platforms such as GS allow rankings of researchers within the same research domain and provide easy access to the research portfolio of each researcher under each research label.
The motivation for our research originated from four major observations:
The use of multiple research labels by researchers in GS allows diverse options for filtering research publications.
The selection of a research label for direct access to the published scholarly works of a researcher leads to an enumeration of the entire research profile, including works unrelated to the research label.
This inconsistency sometimes leads directly to a misleading ranking of scholars under any research label, since papers that are unrelated to the label and their relevant citations are included in the ranking calculations.
Thus, knowledge seekers need a more trustworthy and accurate mechanism to access the most relevant and valuable scientific knowledge.
For the purposes of our study, from the vast variety of disciplines and research domains, we decided to focus on the domain of learning analytics, directly related to sustainability in higher education, our special interest. LA is a relatively emerging area of research, gaining massive recognition in the past decade, and identifying the influential keywords and knowledge flows pertaining to it will be an interesting spectrum. It is an example of multidisciplinary and interdisciplinary area of research in which researchers from different backgrounds work in order to enhance the teaching and learning experience of a student.
The overall research approach deployed in our analysis may be summarized as follows:
We collected from GS all authors who had added “Learning Analytics” (LA) manually as their research label. This resulted in 1236 unique research profiles.
We extracted publication information for the top five most cited research works by each author/profile.
We conducted two experiments for mapping and ranking the researchers.
Experiment 1: We used cosine similarity using the seed of word and identified the LA research studies from the top five research works to demarcate the studies related to LA and identify those that were not related to LA. The results were good, yet not comprehensive.
Experiment 2: we deployed text matching using only the keyword “Learning Analytics” (LA) and matched the title and the abstract of the publications for similarity.
We used the two methods in combination and concluded with a categorization of authors and a differentiation of specialist LA researchers from others, as is clarified in
Section 4.
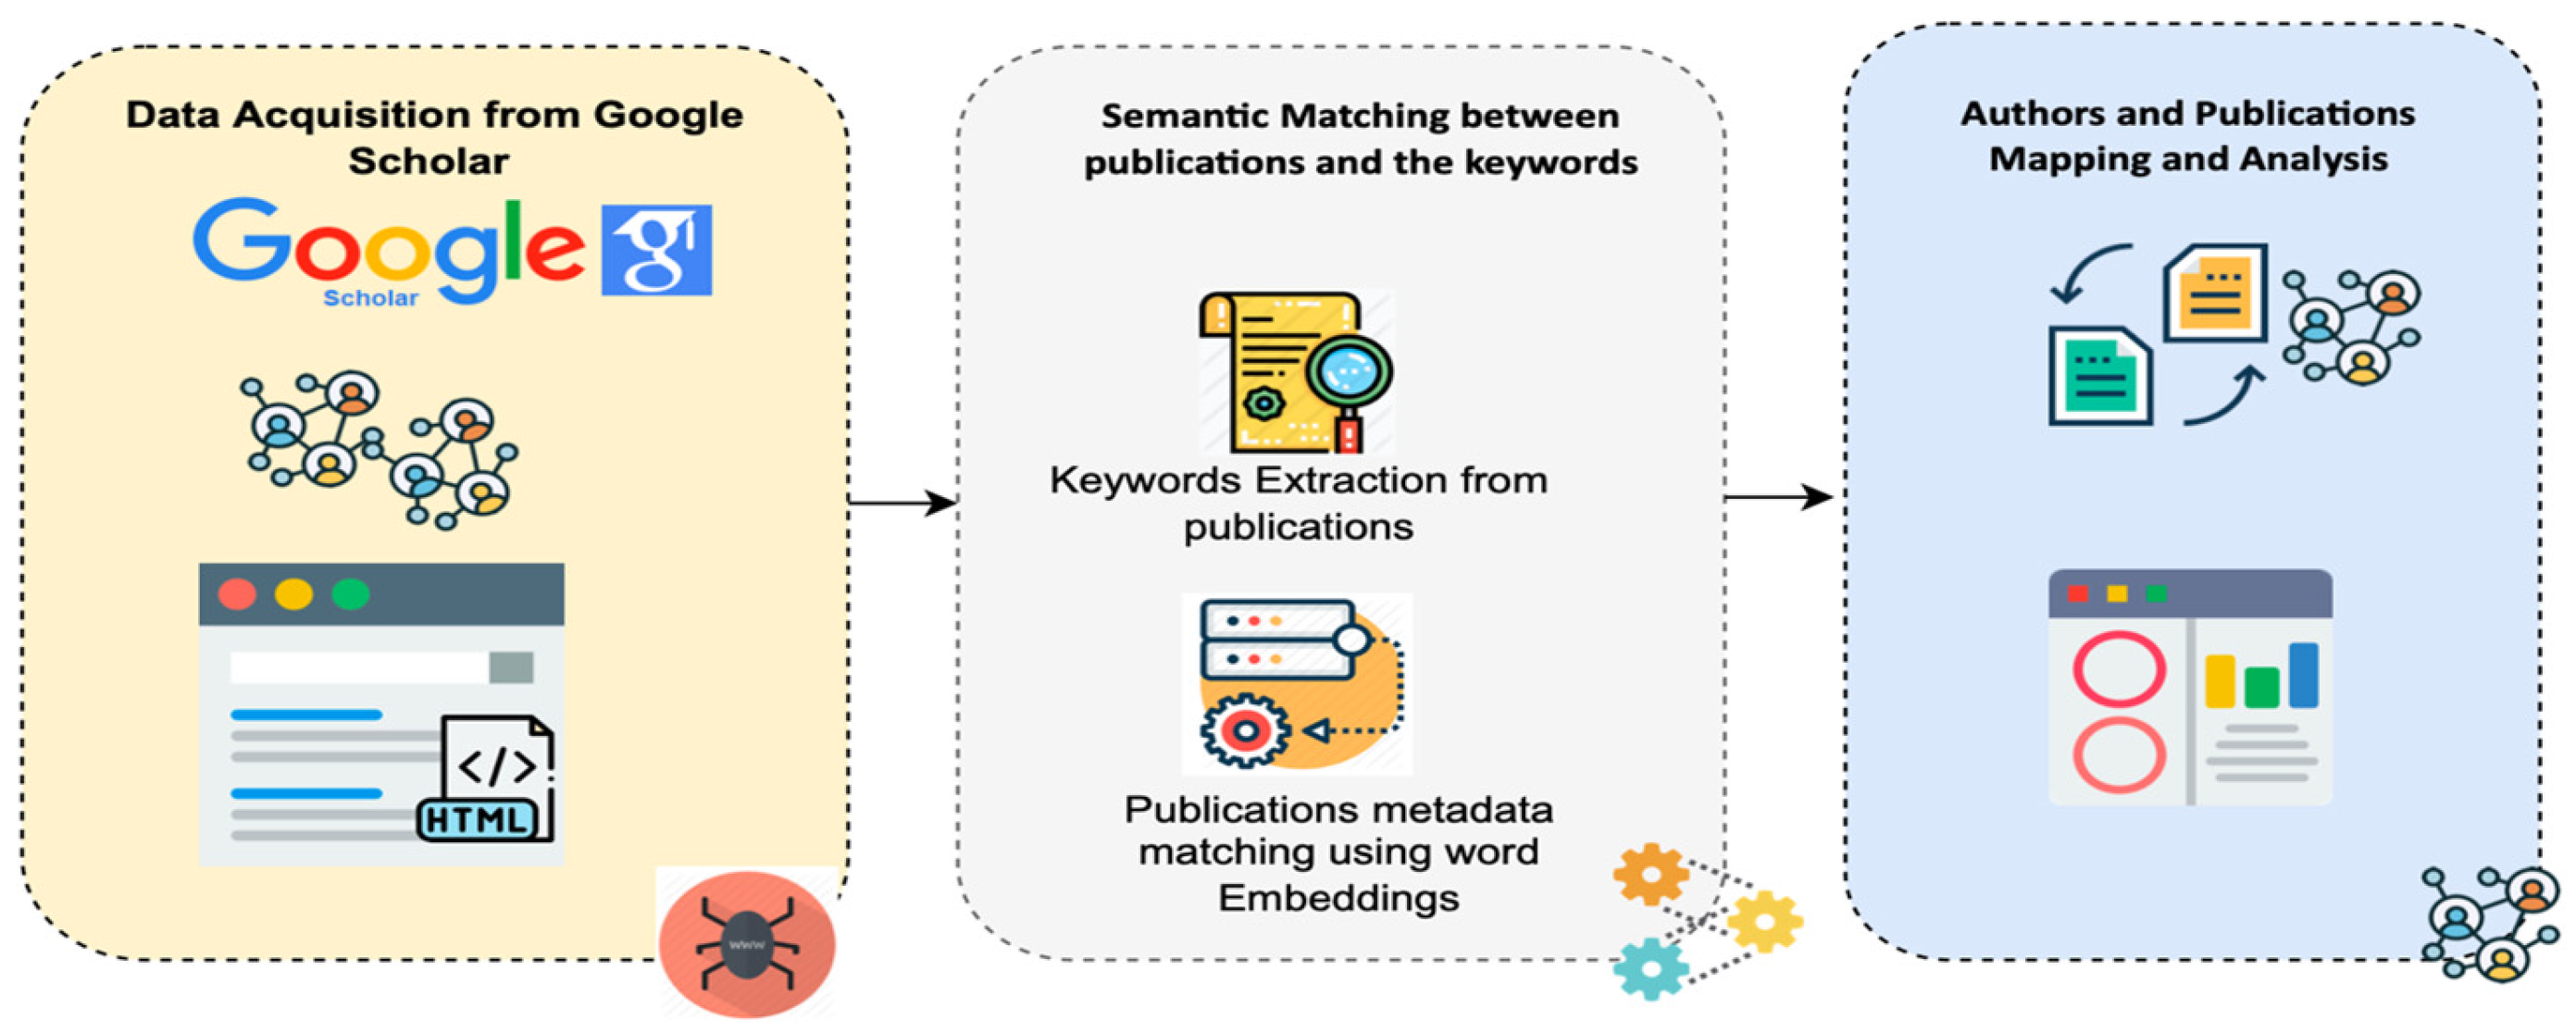
For this study, a framework was designed to identify the leading researchers in the area of LA using the author profiles and their publication data available on GS. Firstly, the author profiles having “learning analytics” as a manual label on their google scholar profiles were collected. Secondly, the publication information against each retrieved author was also scraped. Finally, we designed a framework to analyse the author profiles and their publication metadata to identify the prominent LA researchers. The details of the designed approach are provided in
Figure 1 and the description of each step is discussed in the subsequent subsections.
This section may be divided by subheadings. It should provide a concise and precise description of the experimental results, their interpretation, as well as the experimental conclusions that can be drawn.
3.1. Seed Keywords List Selection
To find the relevant and prominent keywords used by researchers over the years, Lee and Cheung (2020) presented the current trends and innovation in the field of LA by using the SCOPUS data [
8]. The database was searched for papers using the term “learning analytics”, and it was noted that the publications increased rapidly after 2011, since this term was coined in 2011 [
11] Moreover, the keywords revealed that e-learning, particularly online learning and blended learning, frequently employs LA technologies (e.g., e-learning, online learning, MOOC). The most frequent keywords associated with LA are presented in
Table 1. It is important to note that LA is of interest to researchers and educators from both pedagogical (such as curricula, self-regulated learning, and learning processes) and technical perspectives (e.g., data mining techniques, data visualization techniques, and learning management systems).
3.2. Semantic Matching of Papers’ Metadata Using WordtoVec
In order to enhance the number of words in domain-specific keywords, build lexicons with more terms, and expand the terms that can be matched, we studied several weighting systems, including the latent semantic indexing [
13] and Word2Vec [
14] models. Based on the notion that each word in a language may be represented by a collection of real numbers, word embedding was developed (a vector). N-dimensional vectors called word embeddings try to capture the context and meaning of words through their values. Any set of integers is acceptable for a word vector, but for a set of vocabulary to be useful it must naturally capture the meaning of the words, their relationships, and the context in which they are used.
Metadata (title and abstract) against each paper were represented as a single vector. Every word vector could be averaged or added to create a 300-dimensional representation for every 64 × 300 representation [
15,
16]. However, averaging or adding the terms would dilute the writings’ semantic and contextual meanings. Various document lengths would likewise negatively affect them. A weighted average of word vectors using the tf-idf weights was a more effective method to accomplish this. This addressed the issue of changeable length, to some extent, but the semantic and contextual meaning of words could not be preserved. After that, we calculated similar documents using the pairwise distances.
3.3. Author and Publication Metadata Mapping
To perform mapping between authors who display LA in their GS profiles and certain domain-specific keywords, from the list of seed keywords in their publications’ metadata, we used cosine similarity to match the publication metadata, such as title and abstract, to domain-specific keywords. Cosine similarity has been found to be the most effective measure of semantic similarity between vectors generated through word embeddings [
17]. Furthermore, we performed data filtration to find researchers with LA as their primary area of research. The following are details of the cosine similarity measure and our data filtration approach.
3.3.1. Cosine Similarity Measure for Contextual Mapping
The most popular and efficient methods of determining similarities include the angular distance between two vectors, given to us by the cosine of the angle between the two vectors [
18,
19]. It is not only an angle-based measure but is also scale invariant, that is it does not account for the actual values of the compared vectors instead emphasizes on their relative relationships. For two vectors V1 and V2, the formula to determine their cosine similarity is shown is Equation (1), where V1 indicates the embedding vector of the publications’ metadata and V2 represents the embedding vector of the LA-domain-specific keywords [
20]. Furthermore, we used the threshold value to label each publication as either an LA paper or not:
This yielded for each author their highly cited papers that showed the presence of keywords from the list of seed keywords, as in
Table 1.
3.3.2. Semantic Terms Matching in Publication
In this module, we employed a list of frequent keywords prevalent in the domain of LA and then performed data cleaning to semantically normalize the terms. The data acquisition layer extracted the publications metadata including title and abstract from GS; therefore, we first performed data preprocessing to filter the raw data. Further, the experimental steps are discussed in detail in
Section 4.
4. Experimental Work and Data Analysis
This section further discusses the two combined experiments included in our designed approach and defined in
Section 3. From the list of seed keywords, a relevance was formulated based on the presence of the keywords in the retrieved publications. Based on this relevance count, further experiments were conducted, and publications were categorized as relevant/irrelevant.
4.1. Experiment 1: Using Seed of Words Related to Learning Analytics
For our first approach, a seed of keywords (provided in
Table 1) was applied to analyse the publications’ metadata and find the core publications in LA. First, we performed semantic matching between the publication metadata and the seed keywords. Each publication was labelled either as relevant (yes) or nonrelevant (no) with reference to the percentage of seed keywords that matched the metadata.
Table 2 shows the publication metadata of a researcher as an example, along with the labels (yes/no) assigned by matching the metadata and seed keywords. We also calculated the number of relevant publications by each author (see
Table 3).
4.2. Experiment 2: Using “Learning Analytics” as a Term to Find Matches in Title or Abstract
We manually scrutinized the GS profile of each researcher, finding that not every author was an LA researcher, despite experiment 1 labelling their publication as a core LA paper. To refine our methodology, another approach specifically targeted the term “learning analytics”, highlighting all publications that used that term in their title or abstract. For a more robust analysis, our experiments took both approaches. Similarly, for each author, a count of publications was kept by identifying those with the keyword “learning analytics” in either the title or abstract.
Table 4 shows sample results of the second method of highlighting the core papers with “learning analytics”, and their respective authors.
From the collected data corpus, we found the author and publication metadata with “learning analytics” as a manual research label on the authors’ GS profiles, then performed an analysis to extract those authors and publications with the specific keywords “learning analytics” in either the title or abstract of the publication. This assisted us in identifying the core LA papers mentioning that keyword in either title or abstract. For this purpose, simple text matching was performed on the five most cited papers of each extracted author who had used LA as a manual research label.
4.3. Thematic Analysis of Automatically Extracted Keyword of Title and Abstract
To analyse the thematic structure of the field of LA and related terms associated with it, term maps were created from the keywords extracted from the extracted publications’ metadata, such as from their title and abstract. VOSviewer (
http://www.vosviewer.com, accessed on 5 January 2023) version 1.6.18 was employed to construct these maps and find their common keyword themes [
21,
22]. The VOSviewer utility helps to analyse the research landscape of any discipline by constructing bibliometric networks and term maps that highlight important themes in that discipline [
23,
24,
25,
26,
27,
28]. From the extracted publications’ metadata, the title and abstract of each publication were input to VOSviewer, where various keywords from each abstract and title became candidate terms to construct the map. To extract the important keywords, VOSviewer treats each candidate item as a noun.
Using the chosen candidate words, VOSviewer returned concept maps using the suggested recommended (
http://www.vosviewer.com/documentation/Manual_VOSviewer_1.3.1.pdf, accessed on 5 January 2023) first normalization method, with 0 indicating convergence, 1 resolution, and 100 random starts. Each semantic concept was represented as a node in a map consisting of the candidate terms extracted from the articles’ titles and abstracts. The size of each node indicated the frequency of the item, and the distance between nodes showed the strength of the association between them [
29]. The distance between the two concepts or items reflected their similarity, which was computed by Equation (2):
where
represents the similarity,
represents the number of co-occurrences between two concepts i and j,
is the total number of occurrences of the concept i, and
is the total number of occurrences of the concept j. The term maps constructed using these associations helped us to understand the thematic structure of the research landscape of a particular field, specifically for identifying its common concepts.
5. Results and Discussion
For the purpose of this study, data from 4732 publications by 1236 authors with “Learning Analytics” in their public GS profile labels and their top most cited publications since 2011 were collected and analysed. We conducted two experiments to compare the use of manually added research labels and automatically extracted research keywords to identify LA specialist researchers.
This section is organized as follows.
Section 4.1 presents an analysis of the manually added research labels in GS by authors who used LA as a research label, while
Section 4.2 provides an analysis of the automatically extracted research keywords used by the researcher categories identified from our designed approach.
5.1. Analysis of the Manually Added Research Label of Learning Analytics
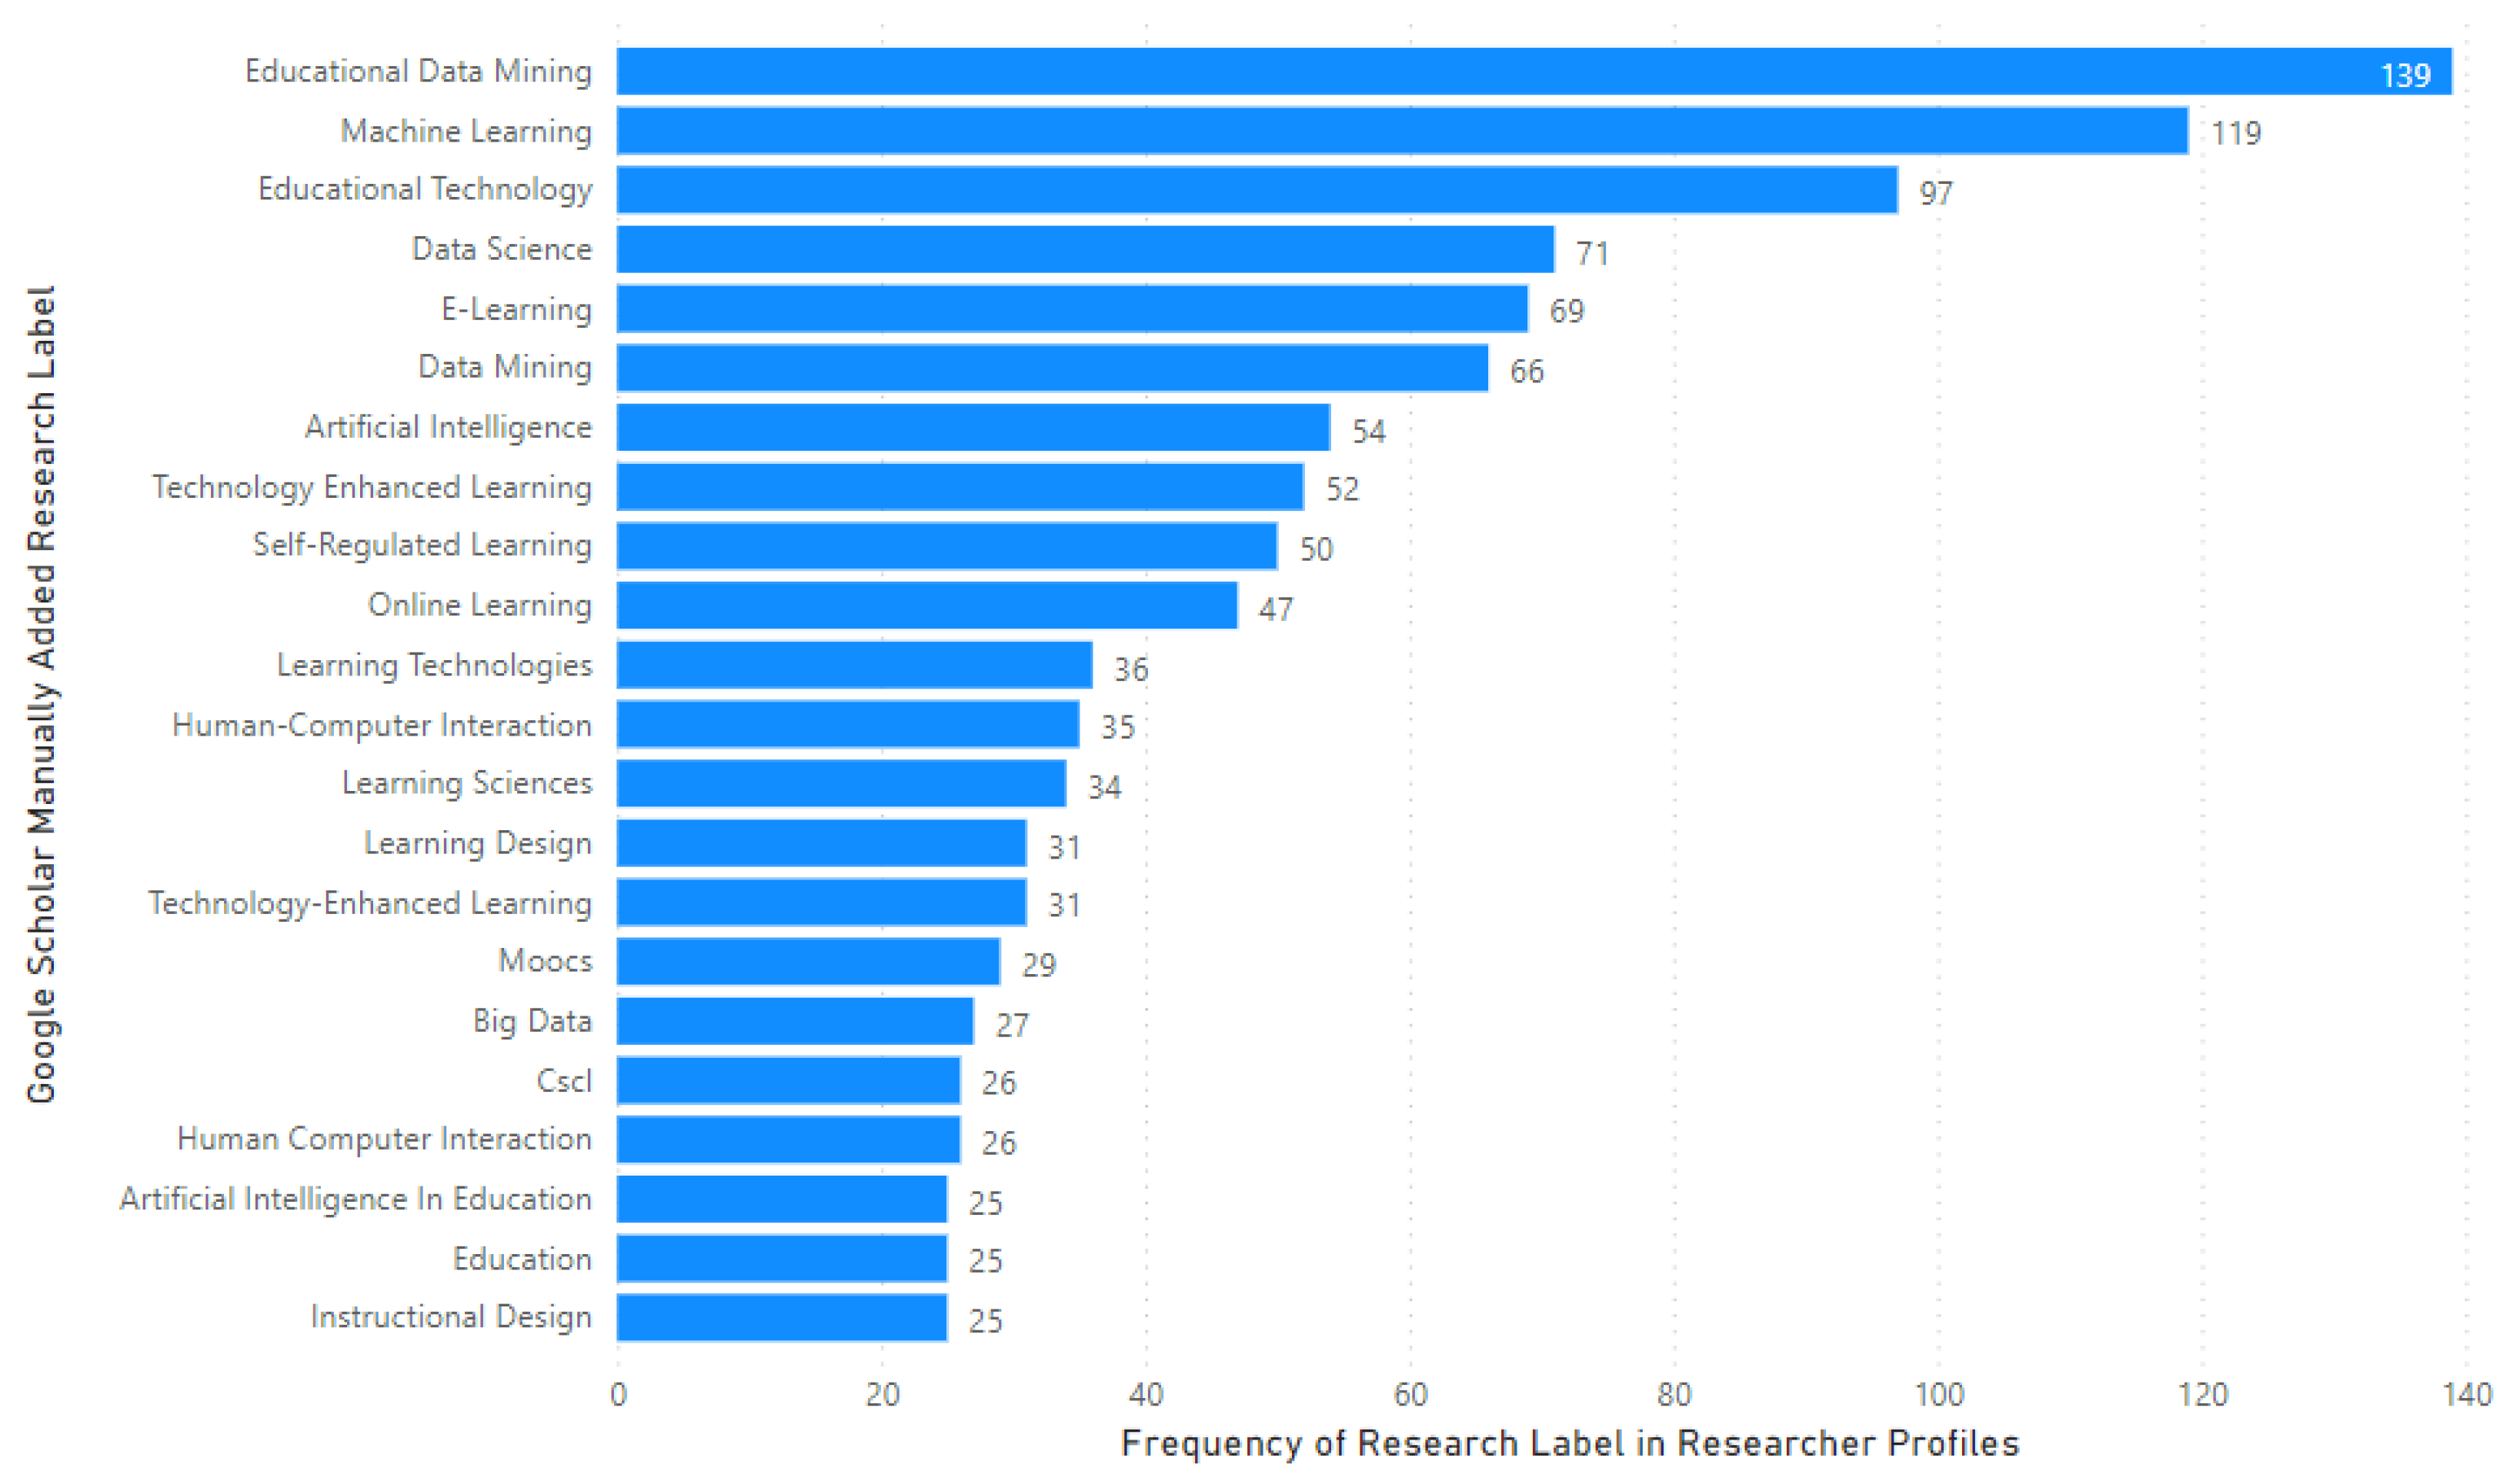
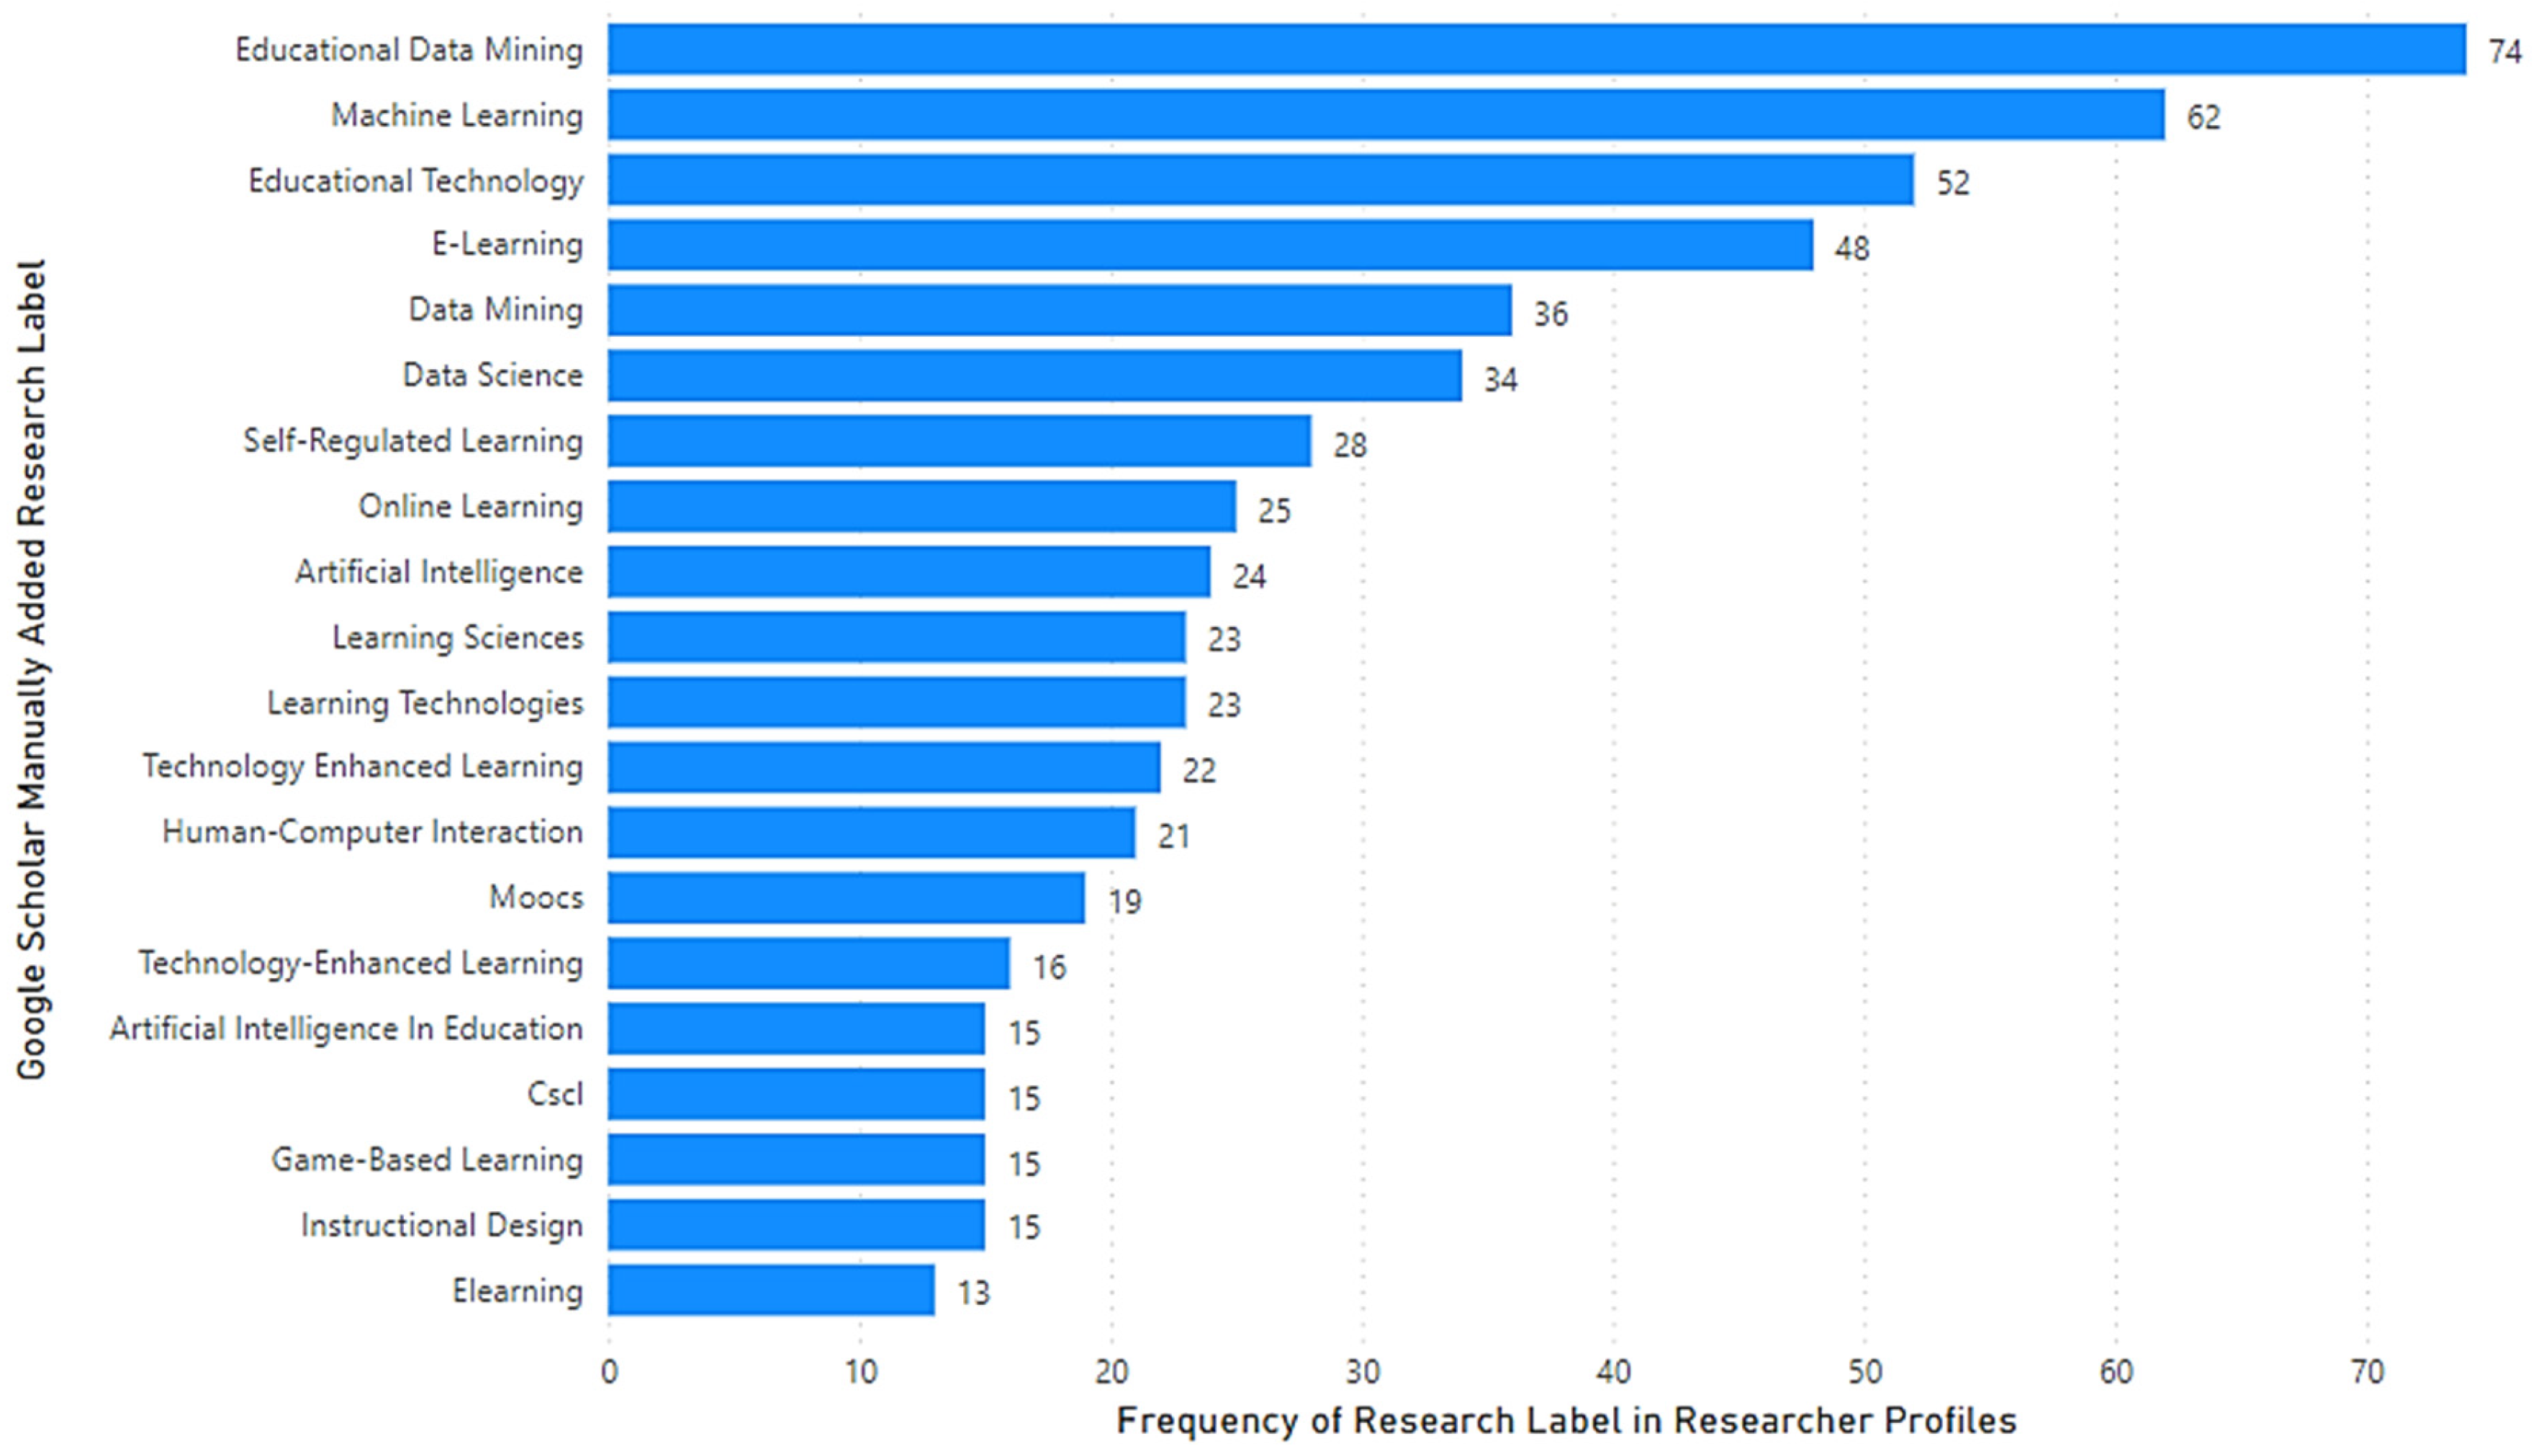
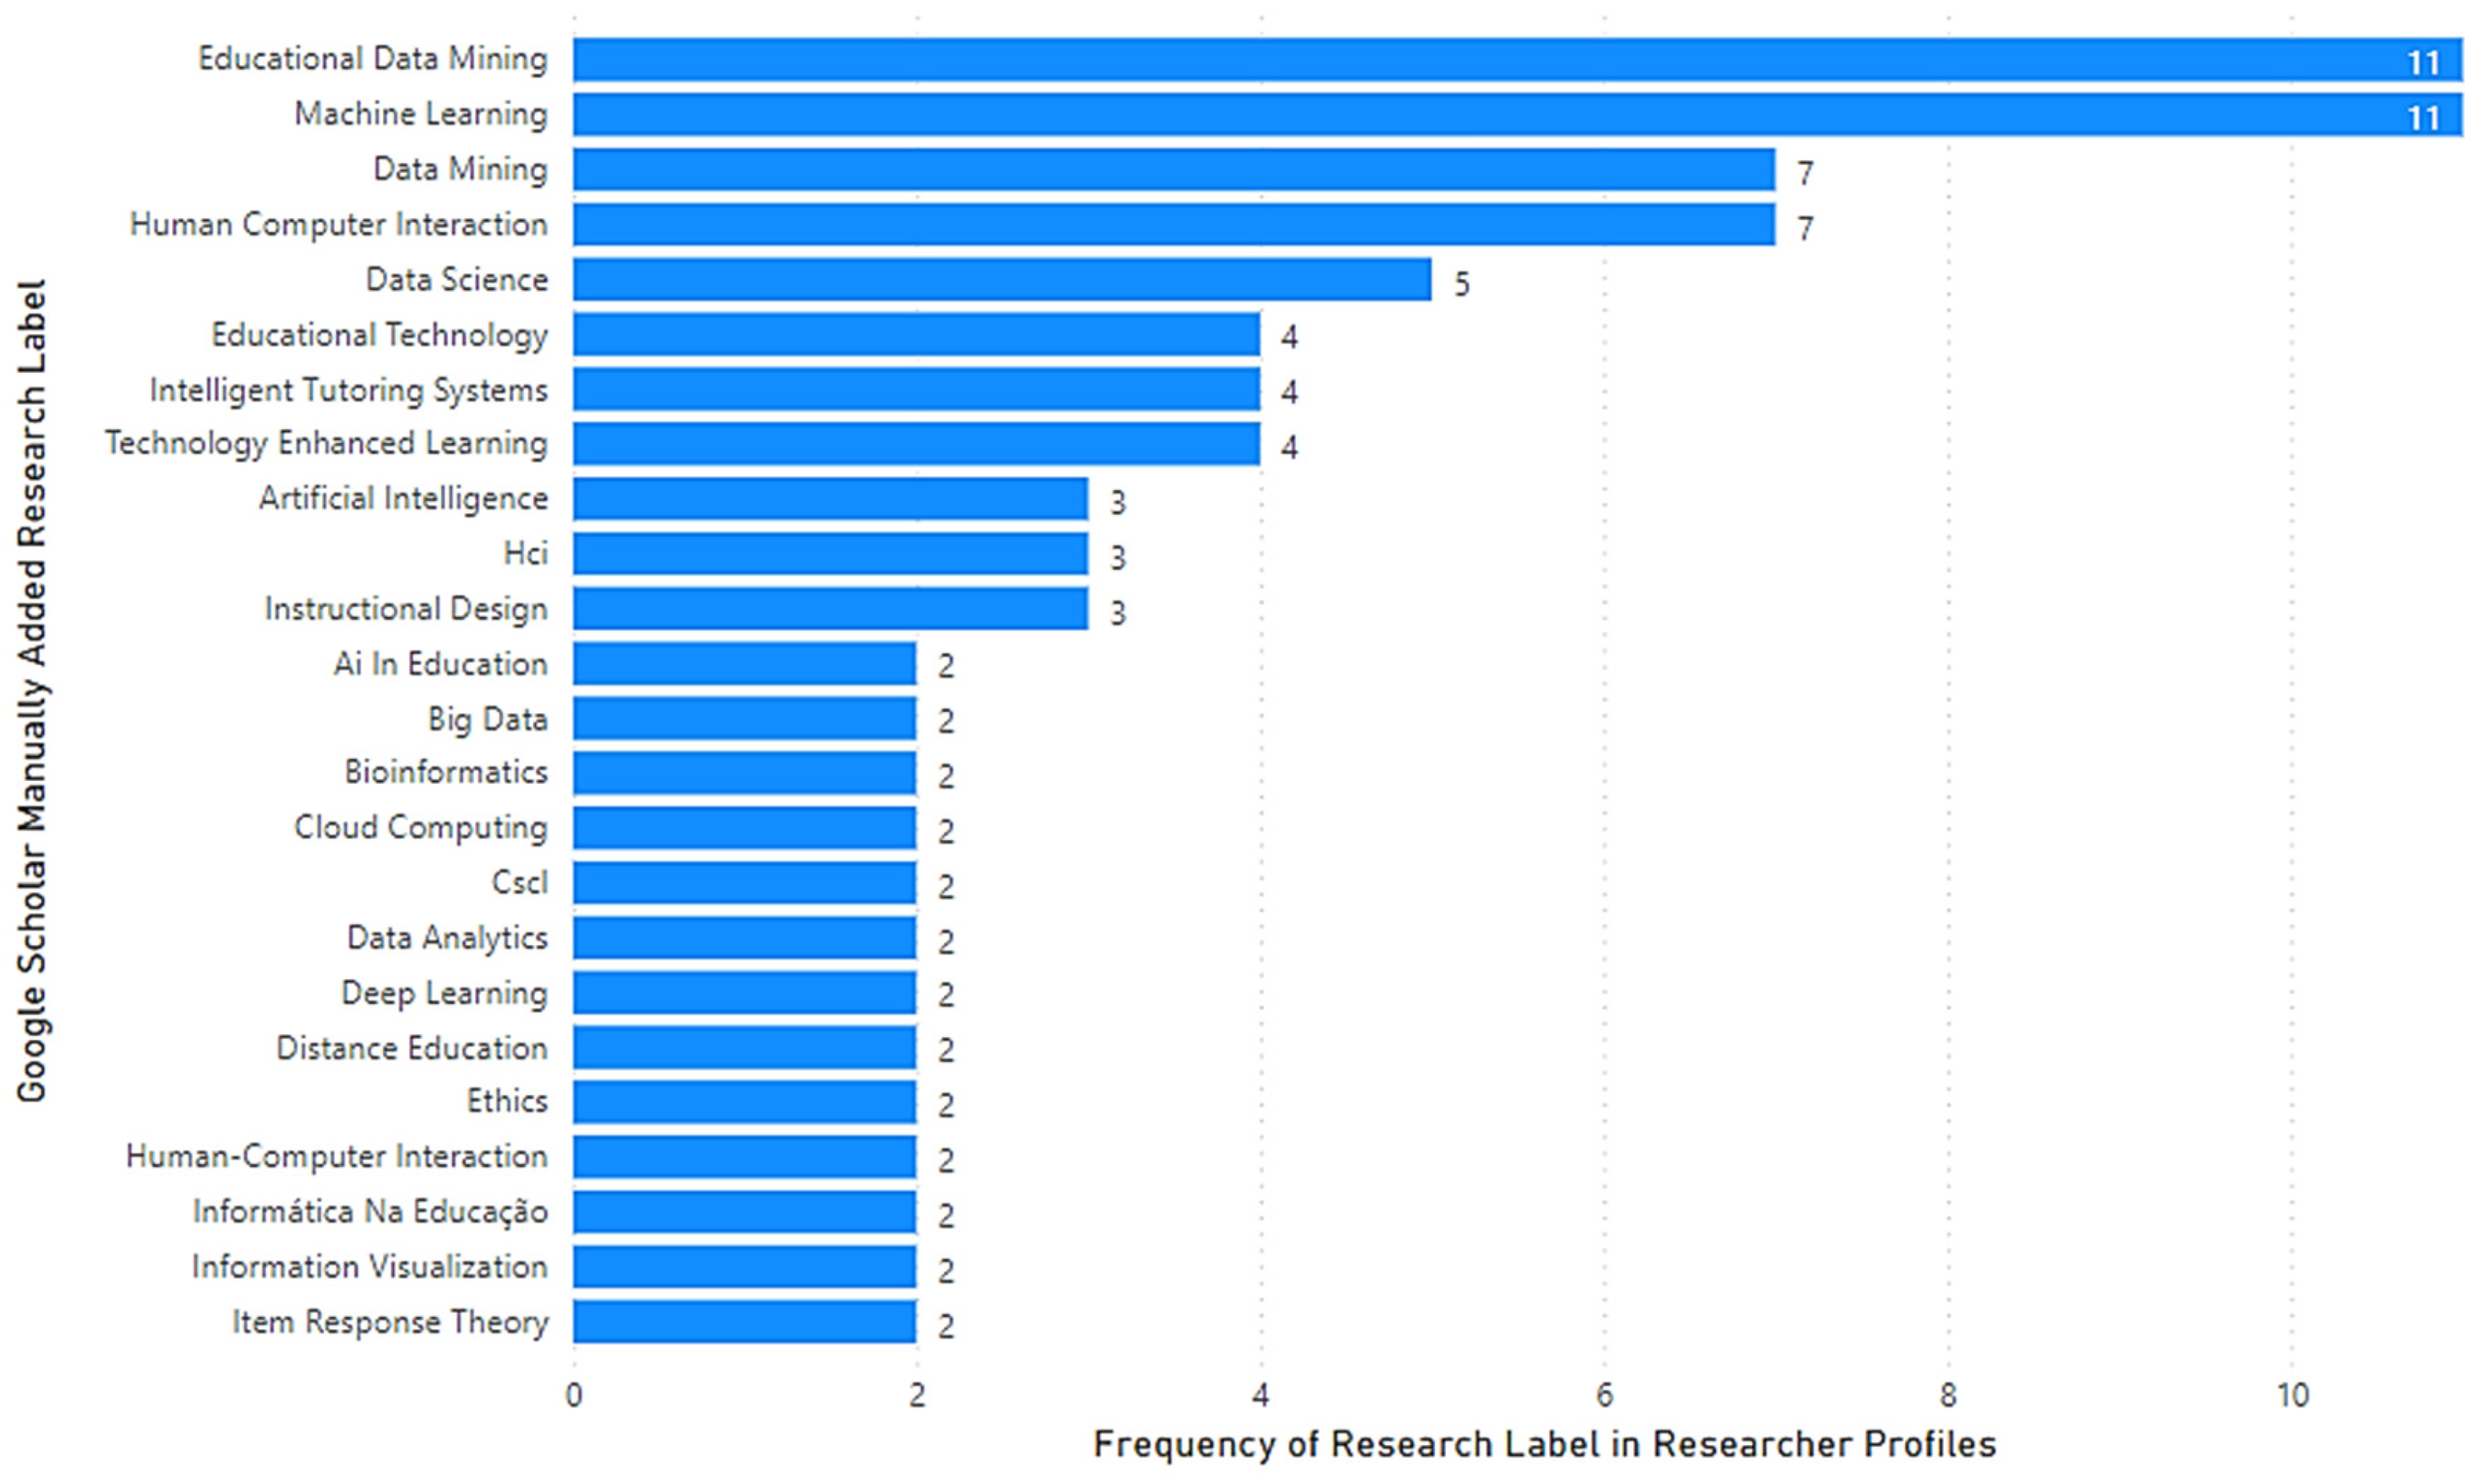
Our analysis of “manually added research labels” showed that the most common research label was “Educational Data Mining”, followed by “Machine Learning” and then “Educational Technology” as depicted in
Figure 2. We observed a variety of research labels manually added by researchers, which reflected the multidisciplinary and interdisciplinary nature of the LA research area.
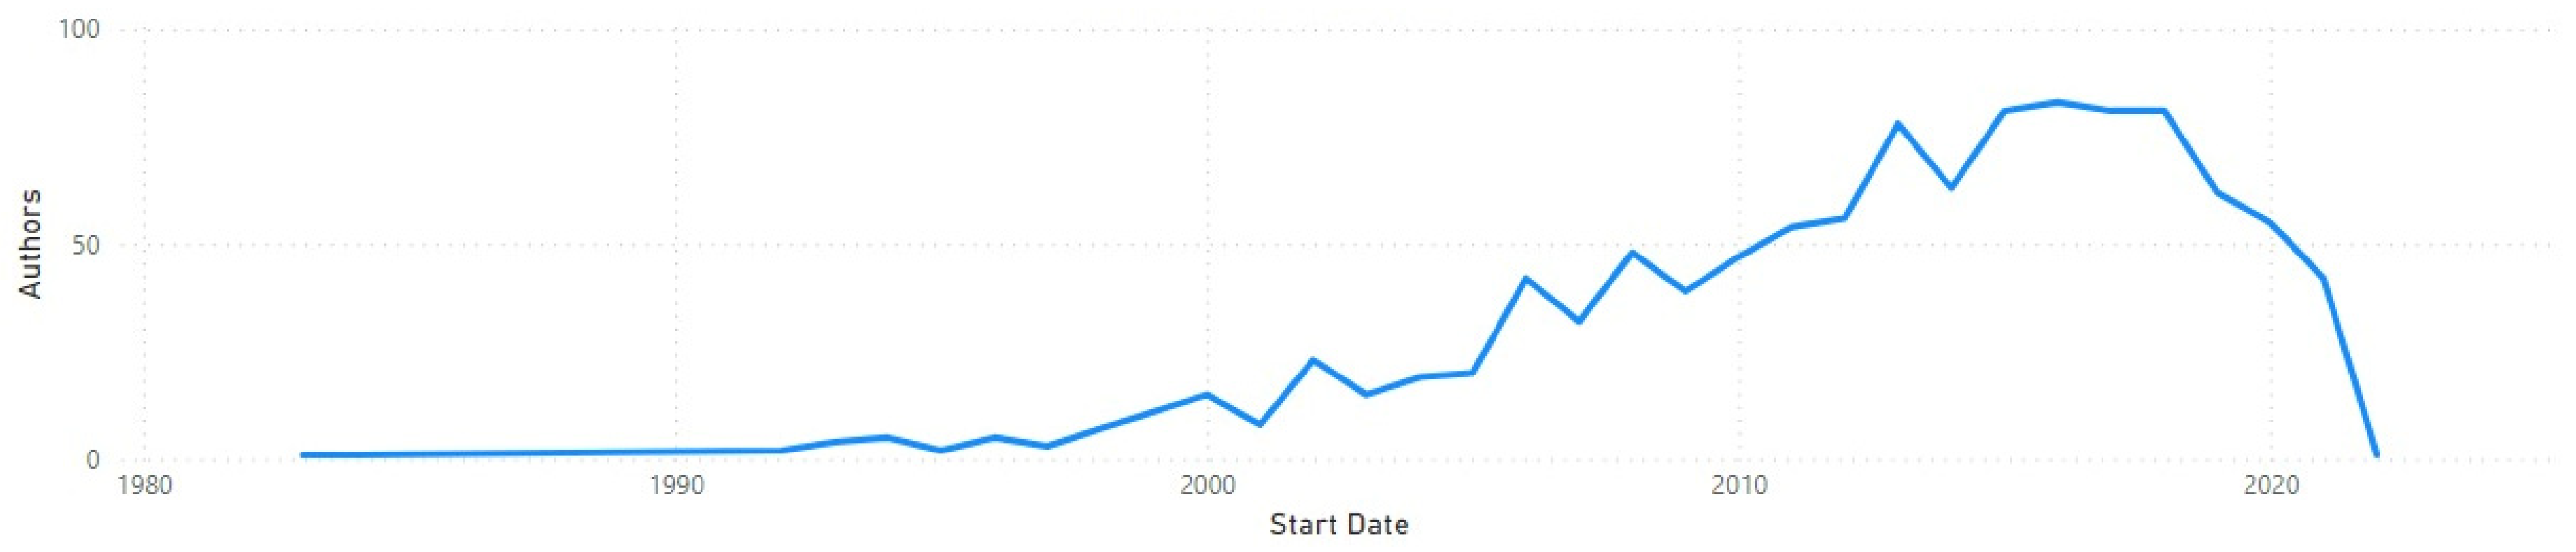
The results showed that the research label “learning analytics” was added by authors with a wide-ranging length of experience in scientific research, showing LA’s emergence as a new area of research as recently as 2011.
Figure 3 shows that the oldest public profiles with LA as a research label were created as early as 1980, while the latest were in the 2020s.
An analysis of the frequency of research labels used by authors revealed that using manually added research labels did not usefully differentiate specialist LA researchers from others, for the following reasons:
Consistency: Manually added research labels may vary in the level of detail and specificity used to describe a particular research interest. For example, some authors may use very broad labels that encompass a wide range of topics, while others may use more specific labels that relate to a narrow subfield.
Timeliness: manually added research labels may not be updated as frequently as the content of the paper itself or the author’s current areas of research.
Objectivity: As noted earlier, manually added research labels may be more subjective, thus potentially biased. This is because research labels are added by the authors themselves and may be influenced by their personal perspectives and priorities.
Mischaracterization: manually added research labels are not verified or reviewed by GS or any other independent organization, which signify that there might be chances of potential error.
5.2. Analysis of Automatically Extracted Research Keyword for Authors Who Use Manually Added Learning Analytics Research Labels
As discussed previously, manually added research labels cannot be used to classify authors who have added LA to their public GS profiles.
The data filtered through the two experiments (1 and 2, discussed in
Section 4.1 and
Section 4.2) were then analysed in various forms, depending on the count of the publications for each author. A count of publications was maintained for both experiments side by side, which yielded some authors that had either no publications in experiment 1 but multiple or at least one publication in experiment 2, and vice versa. Therefore, there were authors in the final output aggregated file that had no publications in either experiment 1 or experiment 2. Further, for some in-depth analysis, filters were applied on each method to analyse the number of publications and the impact of one filter on the other.
This textual analysis (experiments 1 and 2) of 4732 publications by 1236 authors with “Learning Analytics” in their public GS profile labels and top most cited publications, identified four unique clusters of researchers:
The definition of each category, based on the number of authors, papers, and average number of papers directly related to LA, is presented in
Table 5.
For each identified researcher category, a count of publications was maintained for both experiments (1 and 2) in order to analyse the disparity in the number of publications and whether this factor could be a discriminatory element amongst the researcher categories. One of the most interesting findings from this analysis is summarized in
Table 6 below. The cluster of early career researchers, or “rising stars”, proves that there is a sustainable productivity in the LA area. It seems that besides well-established specialists, early researchers make a significant contribution to the body of LA knowledge, promoting the discipline further.
It is evident from our analysis of automatically extracted keywords in the top five most cited publications in GS that specialist researchers published three articles on topics in the field of LA in their top five (60%), while early career researchers were committed solely to this field, so all five authors completely related to LA. This may be an indication that early career researchers were PhD students or postdoc researchers on LA projects, who were disseminating their project’s output. By contrast, only a third (33%) of occasional researchers’ top five publications related to the field of LA research.
In the following subsections, we provide additional insights into the four clusters/categories of researchers identified in our combined analysis.
5.2.1. Specialist Researchers
Those specialist researchers who used manual self-descriptive research labels for their publications employed a variety of terms, as shown in
Figure 4. The most frequently used terms were:
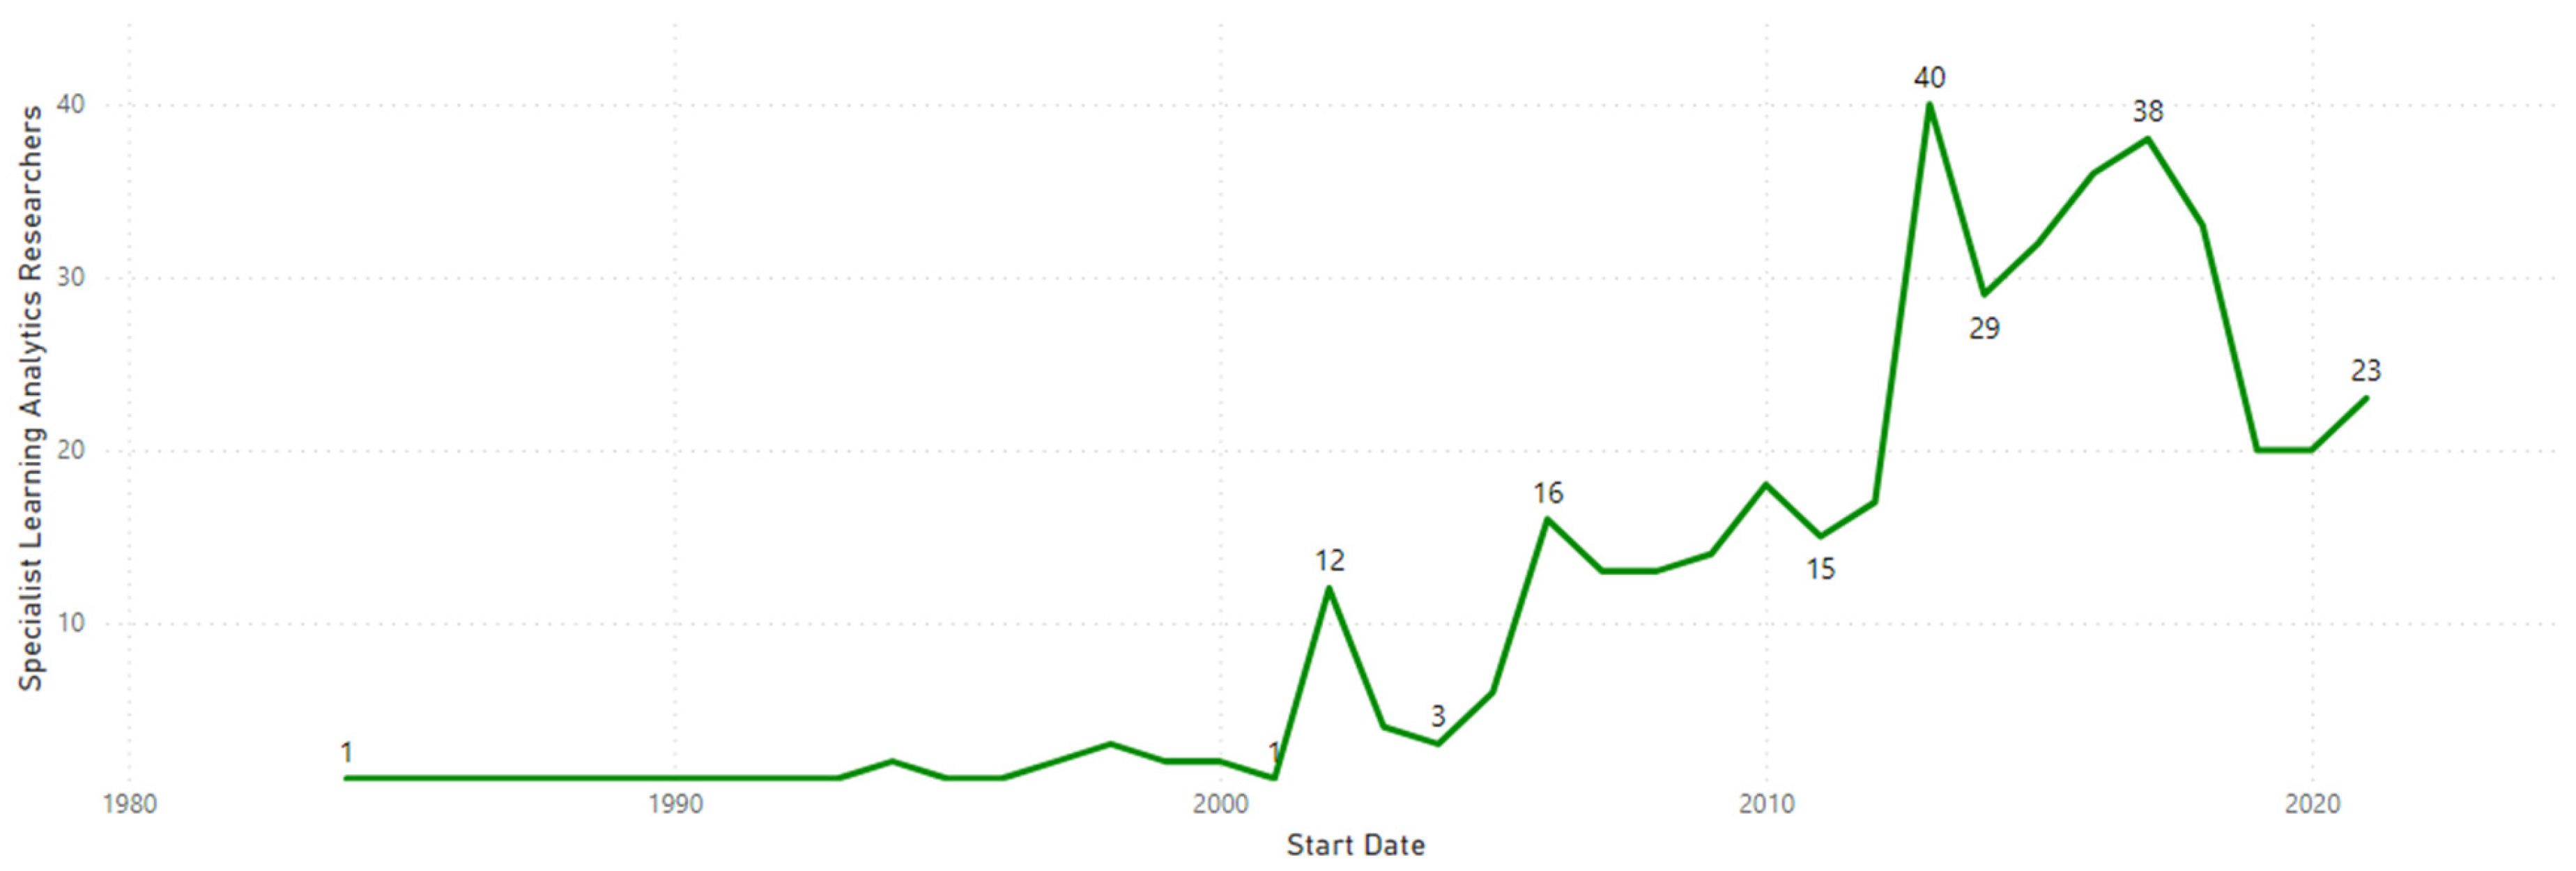
It is evident from our analysis that the start dates of specialists displayed a fairly normal distribution, with important peaks in 2001, 2005, 2013 2016, and 2021, as shown in
Figure 5.
In addition to word clouds, this study constructed text maps from the titles and abstracts of those publications selected for each of the groups identified. Since the word clouds consisted only of manual research labels, to observe our analysis and results in a holistic manner, we constructed text-based maps in VOSviewer from the title and abstract of the publications found by filtering each identified group. In line with the first analysis, where publications had “learning analytics” and related keyword terms in the title or abstract,
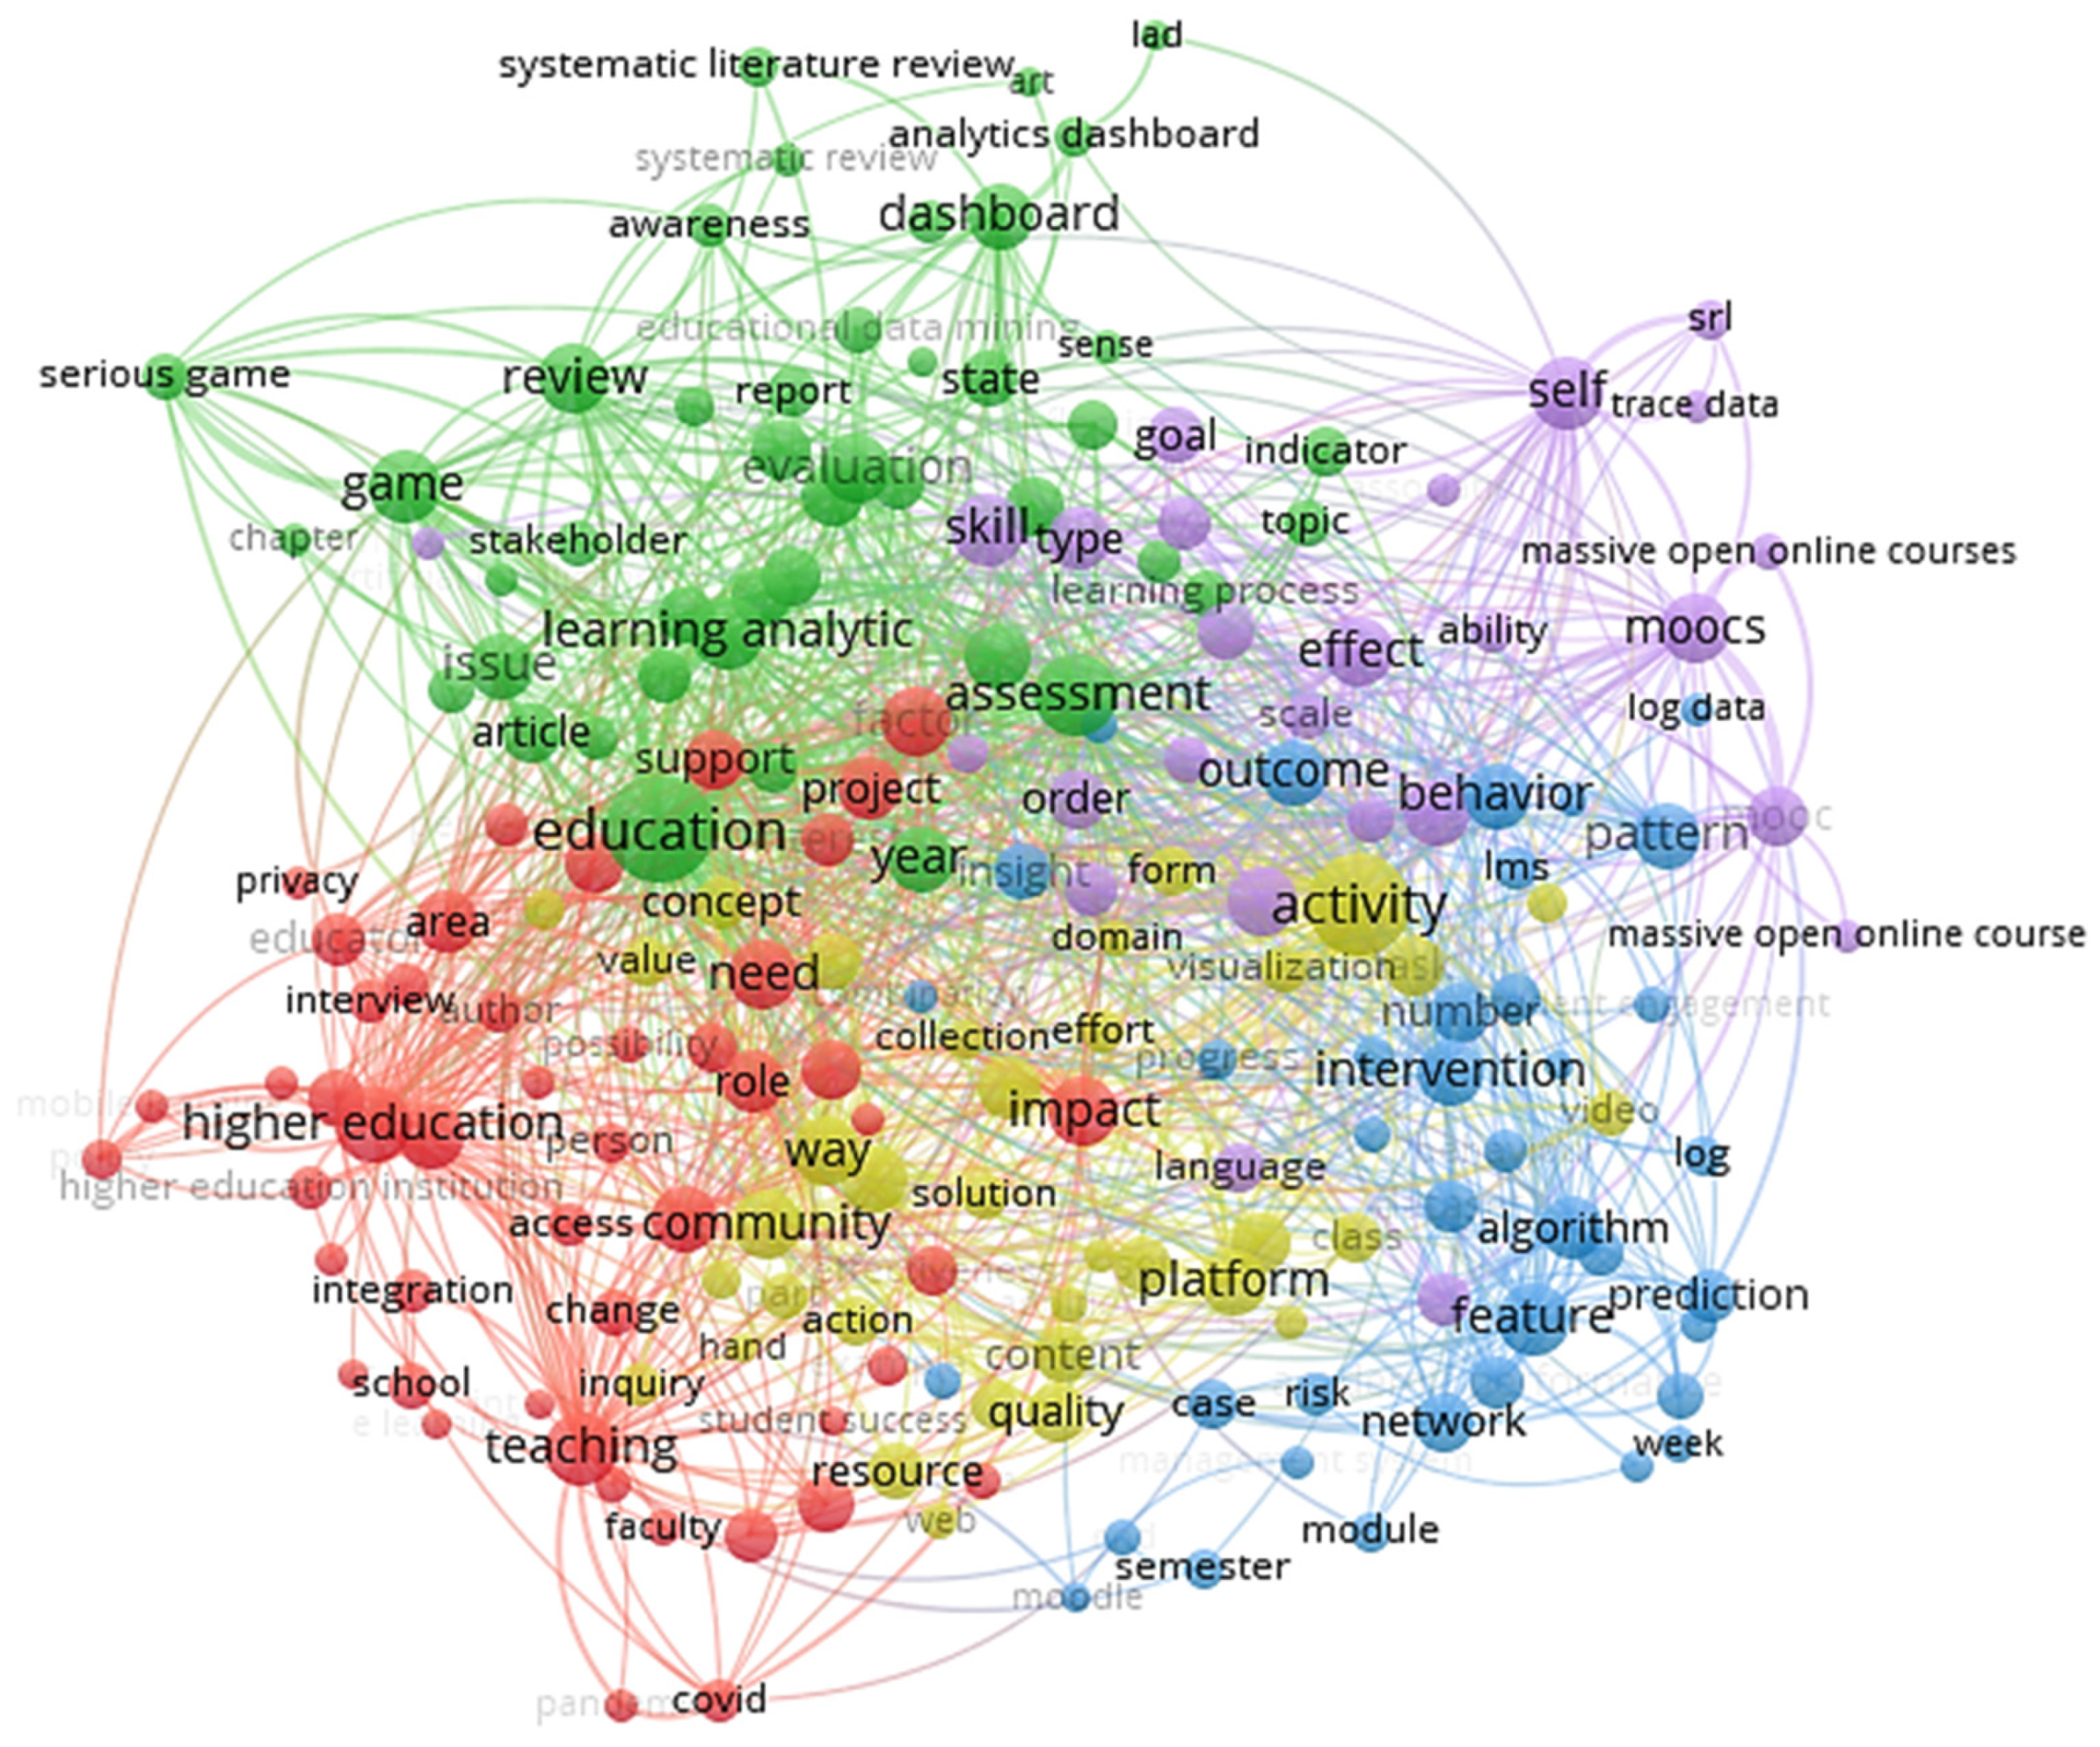
Figure 6 displays frequently occurring terms using VOSviewer.
The map showed 230 terms out of 23,034, using a minimum of 40 occurrences of each term as the threshold to highlight the major keywords in the titles and abstracts of the publication corpus. The related terminologies were in a single cluster, indicating their close correlation in terms of published articles relating to them. The co-occurrence map consisted of an array of concepts interrelated with LA and associated terms pertaining to education, assessments’ evaluation, detecting at-risk students, and so on. It can be observed that several key terms associated with LA can be identified from this text map, such as LA, massive open online courses, learning management systems (LMS), higher education, student assessment, and so on. These key terms revealed that this research community was focused on LA and its associated terms.
5.2.2. Occasional Researchers
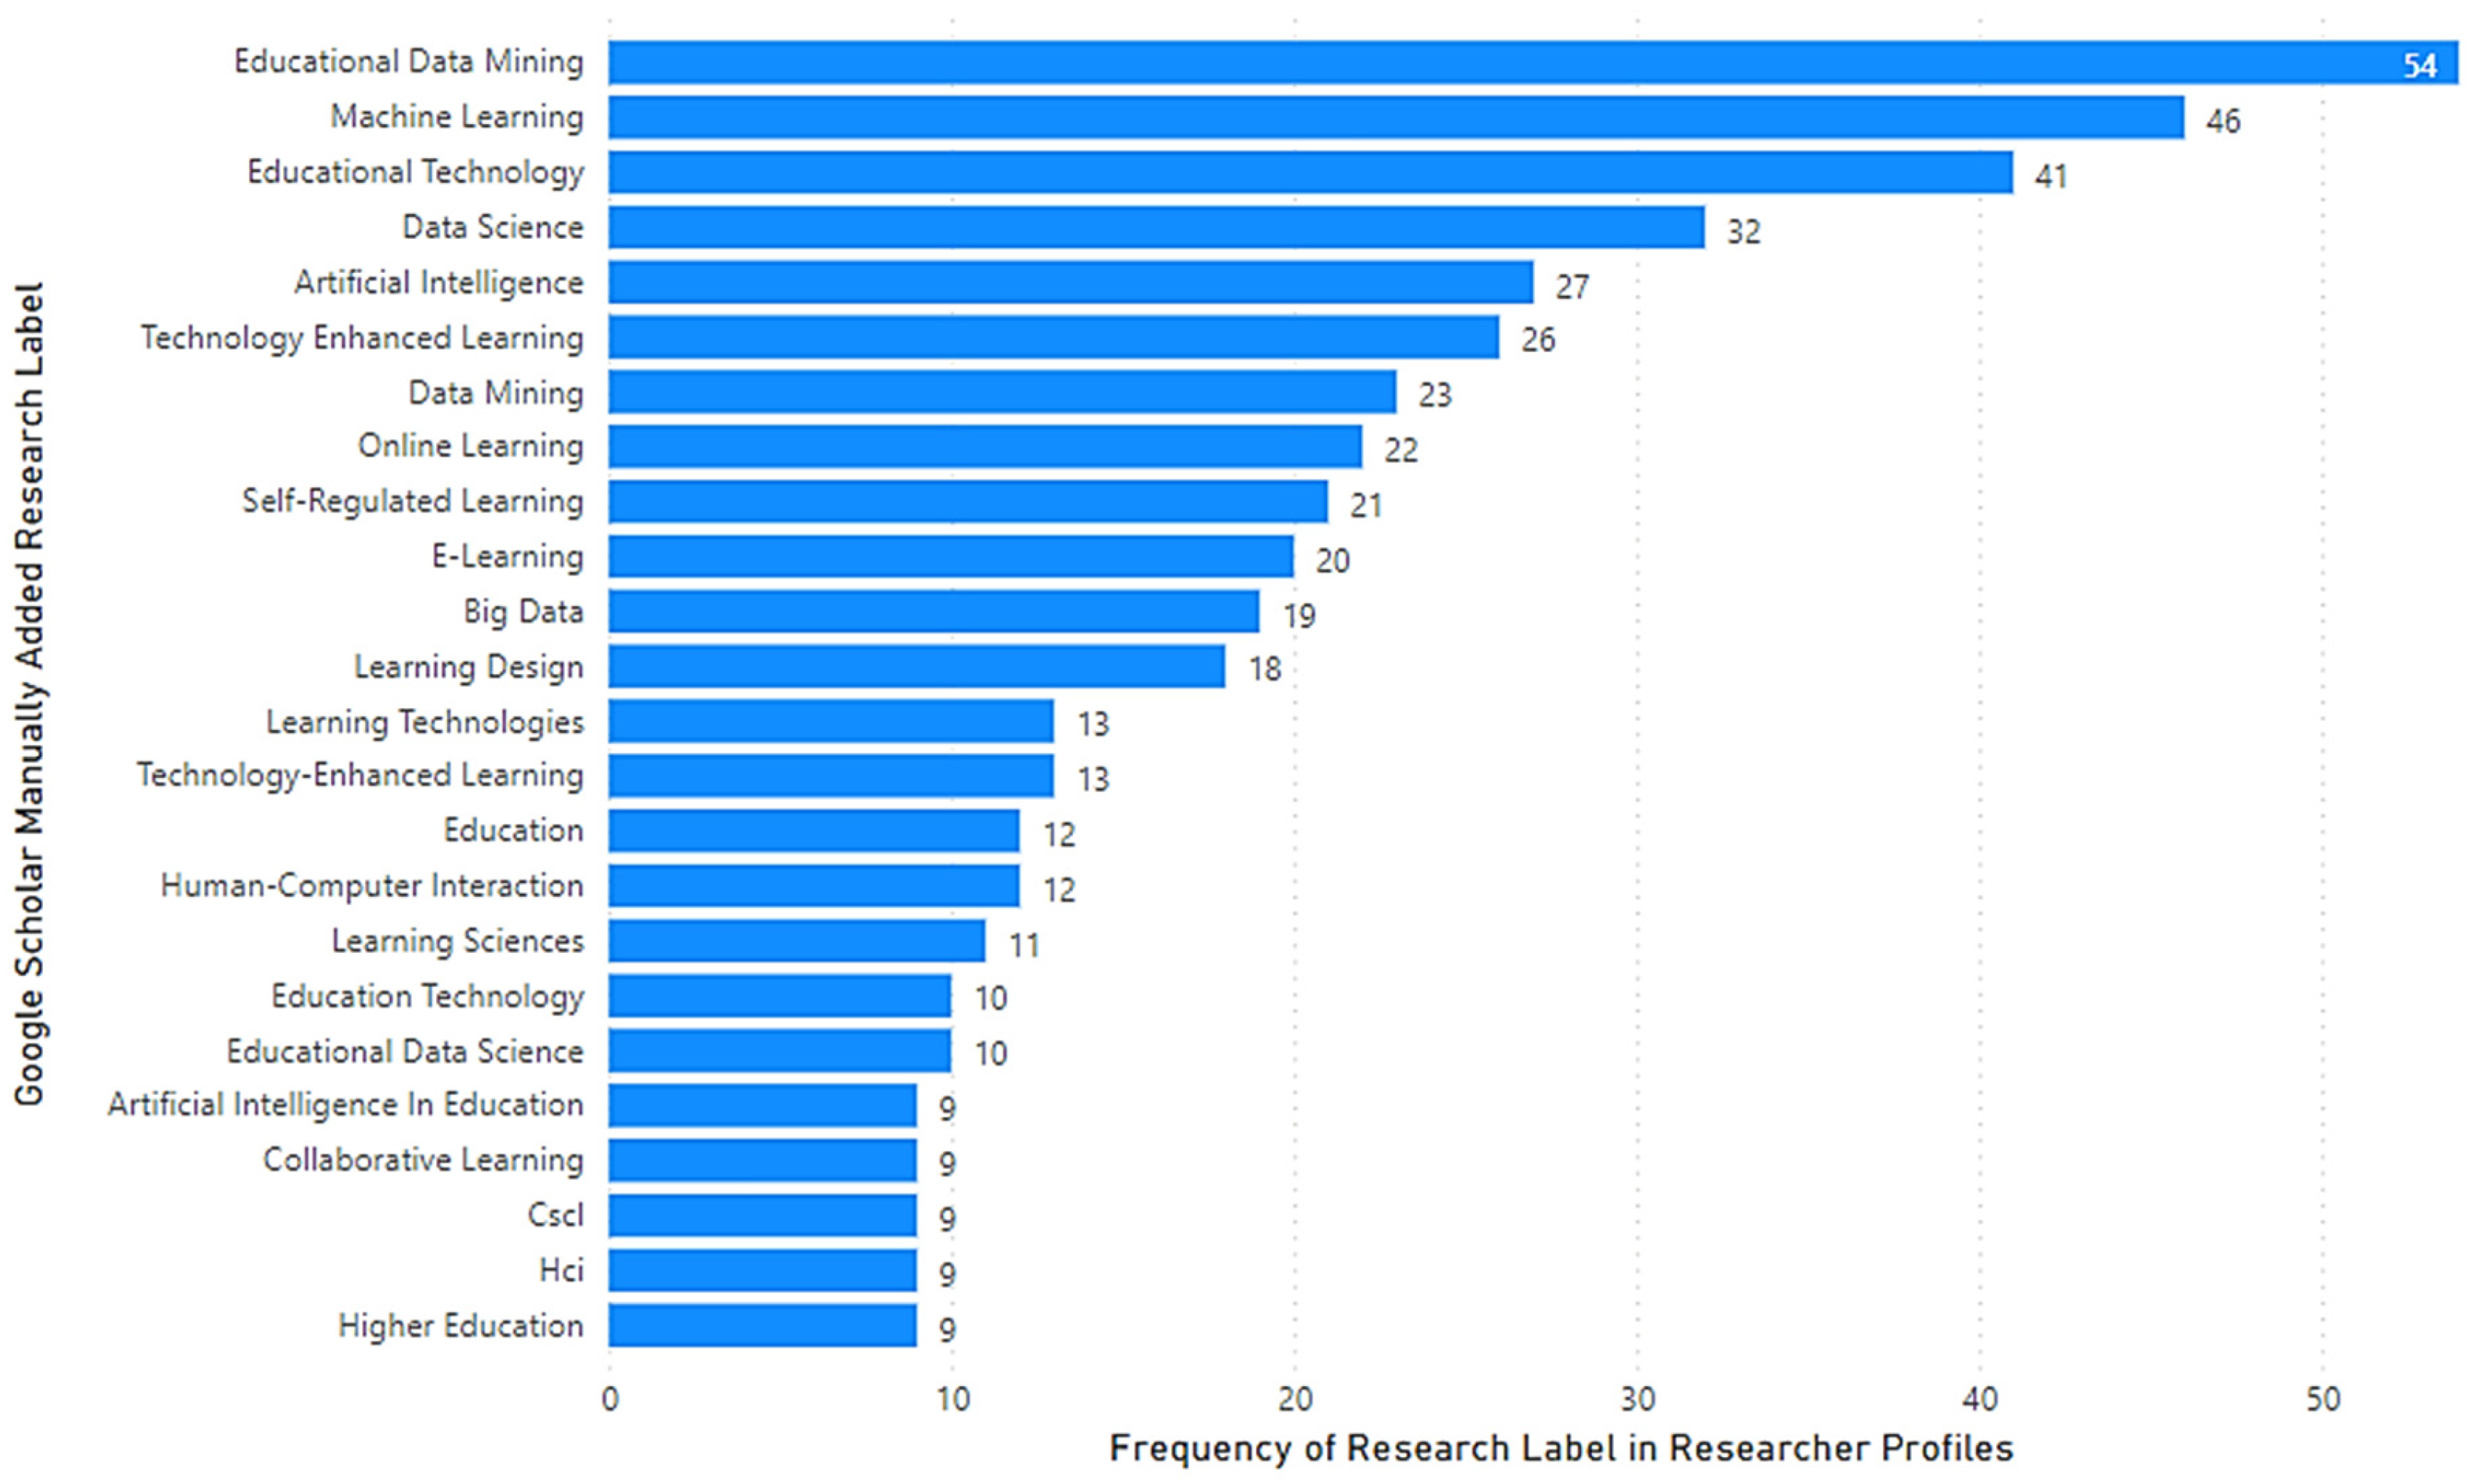
Occasional researchers who deployed manual self-descriptive research labels for their research used a variety of terms, as shown in
Figure 7.
The most frequently used labels were:
Educational data mining;
Machine learning;
Educational technology;
E-learning;
Data mining.
There was a consistent approach to the self-descriptive research tags, since there was only one difference in the top five labels compared to specialists.
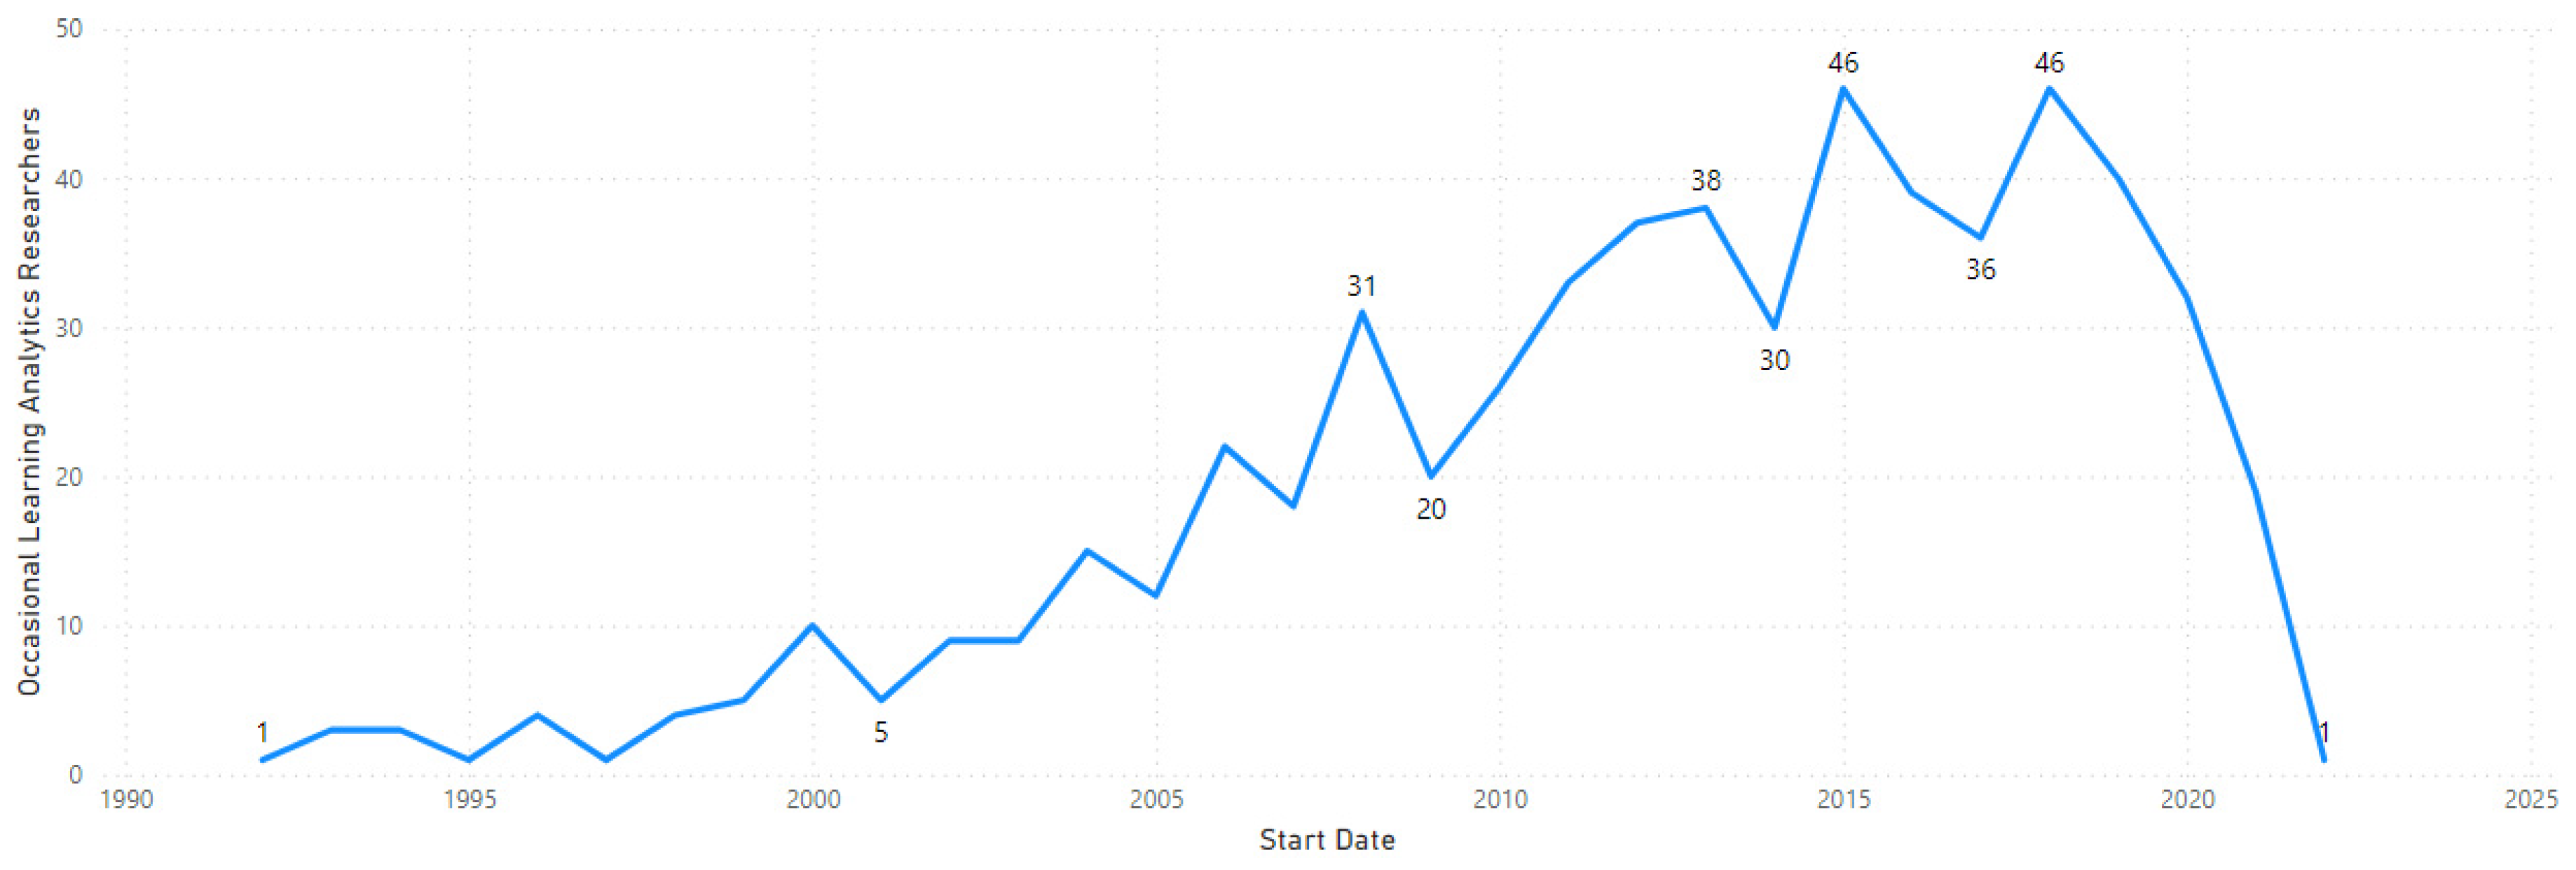
In the 1990s, occasional researchers showed a similar pattern of initiating contributions, but from early 2000, there has been a continuous presence and contribution to the body of LA knowledge, as depicted in
Figure 8.
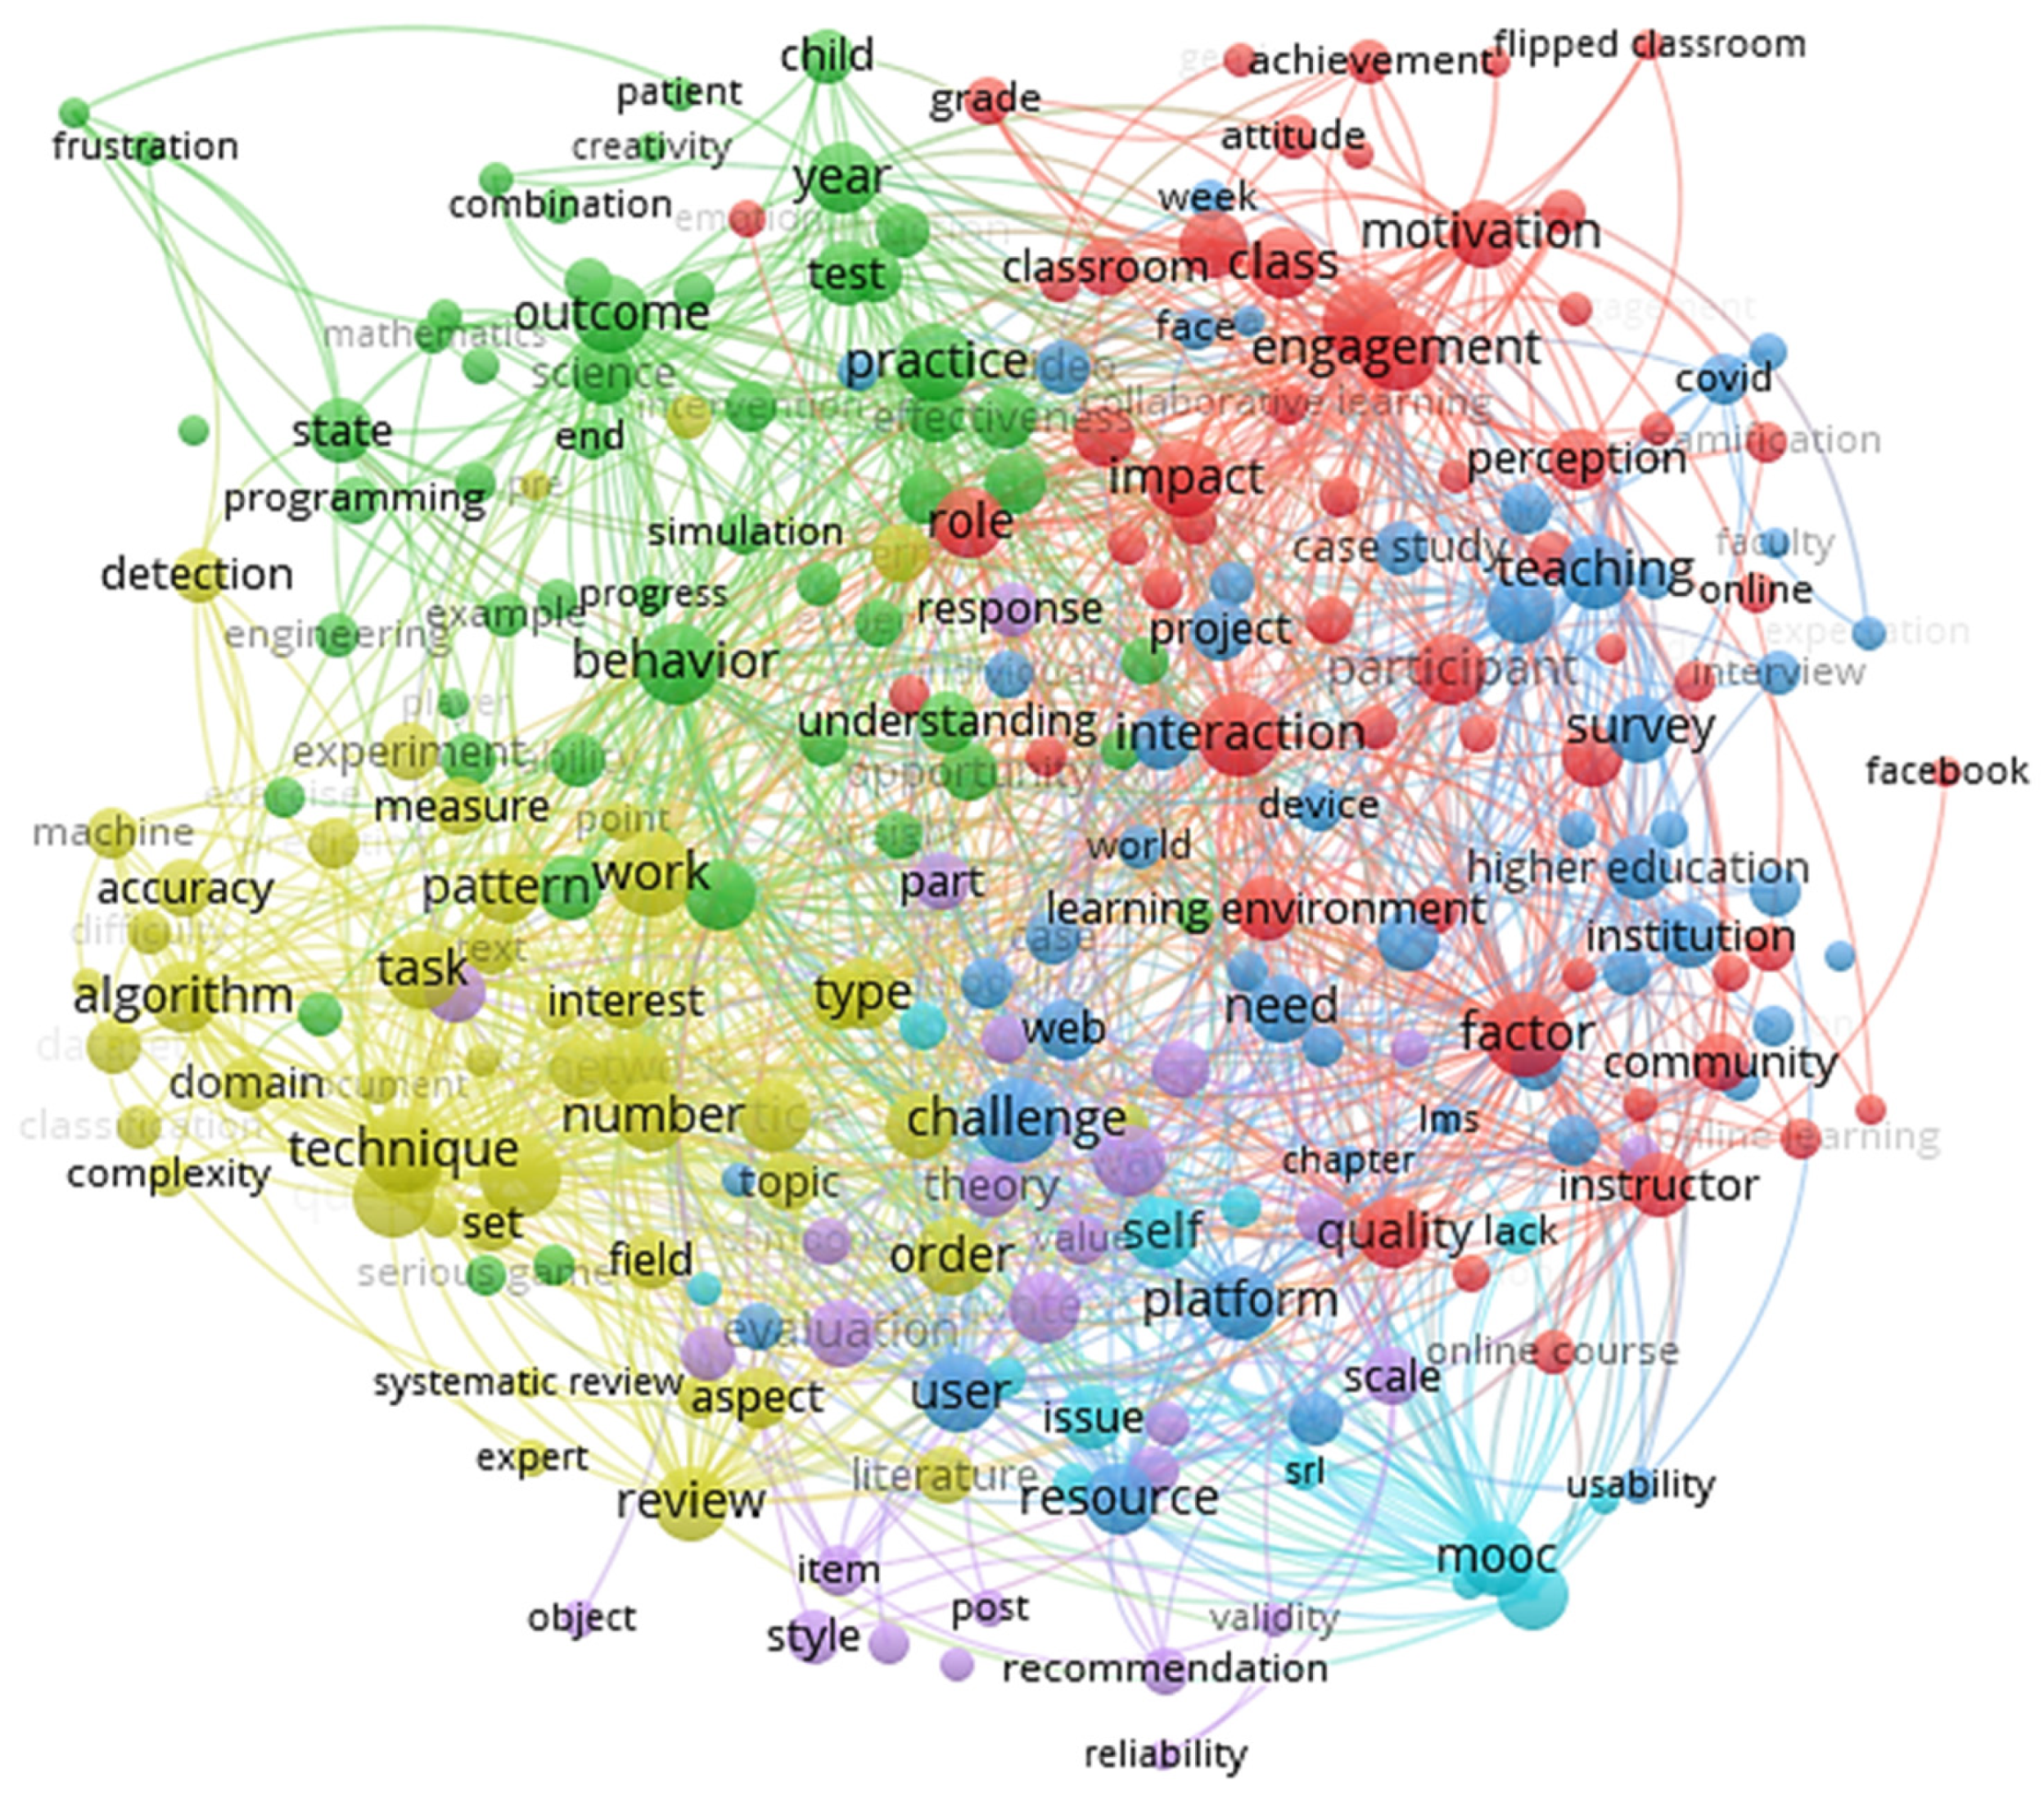
A thematic analysis of the research keywords related to occasional researchers easily differentiated them from other groups, as depicted in
Figure 9, where a term co-occurrence map was constructed for occasional researchers from the extracted keywords.
Figure 9 shows 285 terms out of 34,196, using a minimum of 40 occurrences of each term as a threshold to highlight the major keywords in the title and abstract of publications by occasional researchers in LA. An amalgamated pattern can be observed, encompassing a variety of keywords, such as LMS, flipped classroom, higher education, online course, collaborative learning, and online learning, that are associated with LA, as well as keywords not associated with this discipline, such as systematic review, mathematics, engineering, and so on.
5.2.3. Early Career Researchers
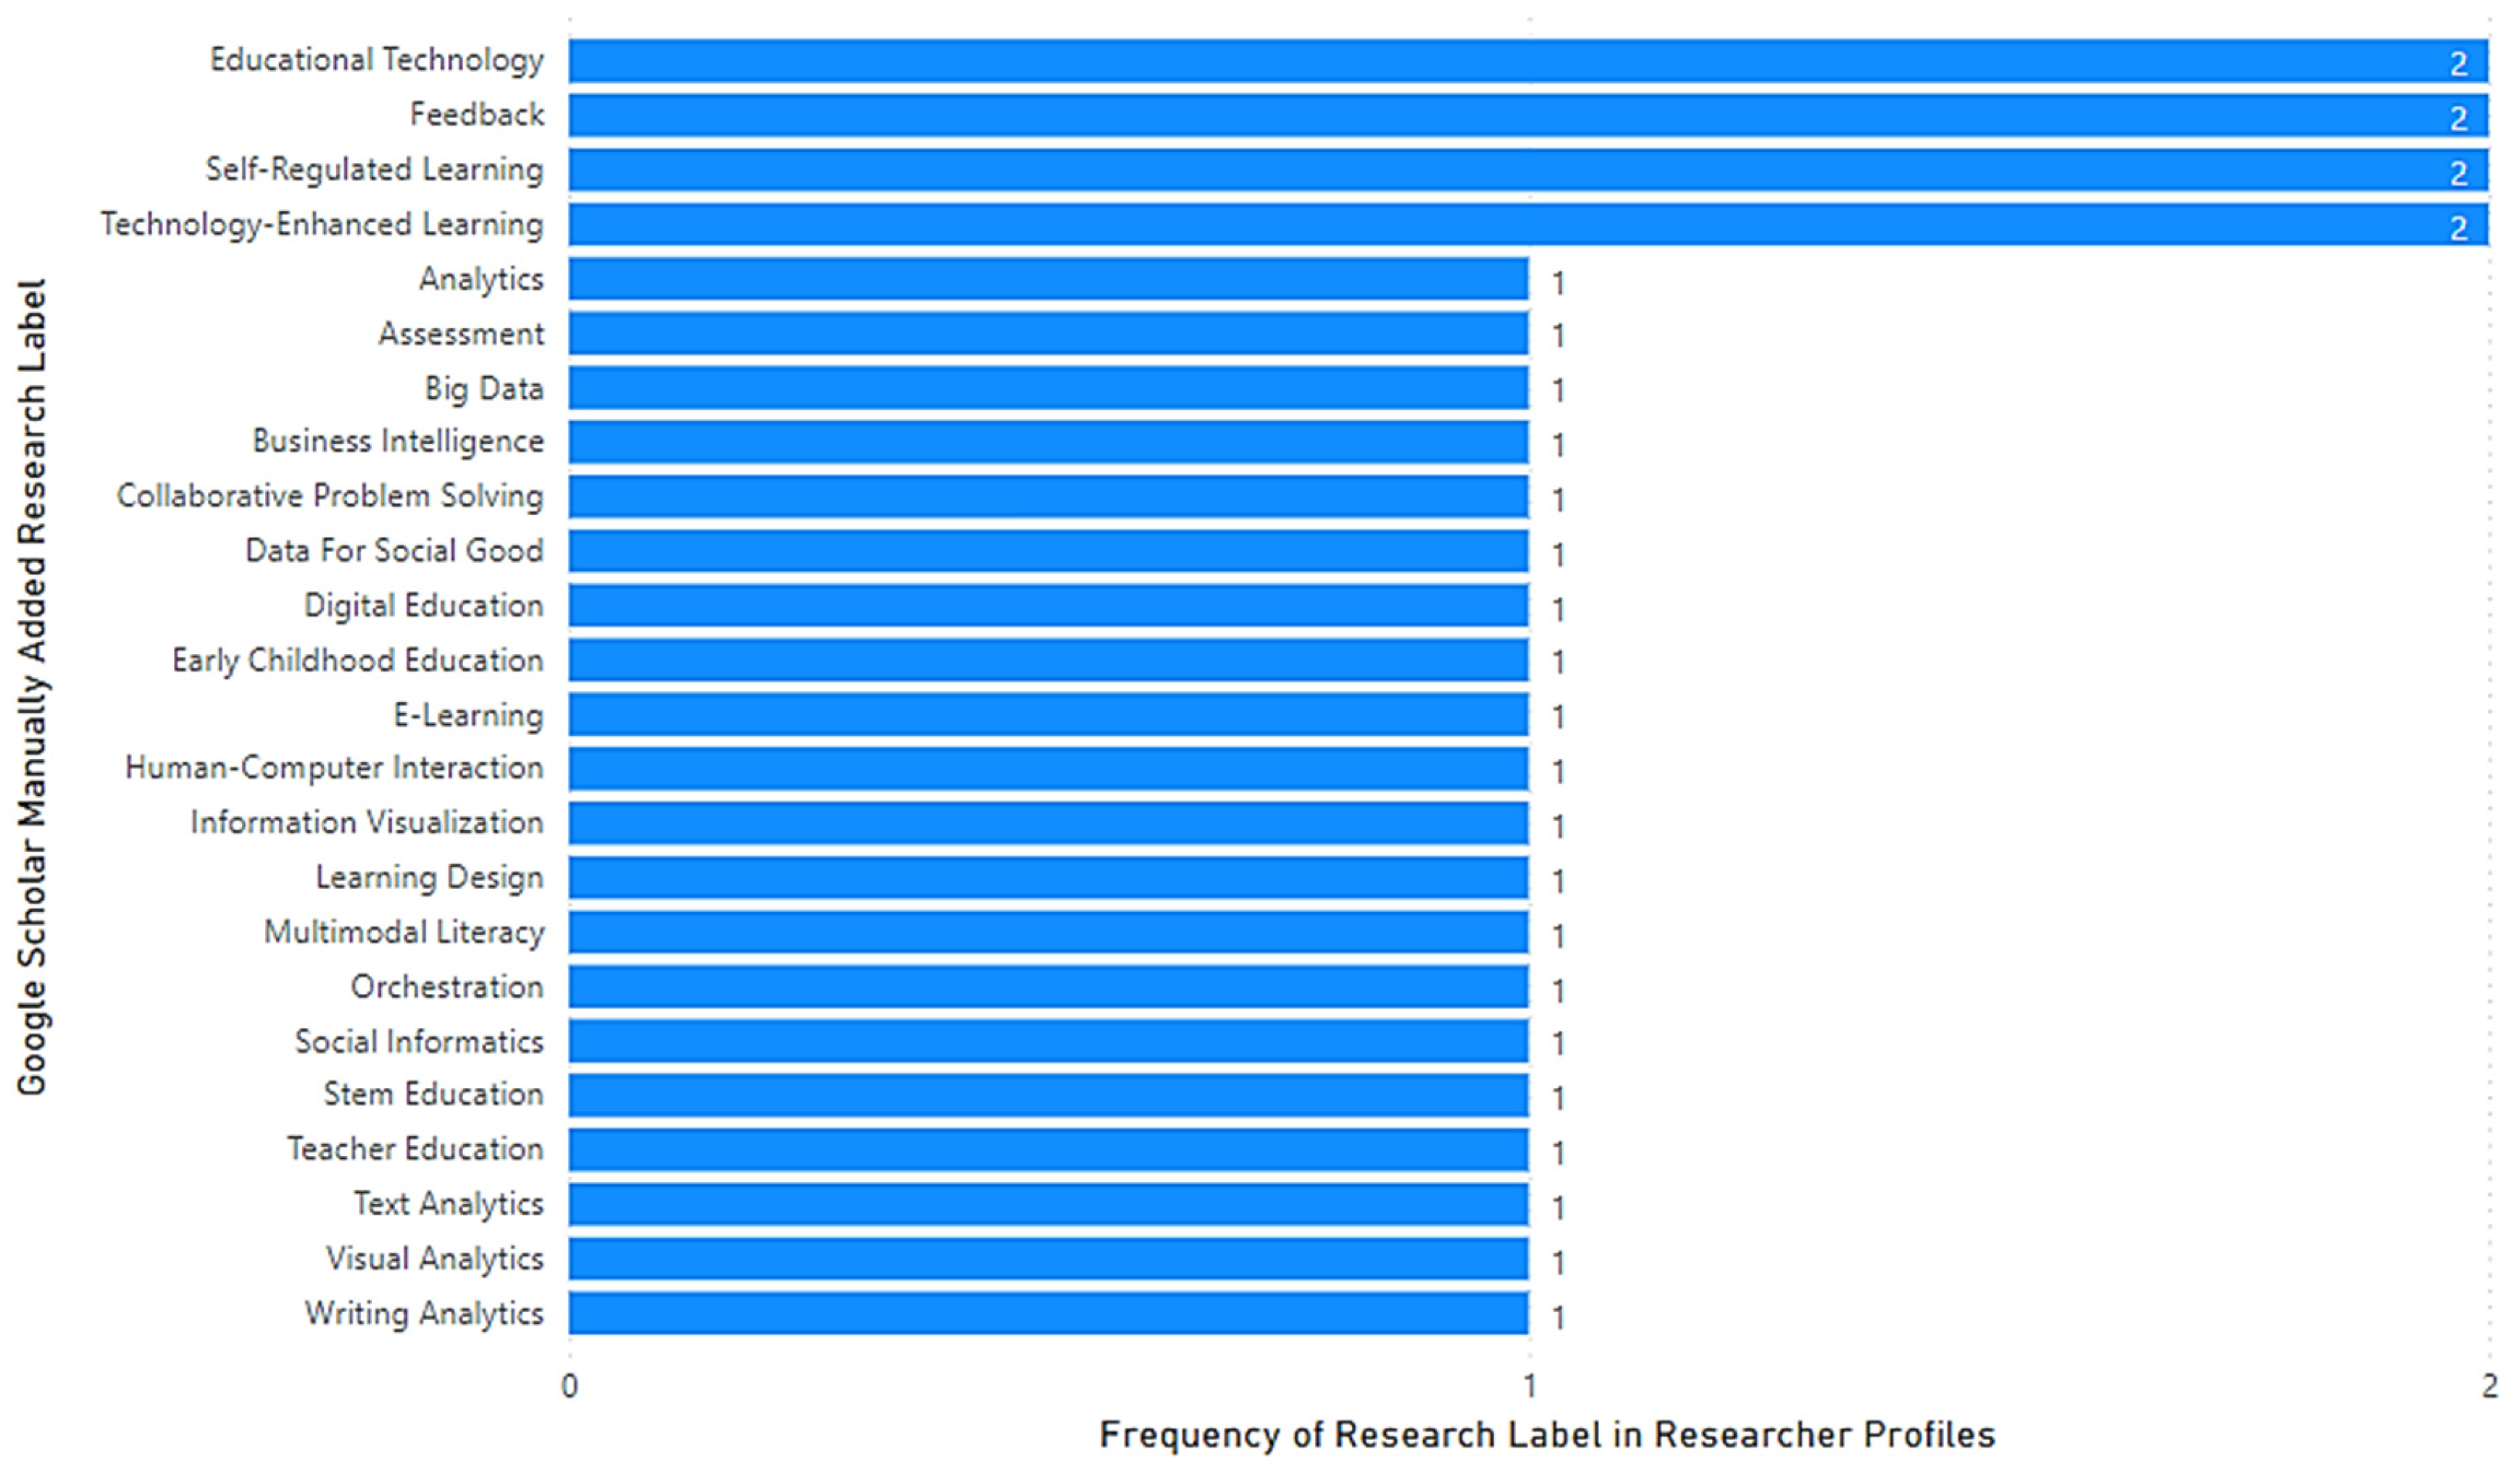
Early career researchers used research labels in a way slightly different from the previous two categories, introducing an emerging research agenda in the LA domain, as illustrated in
Figure 10, where the most prevalent research labels are listed, including:
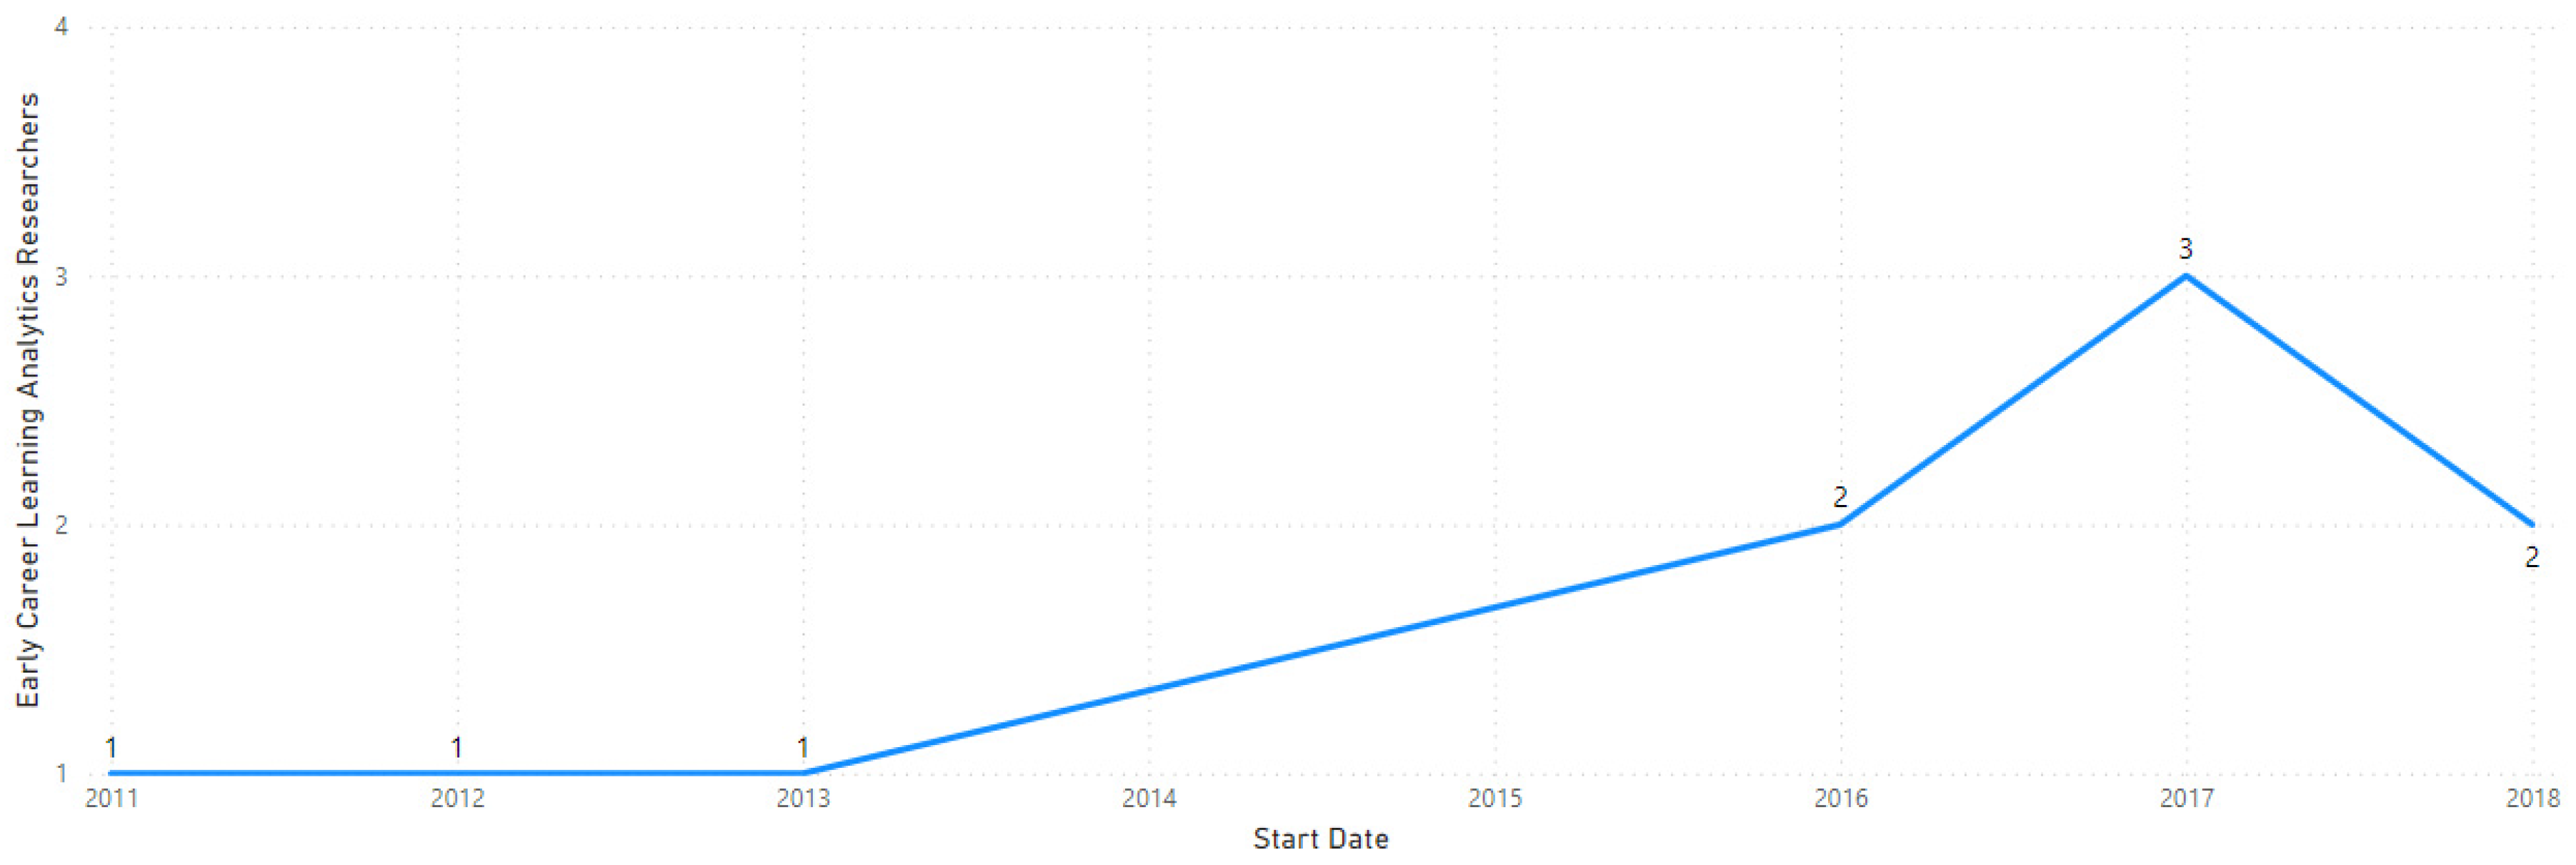
Most early career researchers have contributed to the LA domain since 2013. The few new researchers may indicate a fresh shift in research domain priorities, as shown in
Figure 11.
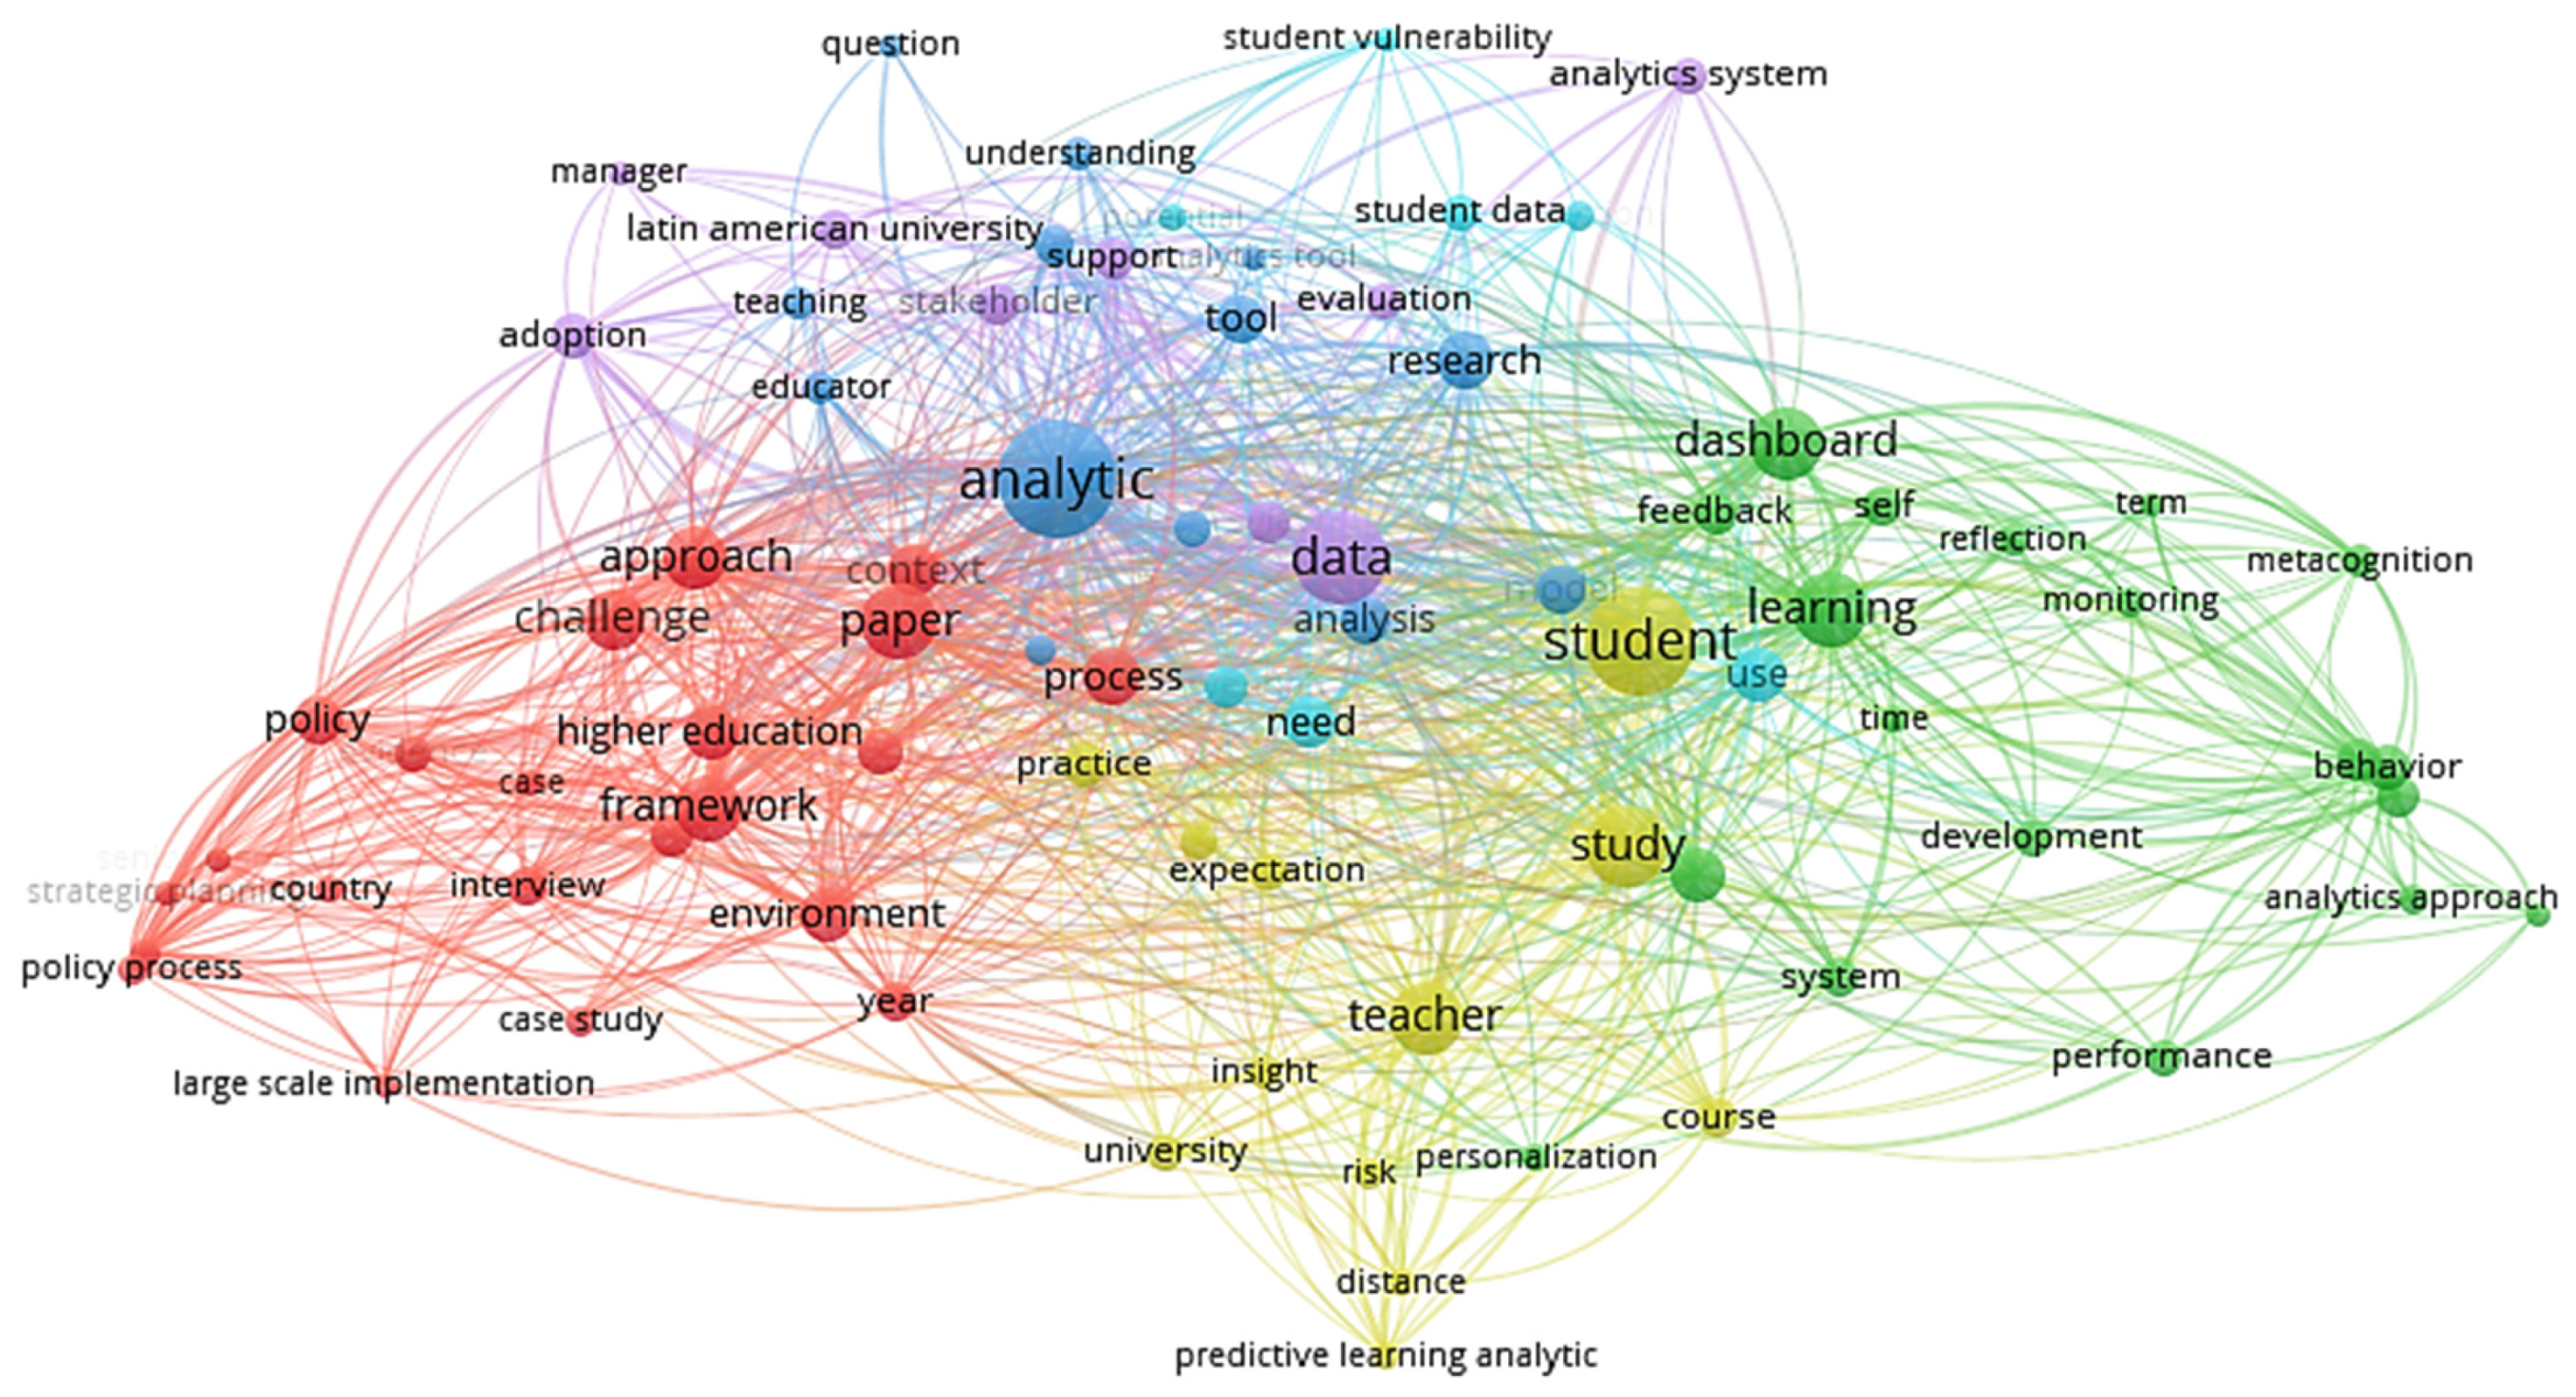
A term co-occurrence map was also constructed for early career researchers from the extracted keywords.
Figure 12 shows 87 terms out of 948, using a minimum of four occurrences of each term as a threshold to highlight the major keywords in the title and abstract of the publications for the early career researchers in LA. The map shows emerging terms associated with LA, such as analytics system, student vulnerability, predictive LA, and conventional terms in this discipline, such as higher education and blended learning. All these terms are inherently associated with LA and the educational community; hence, it demonstrates the robustness of our analysis and, in alignment with our observation, the extracted keywords are interlinked and associated with the LA discipline, further strengthening our claim for early researchers in this area.
5.2.4. Interested Researchers
Interested researchers used research labels slightly differently from the previous three categories, introducing the interdisciplinary research agenda of the LA domain, represented in
Figure 13, with labels such as:
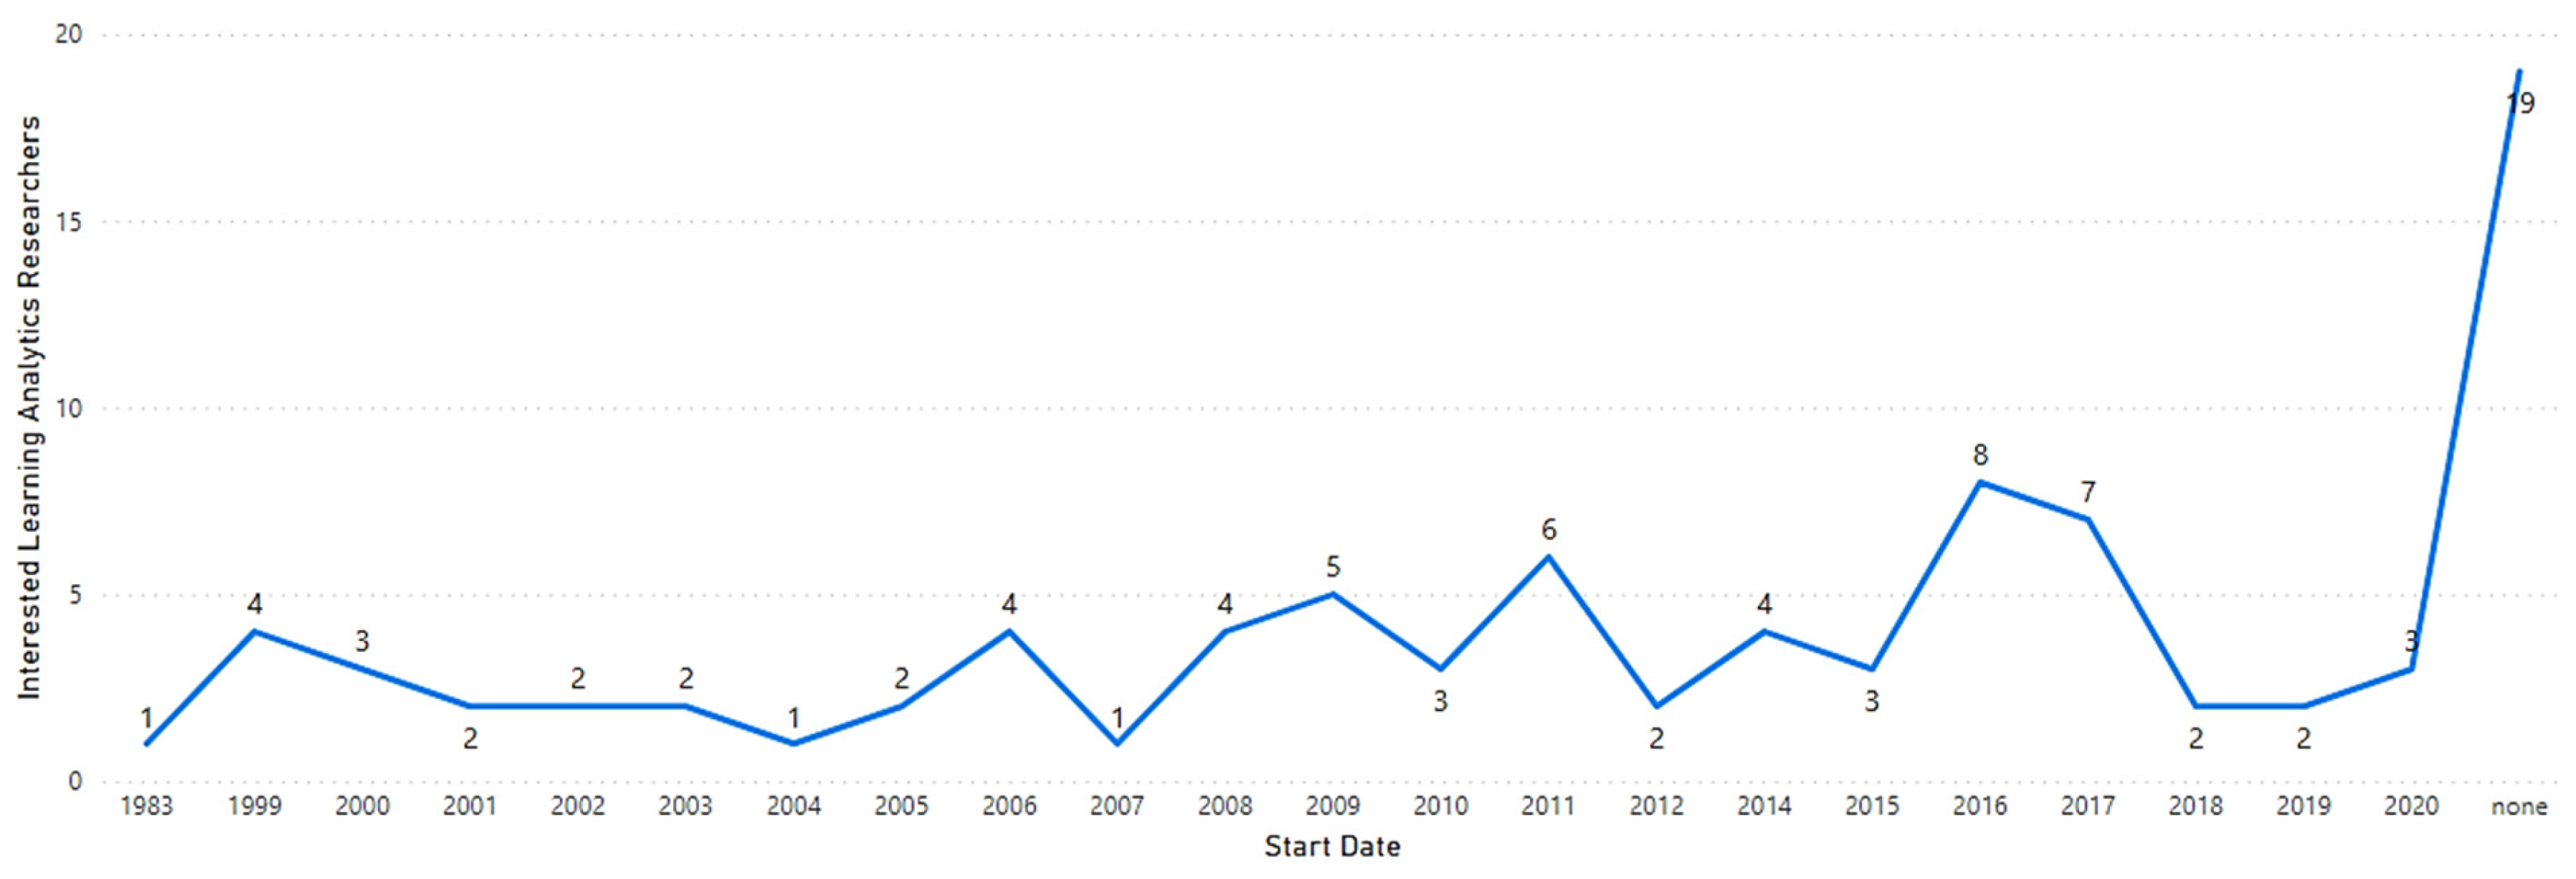
It is evident from the timeline presented in
Figure 14, that recent years have seen an increase in interested researchers, proving the potential of interdisciplinary research contributions for next-generation LA research combined with other scientific domains, such as human–computer interaction in social sciences.
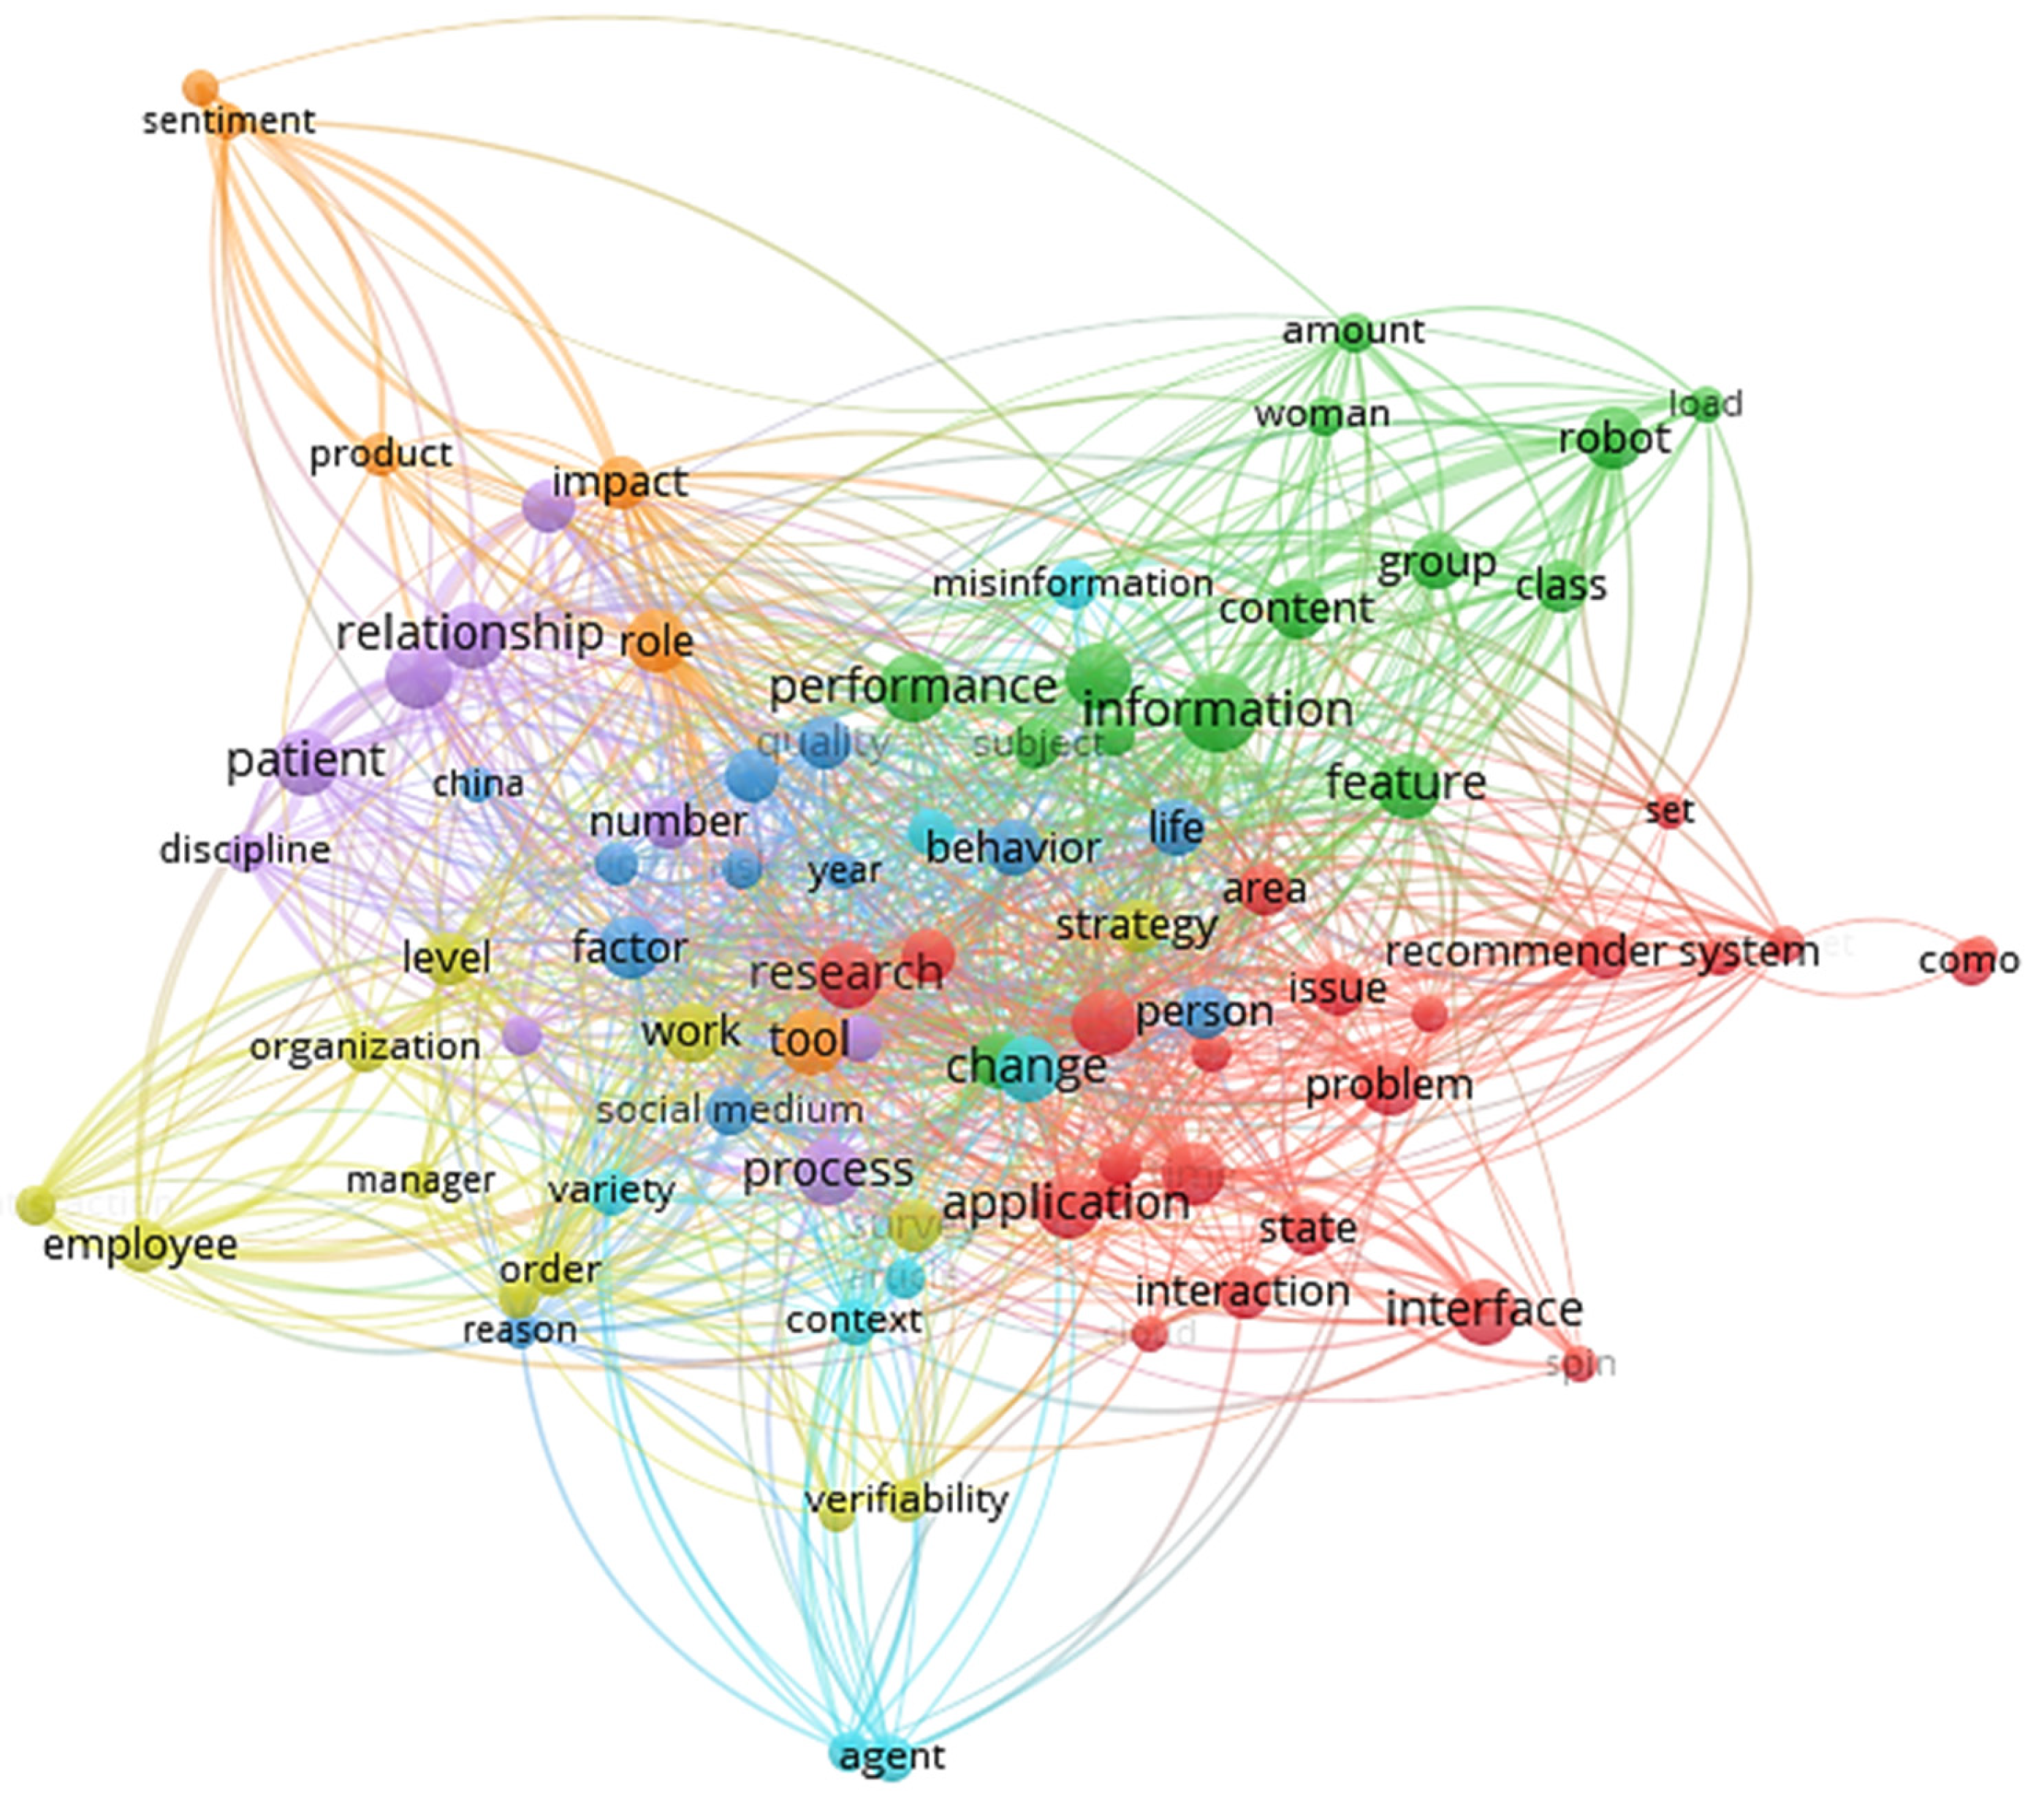
Similarly, a term co-occurrence map for interested researchers was constructed from the extracted keywords.
Figure 15 shows 94 terms out of 4947, using a minimum of eight occurrences of a keyword. It is notable that no cluster of LA associated terms was observed. This phenomenon highlights an important observation about this group, whereby some authors used LA only as a research label, yet their publications contained no keywords associated with LA.
6. Discussion
In this section we elaborate the key findings related to the research objectives and research hypothesis of our study.
6.1. Research Objectives
Research Objective #1: To deploy a robust, novel, heuristic approach to measure the research impact and influence of researchers and publications in the area of learning analytics.
The combined method (experiments 1 and 2) for locating influential researchers in the LA domain achieved an improved efficiency, identifying four distinct clusters of scholars, namely specialists, occasional, interested, and early career researchers.
The deployed methodology proved the capacity of our robust, novel, heuristic approach to attach more accurate and representative reference layers to the body of scientific knowledge. Our emphasis on the LA research domain tested the capacity of our approach to deliver meaningful information processing. The combined method of matching semantic terms in publications together with author and publication metadata mapping resulted in a new ranking of researchers based on their scientific production. The sophisticated filtering and selection of research publications based on the semantic association of meaning to the body of the knowledge are significant. This achievement is twofold: it can serve both the academic scientific community and those researchers or knowledge seekers who aim to identify high-quality research.
Research Objective #2: To reveal hidden patterns on the classification and clustering of research profiles, aiming to increase the searchability and the exploitation of research publications and content for sustainable research and education.
The deployment of our novel heuristic approach for the value assessment of research publications also resulted in the identification of four categories of researchers’ profiles, namely:
The unique features attached to these four clusters of scholars comprise significant metainformation for researchers and knowledge-seekers. The enhanced rankings attached to typical GS profiles based on our unique heuristic approach are further supported by these clusters. Each is associated with different aspects of quality and serve varying information-seeking needs. For example, specialist researchers represent well-established scholars with strong achievements and contributions. Early career researchers represent the rising stars of a research domain, and thus warrant the community’s attention. Interested researchers prove the interest of academic community members in diverse research areas, thus providing opportunities for multidisciplinary and interdisciplinary research.
6.2. Research Hypothesis
Research Hypothesis #1: The deployment of heuristic algorithms on the value assessment of research publications improves the classification of GS profiles and publications.
This hypothesis was fully supported by our analysis. The rankings of top scholars and rising stars in the LA research domain were significantly enhanced in terms of accuracy and quality by adopting a new layer of quality assurance powered by our proposed heuristic approach.
Research Hypothesis #2: Significant interpretations on the clusters of researchers in GS allow new modes of scholarly publication exploitation and value dissemination.
This hypothesis was also fully supported. The identification of four clusters of scholars, namely specialist researchers, occasional researchers, interested researchers, and early career researchers, served various modes of exploitation and value dissemination of scholarly publications in the following directions:
A fast identification of the most influential work of specialist researchers;
Direct reference to promising work by early career researchers;
Opportunities for multidisciplinary research based on ideas discussed by interested researchers or occasional researchers.
Further, one of the most significant ways in which to explore the unique value proposition of our heuristic approach is how it can serve a new generation of top-quality rankings, in comparison to recently introduced methods such as the topic characterization of papers.
7. Conclusions
Our work contributes to the areas of knowledge of bibliometrics and of sustainable research and education. The chief contribution is a heuristic approach to accessing the value and impact of scientific knowledge. The development of a unique reference layer for quality and impact assessment of research publications and researchers’ profiles may serve as a basis for more sophisticated services linked to this innovative approach. This study aimed to explore the use of manually added research labels in GS profiles to identify specialist LA researchers, in comparison to research keywords automatically extracted from their publications.
For this study, data were collected and analysed from 4732 publications by 1236 authors with “Learning Analytics” in their public GS profile labels and whose top most cited publications were since 2011. The results showed that using manually added research labels to identify the specialist LA researchers was of limited use, and that using automatically extracted keywords was more useful.
The key findings of our research were presented in the previous section. In analysing the key interpretations of our work, we must emphasize three integral components.
The first one is the capacity of sophisticated information-processing methods to reveal hidden patterns in the scientific publication data. This constitutes a significant milestone towards a new era of value-adding services that aim to generate worth from publicly available knowledge. Our heuristic approach emphasizes the contribution of domain experts to filtering the scientific knowledge and promoting new reference layers and new annotation taxonomies over what is available from technical procedure data sets.
The second component is that our heuristic approach proves the limitations of current standard procedures for the annotation of scholarly knowledge from the top platforms of our time, such as GS. The rankings of GS seem only partially accurate, or at least not as good as they could be. Our work is envisioning a new era of rankings based on trusted sources and procedures. The scientific competition among researchers and institutions should be facilitated by objective key performance indicators (KPIs).
Furthermore, the meaningful clustering of scholars into four categories of specialist researchers, occasional researchers, interested researchers, and early career researchers sets a new reference layer for both scientific publications and searchability. It would be meaningful for knowledge consumers or knowledge seekers to be able to access this layer in the public classification schemas of researchers’ profiles.
It is worth noting that both manually added research labels in GS and automatically extracted keywords have their strengths and limitations and may be useful in certain contexts. For example, manually added research labels may be particularly useful for a broad overview of an author’s research interests, while automatically extracted keywords provide more detailed and specific information on the content of a particular paper or group of papers.


