Abstract
The use of personal protective equipment (PPE) is essential to protect the human body in hazardous environments or where there is a risk of CBRN agents. However, PPE also poses a barrier to evaporative heat dissipation, therefore increasing heat accumulation in the body. In our research, we investigated the applicability of thermophysiological models for the prediction of thermal strain and the permissible working time in a contaminated environment when the usage of protective ensembles is required. We investigated the relationship between the thermal insulation characteristics of four types of PPE against CBRN agents and the induced thermal strain in a set of real physiological strain tests with human probands wearing the PPE in a climatic chamber. Based on the results, we compared the predictions using two thermophysiological models—Predicted Heat Strain Index (PHS) and FIALA-based model of thermal comfort (FMTK)—with the experimental data. In order to provide a user-friendly platform for the estimation of thermal stress in PPE, a user-friendly computational tool, Predictor of Thermal Stress (PTS), was developed. The PTS tool is based on an extensive database of simulated calculations using an FMTK model based on PPE characteristics, environmental conditions, individual parameters, and expected workload. The PTS tool was validated by means of the results from real tests in a climatic chamber. The PTS was shown to be an easy-to-use computational tool, which can be run on a regular PC, based on real data applicable for the estimation of the permissible work time limit with regard to thermal strain in PPE under various conditions.
1. Introduction
The use of protective clothing is, in many cases, the only way to protect people from external environmental influences when dealing with fires or dangerous chemical, biological, or radioactive substances. In addition, working in a contaminated or smoke = filled environment represents a significant physiological and psychological burden, and so, it is necessary that the wearer has complete confidence in the protective performance of protective clothing [1,2]. Factors contributing to the psychological burden include the limited ability to move, sense perception (vision, hearing) and communication, the heavy weight and potential discomfort of the PPE, local discomfort on certain parts of the body, the limited ability to perform delicate mechanical operations such as operating instruments, taking samples, and making records, and many others [1,2].
Moreover, working in personal protective equipment (PPE) accounts for an increased risk of thermal strain development. This thermal strain is one of the most-important harmful factors that results in impaired performance and subsequent occupational accidents [1,2].
During the COVID-19 pandemic, the authors of a study on group of 224 healthcare workers using PPE [2] observed 72.3% of respondents perceiving it to be “hot”, with 89.7% feeling “very uncomfortable” or “uncomfortable”, and 98.7% experienced an increase in sweating. A further 91.5% of respondents reported that PPE made their job more difficult. Cognitive tasks (making decisions, solving complex problems, focused attention) were limited for 32% respondents on average, and 59% of respondents on average showed heat-related illness symptoms (e.g., dizziness, fatigue, headache, heavy sweating). The average time of PPE usage was 6.5 h per day. Very similar issues were identified in a field study [3] focused on the heat stress and strain of COVID-19 nucleic acid sampling staff in a hot and humid environment. The results showed that the conditions of the ambient environment identified by the WBGT index between 27 and 29 °C led to a very high heat strain expressed by the mean skin temperature reaching up to 37 °C.
Typically, medical suits are more air-permeable than chemical protective suits, and the permissible working time is even more reduced while wearing these heavy protective suits [4]. In the study on chemical, biological, radiological, and nuclear (CBRN) protective clothing [5], heat strain was shown to be significantly higher with the ensembles provided with selectively permeable membranes compared to air-permeable ensembles. Options for how to manage thermal stress in protective clothing including ventilation systems have been previously discussed [6,7,8]. Detailed knowledge of clothing insulation and evaporative resistance are important parameters that could be supportive for workplace policies and decision-making processes [9].
The prediction of the permissible duration of activity in PPE is associated with a number of parameters, e.g., external conditions, PPE characteristics, individual user parameters, expected energy expenditure during the activity, etc. This is a rather complex issue that is difficult to express by a simple mathematical relationship [4]. To predict the risk of human exposure to overheating, models and indexes intended for predicting human thermal stress are widely used [10]. The use of thermophysiological models to predict the human heat load allows the assessment of various conditions, including the extreme ones, in advance and deriving the estimation of the permissible duration of stay in any given conditions or the critical risk at high or low temperatures. Based on the output of the model, appropriate preventive measures can then be set to avoid endangering the user’s health (e.g., estimation of the permissible work time by a particular user under given conditions, the necessary time interval for alternating PPE users under given conditions, or the interval of necessary breaks to prevent the risk of heat stress) [10].
The first concept of the calculation of heat transfer in body tissues was derived and solved by Pennes (1948) [11]. Later, several numerical whole-body models including the passive system (heat transfer inside the body) and active system (thermoregulation) were introduced [12,13,14,15,16,17,18,19]. Katič et al. summarized the applications of these complex models [18].
FIALA’s multi-segmental model has been widely accepted by the research community thanks to the model being well-documented. Moreover, the model was comprehensively validated [20,21,22] and also used for the prediction of heat stress by the Universal Thermal Climate Index (UTCI) [23], which was established as a more-complex and -advanced alternative to the wet bulb globe temperature (WBGT) [10]. The FIALA-based models are well designed for the evaluation of protective clothing, which can help to design safe periods of exposure and workload in these garments [21,24].
Using thermophysiological models, it is possible to consider most of the objectively measured factors mentioned above to predict the transient changes of the deep body temperature and local surface temperatures.
Currently, there are a number of thermophysiological models for thermal stress simulations, but most of them assume normal climatic conditions and reflect the thermal insulation properties of clothing (normal sports or work clothing) to a certain extent only, e.g., the predicted heat strain (PHS) model described in ISO 7933 [19] or the FIALA model of thermal comfort (FMTK), which includes the thermoregulatory response of the body [15,20]. These models are intended to be used by occupational health specialists to evaluate working conditions. However, protective clothing against heat, cold, or contaminated environments is outside the framework of applicability of the standard methods such as PHS or the WBGT for these exceptional conditions with regard to the specific properties of any particular PPE needs to be further validated [10].
An example of an application designed to estimate the thermal behavior of the body when using protective clothing under extreme conditions is the Cold Weather Ensemble Decision Aid (CoWEDA), a computational tool developed by the U.S. Army Research Institute of Environmental Medicine (USA) to estimate cold stress for different variants of protective clothing under defined cold weather conditions [25]. The application is also based on the results of a thermophysiological model and measurements of PPE properties and is intended for planning equipment for military or civilian units. These recommendations help to ensure optimal protective clothing against cold and safe cold exposure time [25].
In our study, we developed a new user-friendly computational tool, the Predictor of Thermal Stress (PTS), for the prediction of thermal stress and the permissible duration of activity in PPE. The tool was based on pre-calculated scenarios that reflect a combination of experimental tests with human subjects wearing PPE in a climatic chamber. The PTS tool, as well as the climatic chamber tests covered four types of PPE—two types of impermeable chemical protective suits and an air-permeable firefighter suit and filtration (adsorptive) NBC suit. The local thermal insulation characteristics of all clothing were measured by using a 34-zone Newton thermal manikin. A total of 11,664 mathematical simulations were performed using the FMTK thermophysiological model with an “average test subject” based on test parameters’ combinations. The results were used to create the core “look-up table” of the PTS tool, and the predictions were compared with the data obtained from the real tests subject. The PTS tool was validated using the results from the real tests with human probands in the climatic chamber.
2. Materials and Methods
For this study, four types of protective ensembles were measured, which were complemented by appropriate respiratory protection, either a CM-6 protective mask by Gumarny Zubri or an Auer Maxx with an MSA self-contained breathing apparatus (SCBA), as well as undergarments, boots, gloves, or a helmet. The types of protective ensembles tested are listed as follows (see also Figure 1):
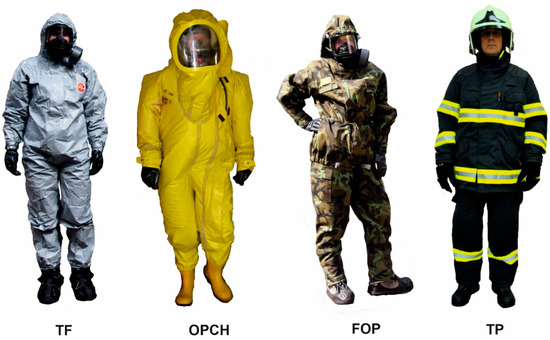
Figure 1.
Protective ensembles tested.
- TF: impermeable chemical protective clothing Tychem F ® DuPontTM, with protective mask CM-6, cotton underwear with long sleeves and legs, cotton gloves + rubber gloves, and work boots + CBRN overboots;
- OPCH: fully encapsulated suit OPCH90PO by Ecoprotect with a self-contained breathing apparatus (SCBA) Auer Maxx, cotton underwear with long sleeves and legs, cotton gloves under rubber gloves, rubber boots;
- FOP: Air-permeable filtration NBC suit FOP96 by B.O.I.S. with protective mask CM-6, boots + CBRN overboots, bamboo underwear with long sleeves and legs, and cotton gloves + rubber gloves;
- TP: Air-permeable firefighter suit Tiger Plus by DEVA either with helmet without respiratory protection or with helmet + SCBA Auer Maxx, bamboo T-shirt, and firefighter gloves and boots.
For a temperature of 5 °C, 25 °C, or 35 °C, the underwear was as described above; for the tests at a temperature of −10 °C, the probands wore an additional merino wool sweatshirt.
2.1. Thermal Insulation Characteristics of the Clothing
The thermal insulation characteristics of the clothing were measured in a climatic chamber at Brno University of Technology using the 34-zone Thermal manikin Newton (Theremetrics, Seattle, WA, USA).
The total thermal insulation of clothing IT and local thermal insulation IT,i were measured using a standard procedure according to EN ISO 15831 [26] and calculated according to Equations (1) and (2). The evaporative resistance ReT was measured using a non-standard method based on the measurement of moisture loss from the “artificial skin” covering the entire surface of the manikin [27] and recalculated from the measured heat loss according to Equation (3) [27].
For further purposes of the data input of IT, we used clo units instead of m2·K·W−1, where 1 clo = 0.155 m2·K·W−1. Icl is the intrinsic insulation from the skin surface to the outer clothing surface (including enclosed air layers) [28]; IT = Icl + Ia, where Ia is the thermal resistance of the outer air layer; for a naked man, Icl = 0 clo.
- IT—Total thermal insulation including the air boundary layer of the measured garment (m2·K·W−1);
- TS—Average manikin surface temperature (°C);
- Ta—Air temperature in the climatic chamber (°C);
- AM—Total body surface area of the manikin (m2);
- Hc—Total thermal energy delivered to the manikin (W).
- IT,i—Local thermal insulation including the air boundary layer of the measured garment (m2·K·W−1);
- TS,i—Local manikin surface temperature (°C);
- AM,i—Surface area of the individual zones of the manikin’s body (m2);
- Hc,i—Local thermal energy delivered to a given zone on the manikin (W).
- ReT—Total evaporative resistance (kPa·m2·W−1);
- Δpiso—The difference between the saturated vapor pressure at the manikin surface and the ambient vapor pressure (kPa);
- He—Amount of evaporative losses from the manikin surface (W);
- AS—Sweating surface of the manikin (m2).
Based on the measured values of IT and ReT, the static clothing permeability index im was calculated according to Equation (4) described in the standard EN ISO 9920 [28] for all measured types of protective ensembles. In the recalculation of the im value, however, it is necessary to take into account a certain uncertainty in the measurement [27,29].
- im—Static clothing permeability index (-);
- LR—Lewis constant (LR = 16.5 K·kPa−1).
2.2. Testing of the Thermal Strain in Climatic Chamber
The real tests of physiological strain were conducted in a climatic chamber of the National Institute for NBC Protection according to a standard protocol with up to 12 volunteer probands (6 men and 6 women) experienced in PPE testing in climatic chambers or familiar with using PPE at work. Anthropometric data (height, weight etc.), the Body Mass Index (BMI), and other individual characteristics were measured for each proband before each test, and the VO2max value was measured for each proband in advance of the set of tests as an indicator of physical fitness.
Some of the probands were not able to conduct the complete set of tests within the research; therefore, the count of the tests under the same conditions may vary, as indicated in the Section 3. The tests of physiological strain under conditions of −10 °C and 5 °C were not conducted with all probands, as these tests were performed only for informative reasons (testing of the applicability of the thermophysiological models), as these conditions are outside the validity range of the thermophysiological models; for the count of the tests, see the Section 3.
Before conducting the test, the proband undertook a pre-conditioning time of 15 min in a relaxation room with the possibility to drink. The preparation for the test took another 15 min (weighing, measurement of blood pressure, adjusting the sensors, donning the underwear and protective ensemble). The probands wore the appropriate protective ensemble and performed a simulated work load by walking on a belt ergometer in a climatic chamber under given climatic conditions.
The tests with the SCBA were arranged in such a way that two cylinders could be used sequentially during the test without interrupting the test:
- Parameters of the probands: (a) 6 men (age: 29–53 years, height: 170–187 cm, weight: 69–92 kg, BMI: 20.2–29.4 (2 normal, 4 Overweight Class I), fitness level based on VO2max value: from very poor (4 men, the worst 27.8 mL·min−1·kg−1 for a man of age 29 years) to good (2 men, the best 37.3 mL·min−1·kg−1 for a man of age 55 years)); (b) women (age 28–49 years, height: 158–176 cm, weight 56–71 kg, BMI: 20.3 to 26.1 (5 normal, 1 Overweight Class I), fitness level based on VO2max value: from poor (1 woman, 28.4 mL·min−1·kg−1 for a woman of age 28 years) to good (5 women, the best 33.6 mL·min−1·kg−1 for a woman of age 36 years)).
- Conditions in the climatic chamber: (a) −10 °C and 25–35% rel. humidity (RH), (b) 5 °C and 20–30% RH, (c) 25 °C and 20–30% RH, (d) 35 °C and 15–25% RH; air flow always 0.2 m/s, walking on ergometer (4 km/h, inclination 10%) in mode of 5 min acclimatization in the climatic chamber + max. 4 cycles of 20 min walking + 10 min rest, i.e., 125 min in total.
- Max time achieved—reasons for termination of the test: (a) reaching the end of the test with standard test time limit 125 min, or (b) reaching the heart rate limit (HRlim = 220 − age), or (c) reaching the body core temperature/rectal temperature limit (Tre,lim = 38.5 °C), or (d) proband’s own request (headache, unbearably hot, nausea, breathing problems, etc.).
Physiological parameters were monitored using the following systems: Almemo 2590-4S (Ahlborn GmbH, Holzkirchen, Germany, accuracy ±0.17 °C) and Viridia (Philips Medizinsysteme, Boeblingen, Germany) with rectal probe Philips 21075A (accuracy ±0.1 °C within the range 25 °C to 45 °C) using wired data transmission. The maximum test time achieved was recorded for all tests, as well as the reasons for test termination. The measurement of VO2max and the related estimation of the fitness level was conducted on the METAMAX 3B (CORTEX, Biophysik GmbH, Leipzig, Germany). The conditions in the climatic chamber were controlled using the programmable temperature and relative humidity sensor Comet T3110 (Comet Systems, s. r. o., Rožnov pod Radhoštěm, Czech Republic, accuracy ±0.4 °C for temperature and ±2.5% for relative humidity) and monitored using an independent multifunctional thermometer, the Testo 435-4 (Testo SE & Co. KGaA, Titisee Neustadt, Germany, accuracy ±0.2 °C for temperature and ±2% for relative humidity). During the tests, the temperature set in the climatic chamber, (−10 °C, 5 °C, 25 °C or 35 °C)/relative humidity set at 25%, fluctuated within the amplitude ±1 °C/±5% based on the accuracy of the controlling sensor and in regard to the technical equipment of the climatic chamber:
- Monitored values: heart rate (HR in BPM = beats per minute), body core temperature = measured rectal temperature (Tre) in (°C), skin temperature (Tsk) (°C), and sweat production in (g·m−2·h−1).
- Physiological parameter measurement systems: Viridia (HR, Tre), Almemo (Tsk).
From the resulting values measured with different probands under the same test conditions, the averages and standard deviations were calculated, and the reasons for test termination were summarized.
2.3. Verification of Usability of the Thermophysiological PHS and FMTK Models
Two thermophysiological mathematical models, the PHS and FMTK, were tested to verify their applicability for estimating the permissible work time limit in a protective ensemble in terms of the thermal strain caused by the heat accumulation in the body and the associated increase in body core temperature. The purpose of the comparison between the two models is important to determine whether the PHS, FMTK, or both result in different and/or reasonable predictions also for protective clothing with properties outside the validity range of the models:
- The predicted heat strain (PHS) model is described in the ISO standard 7933 [19] and is intended for the prediction of body core temperature, mean skin temperature, and intensity of sweating. The PHS is a simpler and less time-consuming model in comparison with the FMTK model below. The validity range of the PHS model is shown in Table 1 [19,30].
 Table 1. Range of validity of PHS and FMTK models [15,19,20], where Ta = air temperature, pa = water vapor partial pressure, Trad = mean radiant temperature, va = air velocity, M = metabolic rate, Icl = intrinsic clothing insulation.
 - The FIALA-based model of thermal comfort (FMTK) [15,20] is based on the calculation of heat exchange in the body with respect to the individual anthropometric data of the user, external climatic conditions, thermal insulating properties of the protective ensemble, and expected intensity of physical activity. The FMTK model works as a dynamic model, i.e., it consists of a system of partial differential equations of heat transfer in human tissues. The FMTK model is based on the numerical solution of heat transfer in the human body with a resolution of 19 human body segments and provides a prediction of the mean skin temperature, rectal temperature, and local skin temperatures. The validity range of the model is shown in Table 1 [15,20].
Both models, the PHS and FMTK, were implemented in the MATLAB software (version 2020b) based on the publications [15,19].
Firstly, a preliminary usability study [24] was conducted for both models. The resulting predictions were compared with the actual values of the body core temperature obtained from the real test with one proband in a climatic chamber for three types of ensembles: Klimatex underwear, air-permeable military filtration NBC suit M2000, and impermeable chemical protective clothing Tychem® F (DuPont de Nemours, Luxembourg). For more details, see the study [24].
In this research, further experiments with more probands wearing various protective suits under various conditions were carried out to verify the results of the study [24] on a larger set of measured data. In accordance with the preliminary study [24], the FMTK model was determined to be more suitable for the PPE application; see the Section 3 for more details.
For the comparison of the simulated data with the real experiments, the mean absolute error (MAE) was used. It was calculated according to Equation (5):
- MAE—Mean absolute error;
- n—Number of measurements;
- xi—Measured values;
- yi—Simulated values.
Moreover, for the later validation of the PTS tool and the comparison of the simulated data with the real experiments, the mean absolute percentage error (MAPE) generally used for the regression models was calculated according to Equation (6):
- MAPE—Mean absolute percentage error;
- n—Number of measurements;
- xi—Measured values;
- yi—Predicted values.
2.4. Creating of the Predictor of Thermal Stress Tool
Considering the complexity of the thermophysiological models and the demanding character of working with the MATLAB application, it was proposed to create a simpler computational tool, the Predictor of Thermal Stress (PTS), based on simulation calculations using the FMTK model, which would work in a commonly available application with a simple graphic user interface (GUI). MS Excel (in MS Office 365, version 2108 from 2021) was chosen as a suitable environment, which allows basic data operations, although it is not suitable for implementing more complex dynamic heat transfer models. These do require the MATLAB application.
Thus, the core of the PTS tool consists of an extensive look-up table of the simulated scenarios accomplished using the FMTK thermophysiological model, which is searchable to find the most-similar scenario according to the given input parameters. The current version of the PTS tool uses a variant with 11,664 precomputed scenarios. This is the result of combining different input parameters to cover the expected range of boundary conditions. The most emphasis was placed on ambient temperature (9 variants), metabolic heat production (6 variants), clothing types (6 variants), and work regimes (6 variants), as described in Table 2 and Table 3. Other parameters considered in the FMTK model had to be reduced to 1–3 variations, due to the potentially huge increase of the possible combinations.
Table 2.
Boundary conditions for the scenarios forming the core of the PTS tool: 11,664 scenarios in total (9 × 3 × 2 × 6 × 6 × 6 = 11,664).
Table 3.
Work regimes’ simulated scenarios.
The values of the metabolic rate M were considered in 6 variants from 1 met (lying) to 8.5 met (hard work). The work regimes were set on the basis of real situations demanding the usage of PPE with an expected work time of 83 min or 180 min in total, including the access and return from the point of action (easy access, e.g., walking straight, or difficult, e.g., walking up a hill/up stairs) and the demanded work task (short-time/long-time and/or easy, e.g., taking samples, patrolling, or hard work, e.g., carrying a heavy load, transporting a person). The work effort was based on a compendium of physical activities [31]. Scenario 6, “Intermittent activity”, corresponds to the laboratory tests performed by probands in the climatic chamber.
The clothing properties of the protective ensembles IT (total thermal insulation) and evaporative resistance (ReT) were measured using a 34-zone Newton manikin. The measured values and calculated values of the static clothing permeability index im are given in the results in Table 4 for the four types of protective ensembles, for variants with (a) light and (b) warm underwear. The defined garments including their local characteristics were entered into the FMTK model.
The FMTK model code in MATLAB was optimized for performance, i.e., all redundant functions that did not serve directly for the calculation were suppressed so the simulation time for one scenario was in the range of 20–60 s. A one-time iteration for FMTK is represented as 20 s, i.e., the number of iterations of one simulation ranged from 249–540 iterations depending on the real time length of the scenario, which was 83 min or 180 min. The entire computation of the table of 11,664 scenarios took approximately 6 days on a desktop PC (AMD Ryzen 5 3600 6-Core Processor 3.60 GHz, 32.0 GB RAM). This spreadsheet was copied into MS Excel. The FILTER function was used for searching according to the data entered by the user. The interpolation was enabled, including the created weighting system to account for the distance of the searched parameters from those recalculated in the spreadsheet. A key feature is “dynamic filtering”, which is currently available in MS Office 2019 and newer and is the main reason why the PTS tool cannot be run in older versions of MS Excel.
Only selected sheets are accessible to the user; sheets with look-up table bases or sheets with the possibility of customizing protective clothing properties or physical activity scenarios are accessible only to the PTS development team. The advantage of this approach is that the look-up table can be incrementally updated with new scenario variations, thus extending the capabilities of the prediction tool.
3. Results
3.1. Thermal Insulation Characteristics of Protective Ensembles
The thermal insulation characteristics of the individual ensembles including the corresponding underwear were measured using the 34-zone thermal manikin Newton as shown in Figure 2.
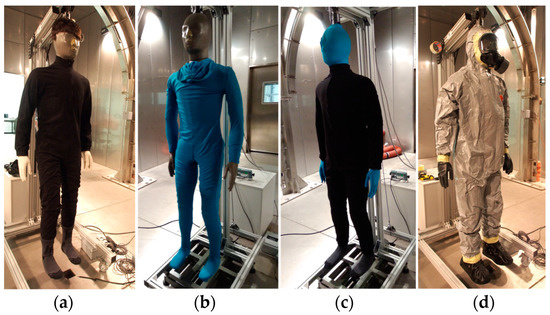
Figure 2.
Examples of measurements of the thermal insulation properties of garments using the Newton 34-zone thermal manikin: (a) measurement of local thermal insulations IT,i—manikin in cotton underwear; (b) measurement of local evaporation resistance ReT using “artificial skin” method; (c) Measurement of local evaporation resistance ReT—manikin dressed in “artificial skin” and cotton underwear; (d) measurement of local thermal insulations IT,i—manikin dressed in complete set TF + CM-6 including the cotton underwear.
The total thermal insulation of clothing IT and local thermal insulation IT,i were measured using a standard procedure according to EN ISO 15831 [26] and calculated according to Equations (1) and (2), with the results given in Table 4 and Figure 3. The evaporative resistance ReT was measured using a non-standard method based on the measurement of moisture loss from the “artificial skin” covering the entire surface of the manikin and recalculated from the measured heat loss according to Equation (3) [27]; for the results, see Table 4 and Figure 4.
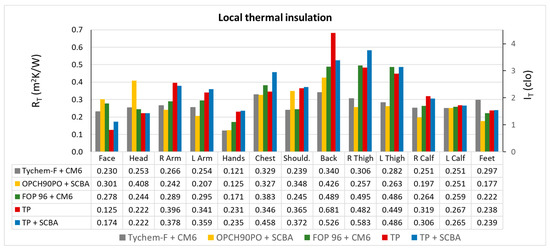
Figure 3.
Summary of the local thermal insulation IT,i values in m2·K/W or clo of the individual ensembles (variant a) using the Newton 34-zone thermal manikin.
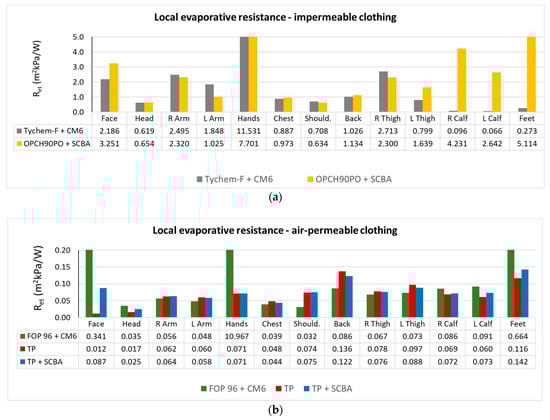
Figure 4.
Summary of local evaporative resistance ReT,i values of the individual ensembles (variant a) using the Newton 34-zone thermal manikin: (a) impermeable ensembles TF and OPCH; (b) air-permeable ensembles’ FOP with mask and firefighter suit TP (without respiratory protection or with the SCBA).
3.2. Testing of the Physiological Strain in Climatic Chamber
Thermal strain is an important limiting factor for the performance of the activity in PPE. Thermal strain was monitored by a set of more than 130 tests in the climatic chamber with human probands wearing various protective ensembles, as shown in Figure 1. Based on continuous on-line monitoring of physiological functions such as heart rate HR and body core temperature Tre, a considerable variability of the results was observed in various probands even under the same test conditions.
Heat stress management is highly individual and depends significantly on the associated body composition (here assessed by the BMI) and physical fitness (here assessed using VO2max). The individuality of the subjects was already evident at the beginning of the test, when differences between the probands regarding the initial Tre,0 were up to 1 °C (36.9 ± 0.5 °C). The different initial Tre,0 temperature and subjective perception of thermal comfort resulted in different test termination times. While some probands managed to perform the tests always until reaching the limit Tre,lim = 38.5 °C or HRlim = 220 − age, regardless of different conditions or PPE, other probands repeatedly terminated when the body core temperature reached around 38.1–38.2 °C, and the higher temperature was subjectively unbearable. The observed results of the physiologic strain tests (maximum test times and body core temperature Tre achieved under the given conditions) are summarized in Table 5.
Table 5.
Summary of the results of real tests in the climatic chamber performed by up to 12 probands at temperature Ta (°C) wearing protective ensemble TF/OPCH/FOP/TP and performing physical activity. The table summarizes the number of tests performed (n), achieved time (min), starting Tre,0 (°C) and terminal Tre,max (°C), and reasons for test termination (■ Time limit = 125 min, ■ Tre limit = 38.5 °C, ■ HR limit = 220 − age, ■ Proband´s request, ■ SCBA—out of air, ■ Technical reasons).
In many tests at 25 °C and 35 °C, probands quit on their own request before reaching the heart rate limit or body core temperature limit because of intolerable discomfort (headache, intolerable heat, back pain, breathing difficulties, etc.), as summarized in Table 5.
Obviously, for the temperatures −10 °C and 5 °C, overheating is not a demanding issue. Most of the tests were terminated due to the time limit (125 min), and in the vast majority of tests, the maximum body core temperature measured at the end of the test was below 38.2 °C. A few test cases deploying the SCBA had to be terminated due to the exhausted capacity of cylinders, even after successively using two of them, or due to other reasons (e.g., too cold, freezing hands). However, under more strenuous conditions (long-term hard work) in PPE, the apparent slow increase of the body core temperature should not be ignored.
The resulting values measured with different probands were averaged including standard deviations and compared with the simulation calculations performed using the PHS and FMTK thermophysiological models.
3.3. Validation of PHS and FMTK Thermophysiological Models
In the preliminary study [24], we compared the predictions of the body core temperature increase using two thermophysiological models, the PHS and FMTK, with the experimental data measured in a real test in the climatic chamber with one proband. The aim of the study was to investigate the applicability of the two thermophysiological models for usage even out of the validity range regarding the insulation properties of the protective clothing. The results generally showed that, for both models (PHS, FMTK), the difference between the simulated and experimental values expressed in the form of the mean absolute error (MAE) was lower than 0.5 °C for the air-permeable suit. Moreover, the FMTK model showed good predictability for impermeable suits also, with an MAE value of 0.69 °C for an ambient temperature of 30 °C and an MAE value of 0.19 °C for an ambient temperature of 40 °C. On the other hand, the PHS model showed very high MAE values, around 1.8 °C and 1.2 °C, respectively, for the prediction of the body core temperature for the impermeable suits at the two ambient temperatures tested [24].
In this follow-up study, a series of simulation calculations was performed for the selected ensembles (Tiger Plus as a representative of the air-permeable protective ensemble and Tychem-F as a representative of the impermeable protective ensemble) and for external conditions with ambient temperatures of 25 °C and 35 °C. The resulting values were then compared with the average values from real tests under the same conditions. Examples of the behavior of each prediction model are shown in Figure 5 for the air-permeable Tiger Plus and in Figure 6 for the impermeable Tychem F.
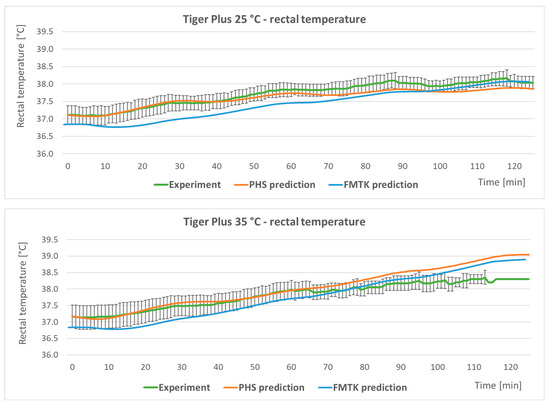
Figure 5.
Examples of the simulation calculations of the body core temperature (Tre) increase using the PHS and FMTK models compared to real tests with 12, respectively 11 probands, for the air-permeable ensemble Tiger Plus (at ambient temperatures of 25 °C and 35 °C).
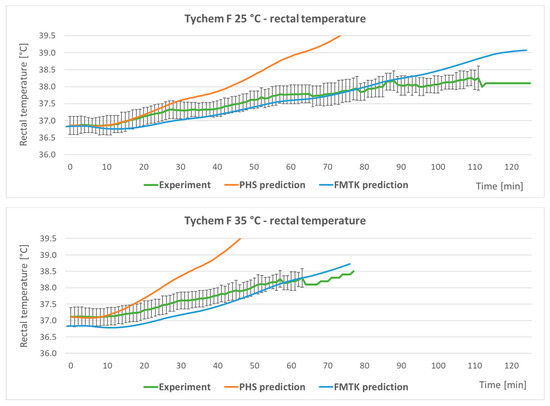
Figure 6.
Examples of simulation calculations of the body core temperature (Tre) increase using the PHS and FMTK models compared to real tests with 9 probands for the impermeable ensemble Tychem F (at ambient temperatures of 25 °C and 35 °C).
For the air-permeable Tiger plus ensemble, the PHS index was able to predict the rectal temperature more accurately than the much more complex FMTK model (Figure 5) at both ambient temperatures tested. A slight inaccuracy could be observed at an ambient temperature of 35 °C, where both models slightly overestimated the value of the rectal temperature in comparison with the experiments.
For the impermeable Tychem F ensemble, the PHS index predicted unrealistic values of the body core temperature increase, as demonstrated in Figure 6, compared to the experimental data and also compared to the FMTK model prediction. The PHS index predicted a much faster increase of the body core temperature Tre than the probands achieved in reality under the given conditions. After comparing both models, the PHS and FMTK, the prediction performed by the FMTK model showed much better agreement with the experimental data for both temperatures for the impermeable ensemble.
The calculated MAEs values for each type of protective ensemble and for both ambient temperatures are shown in Figure 7. The value of the MAE for the air-permeable ensemble Tiger Plus was lower than 0.4 °C for both ambient temperatures. In addition, the PHS model showed an even lower value of MAE compared to the FMTK model results. On the other hand, the FMTK model showed a good predictability of rectal temperature for the impermeable ensemble Tychem F, where the MAE value for both temperatures was lower than 0.4 °C, whereas the PHS model for this type of garment showed an MAE value many times higher. The MAE value was approximately 1.6 °C at an ambient temperature of 25 °C and approximately 1.4 °C at an ambient temperature of 35 °C.
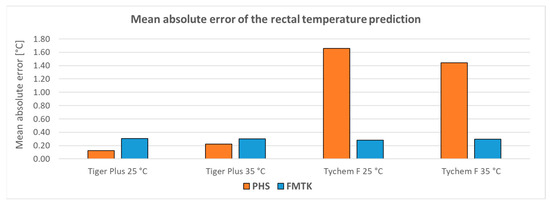
Figure 7.
Mean absolute error (MAE) of the rectal temperature prediction using the PHS and FMTK models on the air-permeable and impermeable protective ensembles.
The results were consistent with the results of the preliminary study [24].
Based on the outcome of these results, we were able to create an easy-to-use computational tool, the Predictor of Thermal Stress, based on the simulation calculations using the more suitable FMTK model.
3.4. Creating of Predictor of Thermal Stress Tool
Due to the complexity and difficulty of using the FMTK thermophysiological model, a simpler and more user-friendly computational PTS tool was developed. The core of the PTS computational tool is based on an extensive set of look-up tables created from simulations of 11,664 scenario variants calculated using the FMTK model. The scenarios include different variants of PPE, climatic conditions, work regimes, and activities, as described in Table 2 and Table 3. The prediction accuracy of the PTS tool is related to the number of scenarios precomputed. In developing and building the look-up table, it was initially tested with 1920 scenarios, next with 5184, then with 11,664, and finally, with 37,908. After due consideration, the version with 11,664 scenarios was adopted.
The user interface of the PTS tool is shown in Figure 8.
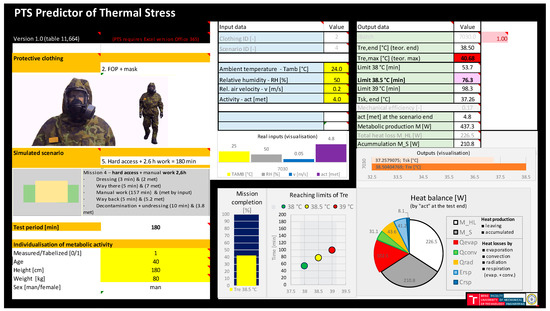
Figure 8.
Predictor of Thermal Stress (PTS) tool–user interface.
Once all the required input data fields have been selected/entered on the input screen, the PTS tool selects the most-similar combination from the precalculated inputs stored in the locked sheet, and the results are calculated and displayed.
The input parameters include six protective ensemble variants; see Figure 9a. The input climatic conditions cover a range of ambient temperatures from 5 °C to 45 °C, taking into account relative humidity and wind speed (0.05–2.4 m/s). The presumed metabolic activity of the person performing the activity is an essential input; see Figure 9b. The metabolic activity (0–8.5 met) can be entered as “measured” in the case when it is possible to measure directly the energy expenditure using an O2/CO2 analyzer during the tests or other monitoring device or “tabulated”, which can be selected from the listing of described activities in met units provided in a separate additional data sheet [31].
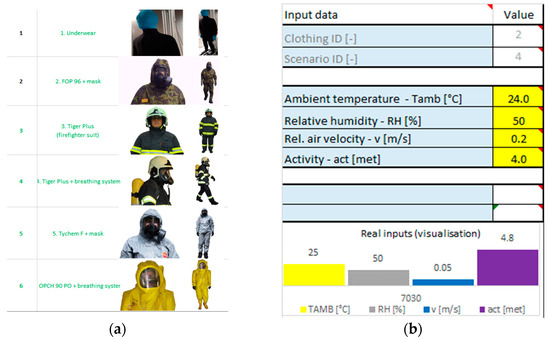
Figure 9.
(a) Offer of the PPE ensembles. (b) For the combination entered in Figure 8, the input parameters are a 24 °C ambient temperature, 50% RH, an air velocity of 0.2 m/s, and the expected work intensity activity 4 met corresponding to light-medium manual work or walking with a load of up to 10 kg. For the given individual (40 years, 180 cm and 80 kg), the entered “tabulated” metabolic activity 4.0 met was converted into a “corrected activity” of 4.5 met, corresponding better to the given person. The closest activity value in the precalculated table is 4.8 met; therefore, the value of 4.8 met was used for the following search, as indicated in the purple column in the real inputs (control) field. The entered ambient temperature 24 °C was corrected to 25 °C as the nearest temperature covered in the look-up tables.
Based on the individual person parameters such as height (151–200 cm), weight (25–124.9 kg), age (21–70), and sex (male/female), the PTS tool recalculates the entered “Activity” in met units into individualized “Corrected Activity” in met, which is then used for searching in the look-up tables.
The PTS tool has precalculated data for particular input values. When any value within the range is entered, the value is used to find the nearest value in the precalculated table. This retrieved value is displayed in the real inputs (control) graphical interface; see Figure 9b. If out-of-range values are entered, all values are displayed as 0-0-0-0 or a “Divide by zero” message is shown in the GUI.
For advanced users, it is possible to set the interpolation between the closest points in the table in the worksheet, making the PTS prediction tool behave like a continuous model. If interpolation is turned on, the desired values are calculated based on a weighted average of the closest scenarios found; typically, this can be the 4–10 closest scenarios. The closer the pre-calculated scenario is to the input, the higher the weight attributed is. If interpolation is turned off, the entered values are taken directly as the closest to the input values described in Table 2.
The result of the database search is a table of output data, which shows the value of the allowable work time limit in minutes, i.e., the maximum permissible load time under the given conditions until the body core temperature Tre reaches 38.5 °C. In addition, the estimated time to achieve rectal temperatures of 38 °C and 39 °C is given also, as demonstrated in Figure 10a. The output value of the body core temperature, Tre,end, is the temperature reached at the end of the activity (maximum 38.5 °C) and Tre,max is a theoretical value of the body core temperature that would be reached if the worker completed the specified activity (according to the selected Work regime) until the planned end. The estimated skin temperature, Tsk,end, at the end of the activity is also provided. Based on the entered work effort in met in the selected work regime, the mechanical efficiency (percentage of energy converted to mechanical work) is assigned based on the FMTK simulation calculation in the look-up table as a base for the calculation of metabolic production (W).
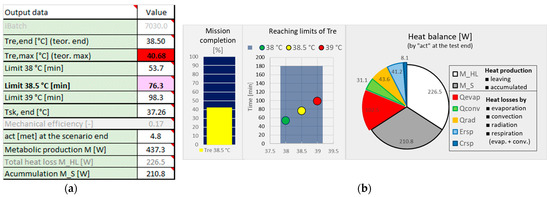
Figure 10.
(a) Output values Tre,end (°C) (end of activity, maximum 38.5 °C), Tre,max (°C) (theoretical maximum at the end of planned activity according to selected work regime, limits of 38 °C (min), 38.5 °C, or 39 °C, respectively, and Tsk,end (°C) skin temperature at the end of the activity. (b) Graphical image of Mission Completion, Reaching Limits of Tre, and heat balance.
The selected output data are also displayed graphically in the Mission Completion, Reaching Limits Tre and Heat Balance fields, as shown in Figure 10b. The Mission Completion represents the % of planned time of the selected work regime (83 min or 180 min regarding to the selected scenario presented in Table 3). If the estimated body core temperature limit Tre of 38.5 °C is reached before the end of the planned activity, the Mission Completion (%) value will be lower than 100%. The Reaching Limits of Tre is the graphical form of the estimated time (min) to reach body core temperature Tre values of 38 °C, 38.5 °C, and 39 °C. It is to be borne in mind that the tests were terminated on average at 38.2 °C (see Table 5), so it is appropriate to consider the risk of thermal stress from the limit of 38 °C onwards. In reality, this value can vary by up to ±0.3 °C between individuals. The subjective perception of each individual must be taken into account; many users find a body core temperature of 38.3 °C unbearable, while others are willing to endure even above the Tre or HR limits. Therefore, the above estimation of the permissible working time should be taken with a margin of ±12–25 min (obtained from the results summarized in Table 5).
Based on the predicted metabolic production M (W) at the end of the test, the graphical pie chart represents the estimated heat balance (see Figure 10b)—an overview of the heat loss (M_HL), i.e., heat dissipation by evaporation + convection + radiation + respiration, and heat accumulation in the body (M_S), where M_HL = Qevap + Qconv + Qrad + Ersp + Crsp and heat accumulation M_S = M − M_HL.
3.5. Validation of the PTS Tool Using Real Tests in Climatic Chamber
Based on the results of the real tests in the climatic chamber and the statistical processing of the data, validation data for the PTS were prepared. The main aim of the validation was to compare the predictions of permissible work time with the real mean values of the maximum time achieved by several probands in the laboratory test in the climatic chamber under the given conditions (ambient temperature 25 °C and 35 °C, relative humidity 20–30%, corresponding to the real tests, given protective suits). It is important to remember that the tests could be terminated at Tre temperatures lower than 38.5 °C, either due to achieving the test limit of 125 min, reaching HRlim, or upon subjective request due to nausea, headache, unbearable discomfort etc. For this reason, the average value of the experimentally measured body core temperature at the end of the test was determined to be approximately 38.2 °C for the cases mentioned (25 °C and 35 °C). This value was then used to verify the look-up table. The values of the maximum achieved time in the tests (average value and standard deviation) are summarized in Table 5 and in the chart in Figure 11 (green columns).
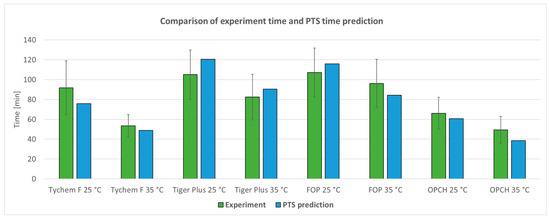
Figure 11.
Comparison of the results of the real tests (maximum time (min) achieved in the tests, average from all the tests performed under the same conditions with up to 12 probands as described in Table 5—green column with black error lines), and the PTS prediction values (time (min) when an “average” person reaches the “average” maximum body core temperature Tre measured in the corresponding set of real tests—blue column).
For the PTS tool’s verification purposes, the average value of the input data (each proband’s weight, height, age) was used to recalculate the tabulated metabolic activity or calculated metabolic activity for each real test and entered into the PTS tool. Work Regime 6 was selected (intermittent activity–20 min work + 10 min rest, 180 min in total), which most corresponds to the laboratory tests. The ambient temperature of 25 °C or 35 °C and the selected protective ensembles were gradually entered. The PTS was set to interpolation mode. Since the model indicates reaching the 38 °C, 38.5 °C, and 39 °C limits, a linear interpolation between these limits allowed the PTS to determine the time limit for reaching the body core temperature, Tre, achieved in the corresponding set of tests on average. The results of interpolation are shown in the chart in Figure 11 (blue columns).
The comparison of the real experiments with the PTS prediction showed a relatively good match; see Figure 11. It can be seen that the time limits predicted by the PTS for all suits were in agreement with the experimental results (the values of the predicted limiting time lie within an error bar representing the standard deviation of the experimental data). The prediction accuracy given by the PTS tool can also be expressed by calculating an MAE of 10.1 min or a MAPE of 12.6%.
A similar comparison for the Tiger Plus with SCBA ensemble was performed. However, during the real tests, as many as 30–50% of the tests were terminated because of air exhaustion from both cylinders of the SCBA and not due to reaching the Tre, HRlim, or because of the proband’s request (see Table 5), and also, the PTS predictions did not show a good agreement with the real data. The PTS tool overestimated the predicted time limit for an ambient temperature of 25 °C and underestimated the predicted time limit for 35 °C. In addition, the predicted values of the permissible work time did not lie within the range of standard deviations of the experimental data measured. For this reason, the validation of this type of protective ensemble is not covered in the summary in Figure 11 and must be validated in the future with differently arranged real tests.
For future prospects, more tests have to be conducted to validate the PTS tool for the same PPE ensembles under various conditions (particularly under higher relative humidity), as well as with further PPE ensembles with different clothing properties.
4. Discussion and Conclusions
When carrying out an activity in PPE, it is necessary to be aware of the risk of a person overheating associated with risk of heat stress development.
It has been demonstrated that the essential parameter of the protective ensembles that influences the occurrence and increase of heat strain is the static clothing permeability index im, according to which protective clothing can be divided into “air-permeable” (im 0.3–0.4) and “impermeable” (im ≤ 0.1). The difference between the two groups of protective clothing in terms of the risk of inducing heat strain can be dozens of minutes in the maximum acceptable working time under the same conditions. As a precaution against excessive heat load, an estimation of the permissible working time in PPE can be made based on simulation calculations using thermophysiological models. For “air-permeable” ensembles, both tested thermophysiological models—the simpler PHS and the computationally demanding FMTK—are applicable. Based on the results, the Tiger Plus garment representing air-permeable protective clothing showed a very low MAE value of less than 0.4 °C for both models tested (PHS, FMTK). However, for “impermeable” protective ensembles represented by the Tychem F, only the FMTK model is applicable, as the PHS model overestimated the results. The MAE value of the PHS prediction for the Tychem F impermeable ensemble was approximately 1.6 °C. For this reason, the FMTK model was selected to build the PTS tool.
However, the direct use of the FMTK model is not suitable for the practical use of the usual PPE users for rapid estimation of the situation, as this model working in Matlab or its Matlab Compiler Runtime (MCR) application requires the input of the detailed insulation properties of the ensembles and other input data. The main difficulty of using the FMTK model directly lies in prescribing the local thermal and evaporative resistances to each part and sector, and subsequent calculations would take dozens of minutes.
To provide an interactive platform without any time delay for operating the thermophysiological model, the Predictor of Thermal Stress (PTS) tool was developed based on data from precalculated scenarios using the FMTK model for four selected types of protective clothing, especially under the conditions of higher metabolic heat production (high load) and higher temperatures. These scenarios were defined to match conditions during real interventions.
The output values of the PTS tool include an estimate of the time when the specified user wearing the selected protective ensemble reaches the internal temperatures of 38 °C, 38.5 °C, and 39 °C under the given conditions. Depending on the work scenario selected (short variant 83 min, respectively long variant 180 min in total) the estimation of: “Mission completion” (in % of planned time) is displayed, as well as the predicted body core temperature Tre value in case the whole selected work scenario would be finished.
When using the PTS tool, it is important to be aware that, for many people, the 38.5 °C threshold may be already beyond the point of intolerable subjective thermal discomfort and many PPE users would have to quit the activity earlier. Thus, for a more sensitive risk assessment, it is appropriate to set the limit when 38.1–38.2 °C is reached, as many people may experience problems after exceeding this limit. This Tre limit is within the range of general recommendation of measures against excessive heat strain by ACGIH regarding the body core temperature of 38.0 °C for unselected unacclimatised workers and 38.5 for medically selected and acclimatized personnel [32]. In similar studies on work in PPE in hot environments, comparable maximum body core temperatures above 38 °C [9], 38.1 °C [33], 38.2 °C [34], 38.4 °C [35], or even up to 39.9 °C [36] were observed in the real work environment. For extreme situations, the PTS tool presents a limit of Tre = 39 °C also, which is completely unbearable for most PPE users and can even be considered as a highly health-threatening condition.
Acclimation to a hot environment may be induced by regular training under hot conditions to increase the endurance against thermal exhaustion [37]. However, it should be remembered that the main purpose of the PPE covered in this study was to provide protection against hazardous environment to experts in the chemical field and/or biological field, medical staff, investigators, decontamination team members, and many others. Therefore, for many of them, one can hardly expect excellent fitness comparable to sportsmen with regular training, and the estimation should regard the “normal” fitness level of the occasional users of this type of PPE.
The estimated values of reaching Tre 38.0 °C and 38.5 °C are of great interest to give an idea of the risks of heat stress, especially when planning strenuous activity in impermeable clothing under relatively undemanding climatic conditions or, conversely, planning long-term physically less-demanding activity in air-permeable protective ensembles under climatically demanding conditions. It is important to keep in mind not only the external climatic conditions and the thermal insulating properties of the garments, but also, especially, the physical demands of the planned activity, as these play an essential role in heat stress development. The risk of heat stress can vary many times between physically less-demanding activities (slow walking, patrolling, etc.) and more-demanding ones (walking uphill or stairs, running, walking on difficult terrain, working with heavy tools, carrying a load or a victim, etc.) even for the same person under the same conditions (external temperature, type of PPE).
The PTS tool was validated by real tests in a climatic chamber with a group of probands under various defined conditions. The results of the comparison between the real average time and the predicted time using the PTS tool can be expressed in the form of a MAPE value of 12.6%. The source of inaccuracies in the validation calculations comparing the real tests and PTS predictions is undoubtedly the input of inaccurate (calculated) metabolic activity. In real tests of thermal strain in the climatic chamber, metabolic output was calculated for each test indirectly from the VO2max, HR increase, and other individual proband parameters, because it was not possible to directly measure the energy expenditure using an O2/CO2 analyzer during the tests and apply the appropriate respiratory protection to the given protective ensemble at the same time. Moreover, the PTS tool applies interpolation between a few strict input values of the metabolic activity. Besides, the cause of deviations in the validation calculations was also due to some differences in the initial body core temperature Tre of the individual probands; see Table 5. However, the simulation calculations using the FMTK model, which are the basis for the look-up tables, were always performed for a default initial Tre of 36.9 °C, although in real tests, the initial Tre temperatures of the different probands ranged from 36.0 to 37.5 °C. In this context, it should be taken into account that the PTS tool may slightly underestimate the risk of overheating if the initial internal body temperature at the start of the activity is in reality higher.
The recommended range use of the PTS tool is 5–45 °C, although 45 °C may seem excessively high in many cases. However, in the context of increasingly significant climate change, temperatures of around 40 °C are not uncommon even in the formerly temperate climates of Europe in summer. Higher temperatures may also be encountered by first responders due to radiation from hot parts of buildings or roads or if they are responding directly to the scene of a fire, where temperatures may again rise even higher than 45 °C. However, currently, the PTS tool does not take into account the effect of solar radiation intensity, as it is difficult to define simple boundary conditions for simulation calculations using the FMTK model. Therefore, in the case of working in direct sunlight, it would be possible to enter into the PTS tool the temperature that would be measured by a thermometer exposed to solar radiation, which may again be even higher than the 45 °C mentioned above.
Due to the considerable individual differences between various probands, it is difficult or even impossible to create an entirely reliable prediction model working with individualized parameters and accurate conditions. For this reason, the PTS tool was designed as a supportive tool that is able to predict the risk in any intervention scenario in advance. The PTS tool is not intended to work with real-time data from sensors (e.g., heart rate); rather, the PTS tool is designed (a) to warn about the level of risk inherent in the required type of protective clothing under the specific conditions and work load and (b) predict what an average person would be able to withstand. The factor of subjective discomfort must always be taken into account, as in a state of discomfort, the worker cannot concentrate fully on the work, where there is an increased risk of errors and possibly accidents. For this reason, it is always precarious to predict the allowable work time limit just on the basis of tables, thermal indices, or even complex thermoregulation models focused on ambient climatic conditions and clothing characteristics. The prediction tools should be taken just as an informative recommendation.
Upcoming research intends to focus on the future use of PTS in firefighter training and education, where physiological parameters would be monitored during practical training in PPE to assess the thermal strain, including the evaluation of the subjective perception of heat load and comparison with the PTS prediction. This would result in both controlled monitoring of emerging signs of overheating perceived by the trainees and individual assessment of prediction using the PTS tool.
The PTS tool can be used in particular as a basis for preventive measures when planning activities in PPE, not only for time-consuming activities (all-day interventions in PPE) requiring the sufficient rotation of persons and shifts or the planning of safety breaks, but also when scheduling exercises/training or field training in PPE, especially for situations where tough climatic conditions can be expected.
Author Contributions
Conceptualization, K.L., B.Ř.K., J.P. and J.F.; methodology, K.L., M.M., D.K., V.F., B.Ř.K., J.P. and J.F.; software, J.P.; validation, K.L., B.Ř.K. and J.P.; investigation, K.L., B.Ř.K. and J.P.; resources, M.M., D.K., V.F., J.P. and J.F.; writing—original draft preparation, K.L., B.Ř.K. and J.P.; writing—review and editing, K.L., B.Ř.K., M.M., J.P. and J.F.; visualization, K.L., B.Ř.K. and J.P.; project administration, K.L. and J.F.; funding acquisition, K.L. All authors have read and agreed to the published version of the manuscript.
Funding
This research was funded by the Ministry of the Interior of the Czech Republic, Safety Research Programme 2016–2021 (BV III/2-VZ), Project number VH20182021036 and Brno University of Technology Project FSI-S-23-8192.
Institutional Review Board Statement
The study was conducted in accordance with the Declaration of Helsinki and approved by the Institutional Review Board of National Institute for NBC Protection (Ethic codex of National Institute for NBC Protection in research and innovations, v02, 20 April 2018).
Informed Consent Statement
Informed consent was obtained from all subjects involved in the study.
Data Availability Statement
Data is contained within the article. The data presented in this study are available on request from the corresponding author.
Acknowledgments
The authors thank all probands for their kind cooperation during the tests.
Conflicts of Interest
The authors declare no conflict of interest. The funders had no role in the design of the study; in the collection, analyses, or interpretation of the data; in the writing of the manuscript; nor in the decision to publish the results.
References
- Ghiyasa, S.; Nabizadeh, H.; Jazari, M.; Soltanzadeh, A.; Heidari, H.; Fardi, A.; Movahed, E. The Effect of Personal Protective Equipment on Thermal Stress: An Experimental Study on Firefighters. Work 2020, 67, 141–147. [Google Scholar] [CrossRef] [PubMed]
- Davey, S.L.; Lee, B.J.; Robbins, T.; Randeva, H.; Thake, C.D. Heat Stress and PPE during COVID-19: Impact on Healthcare Workers’ Performance, Safety and Well-Being in NHS Settings. J. Hosp. Infect. 2020, 108, 185–188. [Google Scholar] [CrossRef] [PubMed]
- Zhao, Y.; Liu, J.; Kim, M.K.; Zhou, S.; Du, Y. Experimental Investigation on Thermal Comfort of COVID-19 Nucleic Acid Sampling Staff in Hot and Humid Environment: A Pilot Study of University Students. Appl. Sci. 2021, 11, 11492. [Google Scholar] [CrossRef]
- Goldman, R.F. Heat Stress in Industrial Protective Encapsulating Garments. In Protecting Personnel at Hazardous Waste Sites; Elsevier: Amsterdam, The Netherlands, 2000; pp. 295–355. [Google Scholar] [CrossRef]
- Havenith, G.; den Hartog, E.; Martini, S. Heat Stress in Chemical Protective Clothing: Porosity and Vapour Resistance. Ergonomics 2011, 54, 497–507. [Google Scholar] [CrossRef] [PubMed]
- Morrisey, M.; Wang, F. Air and water perfusion-based cooling systems (PCSs) to protect against heat stress in protective clothing. In Protective Clothing: Managing Thermal Stress, 1st ed.; Wang, F., Gao, C., Eds.; Woodhead Publishing: Sawston, UK, 2014; Chapter 12; pp. 296–315. [Google Scholar]
- Gao, C. Phase-change material (PCMs) for warming or cooling in protective clothing. In Protective Clothing: Managing Thermal Stress, 1st ed.; Wang, F., Gao, C., Eds.; Woodhead Publishing: Sawston, UK, 2014; Chapter 9; pp. 227–248. [Google Scholar]
- Kim, E. Shape-memory alloys (SMAs) for warming or cooling in protective clothing. In Protective Clothing: Managing Thermal Stress, 1st ed.; Wang, F., Gao, C., Eds.; Woodhead Publishing: Sawston, UK, 2014; Chapter 10; pp. 250–280. [Google Scholar]
- Kuklane, K.; Toma, R.; Lucas, R.A.I. Insulation and Evaporative Resistance of Clothing for Sugarcane Harvesters and Chemical Sprayers, and Their Application in PHS Model-Based Exposure Predictions. Int. J. Environ. Res. Public Health 2020, 17, 3074. [Google Scholar] [CrossRef]
- Havenith, G.; Fiala, D. Thermal Indices and Thermophysiological Modeling for Heat Stress. Compr. Physiol. 2016, 6, 255–302. [Google Scholar] [CrossRef]
- Pennes, H.H. Analysis of Tissue and Arterial Blood Temperatures in the Resting Human Forearm. J. Appl. Physiol. 1948, 1, 93–122. [Google Scholar] [CrossRef]
- Wissler, E.H. A Mathematical Model of the Human Thermal System. Bull. Math. Biophys. 1964, 26, 147–166. [Google Scholar] [CrossRef]
- Stolwijk, J.A.J. A Mathematical Model of Physiological Temperature Regulation in Man; NASA: Washington, DC, USA, 1971.
- Gagge, A.P.; Fobelets, A.P.; Berglund, L.G. A Standard Predictive Index of Human Response to the Thermal Environment. ASHRAE Trans. 1986, 92, 709–731. [Google Scholar]
- Fiala, D. Dynamic Simulation of Human Heat Transfer and Thermal Comfort. Ph.D. Thesis, De Montfort University, Leicester, UK, 1998. [Google Scholar]
- Fiala, D.; Lomas, K.J.; Stoher, M. A Computer Model of Human Thermoregulation for a Wide Range of Environmental Conditions: The Passive System. J. Appl. Physiol. 1999, 87, 1957–1972. [Google Scholar] [CrossRef]
- Schellen, L.; Loomans, M.G.L.C.; Kingma, B.R.M.; de Wit, M.H.; Frijns, A.J.H.; van Marken Lichtenbelt, W.D. The Use of a Thermophysiological Model in the Built Environment to Predict Thermal Sensation. Build. Environ. 2013, 59, 10–22. [Google Scholar] [CrossRef]
- Katić, K.; Li, R.; Zeiler, W. Thermophysiological Models and Their Applications: A Review. Build. Environ. 2016, 106, 286–300. [Google Scholar] [CrossRef]
- EN ISO 7933:2004; Ergonomics of the Thermal Environment—Analytical Determination and Interpretation of Heat Stress Using Calculation of the Predicted Heat Strain. International Organization for Standardization: Geneva, Switzerland, 2004.
- Pokorný, J.; Fišer, J.; Fojtlín, M.; Kopečková, B.; Toma, R.; Slabotínský, J.; Jícha, M. Verification of Fiala-Based Human Thermophysiological Model and Its Application to Protective Clothing under High Metabolic Rates. Build. Environ. 2017, 126, 13–26. [Google Scholar] [CrossRef]
- Psikuta, A.; Fiala, D.; Laschewski, G.; Jendritzky, G.; Richards, M.; Błażejczyk, K.; Mekjavič, I.; Rintamäki, H.; de Dear, R.; Havenith, G. Validation of the Fiala Multi-Node Thermophysiological Model for UTCI Application. Int. J. Biometeorol. 2012, 56, 443–460. [Google Scholar] [CrossRef]
- Martínez, N.; Psikuta, A.; Kuklane, K.; Quesada, J.I.P.; de Anda, R.M.C.O.; Soriano, P.P.; Palmer, R.S.; Corberán, J.M.; Rossi, R.M.; Annaheim, S. Validation of the Thermophysiological Model by Fiala for Prediction of Local Skin Temperatures. Int. J. Biometeorol. 2016, 60, 1969–1982. [Google Scholar] [CrossRef]
- Bröde, P.; Fiala, D.; Błażejczyk, K.; Holmér, I.; Jendritzky, G.; Kampmann, B.; Tinz, B.; Havenith, G. Deriving the Operational Procedure for the Universal Thermal Climate Index (UTCI). Int. J. Biometeorol. 2012, 56, 481–494. [Google Scholar] [CrossRef]
- Kopeckova, B.; Pokorny, J.; Lunerova, K.; Fiser, J.; Jicha, M. Case Study Comparing Fiala-Based Thermophysiological Model and PHS Index with Experimental Data to Predict Heat Strain in Normal and Protective Clothing. J. Meas. Eng. 2021, 9, 36–47. [Google Scholar] [CrossRef]
- Potter, A.W.; Looney, D.P.; Santee, W.R.; Gonzalez, J.A.; Welles, A.P.; Srinivasan, S.; Castellani, M.P.; Rioux, T.P.; Hansen, E.O.; Xu, X. Validation of New Method for Predicting Human Skin Temperatures during Cold Exposure: The Cold Weather Ensemble Decision Aid (CoWEDA). Inf. Med. Unlocked 2020, 18, 100301. [Google Scholar] [CrossRef]
- EN ISO 15831:2004; Clothing—Physiological Effects—Measurement of Thermal Insulation by Means of a Thermal Manikin. International Organization for Standardization: Geneva, Switzerland, 2004.
- Toma, R.; Kuklane, K.; Fojtlín, M.; Fišer, J.; Jícha, M. Using a Thermal Manikin to Determine Evaporative Resistance and Thermal Insulation—A Comparison of Methods. J. Ind. Text. 2021, 50, 1493–1515. [Google Scholar] [CrossRef]
- ISO 9920:2007; Ergonomics of the Thermal Environment—Estimation of Thermal Insulation and Water Vapour Resistance of a Clothing Ensemble. International Organization for Standardization: Geneva, Switzerland, 2007.
- Fojtlín, M.; Fišer, J.; Jícha, M. Determination of Convective and Radiative Heat Transfer Coefficients using 34-zones Thermal Manikin: Uncertainty and Reproducibility Evaluation. Exp. Fluid Sci. 2016, 77, 257–264. [Google Scholar] [CrossRef]
- Malchaire, J.; Piette, A.; Kampmann, B.; Mehnert, P.; Gebhardt, H.; Havenith, G.; Den Hartog, E.; Holmer, I.; Parsons, K.; Alfano, G.; et al. Development and Validation of the Predicted Heat Strain Model. Ann. Occup. Hyg. 2001, 45, 123–135. [Google Scholar] [CrossRef] [PubMed]
- Ainsworth, B.E.; Haskell, W.L.; Herrmann, S.D.; Meckes, N.; Bassett, D.R.; Tudor-Locke, C.; Greer, J.L.; Vezina, J.; Whitt-Glover, M.C.; Leon, A.S. 2011 Compendium of Physical Activities. Med. Sci. Sport. Exerc. 2011, 43, 1575–1581. [Google Scholar] [CrossRef] [PubMed]
- Threshold Limit Values (TLVs®); Biological Exposure Indices (BEIs®). American Conference of Governmental Industrial Hygienists; ACGIH: Cincinnati, OH, USA, 2017. [Google Scholar]
- O’Brien, C.; Blanchard, L.A.; Cadarette, B.S.; Endrusick, T.L.; Xu, X.; Berglund, L.G.; Sawka, M.N.; Hoyt, R.W. Methods for Evaluating Protective Clothing Relative to Heat and Cold Stress: Thermal Manikin, Biomedical Modeling and Human Testing. J. Occup. Environ. Hyg. 2011, 8, 588–599. [Google Scholar] [CrossRef]
- Miller, V.S.; Bates, G.P. The Thermal Work limit is a Simple Reliable Heat Index for the Protection of Workers in Thermally Stressful Environments. J. Occup. Environ. Hyg. 2021, 18, 430–435. [Google Scholar] [CrossRef]
- Flouris, A.D.; Ioannou, L.G.; Dinas, P.C.; Mantzios, K.; Gkiata, P.; Gkikas, G.; Vliora, M.; Amorim, T.; Tsoutsoubi, L.; Kapnia, A. Assessment of Occupational Heat Stain and Mitigation Strategies in Qatar; Report No. FL/2019/13; International Labour Organization: Doha, Qatar, 2019. [Google Scholar]
- Herstein, J.J.; Abdoulaye, A.A.; Jelden, K.C.; Le, A.B.; Beam, E.L.; Gibbs, S.G.; Hewlett, A.L.; Vasa, A.; Boulter, K.C.; Stentz, T.L.; et al. A pilot study of Core Body Temperatures in Health Workers Wearing Personal Protective Equipment in High-level Isolation Unit. Occup. Environ. Hyg. 2021, 18, 430–435. [Google Scholar] [CrossRef]
- Nielsen, B.; Hales, J.R.S.; Strange, S.; Christensen, N.J.; Warberg, J.; Saltin, B. Human Circulatory and Thermoregulatory Adaptations with Heat Acclimation and Exercise in a Hot, Dry Environment. J. Physiol. 1993, 460, 467–485. [Google Scholar] [CrossRef]


Disclaimer/Publisher’s Note: The statements, opinions and data contained in all publications are solely those of the individual author(s) and contributor(s) and not of MDPI and/or the editor(s). MDPI and/or the editor(s) disclaim responsibility for any injury to people or property resulting from any ideas, methods, instructions or products referred to in the content. |
© 2023 by the authors. Licensee MDPI, Basel, Switzerland. This article is an open access article distributed under the terms and conditions of the Creative Commons Attribution (CC BY) license (https://creativecommons.org/licenses/by/4.0/).