
GRU Neural Network Based on CEEMDAN–Wavelet for Stock Price Prediction


Abstract
1. Introduction
2. Preliminaries
2.1. Related Work
2.2. RNN
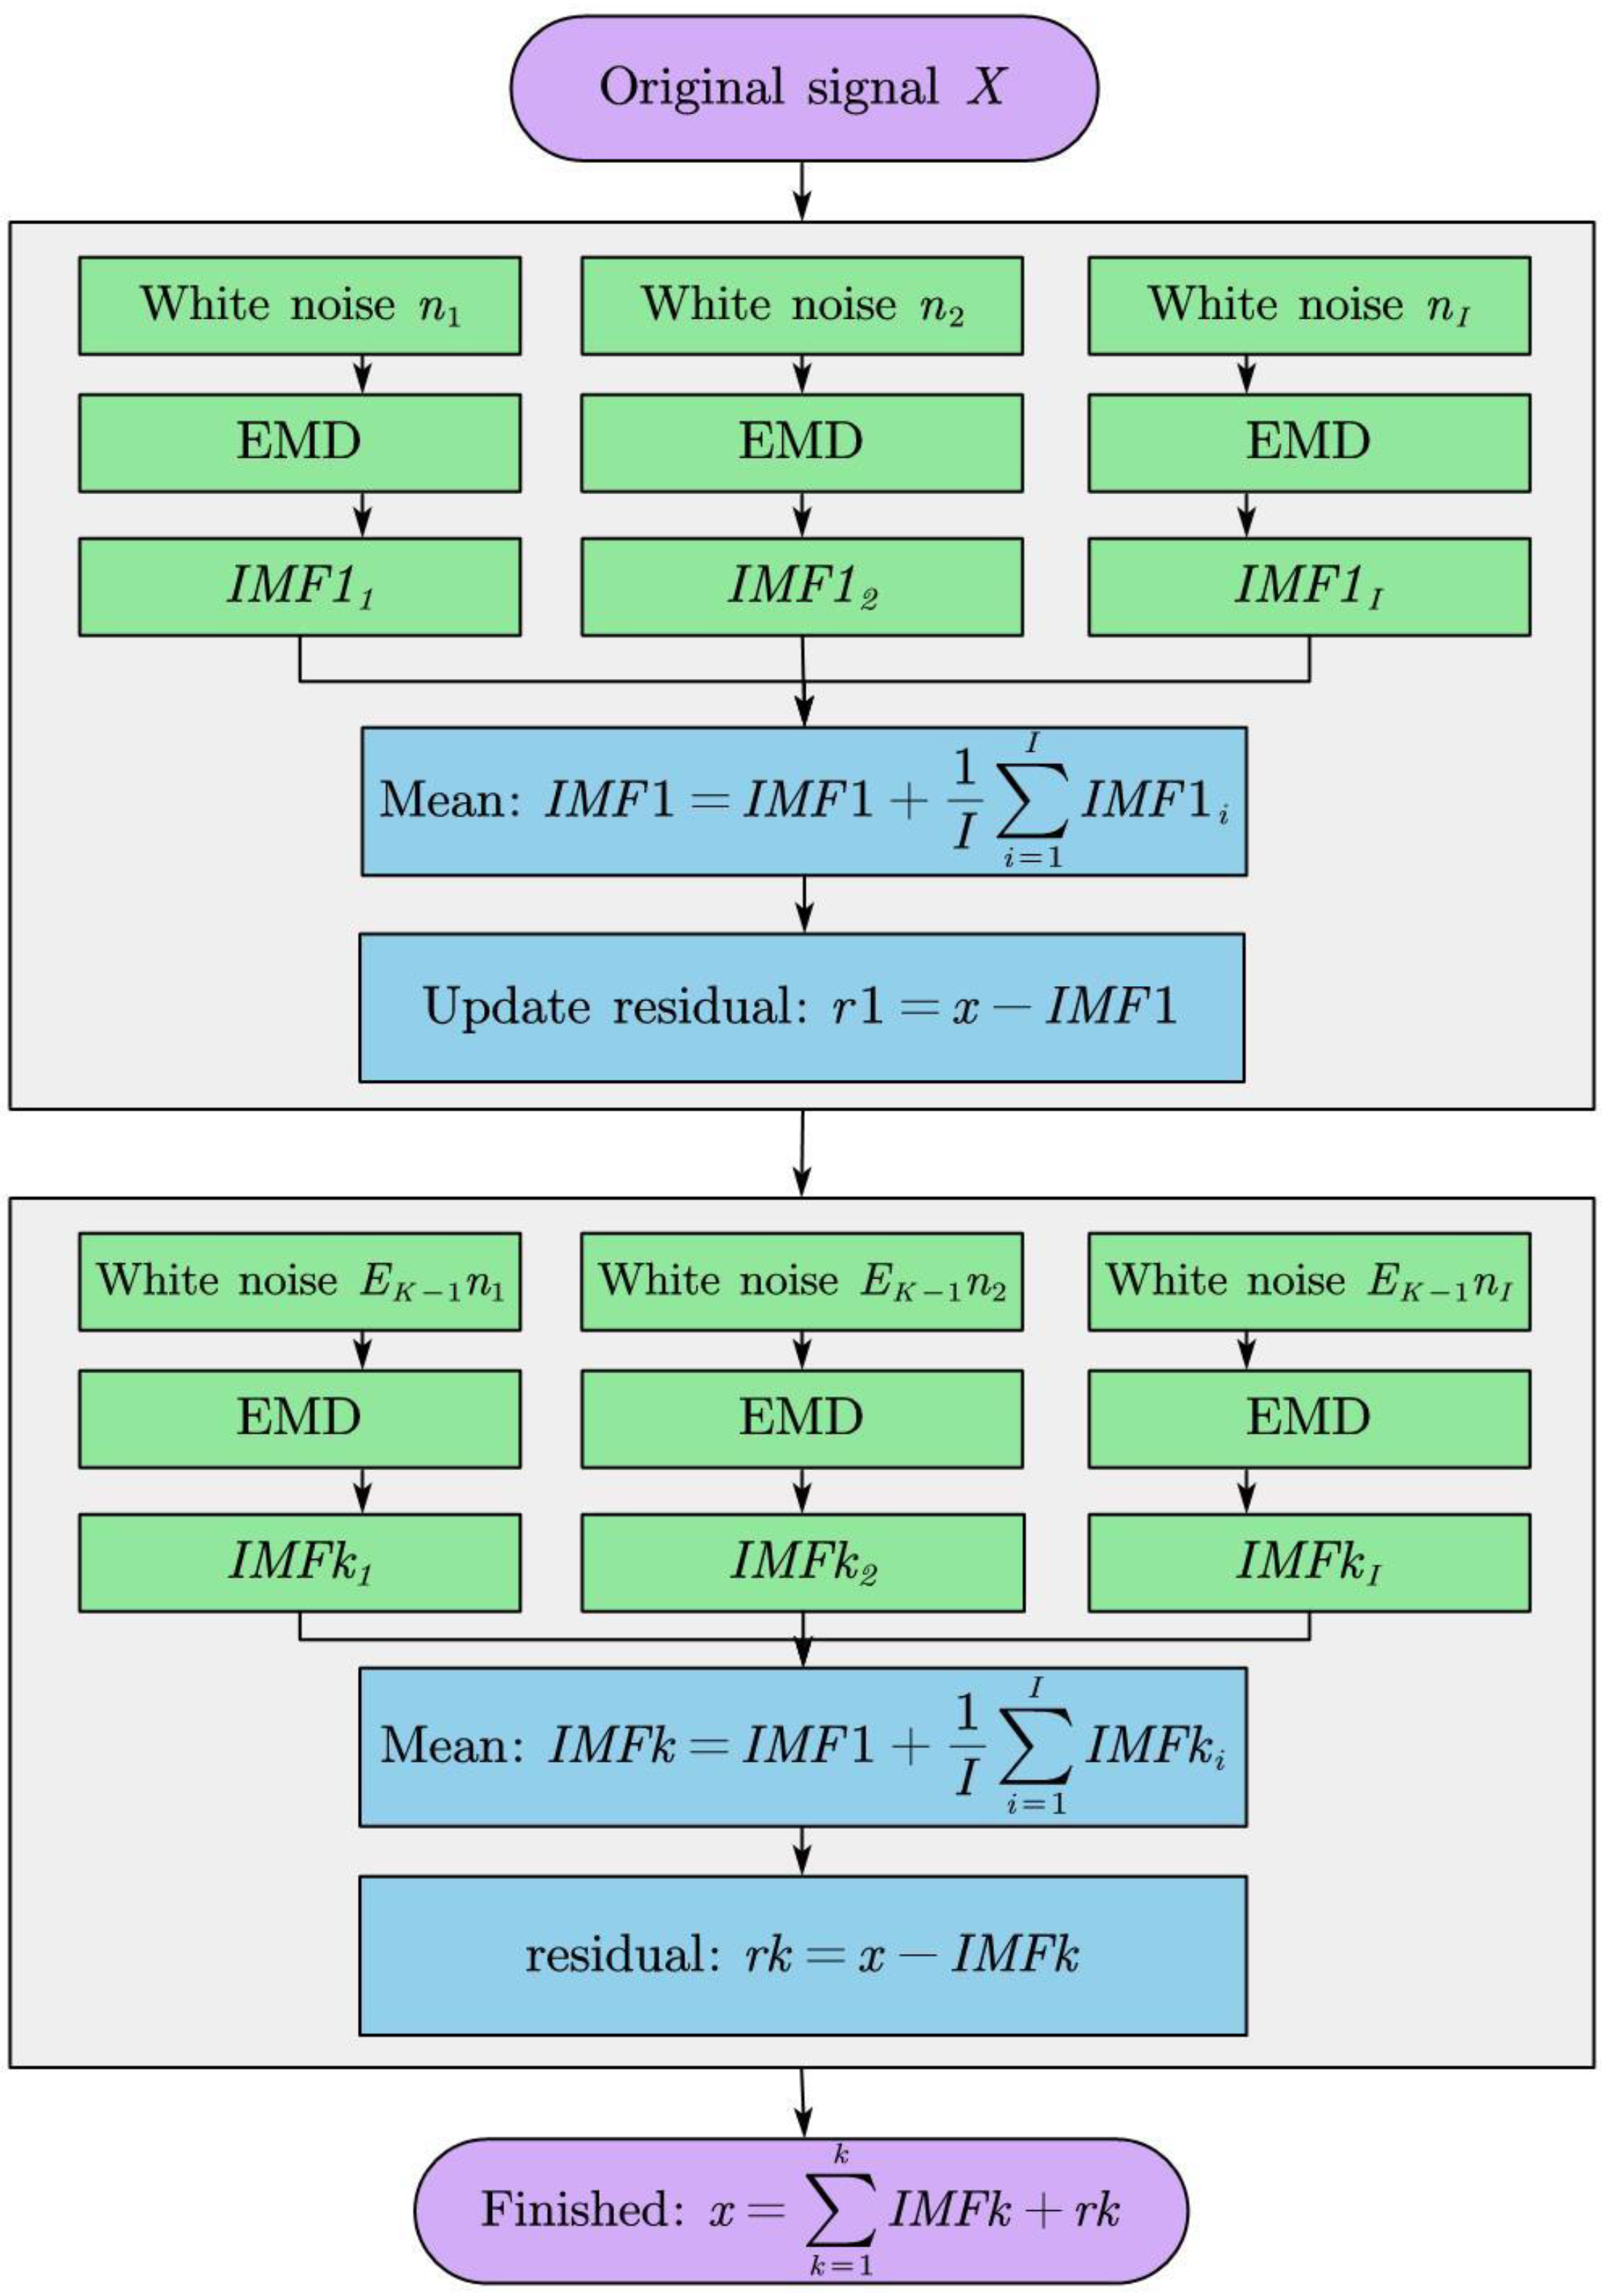
2.3. CEEMDAN
- Find out every local maximum and minimum point in the original signal, and then construct the upper envelope and lower envelope by combining each extreme point through the curve fitting method;
- Constructing their mean curves by using the upper envelope and lower envelope, then the mean curve is subtracted from the original signal so that the resulting is the IMF;
- Repeating the first and the second steps until the standard deviation (SD) is less than the threshold; then we can stop, and the formula is:
3. GRU Neural Network Based on CEEMDAN-Wavelet
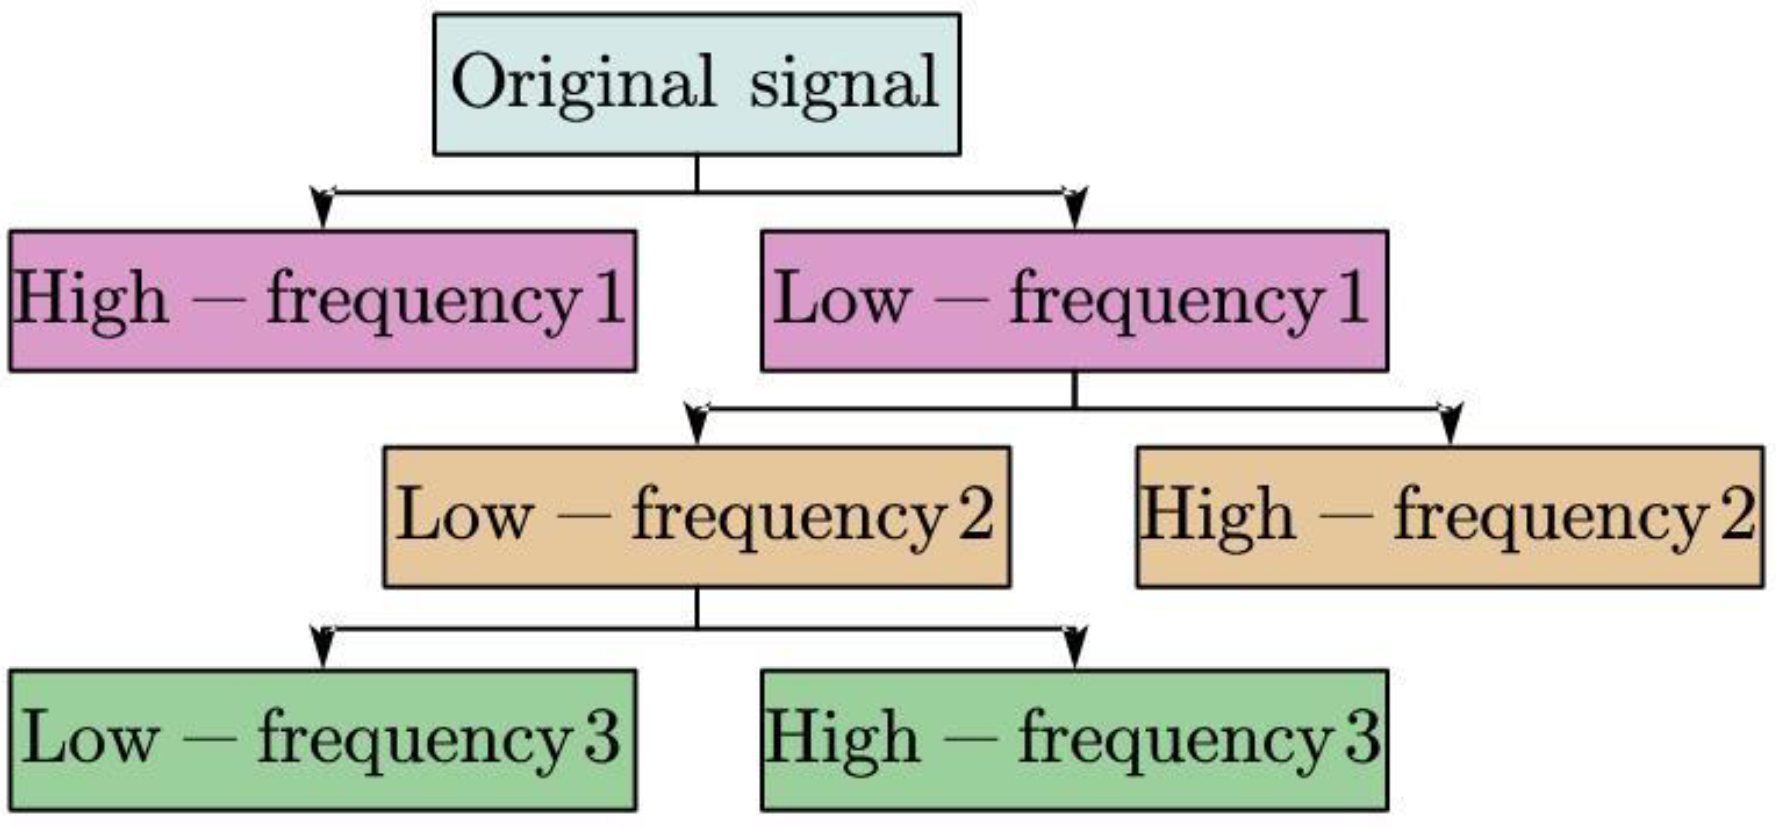
3.1. Wavelet Decomposition in CEEMDAN Framework
- Set N decomposition layers to decompose the original signal and get each scale coefficient;
- Select the appropriate threshold for the signal to quantize the scale coefficients of each layer by the experiments, and select the appropriate wavelet basis function;
- Integrate and reconstruct the completed denoised signal. The basic decomposition process of the wavelet transform is shown in Figure 2.
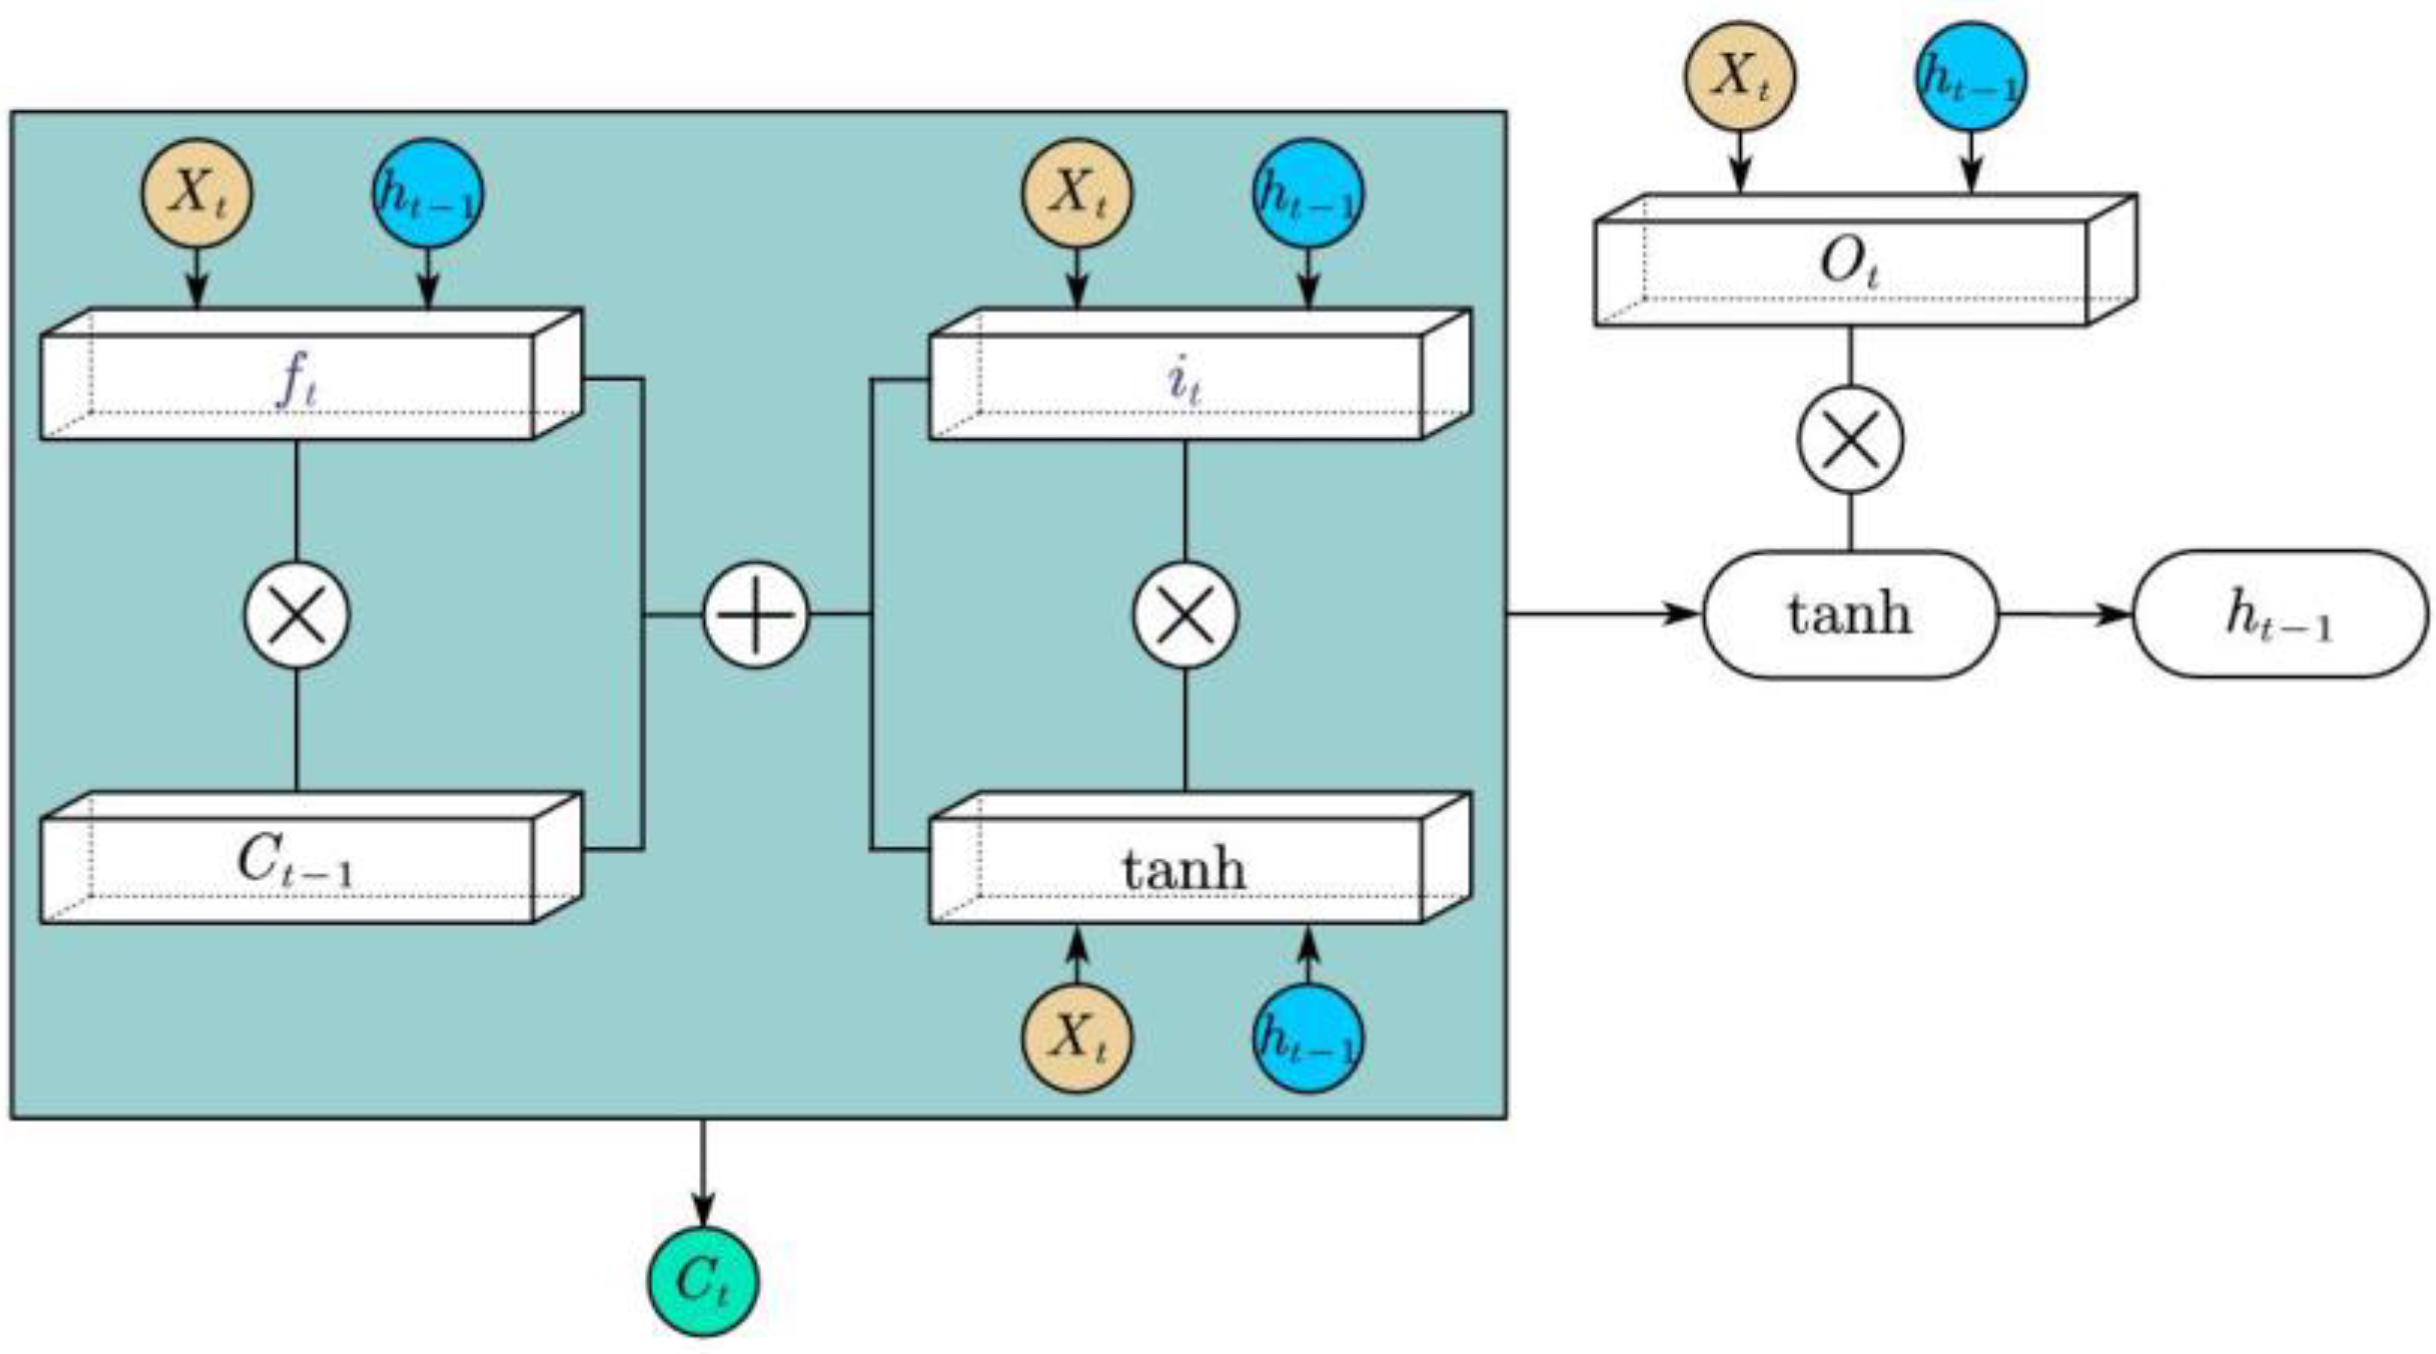
3.2. LSTM
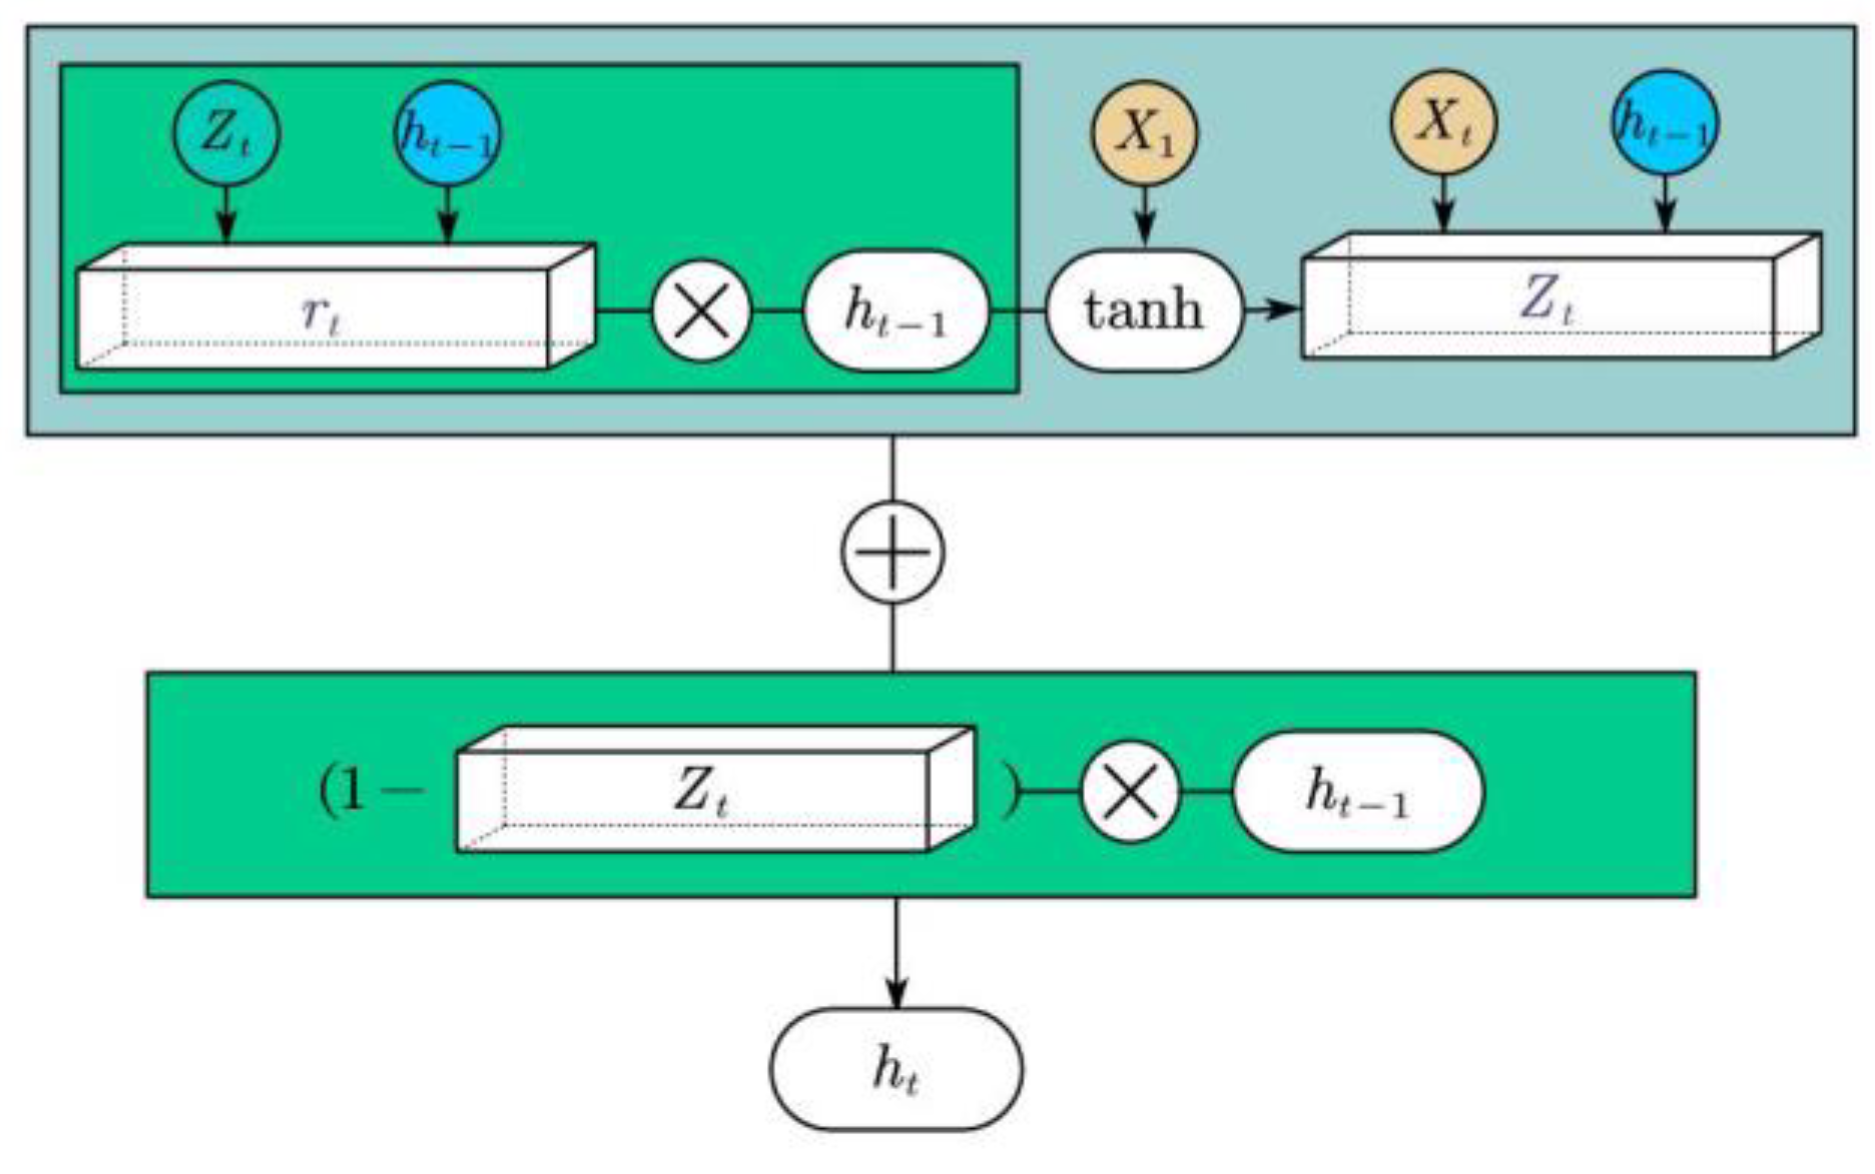
3.3. GRU
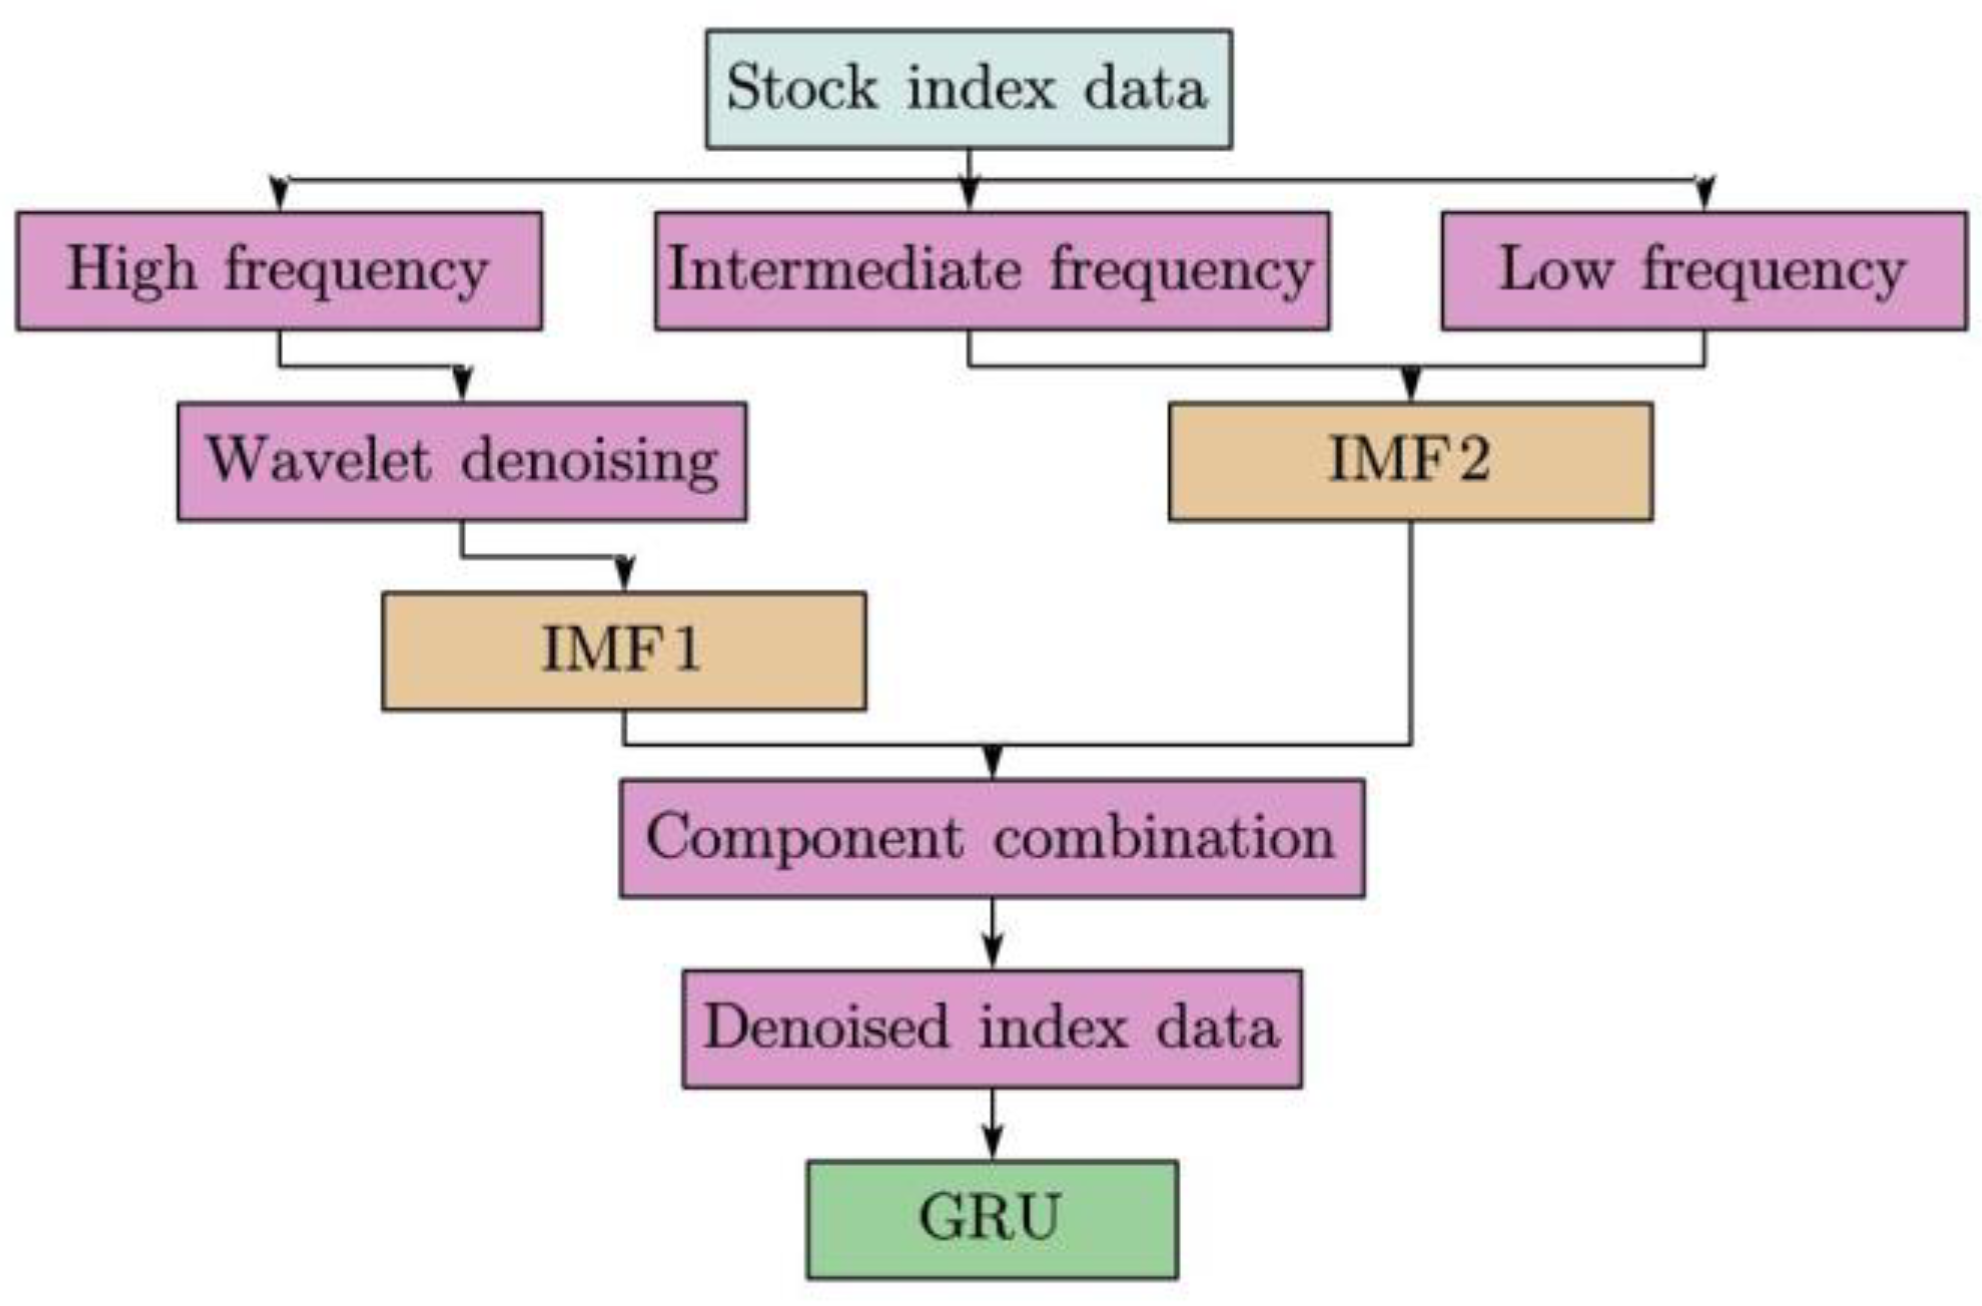
3.4. The Framework of GRU Neural Network Based on CEEMDAN–Wavelet
4. Results
4.1. Experiment Design
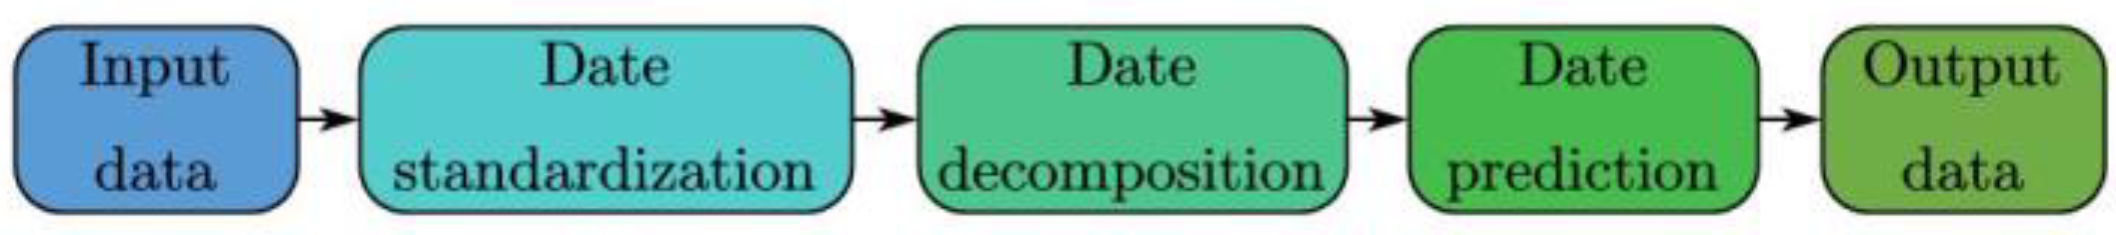
4.2. Test Process
- Historical data is entered into the model waiting to be used;
- Before using data, the input data needs to be standardized according to formula (22);
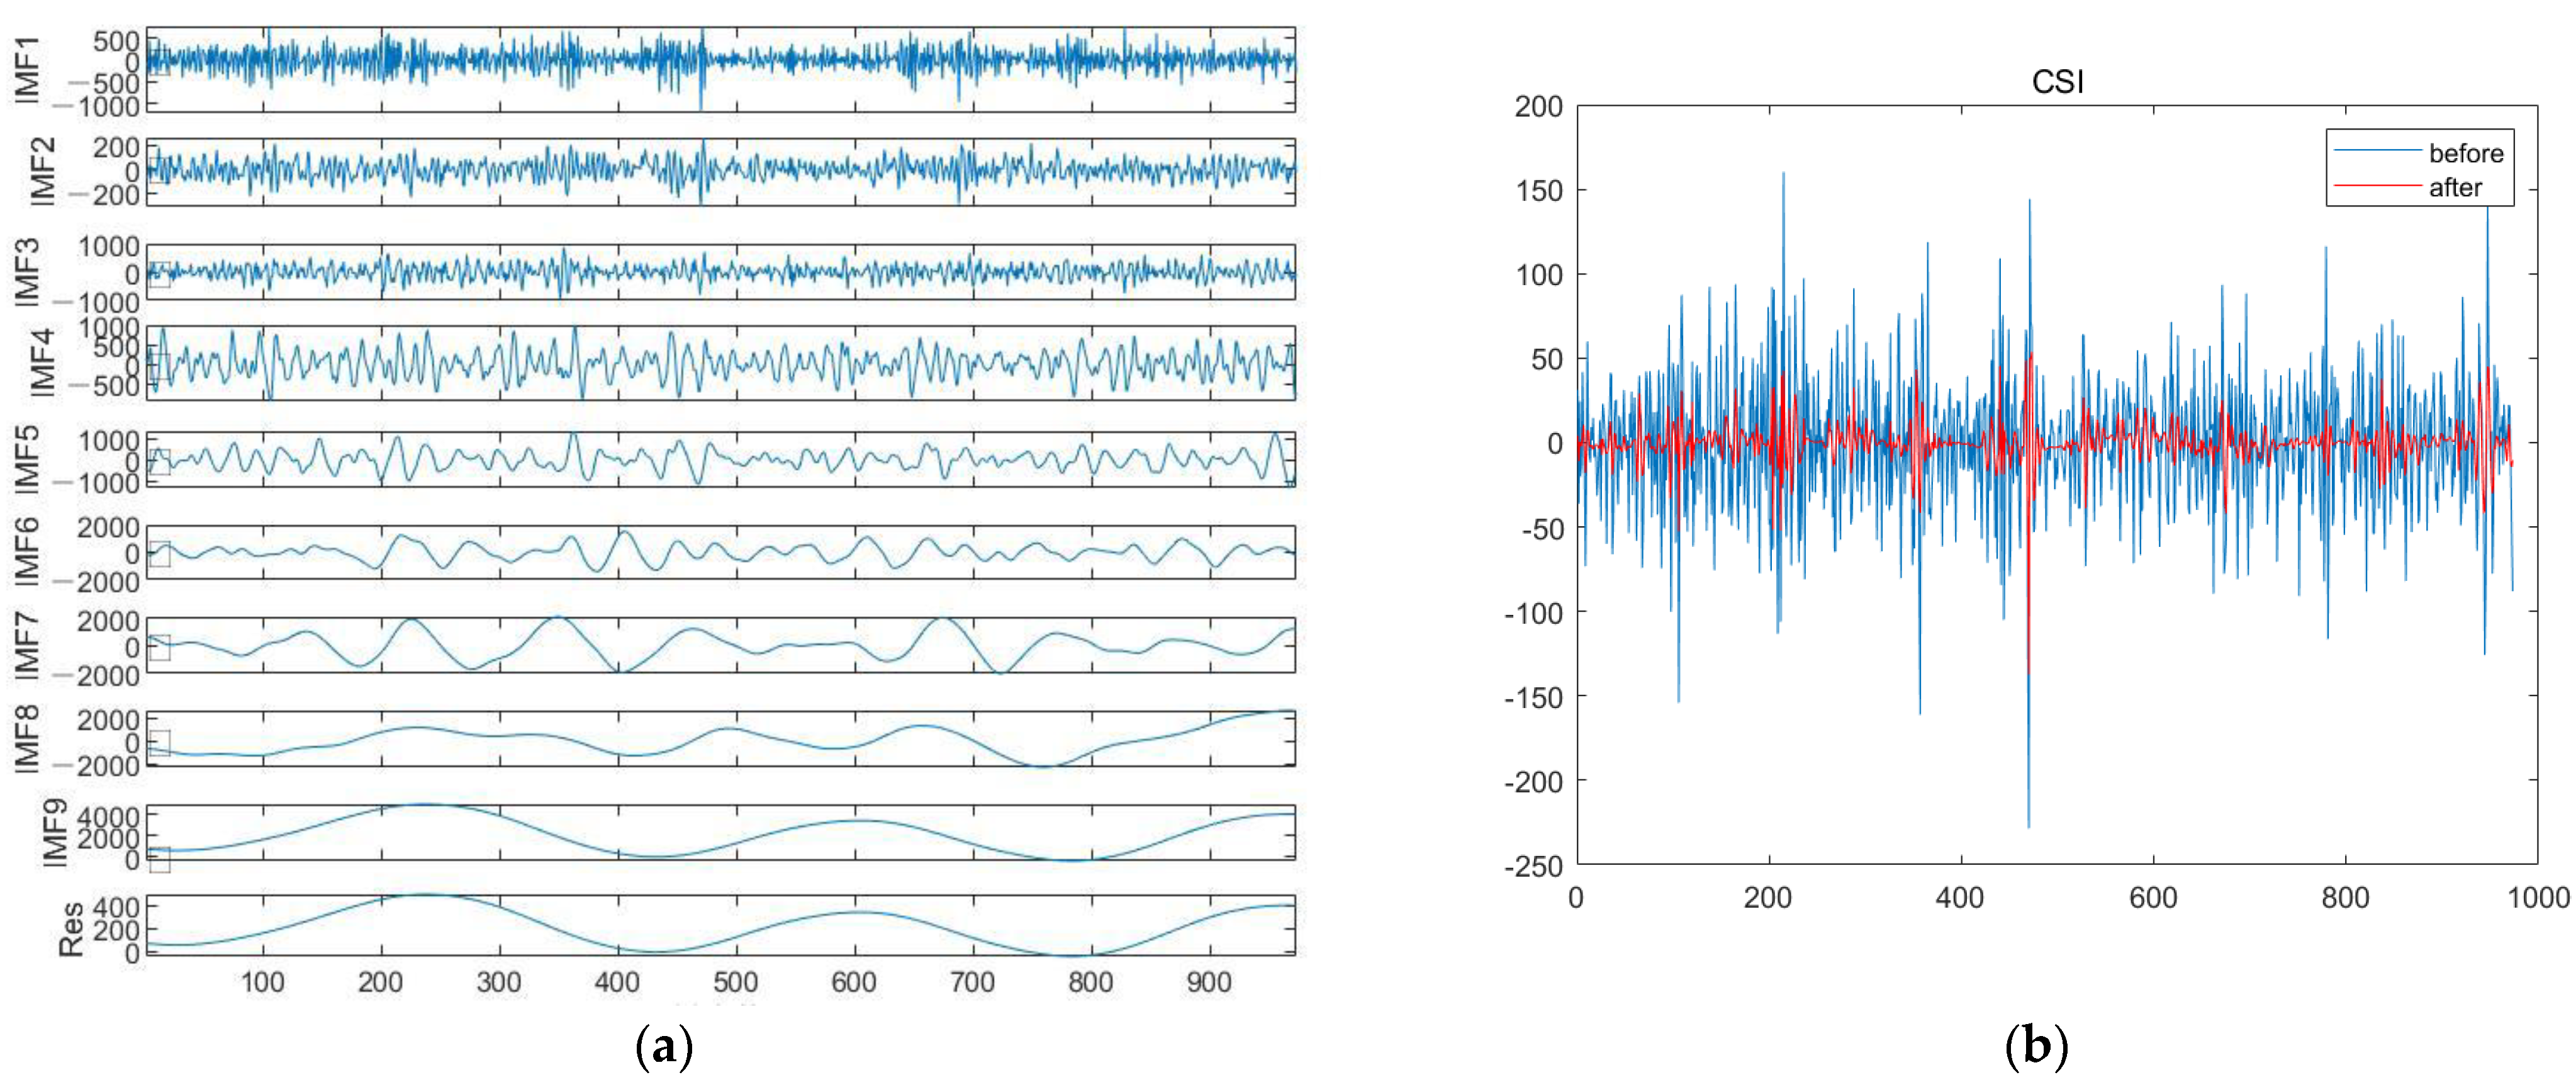
- Noise reduction of data using CEEMDAN, and wavelet threshold denoising method is used for high-frequency components;
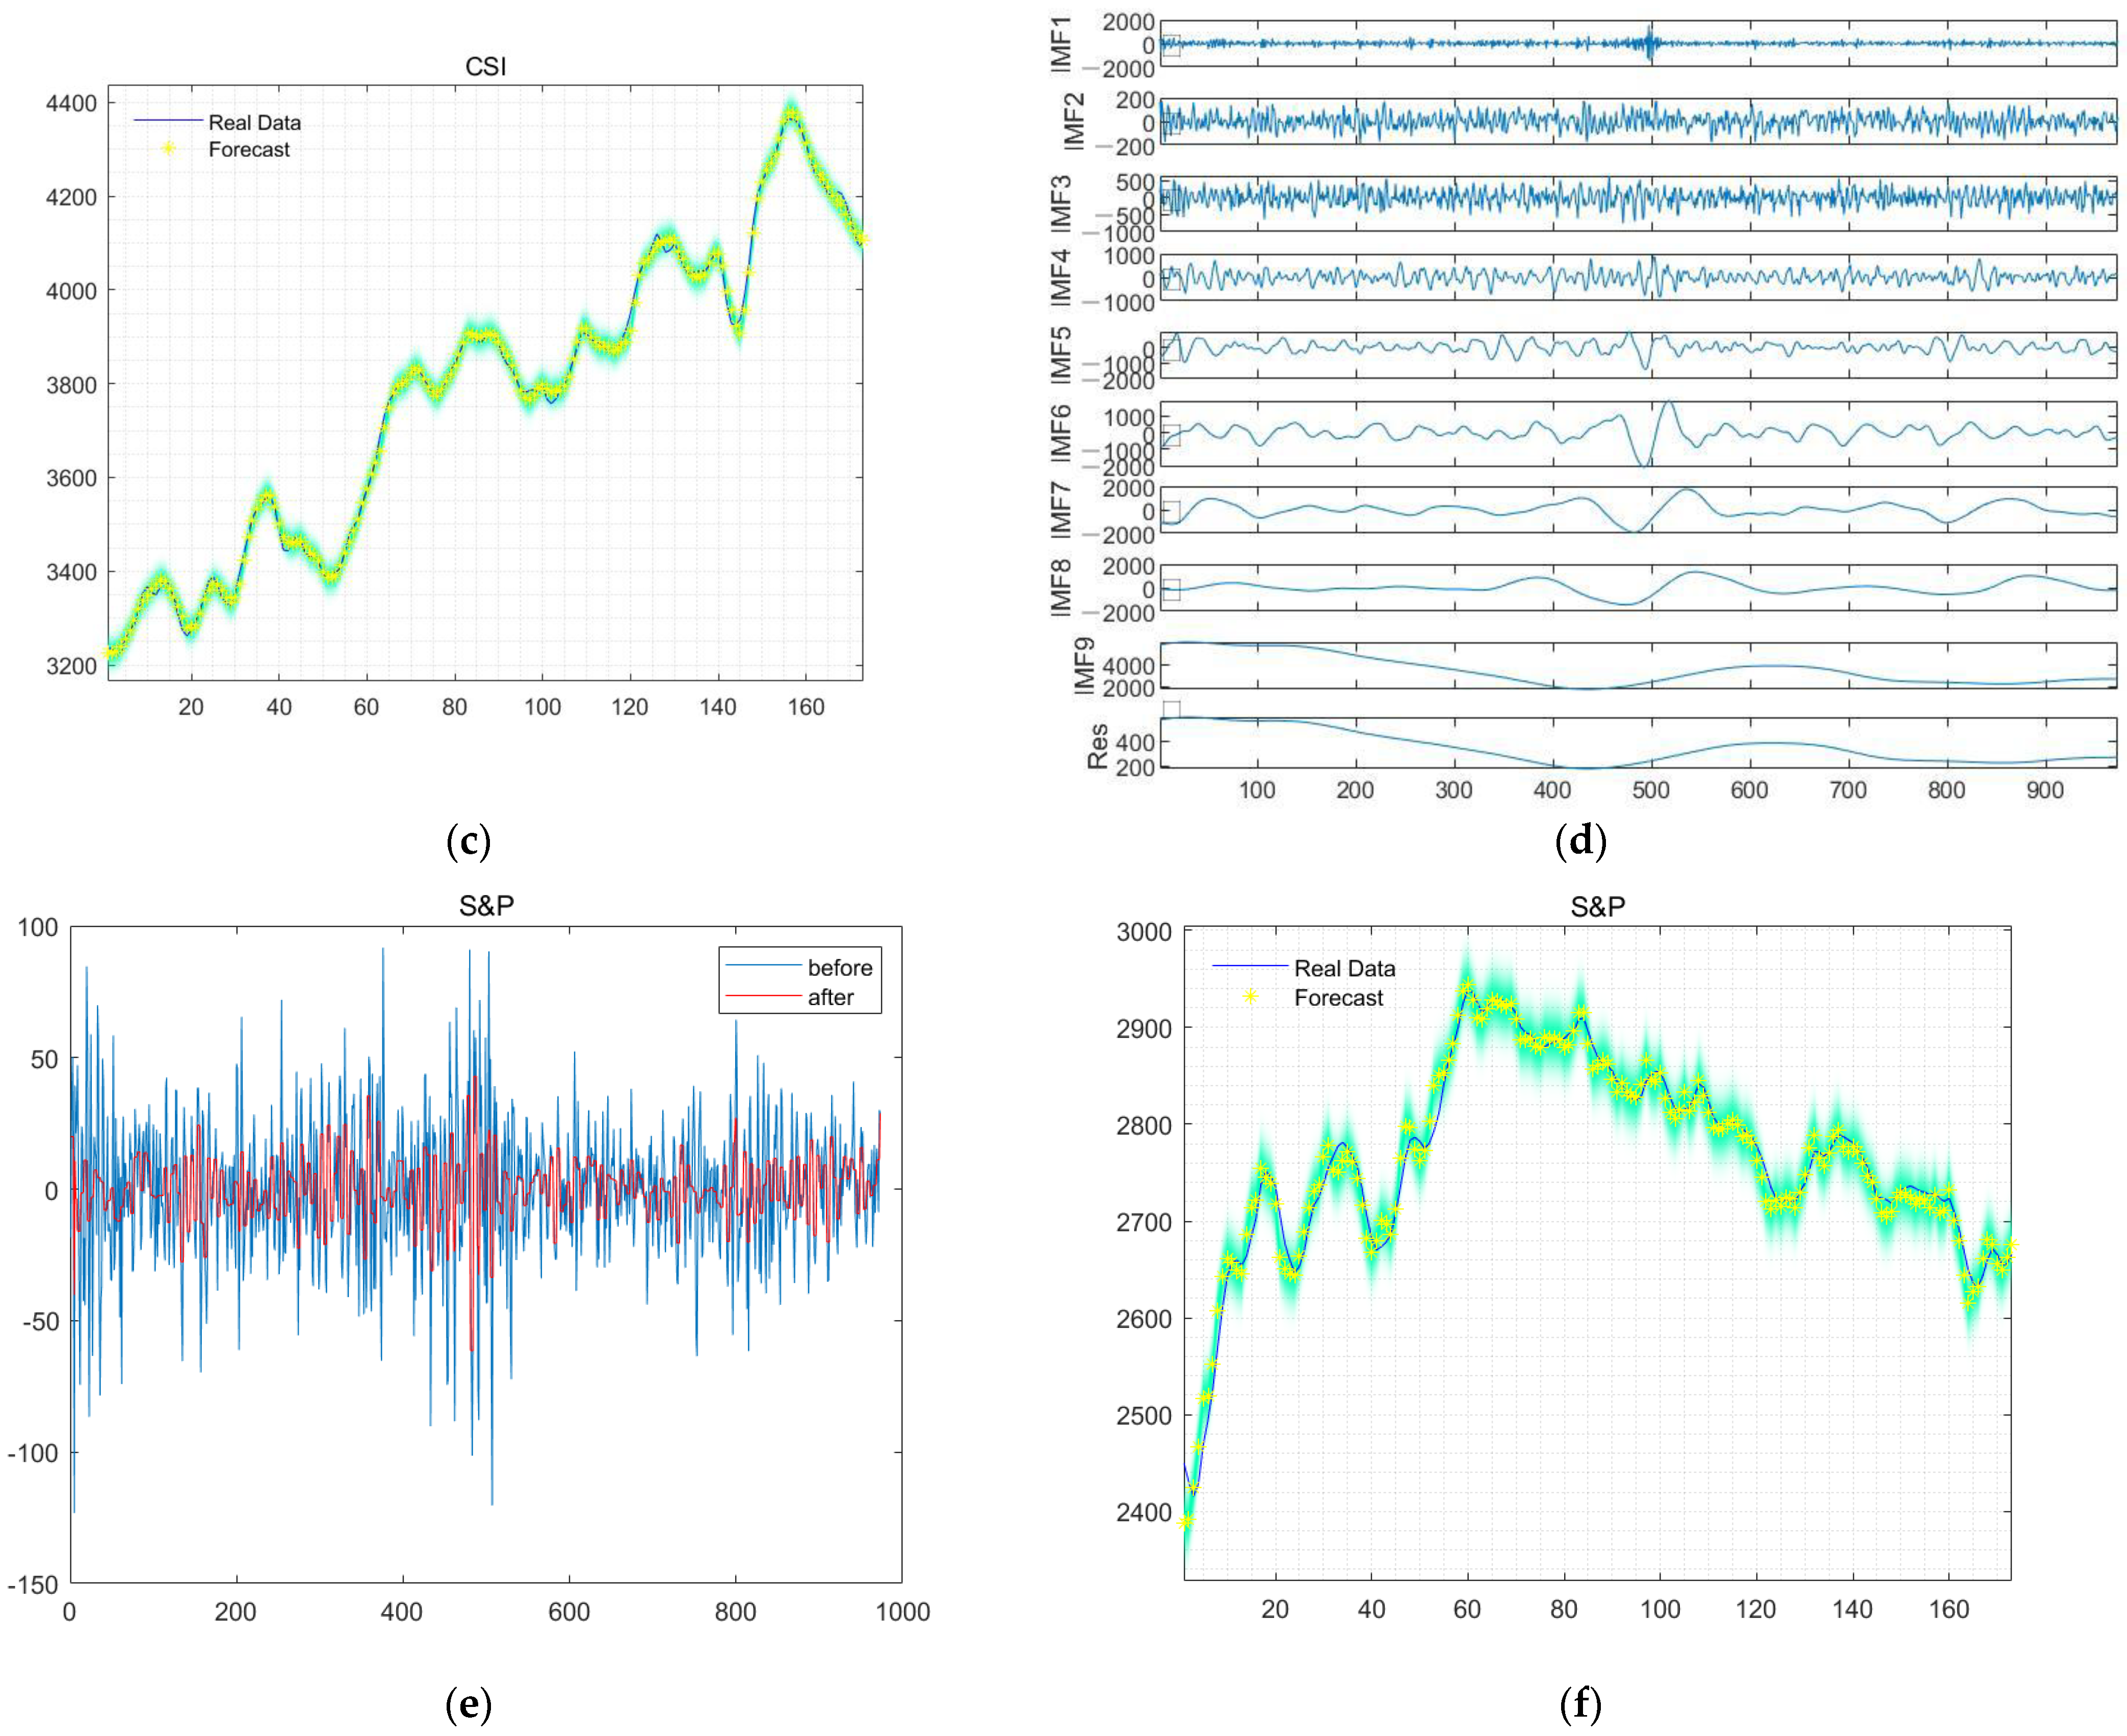
- The denoised signals are inputted into the trained GRU to get the output value;
- Restoring standardized data.
4.3. Comparative Experiments
4.4. Evaluation Method
4.5. Experimental Result and Comparison
5. Discussion
6. Conclusions
Author Contributions
Funding
Institutional Review Board Statement
Informed Consent Statement
Data Availability Statement
Conflicts of Interest
References
- Wu, J.M.T.; Li, Z.; Herencsar, N.; Vo, B.; Lin, J.C.W. A graph-based CNN-LSTM stock price prediction algorithm with leading indicators. Multimed. Syst. 2021, 29, 1751–1770. [Google Scholar] [CrossRef]
- Zhang, R.; Su, J.; Feng, J. An extreme learning machine model based on adaptive multi-fusion chaotic sparrow search algorithm for regression and classification. Evol. Intell. 2023, 1–20. [Google Scholar] [CrossRef]
- Ivakhnenko, A.G. Polynomial theory of complex systems. IEEE Trans. Syst. Man Cybern. 1971, SMC-1, 364–378. [Google Scholar] [CrossRef]
- Rumelhart, D.E.; Hinton, G.E.; Williams, R.J. Learning representations by back-propagating errors. Nature 1986, 323, 533–536. [Google Scholar] [CrossRef]
- Tang, J.; He, L. Genetic optimization of BP neural network in the application of suspicious financial transactions pattern recognition. In Proceedings of the 2012 International Conference on Management of e-Commerce and e-Government, Beijing, China, 20–21 October 2012. [Google Scholar]
- Graves, A.; Mohamed, A.; Hinton, G. Speech recognition with deep recurrent neural networks. In Proceedings of the 2013 IEEE International Conference on Acoustics, Speech and Signal Processing, Vancouver, BC, Canada, 26–31 May 2013. [Google Scholar]
- Zhang, R.; Su, J.; Feng, J. Solution of the Hirota equation using a physics-informed neural network method with embedded conservation laws. Nonlinear Dyn. 2023, 1–16. [Google Scholar] [CrossRef]
- Huang, L.; Xie, G.; Zhao, W.; Gu, Y.; Huang, Y. Regional logistics demand forecasting: A BP neural network approach. Complex Intell. Syst. 2021, 9, 2297–2312. [Google Scholar] [CrossRef]
- Schmidhuber, J.; Hochreiter, S. Long short-term memory. Neural Comput. 1997, 9, 1735–1780. [Google Scholar]
- Selvin, S.; Vinayakumar, R.; Gopalakrishnan, E.A.; Menon, V.K.; Soman, K.P. Stock price prediction using LSTM, RNN and CNN-sliding window model. In Proceedings of the 2017 International Conference on Advances in Computing, Communications and Informatics (ICACCI), Udupi, India, 13–16 September 2017. [Google Scholar]
- Zhang, W.; Li, H.; Tang, L.; Gu, X.; Wang, L.; Wang, L. Displacement prediction of Jiuxianping landslide using gated recurrent unit (GRU) networks. Acta Geotech. 2022, 17, 1367–1382. [Google Scholar] [CrossRef]
- Büyükşahin, Ü.C.; Ertekin, Ş. Improving forecasting accuracy of time series data using a new ARIMA-ANN hybrid method and empirical mode decomposition. Neurocomputing 2019, 361, 151–163. [Google Scholar] [CrossRef]
- Huang, N.E.; Shen, Z.; Long, S.R.; Wu, M.C.; Shih, H.H.; Zheng, Q.; Yen, N.; Tung, C.C.; Liu, H.H. The empirical mode decomposition and the Hilbert spectrum for nonlinear and non-stationary time series analysis. Proc. R. Soc. Lond. Ser. A Math. Phys. Eng. Sci. 1998, 454, 903–995. [Google Scholar] [CrossRef]
- Lakshmi, M.D.; Murugan, S.S.; Padmapriya, N.; Somasekar, M. Texture Analysis on Side Scan Sonar images using EMD, XCS-LBP and Statistical Co-occurrence. In Proceedings of the 2019 International Symposium on Ocean Technology (SYMPOL), Ernakulam, India, 11–13 December 2019. [Google Scholar]
- Riaz, F.; Hassan, A.; Rehman, S.; Niazi, I.K.; Dremstrup, K. EMD-based temporal and spectral features for the classification of EEG signals using supervised learning. IEEE Trans. Neural Syst. Rehabil. Eng. 2015, 24, 28–35. [Google Scholar] [CrossRef]
- Mallat, S.G. A theory for multiresolution signal decomposition: The wavelet representation. IEEE Trans. Pattern Anal. Mach. Intell. 1987, 11, 674–693. [Google Scholar] [CrossRef]
- Torres, M.E.; Colominas, M.A.; Schlotthauer, G.; Flandrin, P. A complete ensemble empirical mode decomposition with adaptive noise. In Proceedings of the 2011 IEEE International Conference on Acoustics, Speech and Signal Processing (ICASSP), Prague, Czech Republic, 22–27 May 2011. [Google Scholar]
- Swathi, T.; Kasiviswanath, N.; Rao, A.A. An optimal deep learning-based LSTM for stock price prediction using twitter sentiment analysis. Appl. Intell. 2022, 52, 13675–13688. [Google Scholar] [CrossRef]
- Zhao, Y.; Yang, G. Deep Learning-based Integrated Framework for stock price movement prediction. Appl. Soft Comput. 2023, 133, 109921. [Google Scholar] [CrossRef]
- Panda, M. Application of ARIMA and Holt-Winters forecasting model to predict the spreading of COVID-19 for India and its states. medRxiv 2020. [Google Scholar] [CrossRef]
- Adebiyi, A.A.; Adewumi, A.O.; Ayo, C.K. Comparison of ARIMA and artificial neural networks models for stock price prediction. J. Appl. Math. 2014, 2014, 614342. [Google Scholar] [CrossRef]
- Enke, D.; Thawornwong, S. The use of data mining and neural networks for forecasting stock market returns. Expert Syst. Appl. 2005, 29, 927–940. [Google Scholar] [CrossRef]
- Lu, W.; Li, J.; Wang, J.; Qin, L. A CNN-BiLSTM-AM method for stock price prediction. Neural Comput. Appl. 2021, 33, 4741–4753. [Google Scholar] [CrossRef]
- Xiao, C.; Xia, W.; Jiang, J. Stock price forecast based on combined model of ARI-MA-LS-SVM. Neural Comput. Appl. 2020, 32, 5379–5388. [Google Scholar] [CrossRef]
- Wang, J.; Wang, J.; Zhang, Z.; Guo, S. Forecasting stock indices with back propagation neural network. Expert Syst. Appl. 2011, 38, 14346–14355. [Google Scholar] [CrossRef]
- Lee, J.; Koh, H.; Choe, H.J. Learning to trade in financial time series using high-frequency through wavelet transformation and deep reinforcement learning. Appl. Intell. 2021, 51, 6202–6223. [Google Scholar] [CrossRef]
- Mikolov, T.; Kombrink, S.; Burget, L.; Černocký, J.; Khudanpur, S. Extensions of recurrent neural network language model. In Proceedings of the 2011 IEEE International Conference on Acoustics, Speech and Signal Processing (ICASSP), Prague, Czech Republic, 22–27 May 2011. [Google Scholar]
- Wang, L.; Zhang, Y.; Yuan, J.; Hu, K.; Cao, S. FEBDNN: Fusion embedding-based deep neural network for user retweeting behavior prediction on social networks. Neural Comput. Appl. 2022, 34, 13219–13235. [Google Scholar] [CrossRef]
- Althelaya, K.A.; El-Alfy, E.S.M.; Mohammed, S. Stock market forecast using multivariate analysis with bidirectional and stacked (LSTM, GRU). In Proceedings of the 2018 21st Saudi Computer Society National Computer Conference (NCC), Riyadh, Saudi Arabia, 25–26 April 2018. [Google Scholar]
- Wang, H.; Yu, L.; Tian, S.; Peng, Y.; Pei, X. Bidirectional LSTM Malicious webpages detection algorithm based on convolutional neural network and independent recurrent neural network. Appl. Intell. 2019, 49, 3016–3026. [Google Scholar] [CrossRef]
- Hasan, N. A methodological approach for predicting COVID-19 epidemic using EEMD-ANN hybrid model. Internet Things 2020, 11, 100228. [Google Scholar] [CrossRef]
- Jamous, R.; ALRahhal, H.; El-Darieby, M. A new ann-particle swarm optimization with center of gravity (ann-psocog) prediction model for the stock market under the effect of COVID-19. Sci. Program. 2021, 2021, 6656150. [Google Scholar] [CrossRef]
- Wu, W.; Wu, X.; Cai, Y.; Zhou, Q. Deep coupling neural network for robust facial landmark detection. Comput. Graph. 2019, 82, 286–294. [Google Scholar] [CrossRef]
- Kamnitsas, K.; Ledig, C.; Newcombe, V.F.J.; Simpson, J.P.; Kane, A.D.; Menon, D.K.; Rueckert, D.; Glocker, B. Efficient multi-scale 3D CNN with fully connected CRF for accurate brain lesion segmentation. Med. Image Anal. 2017, 36, 61–78. [Google Scholar] [CrossRef]
- Bose, A.; Hsu, C.H.; Roy, S.S.; Lee, K.C.; Mohammadi-Ivatloo, B.; Abimannan, S. Forecasting stock price by hybrid model of cascading Multivariate Adaptive Regression Splines and Deep Neural Network. Comput. Electr. Eng. 2021, 95, 107405. [Google Scholar] [CrossRef]
- Roy, S.S.; Mittal, D.; Basu, A.; Abraham, A. Stock market forecasting using LASSO linear regression model. In Afro-European Conference for Industrial Advancement; Springer: Cham, Switzerland, 2015. [Google Scholar]
- Roy, S.S.; Chopra, R.; Lee, K.C.; Spampinato, C.; Mohammadi-ivatloo, B. Random forest, gradient boosted machines and deep neural network for stock price forecasting: A comparative analysis on South Korean companies. Int. J. Ad Hoc Ubiquitous Comput. 2020, 33, 62–71. [Google Scholar] [CrossRef]
- Chen, W.; Yeo, C.K.; Lau, C.T.; Lee, B.S. Leveraging social media news to predict stock index movement using RNN-boost. Data Knowl. Eng. 2018, 118, 14–24. [Google Scholar] [CrossRef]
- Winters, P.R. Forecasting sales by exponentially weighted moving averages. Manag. Sci. 1960, 6, 324–342. [Google Scholar] [CrossRef]
- Zhao, Y.; Ye, L.; Pinson, P.; Tang, Y.; Lu, P. Correlation-constrained and sparsity-controlled vector autoregressive model for spatio-temporal wind power forecasting. IEEE Trans. Power Syst. 2018, 33, 5029–5040. [Google Scholar] [CrossRef]
- Wu, Z.; Huang, N.E. Ensemble empirical mode decomposition: A noise-assisted data analysis method. Adv. Adapt. Data Anal. 2009, 1, 1–41. [Google Scholar] [CrossRef]
- Schwartz, M.; Bennett, W.R.; Stein, S. Communication Systems and Techniques; IEEE: Piscataway, NJ, USA, 1996; Volume 34. [Google Scholar]
- Titchmarsh, E.C. Introduction to the Theory of Fourier Integrals; The Clarendon Press: Oxford, UK, 1938. [Google Scholar]
- Shewalkar, A. Performance evaluation of deep neural networks applied to speech recognition: RNN, LSTM and GRU. J. Artif. Intell. Soft 2019, 9, 235–245. [Google Scholar] [CrossRef]
- Liu, Y.P.; Li, Y.; Ma, H.T. Seismic random noise reduction by empirical mode decomposition combined with translation invariant scale-adaptive threshold. In Proceedings of the 2012 International Conference on Wavelet Analysis and Pattern Recognition, Xi’an, China, 15–17 July 2012. [Google Scholar]


| Model | RMSE | MSE | R2 | MAE |
|---|---|---|---|---|
| GRU based on CEEMDAN–wavelet | 12.99 | 168.89 | 0.994 | 10.63 |
| LSTM | 18.14 | 329.06 | 0.98 | 15.15 |
| ARIMA | 49.376 | 2437.98 | 0.79 | 37.8 |
| GRU | 17.07 | 291.37 | 0.986 | 11.96 |
| CNN-BiLSTM | 20.14 | 405.62 | 0.91 | 13.68 |
| ANN | 22.47 | 504.90 | 0.87 | 14.59 |
| Model | RMSE | MSE | R2 | MAE |
|---|---|---|---|---|
| GRU based on CEEMDAN–wavelet | 22.27 | 496.07 | 0.991 | 17.39 |
| LSTM | 26.34 | 693.79 | 0.97 | 16.544 |
| ARIMA | 27.74 | 769.68 | 0.94 | 19.32 |
| GRU | 23.51 | 552.99 | 0.97 | 21.23 |
| CNN-BiLSTM | 24.28 | 589.52 | 0.96 | 19.87 |
| Control Model | Test Model | p Value of t-Test | Mean Value |
|---|---|---|---|
| GRU based on CEEMDAN–wavelet (303.10) | LSTM | 0.34 | 321.60 |
| GRU | 0.01 | 380.81 | |
| CNN-BiLSTM | 2.08 × 10⁻⁷ | 691.78 | |
| ANN | 2.51 × 10⁻⁶ | 526.46 |
| Control Model | Test Model | p Value of t-Test | Mean Value |
|---|---|---|---|
| GRU based on CEEMDAN–wavelet (13.70) | LSTM | 0.14 | 14.32 |
| GRU | 0.008 | 15.38 | |
| CNN-BiLSTM | 2.89 × 10⁻⁸ | 20.09 | |
| ANN | 0.01 | 15.21 |
| Control Model | Test Model | p Value of t-Test | Mean Value |
|---|---|---|---|
| GRU based on CEEMDAN–wavelet (162.85) | LSTM | 3.11 × 10⁻¹¹ | 627.12 |
| GRU | 1.99 × 10⁻⁵ | 477.31 | |
| CNN-BiLSTM | 6.07 × 10⁻⁵ | 684.32 | |
| ANN | 1.82 × 10⁻¹⁰ | 700.76 |
| Control Model | Test Model | p Value of t-Test | Mean Value |
|---|---|---|---|
| GRU based on CEEMDAN–wavelet (9.18) | LSTM | 9.41 × 10⁻¹¹ | 19.09 |
| GRU | 2.37 × 10⁻⁵ | 16.29 | |
| CNN-BiLSTM | 1.06 × 10⁻⁴ | 20.31 | |
| ANN | 1.91 × 10⁻⁹ | 19.77 |
Disclaimer/Publisher’s Note: The statements, opinions and data contained in all publications are solely those of the individual author(s) and contributor(s) and not of MDPI and/or the editor(s). MDPI and/or the editor(s) disclaim responsibility for any injury to people or property resulting from any ideas, methods, instructions or products referred to in the content. |
© 2023 by the authors. Licensee MDPI, Basel, Switzerland. This article is an open access article distributed under the terms and conditions of the Creative Commons Attribution (CC BY) license (https://creativecommons.org/licenses/by/4.0/).
Share and Cite
Qi, C.; Ren, J.; Su, J. GRU Neural Network Based on CEEMDAN–Wavelet for Stock Price Prediction. Appl. Sci. 2023, 13, 7104. https://doi.org/10.3390/app13127104
Qi C, Ren J, Su J. GRU Neural Network Based on CEEMDAN–Wavelet for Stock Price Prediction. Applied Sciences. 2023; 13(12):7104. https://doi.org/10.3390/app13127104
Chicago/Turabian StyleQi, Chenyang, Jiaying Ren, and Jin Su. 2023. "GRU Neural Network Based on CEEMDAN–Wavelet for Stock Price Prediction" Applied Sciences 13, no. 12: 7104. https://doi.org/10.3390/app13127104
APA StyleQi, C., Ren, J., & Su, J. (2023). GRU Neural Network Based on CEEMDAN–Wavelet for Stock Price Prediction. Applied Sciences, 13(12), 7104. https://doi.org/10.3390/app13127104