Article

Non-Probabilistic Reliability Analysis of Slopes Based on Fuzzy Set Theory

1
School of Civil Engineering and Architecture, Wuhan Institute of Technology, Wuhan 430073, China
2
School of Civil and Hydraulic Engineering, Huazhong University of Science and Technology, Wuhan 430074, China
*
Author to whom correspondence should be addressed.
Appl. Sci. 2023, 13(12), 7024; https://doi.org/10.3390/app13127024
Submission received: 16 May 2023 / Revised: 9 June 2023 / Accepted: 9 June 2023 / Published: 11 June 2023
(This article belongs to the Section Civil Engineering)

Abstract

:
Aimed at the problem of fuzzy uncertainty of geotechnical parameters in slope stability analysis, a non-probabilistic reliability analysis method for slopes based on fuzzy set theory is proposed. Geotechnical parameters are described as fuzzy numbers, which are transformed into interval numbers at different cut set levels by taking fuzzy sets. The corresponding non-probabilistic reliability indexes and failure degrees of the slope are calculated by the non-probabilistic reliability analysis method based on the ellipsoidal model, and then the overall failure degree of the slope is obtained by weighted average to judge the stability state of the slope. The feasibility of the method was verified by a case analysis. The results show that the type and shape parameters of the fuzzy affiliation function of geotechnical parameters have a great influence on the non-probabilistic reliability of the slope. The slope failure degrees obtained from trapezoidal fuzzy numbers were larger, the slope failure degrees obtained from triangular fuzzy numbers and normal fuzzy numbers were medium, and the slope failure degrees obtained from lognormal fuzzy numbers were smaller. When considering soil parameters as triangular fuzzy numbers, normal fuzzy numbers, or lognormal fuzzy numbers, with the reduction of the shape parameters, the non-probabilistic reliability indexes of the slope increased while the failure degrees decreased. Additionally, adopting the overall failure degree to evaluate the stability of the slope can effectively solve the problem where the calculation results are too conservative (if the non-probabilistic reliability index is greater than 1) to judge the stability state of the slope in the traditional non-probabilistic reliability method.

1. Introduction

Under the influence of long-term geological action and construction conditions, a certain degree of fuzzy uncertainty exists in slope engineering [1,2,3,4], and this fuzzy uncertainty mainly comes from three aspects: the fuzziness of geotechnical parameters, the fuzziness of the slope instability damage state and the fuzziness of external actions. The fuzziness of geotechnical parameters refers to the influence of test errors, geotechnical group divisions, people’s incomplete grasp of the regularity of things, and other factors, leading to a range of values for basic variables such as the physical and mechanical parameters of geotechnical properties; the fuzziness of the slope instability damage state refers to the inability to clearly demarcate between the slope in the stable state and the failure state caused by the cumulative progressive nature of the slope deformation damage process; the fuzziness of the external action refers to the fuzzy description of the external action strength (such as the impact of groundwater, seismic forces, human activities, etc.) caused by the limitation of cognition and the risk of external actions. For the fuzziness of geotechnical parameters and slope destabilization damage state, the fuzzy mathematics method can be used as a solution, and for the fuzziness of external action, it can be solved by taking the empirical value.
In order to assess the stability state of the slope as accurately as possible, the influence of fuzzy uncertainty factors in slope engineering should be considered. The main research milestones include the following: (1) Juang et al. [5], Dodagoudar et al. [6], Giasi et al. [7], and Wang et al. [8] described the geotechnical parameters as fuzzy numbers and transformed them into interval numbers by taking fuzzy cut sets, then obtained the fuzzy set of slope safety factors using the limit equilibrium method or calculated the reliability index of the slope using the statistical moment point estimation method. This type of method is widely used because of the clear principle, relatively simple operation process and more comprehensive calculation results. However, it also has some drawbacks, such as the calculation error from the statistical moment point estimation method, the interval expansion problems that exist in the calculation process, the inconsistent results from different fuzzy point estimation methods (e.g., Wang et al. [8] and Zhang et al. [9]) and the large influence of different types of fuzzy affiliation functions on slope reliability. (2) Tan et al. [10] transformed the fuzzy variables into random variables by equivalent transformation and calculated the fuzzy random reliability index of each finite unit in the slope profile. This type of method can directly transform fuzzy variables into random variables to facilitate the use of conventional reliability analysis methods; however, when the geotechnical parameter affiliation function is complex, the equivalence transformation process is difficult and the effectiveness of the method needs to be verified. (3) Khakestar et al. [11], Zhang [12], Zhao et al. [13], Wang et al. [14] and Zhou et al. [15] made fuzzy judgments on the slope stability influence factors, constructed the fuzzy matrix, and determined the risk level of the slope by fuzzy comprehensive evaluation. This type of method can obtain the classification index of slope stability grade, and it can fully consider a variety of environmental influencing factors, and there is no complicated calculation process. In the actual operation, the determination of the weight of the influencing factors is subjective and empirical, and the result can not contain as much information as reliability methods.
In fact, after converting the geotechnical fuzzy numbers into interval numbers by taking fuzzy cut sets (like the first type of method), the non-probabilistic reliability method can also be used to analyze the stability of the slope. The non-probabilistic reliability method is a kind of convex-model-based-method [16] which can consider the uncertainty of parameters and evaluate the stability of the slope without the specific distribution characteristics of the parameters. A non-probabilistic reliability method based on an ellipsoidal model (a kind of convex model) not only can avoid the interval expansion problem but can also analyze all the points from the whole interval. Since the fuzzy geotechnical parameters are transferred into interval numbers by fuzzy cut set theory, it is more reasonable to use the non-probabilistic reliability method.
This paper proposes a fuzzy-set-theory-based non-probabilistic reliability analysis method for the slope. Firstly, the fuzzy distribution characteristics of geotechnical parameters are described by the fuzzy affiliation function, and then the fuzzy numbers of geotechnical parameters are transformed into interval numbers using the λ -cut set method. Secondly, the slope performance function is constructed using the Bucher design and the response surface method. Thirdly, the non-probabilistic reliability index and failure degree of the slope at each cut set level are solved using the non-probabilistic reliability analysis method based on the ellipsoidal model. Finally, the overall failure degree of the slope is obtained by the weighted average method. The proposed method provides a reference basis for slope stability analysis considering the fuzziness of geotechnical parameters, and can be used to guide engineering practice. The novelty of this method lies in the application of an ellipsoidal-model-based non-probabilistic reliability method to handle the fuzzy uncertainty of geotechnical parameters in slope engineering, the use of the failure degree as well as non-probabilistic reliability index to evaluate the slope stability state, and providing the results not only for each fuzzy cut set but also for the overall slope.

2. Fuzzy Characterization Method for Geotechnical Parameters

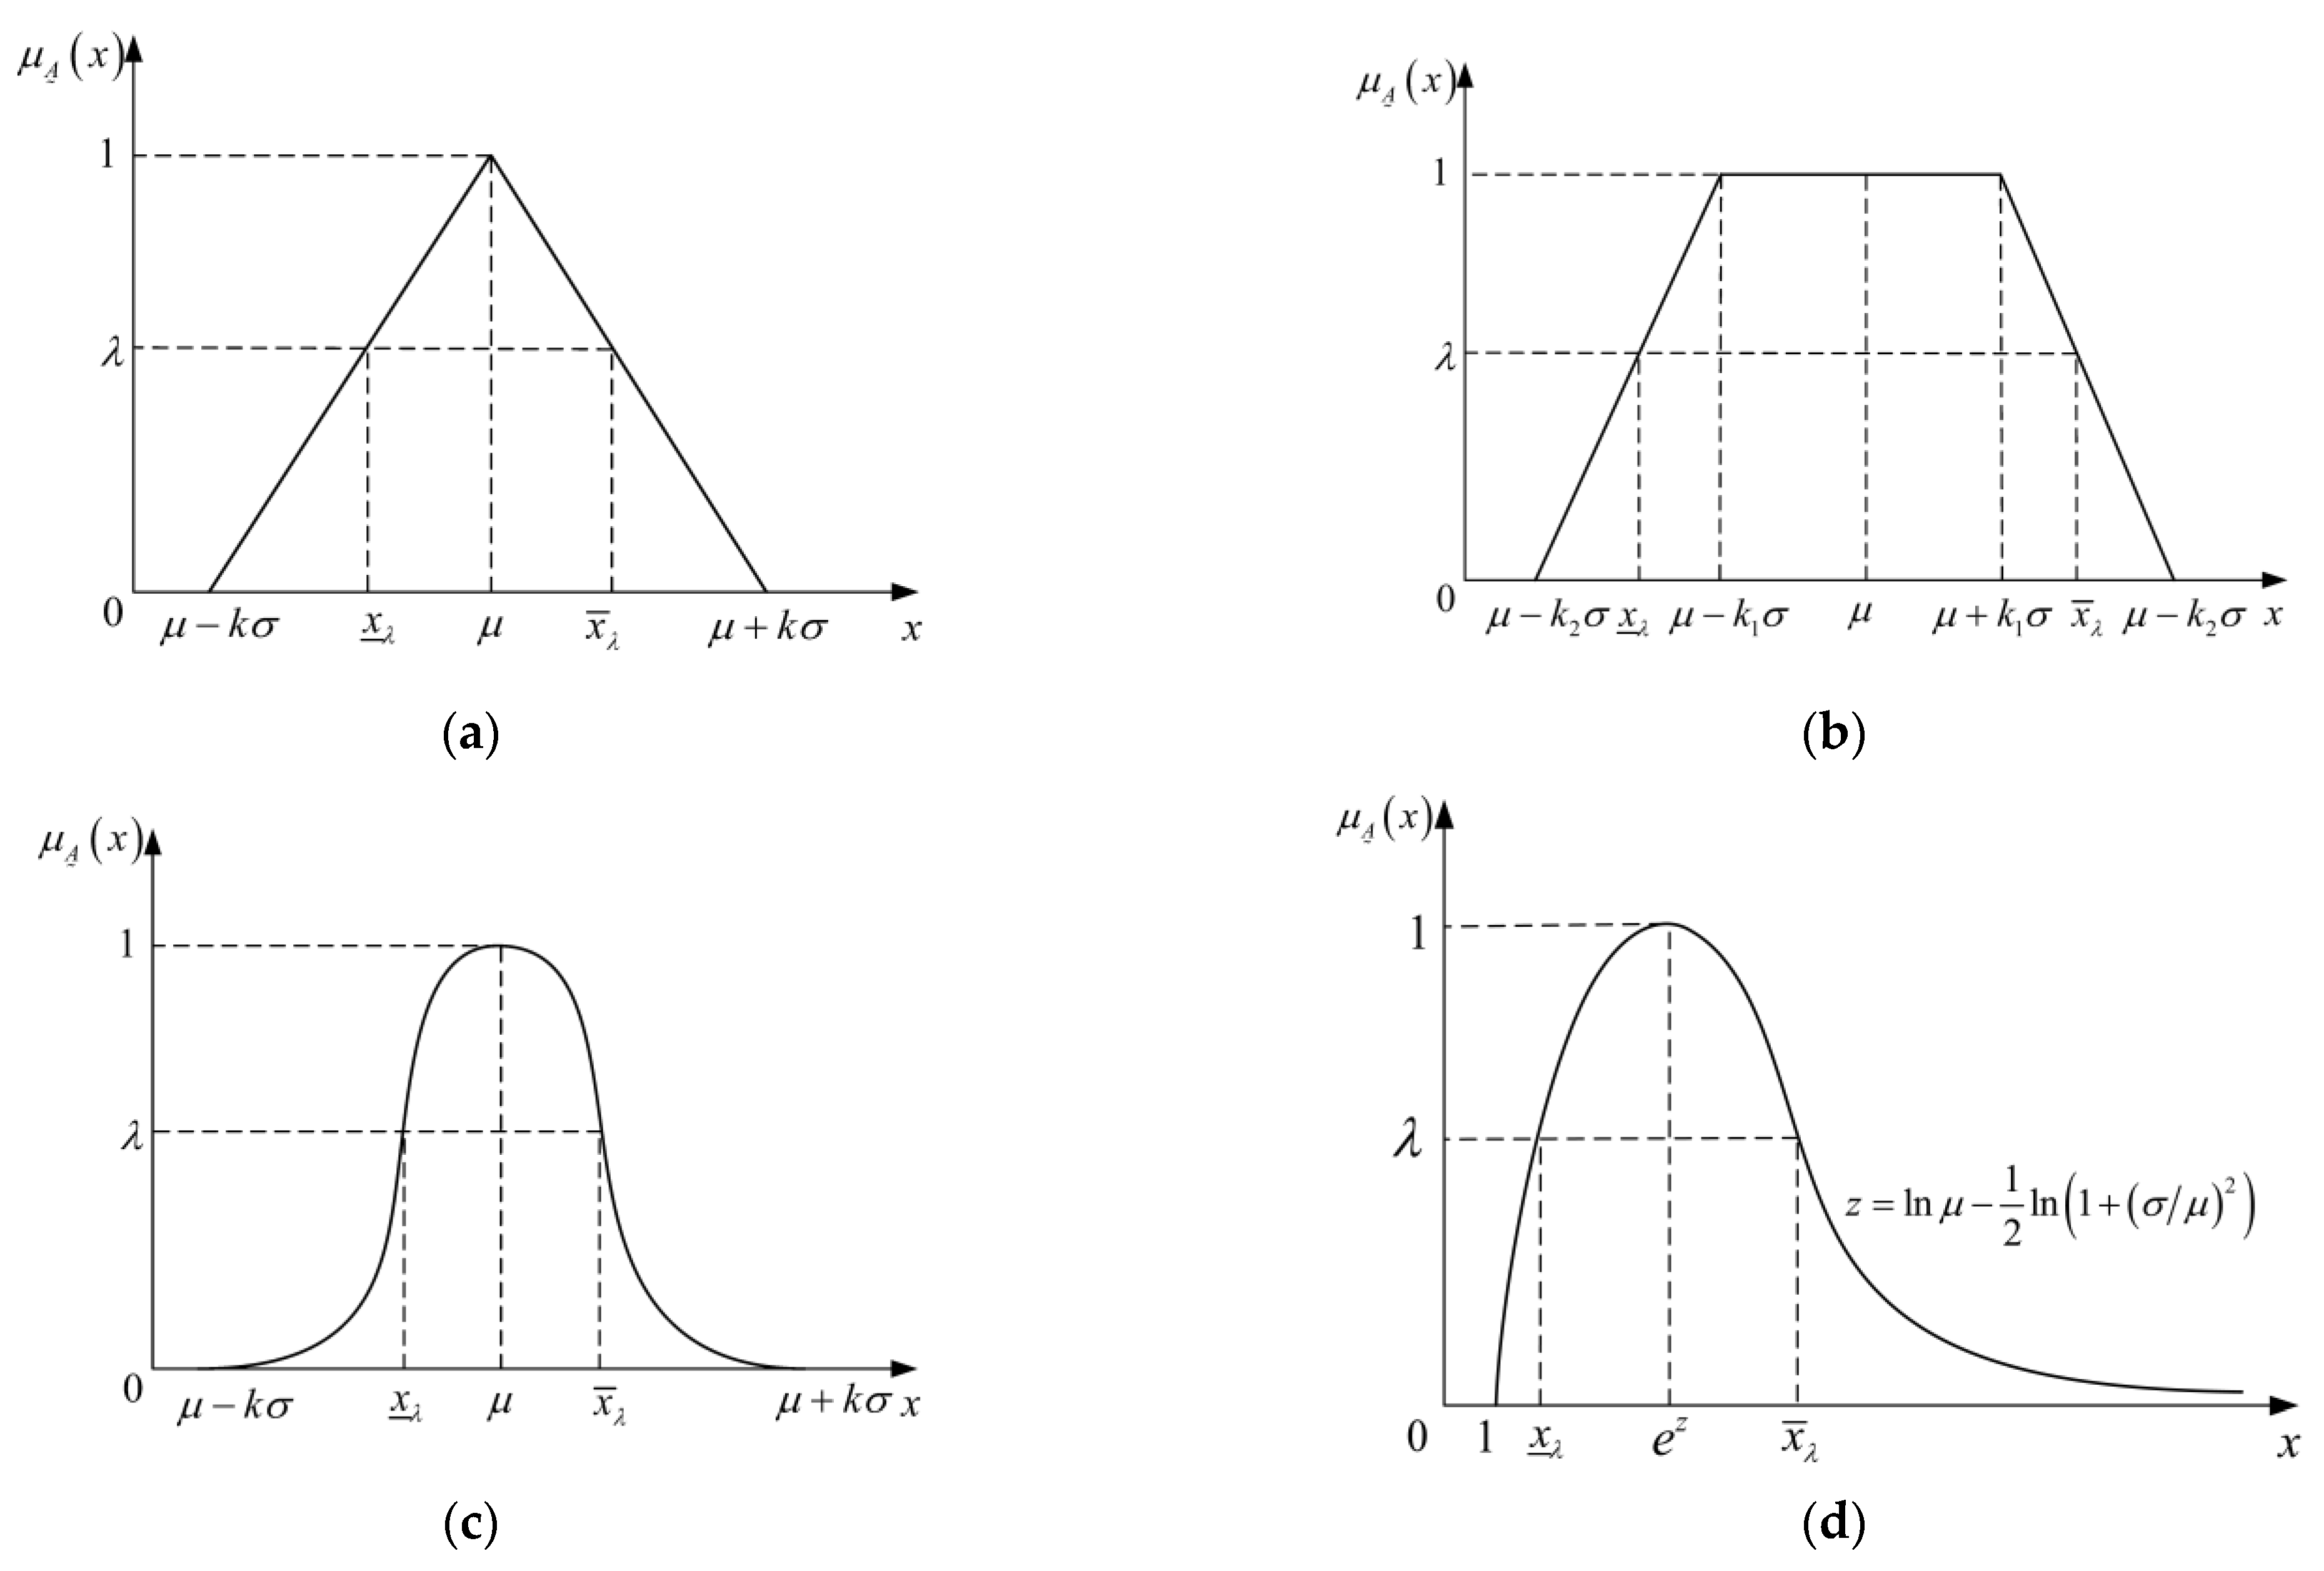
2.1. Fuzzy Affiliation Function

The fuzzy distribution characteristics of geotechnical parameters can be described by the fuzzy affiliation function. For an arbitrary element x in the region U, its degree of belonging to the set A ˜ can be expressed by the affiliation degree μ A ˜ x ; μ A ˜ x takes a value ranging from 0 to 1, and the set A ˜ is called a fuzzy set [17] in 18 the region U. The function composed of the affiliation degree of each element of the fuzzy set in the theoretical region U is called the affiliation function of the fuzzy set. The specific form of the affiliation function can be determined by various methods, such as the intuitive method, the fuzzy statistics method, the relative selection method and the fuzzy distribution fitting method. There are four types of fuzzy affiliation functions commonly used in slope engineering to describe the fuzziness of geotechnical parameters: the triangular distribution, the trapezoidal distribution, the normal distribution and the log-normal distribution, as shown in Figure 1.

2.2. Fuzzy Sets and Fuzzy Cut set Theory

Given a fuzzy set A ˜ U , for any λ [0, 1], let A λ = x x U , μ A ˜ x λ be the λ -cut set of fuzzy set A ˜ , which is the set of all elements in the region U whose affiliation to fuzzy set A ˜ is more than or equal to λ . By taking different values of λ , different λ -cut sets can be constructed, and thus the fuzzy set A ˜ can be transformed into several cut sets A ˜ λ corresponding to different values of λ . In each cut set A ˜ λ , the minimum value x _ λ and the maximum value x ¯ λ of the elements can be determined, and thus the corresponding interval [ x _ λ , x ¯ λ ] of the elements is obtained.
For the triangular fuzzy numbers (as shown in Figure 1a), by taking the λ -cut set of fuzzy set A ˜ , we can obtain the corresponding interval [ x _ λ , x ¯ λ ]. The values of the lower bound x _ λ and the upper bound x ¯ λ are as follows:
x _ λ = μ + λ 1 k σ x ¯ λ = μ + 1 λ k σ
where μ is the mean value of parameter x, σ is the standard deviation of parameter x, and k is the shape parameter (depending on the data available and accuracy of the results desired [6]) of the fuzzy numbers, k [0.5, 3].
For the trapezoidal fuzzy numbers (as shown in Figure 1b), by taking the λ -cut set of fuzzy set A ˜ , we can obtain the corresponding interval [ x _ λ , x ¯ λ ]. The values of the lower bound x _ λ and the upper bound x ¯ λ are as follows:
x _ λ = μ + λ 1 k 2 σ λ k 1 σ x ¯ λ = μ + 1 λ k 2 σ + λ k 1 σ
where μ and σ have the same meanings as above, k 1 and k 2 are the shape parameters (depending on the data available and the accuracy of the results desired [6]) of the trapezoidal fuzzy numbers, k 1 ,   k 2 [0.5, 3].
For the normal fuzzy numbers (as shown in Figure 1c), by taking the λ -cut set of fuzzy set A ˜ , we can obtain the corresponding interval [ x _ λ , x ¯ λ ]. The values of the lower bound x _ λ and the upper bound x ¯ λ are as follows:
x _ λ = μ σ 2 l n λ + 1 λ e x p k 2 / 2 x ¯ λ = μ + σ 2 l n λ + 1 λ e x p k 2 / 2
where μ , σ and k have the same meanings as above.
For the log-normal fuzzy numbers (as shown in Figure 1d), by taking the λ -cut set of fuzzy set A ˜ , we can obtain the corresponding interval [ x _ λ , x ¯ λ ]. The values of the lower bound x _ λ and the upper bound x ¯ λ are as follows:
x _ λ = e x p l n μ 1 2 l n 1 + σ / μ 2 l n 1 + σ / μ 2 2 l n λ + 1 λ e x p k 2 / 2 x ¯ λ = exp ln μ 1 2 ln 1 + σ / μ 2 + ln 1 + σ / μ 2 2 ln λ + 1 λ exp k 2 / 2
where μ , σ and k have the same meanings as above.
In this way, using a specific type of fuzzy number affiliation function to describe the fuzzy distribution of geotechnical parameters and taking different λ -cut sets of the fuzzy number affiliation function, several corresponding intervals are obtained, and thus the fuzzy numbers are converted into interval numbers.

3. Non-Probabilistic Reliability Analysis Method Based on the Ellipsoidal Model

The non-probabilistic reliability analysis method is a structural stability assessment method that uses a convex model [16] to describe parameter uncertainty, which requires only the value bounds of uncertain variables without their specific distribution characteristics. Currently, the commonly used convex models are the interval model and the ellipsoidal model [18,19,20]. Compared with the interval model, the ellipsoidal model provides a more compact uncertainty region, has the ability to consider the correlation between parameters when reflecting the unknown and bounded nature of uncertain parameters, and provides better results in line with the actual geotechnical engineering situation. In this paper, the ellipsoidal model non-probabilistic reliability analysis method was adopted for the example analysis.

3.1. Construction of the Ellipsoidal Model

To construct the ellipsoidal model, it is necessary to know the center point and the radius of the ellipsoidal model, and the covariance matrix of the ellipsoidal variables. For the n-dimensional variables X 1 , X 2 , …, X n , when the value interval of each variable is known, the coordinates of the centroid X i c of the value interval and the deviation X i r in the X i i = 1 ,   2 ,   ,   n -direction can be obtained from Equation (5):
X i c = X ¯ i + X _ i 2 X i r = X ¯ i X _ i 2
where X ¯ i and X _ i represent the upper and lower bounds of the interval number, respectively.
The centroid of the ellipsoidal model X i o coincides with the centroid of the value interval, and the ellipsoidal radius e i is greater than the absolute value of the difference between the variable and the centroid, i.e.,
X i o = X i c = X ¯ i + X _ i 2 e i > X i X i c
The value intervals of all the variables in space represent a hyper-cube, and the ellipsoidal model is constructed by solving for the minimum external hyper-ellipsoid of this hyper-cube. The ellipsoidal covariance matrix is obtained by solving it using the Lagrange multiplier method [21]:
C X = d i a g n X 2 1 r ,   n X 2 2 r ,   ,   n X 2 n r
Let X = X 1 ,   X 2 ,   ,   X n T . The ellipsoidal model is constructed as
E X o , Ω = X X X o T Ω X X o 1
where Ω is the inverse matrix of C X .
Introduce an n × 1 dimensional vector u = u 1 ,   u 2 ,   ,   u n T and define u as
u = Ω 0.5 X X o
Substituting Equation (9) into Equation (8), the original ellipsoidal model is transformed to
E = u u T u 1
where E is a set of unit ellipsoids in the standard vector space U.
Equation (9) can be written as follows:
X = Ω 0.5 1 u + X o = C X 0.5 u + X o
Let C X i = n X 2 i r i = 1 ,   2 ,   ,   n . Equation (11) can then be written as follows:
X i = C X i 0.5 u i + X i o i = 1 ,   2 ,   ,   n
Using the above equation, the original interval variables X = X 1 ,   X 2 ,   ,   X n T are changed into the standardized variables u = u 1 ,   u 2 ,   ,   u n T by the constructed ellipsoidal model (in the standard space, the ellipsoidal model is shown as a circular sphere model). Thus, the structure performance function M = G X 1 ,   X 2 ,   ,   X n is changed into the standardized performance function M = G u 1 ,   u 2 ,   ,   u n .

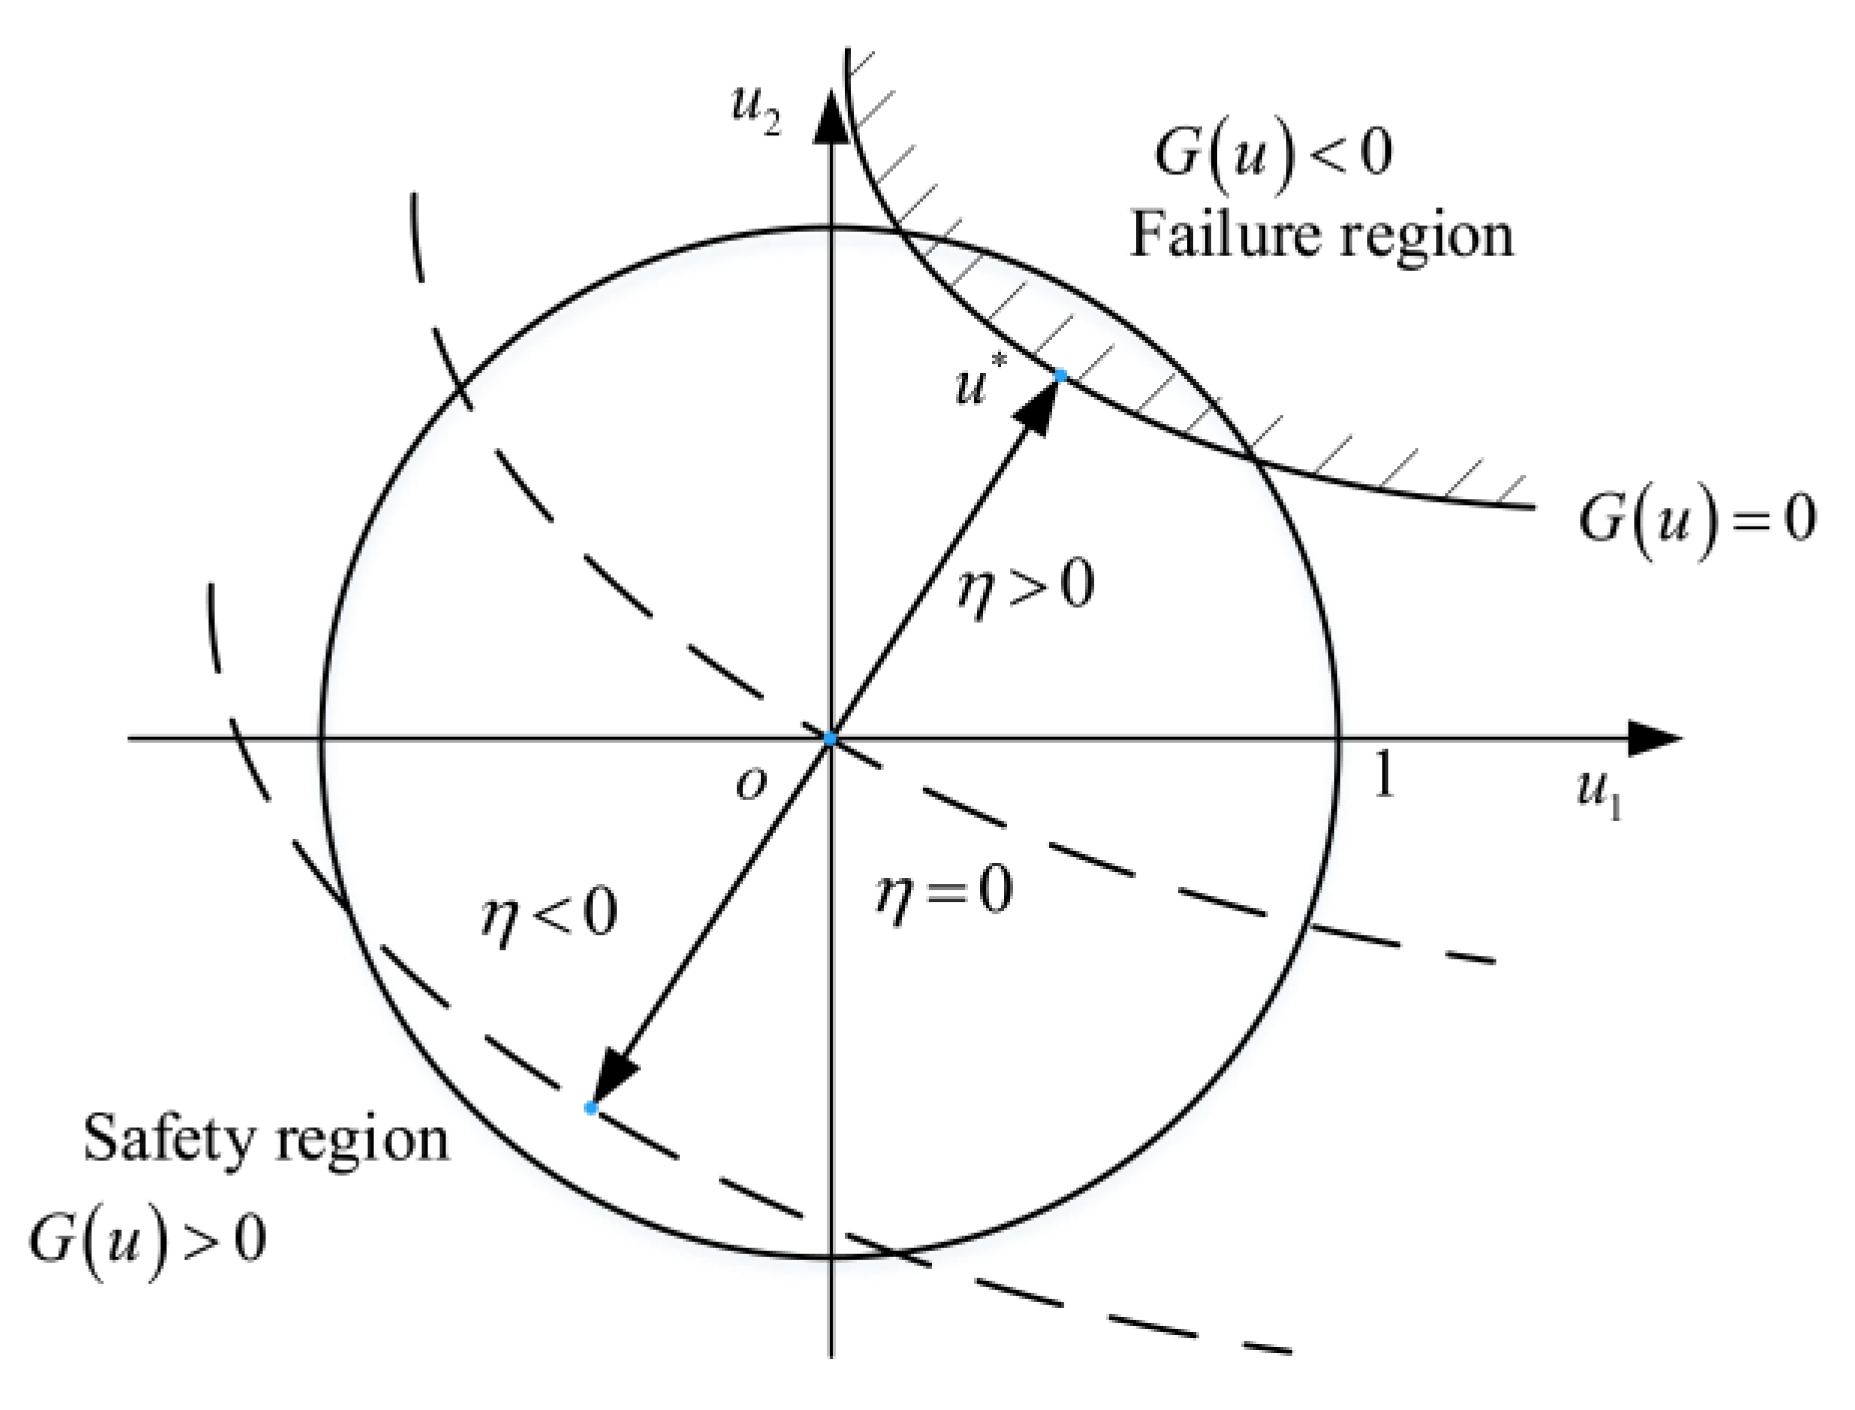
3.2. Non-Probabilistic Reliability Analysis

In the ellipsoidal model, the non-probabilistic reliability index η denotes the shortest distance from the coordinate origin to the limit state surface in the standard coordinate system (as shown in Figure 2). The non-probabilistic reliability index η is defined as follows [22]:
η = s g n G 0 min u s . t .   G u 1 , u 2 , , u n = 0
The value of the non-probabilistic reliability index η can be calculated using the mathematical programming method, the direct iterative method and other methods [23]. The HL-RF iterative algorithm [24,25] has the advantages of a clear concept, simple iteration format, and rapid convergence. The main idea of this method is to select an initial iteration point, and then determine the next iteration point according to the iteration format until the result satisfies the convergence condition (more information about the HL-RF algorithm can be found in the related studies by Santosh et al. [26] and Yang and Zhao [27]). In this paper, this method will be used to calculate the non-probability reliability index of the slope.
From Figure 2, it can be seen that when the value of the non-probabilistic reliability index η is more than 1, the whole standardized ellipsoidal region is in the safe region, indicating that the structure is in a safe state; when the value of the non-probabilistic reliability index η is less than −1, the whole standardized ellipsoidal region is in the failure region, indicating that the structure is in a failure state; when the value of non-probabilistic reliability index η is between −1 and 1, part of the standardized ellipsoidal region is in the safety region and part of the standardized ellipsoidal region is in the failure region, indicating that the structure has some possibility of failure. In this case, the non-probabilistic failure degree F can be used to evaluate the possibility of failure. The failure degree is defined as the ratio of the area of the ellipsoidal region in the failure region to the total area of the ellipsoid (in three-dimensional space, the failure degree is defined as the volume ratio). When η > 1 , the value of the failure degree of the structure is 0; when η < 1 , the value of the failure degree of the structure is 1; when 1 < η < 1 , the value of the failure degree of the structure is between 0 and 1, and it can be obtained by computing the area (volume) of the ellipsoidal region in the failure region using the integration method.
When the expression of the structure performance function is very complicated, it is difficult to compute the failure degree using the integration method. To this end, a simplified method proposed by Jiang et al. [28] can be used: firstly, the limit state function of the structure is expanded into a Taylor series at the design point in the standard space and taken to the quadratic term. The design point is the point in the standard space with the minimum distance from the origin on the limit state surface. The origin of coordinates in standard space can be chosen as the initial design point, and the subsequent design points are determined by iterative calculation. Secondly, the standard space is rotated and changed from the standard space U to the space V (as shown in Figure 3) using matrix theory to obtain the average curvature at the design point. Finally, the area of the structure in the failure region (volume) is solved using the integration method. According to this method, the non-probabilistic failure degree can be calculated using the following equation:
F = 1 s g n v n 2 + s g n v n 1 2 I 1 v n 2 n + 1 2 , 1 2 + κ n + 1 1 B n + 1 2 , 1 2 1 v n 2 n + 1 2
where n is the dimension of the uncertain parameters, κ is the average curvature at the design point, v n is the corresponding value of the feature plane position, B ,   is the Beta function, and I · ,   is the Beta function with incomplete regularization.

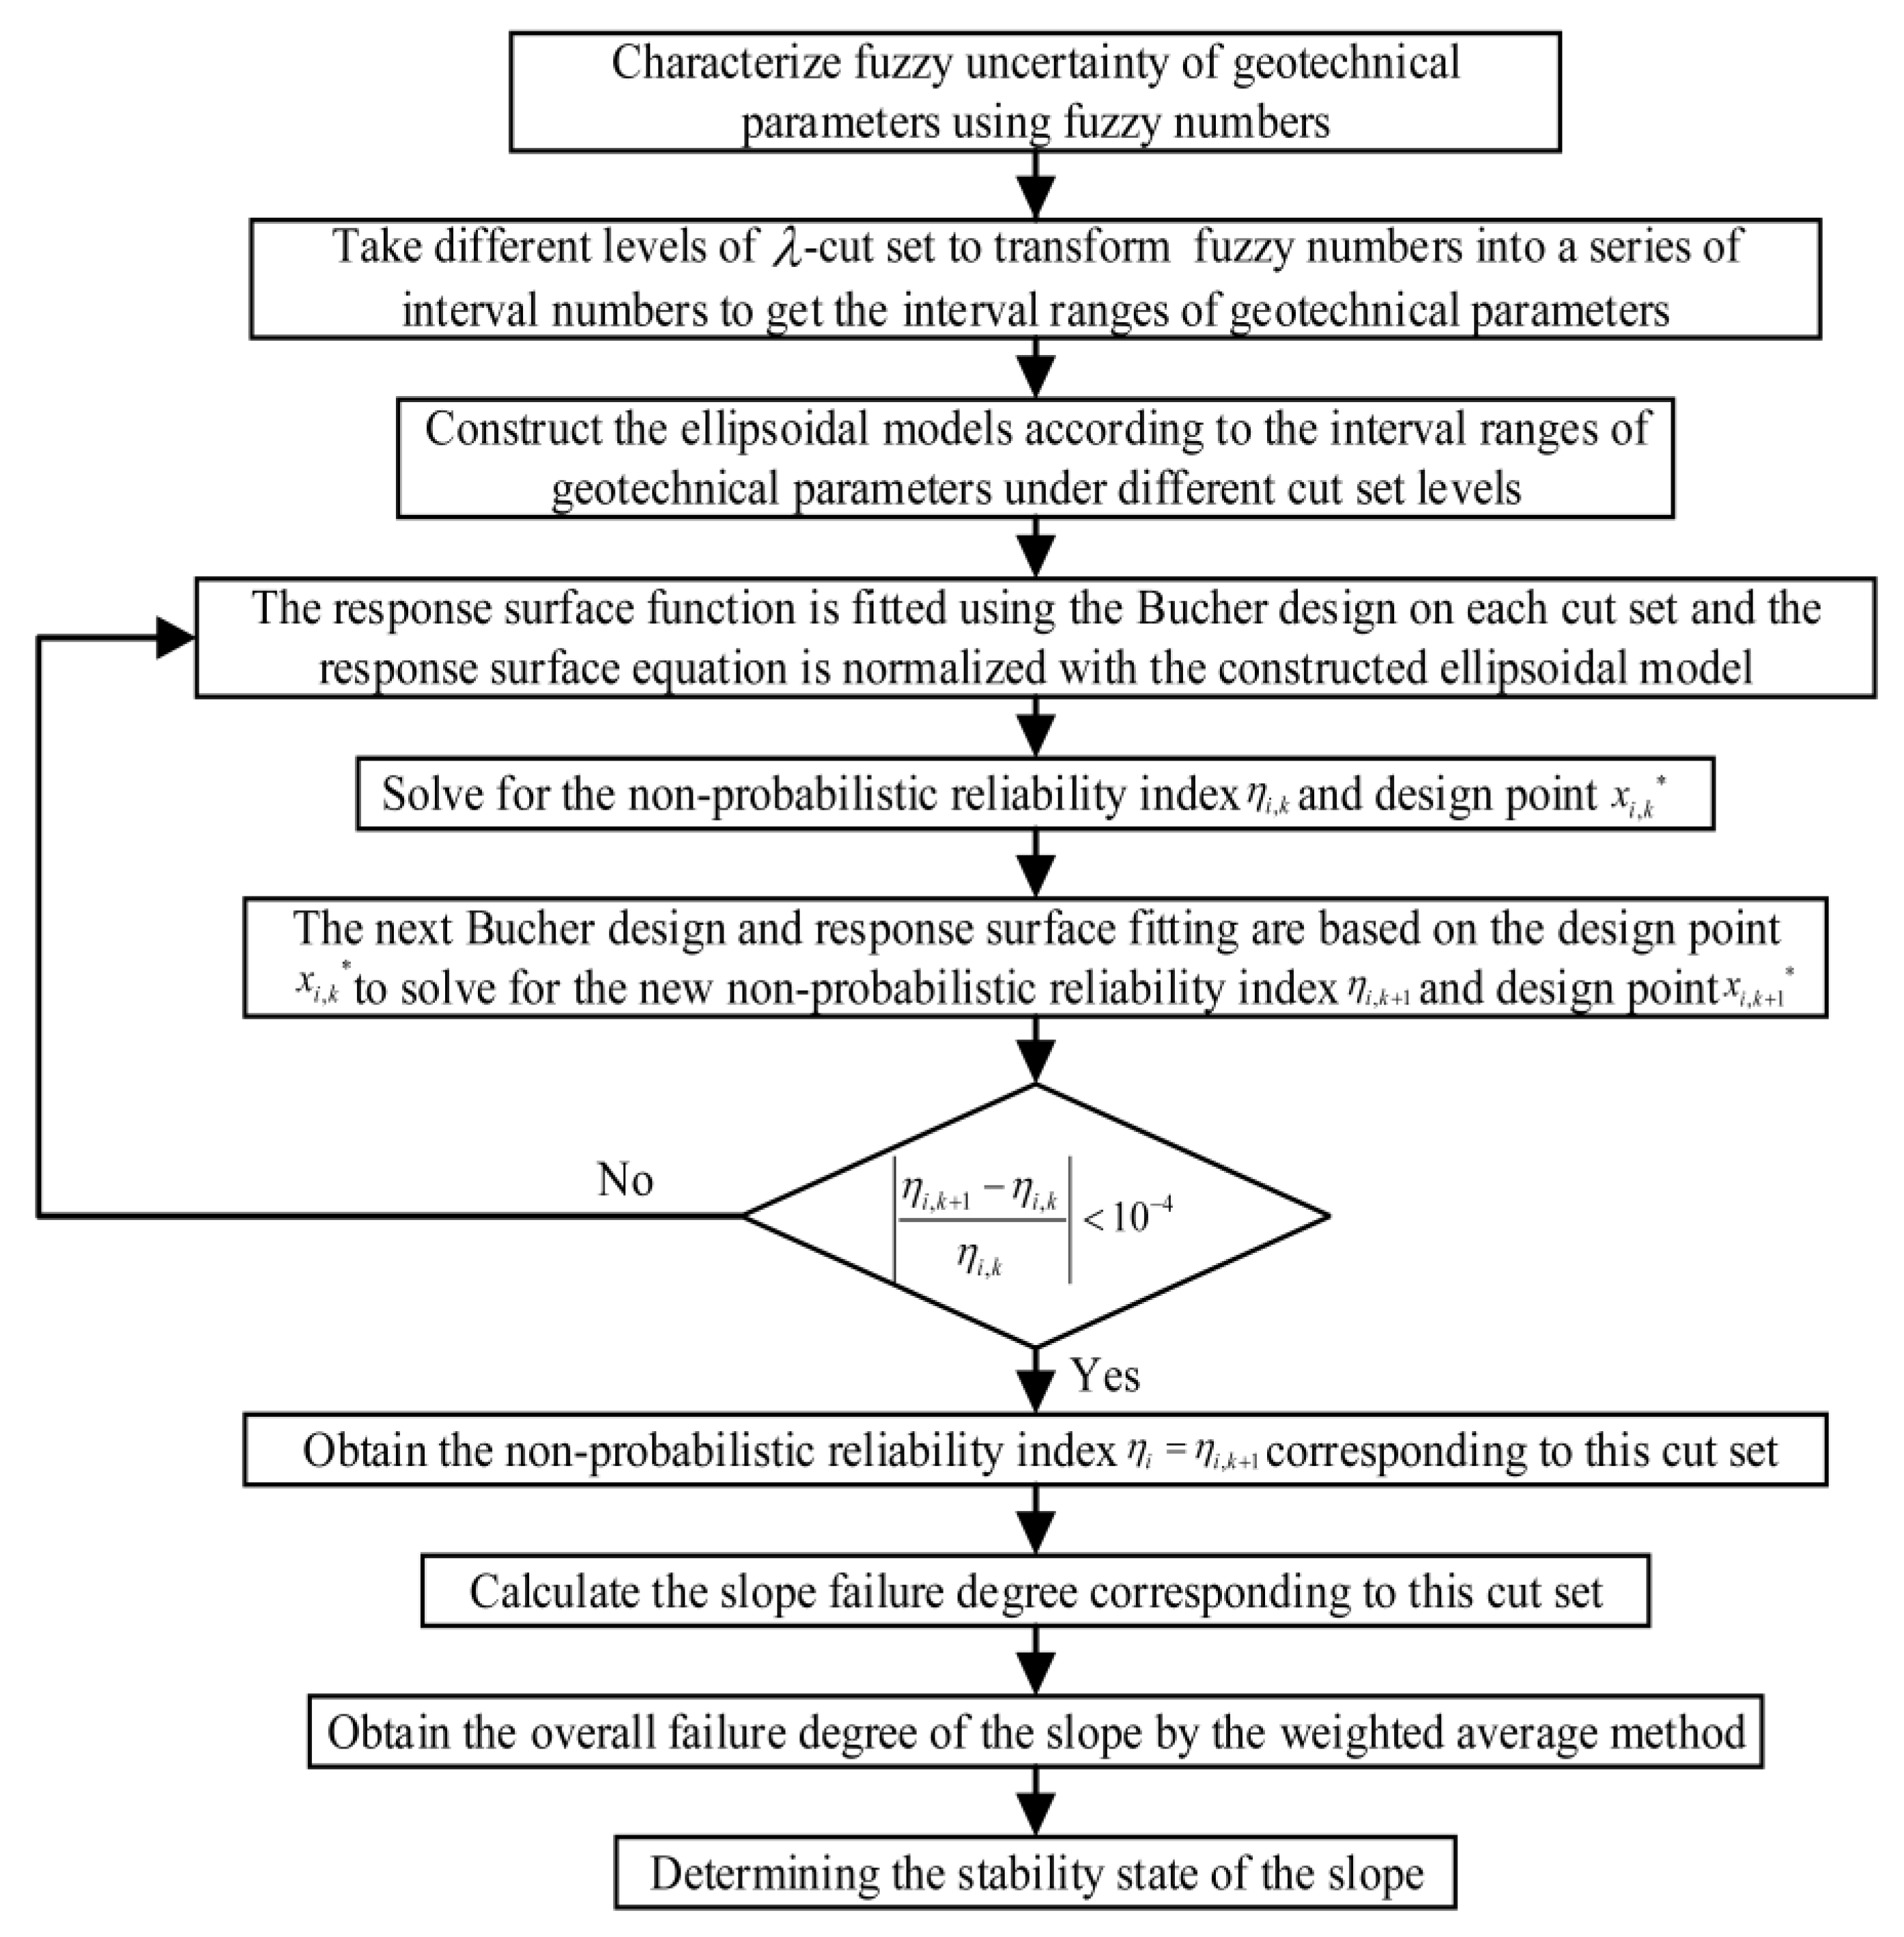
4. Non-Probabilistic Reliability Analysis Method for Slopes Based on Fuzzy Set Theory

(1) Geotechnical parameters are described as certain specific types of fuzzy numbers according to their fuzzy uncertainty characteristics. By taking m different levels of a λ -cut set, the fuzzy numbers are transformed into the corresponding interval numbers for each λ -cut set, and the value range of each interval number is obtained.
(2) On the cut set of λ i (i = 1, 2, …, m), the corresponding ellipsoidal model is constructed according to the interval ranges of geotechnical parameters, and the center X i o , the radius e i and the covariance matrix C X of the ellipsoidal model are calculated using Equations (6) and (7). Then, 2n + 1 groups of sample points are selected according to the interval range of the geotechnical parameters by the Bucher design [29], and the slope safety factor corresponding to each group of sample points is calculated using the limit equilibrium method. Using Kriging-based or PCE-based surrogates [30,31] to approximate the slope performance function can improve prediction accuracy. However, too many basis functions tend to introduce more pending coefficient terms, which leads to a sharp increase in the frequency of calling the original analytical model. Given this consideration, a quadratic polynomial response surface function without cross terms is used in this paper. A quadratic polynomial response surface function without cross terms is established as the approximate slope performance function:
M = G X 1 ,   X 2 ,   ,   X n = F s X 1 ,   X 2 ,   ,   X n F s 0 = a + i = 1 n b i X i + i = 1 n c i X i 2
where F s 0 is the allowable safety factor of the slope and a ,   b i ,   c i i = 1 ,   2 ,   ,   n are the factors of the polynomial that is to be determined.
According to Equation (12), the above approximate slope performance function can be standardized by the ellipsoidal model:
M = G X = G u = a + i = 1 n b i C X i 0.5 u i + X i c + i = 1 n c i C X i 0.5 u i + X i c 2
Firstly, an initial value of the non-probabilistic reliability index η i , k and a design point x i , k can be obtained by the HL-RF algorithm in the approximate limit state surface ( G u = 0 ). Secondly, a new run of the Bucher design is performed based on the design point x i , k , and a new response surface is constructed and standardized to obtain a new value of the non-probabilistic reliability index η i , k + 1 and a new design point x i , k + 1 . Thirdly, if η i , k and η i , k + 1 satisfy the convergence condition
η i , k + 1 η i , k η i , k < 10 4
take η i = η i , k + 1 as the slope non-probabilistic reliability index of this cut set. Otherwise, repeat the Bucher design (each time, a new Bucher design is conducted using the design points obtained from the previous step), response surface establishment and non-probabilistic reliability calculation process until the convergence condition is satisfied. Finally, calculate the slope failure degree Fi of this cut set using Equation (14).
(3) After the non-probabilistic reliability indexes and failure degrees of the slope from all the λ -cut sets are acquired, the overall failure degree of this slope is obtained by the weighted average method [8,32] as follows:
F A = λ 1 F 1 + λ 2 F 2 + + λ m F m λ 1 + λ 2 + + λ m
In this way, not only the non-probabilistic reliability indexes and failure degrees of the slope at each cut set can be obtained to judge the stability state of the slope at that cut set, but the overall failure degree of the slope can also be obtained to judge the overall stability state of the slope. The specific analysis process is shown in Figure 4.

5. Example Analysis

5.1. Basic Information

A two-layer slope from the literature [33] was studied, and the cross-sectional dimensions of the slope are shown in Figure 5. The weight γ of both the upper and lower soil layers is 20 kN/m3, the modulus of elasticity E is 100 MPa, and Poisson’s ratio μ is 0.3. No water table or external water was considered. So the total stress method is appropriate. The subsequent study uses the Bishop method in the limit equilibrium method as the basis for calculating the slope safety factor. The statistical characteristics of the shear strength parameters of each soil layer are detailed in Table 1.
In practical engineering, the distribution types of the fuzzy affiliation function of geotechnical parameters are determined using various methods (e.g., fuzzy distribution fitting method) according to their fuzzy distribution characteristics. In this paper, in order to analyze the influence of different fuzzy number types on the calculation results, four types of fuzzy numbers (triangular fuzzy numbers, trapezoidal fuzzy numbers, normal fuzzy numbers and lognormal fuzzy numbers) for the soil property parameters are considered. Since the shape parameters (k, k1, k2) of the fuzzy affiliation function affect the upper and lower bounds of the parameter interval, they are also considered. When the shape parameters with different distribution forms of geotechnical parameter affiliation functions take smaller values, the reliability index calculated by the fuzzy point estimation method is large and the failure probability is small, which will overestimate the slope stability reliability [9]. Similarly, the shape parameter k is set as 2.0, 2.5 and 3.0 for triangular fuzzy numbers, normal fuzzy numbers, and lognormal fuzzy numbers, and k1 = 1.5 with k2 = 2.0, k1 = 1.0 with k2 = 2.5 and k1 = 0.5 with k2 = 3.0 are taken for trapezoidal fuzzy numbers. There are various options for the cut levels [32,34]. To balance the efficiency and the accuracy of the calculation results, the cut levels of a λ -cut set were set as 0.00, 0.05, 0.10, 0.15, 0.20, 0.25, 0.30, 0.35, 0.40, 0.45, 0.50, 0.55, 0.60, 0.65, 0.70, 0.75, 0.80, 0.85, 0.90, and 0.95.
Using the method in Section 2.2, the parameter value intervals corresponding to different λ -cut sets can be easily obtained. Due to the limited space, only the value intervals of soil parameters obtained from triangular fuzzy numbers (i.e., treating the soil parameters as triangular fuzzy numbers) are shown in Table 2.

5.2. Calculation Results and Analysis

5.2.1. Influences of Different Fuzzy Number Types and Shape Parameters on the Non-Probabilistic Reliability of the Slope

Considering the case of the allowable safety factor F s 0 = 1.0 , the non-probabilistic reliability indexes and failure degrees of the slope obtained from different types of fuzzy numbers (i.e., the soil parameters are considered different types of fuzzy numbers) were calculated, and the results are shown in Figure 6.
In Figure 6, with the increase in λ -cut set levels, the non-probabilistic reliability indexes of the slope increased while the failure degrees decreased, and the amplitude of fluctuation of non-probabilistic reliability indexes increased while the amplitude of fluctuation of failure degrees decreased. In particular, when the cut set level λ was more than 0.9, the changes in the non-probabilistic reliability indexes were significant.
When considering the soil parameters as triangular fuzzy numbers, normal fuzzy numbers or log-normal fuzzy numbers, with the reduction of the k value, the non-probabilistic reliability indexes of the slope grew while the failure degrees decreased. Moreover, the difference between the non-probabilistic reliability indexes of the slope caused by different k values became more pronounced with the rise in the cut set level. When considering the soil parameters as trapezoidal fuzzy numbers, with the change in cut set level λ , the larger the difference between the shape parameters k1 and k2 was, the larger the amplitudes of fluctuation of non-probabilistic reliability indexes and failure degrees were.
To further compare the effects of different types of fuzzy numbers on the non-probabilistic reliability indexes and failure degrees of the slope, the calculation results in Figure 6 are organized by shape parameter in Figure 7.
In Figure 7, the non-probabilistic reliability indexes based on different types of fuzzy numbers were relatively close when the cut set level λ was small, but the failure degrees were different. To be specific, with the same value of k (k2), the slope failure degrees obtained from trapezoidal fuzzy numbers were larger, while those obtained from triangular fuzzy numbers and normal fuzzy numbers were medium, and those from lognormal fuzzy numbers were smaller. The slope failures based on different types of fuzzy numbers were close (except for the case of trapezoidal k2 = 2.0) when the cut set level λ was large, and they all converged or decreased to zero, while the non-probabilistic reliability indexes were different. Specifically, with the same value of k (k2), the non-probabilistic reliability indexes obtained from triangular fuzzy numbers were larger, while those obtained from log-normal fuzzy numbers and normal fuzzy numbers were medium (and the two results were consistent), and those from trapezoidal fuzzy numbers were smaller.

5.2.2. Influences of Different Allowable Safety Factors on the Non-Probabilistic Reliability of the Slope

According to the slope failure degree corresponding to each cut set level, the overall slope failure degree can be calculated using Equation (18); the results are shown in Table 3. Since the allowable safety factor of the slope in practical engineering is usually greater than 1 for safety stock, the overall slope failure degree is also given in Table 3 when the slope allowable safety factor F s 0 is 1.1 or 1.2. For comparison, the slope failure probabilities obtained by the fuzzy point estimation method (a reliability analysis approach that combines the fuzzy set theory and the statistical moment point estimation method) are also listed in Table 3.
From Table 3, it can be found that for triangular fuzzy numbers, normal fuzzy numbers and log-normal fuzzy numbers, the overall failure degree of the slope grew with the increase in the shape parameter. For trapezoidal fuzzy numbers, the overall failure degree of the slope was not only affected by the value of k2, but also by the difference between k1 and k2 (which affects the shape of the trapezoidal affiliation function). When k and k2 had the same value, the overall failure degree of the slope from trapezoidal fuzzy numbers was the largest, while those from triangular fuzzy numbers and normal fuzzy numbers were in the middle, and that from log-normal fuzzy numbers was the smallest. Additionally, the overall failure degrees of the slope based on different types of fuzzy numbers rise with the increase in the allowable safety factor of the slope, which is consistent with engineering practice.
Comparing the non-probabilistic failure degree of the slope obtained by the method proposed in this paper with the failure probability of the slope calculated by the fuzzy point estimation method, the overall failure degree and the failure probability were essentially consistent in order of magnitude, however, the influence of different types and shape parameters of fuzzy affiliation functions on the failure probability of the slope was greater. A Monte-Carlo-simulation-based reliability analysis for the slope without consideration of the fuzziness factors was also conducted, and the calculation results were 0.010350 (when the allowable safety factor is 1.0), 0.023279 (when the allowable safety factor is 1.1) and 0.050221 (when the allowable safety factor is 1.2). Comparing the above results with the data in Table 3, the non-probabilistic failure degree of the slope was closer to the Monte Carlo simulation result than the slope failure probability calculated by the fuzzy point estimation method. Part of the reason is that the non-probabilistic approach considers the whole geotechnical parameter interval while the fuzzy point estimation method uses only a finite combination of interval points.
Tan [35] pointed out that considering the fuzziness of geotechnical parameters will rise the failure probability of slopes. According to this view, it is suggested to use the triangular fuzzy number and take the shape parameter as 3.0 for this slope. The reason why the trapezoidal fuzzy number is not recommended is that the results obtained from this type of fuzzy number were more complex and varied greatly since there were two shape parameters (k1 and k2) need to be determined. It should be noted that in the actual slope project, the selections of geotechnical fuzzy number type and shape parameter should be determined according to the test data. The shape parameter k determines the maximum possible calculation interval for geotechnical parameters, and it is necessary to consider the local averaging effect of parameter variability from the experimental values of points to the calculated values of units [8]. And the value of k is influenced by many factors, such as the variation and correlation of parameters and the sample size.

5.2.3. The Relationship between Non-Probabilistic Reliability Indexes and Failure Degrees

In traditional non-probabilistic analysis, whether the non-probabilistic reliability index is greater than 1 is usually used as the criterion to judge whether the structure is safe. According to this method, if the non-probabilistic reliability index of the slope is greater than 1, the possibility of the slope instability is 0 and the slope is in a safe state, which is not controversial; if the non-probabilistic reliability index of the slope is less than 1, the slope is judged to be unstable, which may be too conservative under certain circumstances (such as when the actual possibility of instability is very small) and cause design waste.
All the data for the non-probabilistic reliability indexes and failure degrees of the slope obtained in the calculation process of this paper were compiled, and the distribution range of non-probabilistic reliability indexes and their corresponding failure degrees were counted when the non-probabilistic reliability index η was less than 1. The results are shown in Table 4.
As can be seen from Table 4, for this two-layer slope, in some cases where η < 1 (e.g., the failure degree of the slope is less than 0.01 for η > 0.9 ), the failure degree of the slope was not large and the corresponding risk level was still acceptable. Referring to the design criteria for failure probability of the slope in reliability analysis [36] (since there are no design criteria for the non-probabilistic failure degree of the slope at present, in view of the similarity between failure degree in non-probabilistic reliability analysis and failure probability calculated from a Monte Carlo simulation in the reliability analysis, the non-probabilistic failure degree herein is used as an analogy to the failure probability), 0.9 can be taken as the evaluation criterion for the non-probabilistic reliability index of the slope. According to the traditional non-probabilistic reliability analysis method, the slope is judged to be unstable when 0.9 < η < 1 ; however, in this paper, this slope was considered to be stable with a small failure degree.
For actual slope projects, the distribution ranges of non-probabilistic reliability indexes and their corresponding failure degrees are not known in advance or need not be counted in large quantities. A specific failure degree evaluation standard (e.g., 0.03, 0.01 or 0.001) can be given according to the acceptable risk level of the project, and then the overall failure degree of the slope can be calculated using the proposed method in this paper and compared with the failure degree evaluation standard to judge the stability state of the slope. In some cases, when the slope failure is not considered for the sake of simplicity, a value smaller than 1 can be given as the evaluation criterion of the non-probabilistic reliability index (e.g., 0.85, 0.9 or 0.95), and then the non-probabilistic reliability of the slope can be calculated using the non-probabilistic reliability method and compared with the evaluation criterion to determine the stability state of the slope.

6. Conclusions

By combining fuzzy set theory and the non-probabilistic reliability method based on the ellipsoidal model, a non-probabilistic reliability analysis method for the slope which can consider the fuzzy uncertainty of geotechnical parameters was proposed in this paper. And the following conclusions were drawn. First, compared with the fuzzy point estimation method, the non-probabilistic reliability method can avoid the interval expansion problem and also analyze the whole interval, thus the obtained results are more reasonable. Furthermore, the feasibility of the method was verified through the example analysis. Combining the fuzzy set theory with the non-probabilistic reliability method and applying it to slope engineering extends the application field of non-probabilistic theory and provides a new feasible solution for slope stability analysis. Additionally, both the non-probabilistic reliability indexes and failure degrees of the slope at each cut set level and the overall failure degree of the slope can be calculated by the proposed method. The calculation results of non-probabilistic reliability indexes and failure degrees of the slope are affected by the type of fuzzy numbers, the value of the shape parameter in the fuzzy affiliation function, and the allowable safety factor of the slope. Finally, when using the non-probabilistic reliability method to analyze slope stability, it is recommended that a specific value of failure degree (which is determined according to the actual requirements of the project) should be used as the judgment standard of the slope stability state to avoid over-conservative results.
In this paper, we consider the soil to be homogeneous because the focus of this study is to consider the fuzziness of the soil parameters, but in fact the spatial variability of the soil is important, which will be considered in a future study.

Author Contributions

Conceptualization, S.S.; methodology, J.Q.; software, J.Q.; formal analysis, W.G. and Z.Y.; investigation, K.P.; resources, S.S. and W.G.; data curation, K.P.; writing—original draft preparation, J.Q.; writing—review and editing, S.S. and W.G.; supervision, S.S. All authors have read and agreed to the published version of the manuscript.

Funding

This research was funded by the National Natural Science Foundation of China (No. 52008319).

Institutional Review Board Statement

Not applicable.

Informed Consent Statement

Not applicable.

Data Availability Statement

Not applicable.

Conflicts of Interest

The authors declare no conflict of interest.

References

  1. Uzhga-Rebrov, O.; Grabusts, P. Methodology for Environmental Risk Analysis Based on Intuitionistic Fuzzy Values. Risks 2023, 11, 88. [Google Scholar] [CrossRef]
  2. Mazarbhuiya, F.A.; Shenify, M. An Intuitionistic Fuzzy-Rough Set-Based Classification for Anomaly Detection. Appl. Sci. 2023, 13, 5578. [Google Scholar] [CrossRef]
  3. Ma, K.; Liu, G. Three-Dimensional Discontinuous Deformation Analysis of Failure Mechanisms and Movement Characteristics of Slope Rockfalls. Rock Mech. Rock Eng. 2022, 55, 275–296. [Google Scholar] [CrossRef]
  4. Chen, Z.; Lu, Z.; Ling, C.; Feng, K. Reliability analysis model of time-dependent multi-mode system under fuzzy uncertainty: Applied to undercarriage structures. Aerosp. Sci. Technol. 2022, 120, 107278. [Google Scholar] [CrossRef]
  5. Juang, C.H.; Jhi, Y.Y.; Lee, D.H. Stability analysis of existing slopes considering uncertainty. Eng. Geol. 1998, 49, 111–122. [Google Scholar] [CrossRef]
  6. Dodagoudar, G.R.; Venkatachalam, G. Reliability analysis of slopes using fuzzy sets theory. Comput. Geotech. 2000, 27, 101–115. [Google Scholar] [CrossRef]
  7. Giasi, C.I.; Masi, P.; Cherubini, C. Probabilistic and fuzzy reliability analysis of a sample slope near Aliano. Eng. Geol. 2003, 67, 391–402. [Google Scholar] [CrossRef]
  8. Wang, Y.; Jia, Z.; Li, X.; Wang, C.; Yu, H. Fuzzy random reliability analysis of slope based on fuzzy point estimate method. Rock Soil Mech. 2012, 33, 1795–1800. (In Chinese) [Google Scholar]
  9. Zhang, Y.; Li, Y.; Li, S.; Jiang, Q. Study of boundaries of membership function values for slope fuzzy reliability analysis. Rock Soil Mech. 2014, 35, 1157–1163. (In Chinese) [Google Scholar]
  10. Tan, X.; Hu, X.; Wu, K. Fuzzy random finite element reliability analysis of slope stability with fuzzy basic veriables and fuzzy states. Chin. J. Rock Mech. Eng. 2009, 28, 3952–3958. (In Chinese) [Google Scholar]
  11. Khakestar, M.S.; Hassani, H.; Moarefvand, P.; Madani, H. Application of multi-criteria decision making methods in slope stability analysis of open pit mines. J. Geol. Soc. India 2016, 87, 213–221. [Google Scholar] [CrossRef]
  12. Zhang, C. Synthetic evaluation on the slope stability of muddy submarine channel based on the fuzzy comprehensive method. J. Saf. Environ. 2019, 19, 1892–1897. (In Chinese) [Google Scholar]
  13. Zhao, Z.; Lyu, H.; Kang, S. Risk assessment of high slope landslide in open-pit mine based on comprehensive geophysical prospecting. IOP Conf. Ser. Earth Environ. Sci. 2022, 983, 012082. [Google Scholar] [CrossRef]
  14. Wang, Z.; Hu, M.; Zhang, P.; Li, X.; Yin, S. Dynamic Risk Assessment of High Slope in Open-Pit Coalmines Based on Interval Trapezoidal Fuzzy Soft Set Method: A Case Study. Processes 2022, 10, 2168. [Google Scholar] [CrossRef]
  15. Zhou, C.; Ouyang, J.; Liu, Z.; Zhang, L. Early Risk Warning of Highway Soft Rock Slope Group Using Fuzzy-Based Machine Learning. Sustainability 2022, 14, 3367. [Google Scholar] [CrossRef]
  16. Jiang, F.; Li, H.; Fu, J.; Hong, L. A RBF and active learning combined method for structural non-probabilistic reliability analysis. Acta Aeronaut. Astronaut. Sin. 2023, 44, 226667. (In Chinese) [Google Scholar]
  17. Zadeh, L.A. Fuzzy sets. Inf. Control 1965, 8, 338–353. [Google Scholar] [CrossRef] [Green Version]
  18. Hong, L.; Li, H.; Fu, J.; Li, J.; Peng, K. Hybrid active learning method for non-probabilistic reliability analysis with multi-super-ellipsoidal model. Reliab. Eng. Syst. Saf. 2022, 222, 108414. [Google Scholar] [CrossRef]
  19. Li, K.; Liu, H. Structural Reliability Analysis by Using Non-Probabilistic Multi-Cluster Ellipsoidal Model. Entropy 2022, 24, 1209. [Google Scholar] [CrossRef] [PubMed]
  20. Wang, C.; Qiang, X.; Fan, H.; Wu, T.; Chen, Y. Novel data-driven method for non-probabilistic uncertainty analysis of engineering structures based on ellipsoid model. Comput. Methods Appl. Mech. Eng. 2022, 394, 114889. [Google Scholar] [CrossRef]
  21. Tan, Z. A Study of Uncertainty Quantification and Reliability Analysis Method Based on Ellipsoid Model. Ph.D. Thesis, Zhejiang Sci-Tech University, Hangzhou, China, 2018. [Google Scholar]
  22. Kang, Z.; Luo, Y.; Li, A. On non-probabilistic reliability-based design optimization of structures with uncertain-but-bounded parameters. Struct. Saf. 2011, 33, 196–205. [Google Scholar] [CrossRef]
  23. Luo, Y.; Kang, Z.; Li, A. Study on structural non-probabilistic reliability index under convex models and its solution methods. Chin. J. Solid Mech. 2011, 32, 646–654. (In Chinese) [Google Scholar]
  24. Hasofer Abraham, M.; Lind Niels, C. Exact and Invariant Second-Moment Code Format. J. Eng. Mech. Div. 1974, 100, 111–121. [Google Scholar] [CrossRef]
  25. Rackwitz, R.; Flessler, B. Structural reliability under combined random load sequences. Comput. Struct. 1978, 9, 489–494. [Google Scholar] [CrossRef]
  26. Santosh, T.V.; Saraf, R.K.; Ghosh, A.K.; Kushwaha, H.S. Optimum step length selection rule in modified HL–RF method for structural reliability. Int. J. Press. Vessel. Pip. 2006, 83, 742–748. [Google Scholar] [CrossRef]
  27. Yang, J.; Zhao, D. Rotation gradient algorithm for calculating structural reliability index. J. Dalian Univ. Technol. 2011, 51, 221–225. (In Chinese) [Google Scholar]
  28. Jiang, C.; Bi, R.G.; Lu, G.Y.; Han, X. Structural reliability analysis using non-probabilistic convex model. Comput. Methods Appl. Mech. Eng. 2013, 254, 83–98. [Google Scholar] [CrossRef]
  29. Bucher, C.G.; Bourgund, U. A fast and efficient response surface approach for structural reliability problems. Struct. Saf. 1990, 7, 57–66. [Google Scholar] [CrossRef]
  30. Guo, X.; Dias, D.; Carvajal, C.; Peyras, L.; Breul, P. Three-dimensional probabilistic stability analysis of an earth dam using an active learning metamodeling approach. Bull. Eng. Geol. Environ. 2021, 81, 40. [Google Scholar] [CrossRef]
  31. Guo, X.; Dias, D. Kriging based reliability and sensitivity analysis—Application to the stability of an earth dam. Comput. Geotech. 2020, 120, 103411. [Google Scholar] [CrossRef]
  32. Shu, S.; Gong, W. An improved fuzzy point estimate method for slope stability analysis based on neural network. Rock Soil Mech. 2015, 36, 2111–2116. (In Chinese) [Google Scholar]
  33. Cho, S.E. Probabilistic stability analyses of slopes using the ANN-based response surface. Comput. Geotech. 2009, 36, 787–797. [Google Scholar] [CrossRef]
  34. Zhang, Y.; Deng, J.; Li, Y.; Wang, G. Fuzzy reliability analysis of slopes considering characteristics of membership function. Chin. J. Geotech. Eng. 2018, 40, 1350. [Google Scholar]
  35. Tan, X. The stability analysis of slope by fuzzy probability method. J. Hefei Univ. Technol. Nat. Sci. 2001, 3, 442–446. (In Chinese) [Google Scholar]
  36. Santamarina, J.; Altschaeffl, A.; Chameau, J. Reliability of slopes: Incorporating qualitative information (abridgment). Transp. Res. Rec. 1992, 1343, 1–5. [Google Scholar]
Figure 1. Four common types of fuzzy affiliation functions (a) The triangular fuzzy affiliation function; (b) The trapezoidal fuzzy affiliation function; (c) The normal fuzzy affiliation function; (d) The log-normal fuzzy affiliation function.
Applsci 13 07024 g001
Figure 2. Implications of the non-probabilistic reliability indexes based on the ellipsoidal model.
Applsci 13 07024 g002
Figure 3. Schematic diagrams of the non-probabilistic failure degree solution based on the ellipsoidal model (a) Two-dimensional case; (b) Three-dimensional case.
Applsci 13 07024 g003
Figure 4. Analysis process of the proposed non-probabilistic reliability analysis method for the slope.
Applsci 13 07024 g004
Figure 5. The slope calculation cross-section.
Applsci 13 07024 g005
Figure 6. The non-probabilistic reliability of the slope obtained from different types of fuzzy numbers. (a) Geotechnical parameters as triangular fuzzy numbers; (b) geotechnical parameters as trapezoidal fuzzy numbers; (c) geotechnical parameters as normal fuzzy numbers; (d) geotechnical parameters as log-normal fuzzy numbers.
Applsci 13 07024 g006
Figure 7. Non-probabilistic reliability indexes and failure degrees of the slope with different shape parameters. (a) shape parameter k (k2) = 2.0; (b) shape parameter k (k2) = 2.5; (c) shape parameter k (k2) = 3.0.
Applsci 13 07024 g007
Table 1. Statistical characteristics of shear strength parameters.
Soil Layer NumberCohesion, kPaInternal Friction Angle, °
Mean ValueStandard DeviationMean ValueStandard Deviation
138.317.6600
223.944.79121.2
Table 2. The value intervals of soil parameters obtained from triangular fuzzy numbers.
λk = 2.0k = 2.5k = 3.0
c1, kPac2, kPaφ2, °c1, kPac2, kPaφ2, °c1, kPac2, kPaφ2, °
0.00[22.99, 53.63][14.36, 33.52][9.60, 14.40][19.16, 57.46][11.97, 35.92][9.00, 15.00][15.33, 61.29][9.57, 38.31][8.40, 15.60]
0.05[23.76, 52.86][14.84, 33.04][9.72, 14.28][20.12, 56.50][12.56, 35.32][9.15, 14.85][16.48, 60.14][10.29, 37.59][8.58, 15.42]
0.10[24.52, 52.10][15.32, 32.56][9.84, 14.16][21.08, 55.55][13.16, 34.72][9.30, 14.70][17.63, 58.99][11.01, 36.87][8.76, 15.24]
0.15[25.29, 51.33][15.80, 32.08][9.96, 14.04][22.03, 54.59][13.76, 34.12][9.45, 14.55][18.78, 57.84][11.73, 36.15][8.94, 15.06]
0.20[26.05, 50.57][16.28, 31.60][10.08, 13.92][22.99, 53.63][14.36, 33.52][9.60, 14.40][19.93, 56.69][12.44, 35.44][9.12, 14.88]
0.25[26.82, 49.80][16.76, 31.13][10.20, 13.80][23.95, 52.67][14.96, 32.92][9.75, 14.25][21.08, 55.55][13.16, 34.72][9.30, 14.70]
0.30[27.59, 49.03][17.23, 30.65][10.32, 13.68][24.91, 51.72][15.56, 32.32][9.90, 14.10][22.22, 54.40][13.88, 34.00][9.48, 14.52]
0.35[28.35, 48.27][17.71, 30.17][10.44, 13.56][25.86, 50.76][16.16, 31.72][10.05, 13.95][23.37, 53.25][14.60, 33.28][9.66, 14.34]
0.40[29.12, 47.50][18.19, 29.69][10.56, 13.44][26.82, 49.80][16.76, 31.13][10.20, 13.80][24.52, 52.10][15.32, 32.56][9.84, 14.16]
0.45[29.88, 46.74][18.67, 29.21][10.68, 13.32][27.78, 48.84][17.35, 30.53][10.35, 13.65][25.67, 50.95][16.04, 31.84][10.02, 13.98]
0.50[30.65, 45.97][19.15, 28.73][10.80, 13.20][28.74, 47.89][17.95, 29.93][10.50, 13.50][26.82, 49.80][16.76, 31.13][10.20, 13.80]
0.55[31.42, 45.20][19.63, 28.25][10.92, 13.08][29.69, 46.93][18.55, 29.33][10.65, 13.35][27.97, 48.65][17.47, 30.41][10.38, 13.62]
0.60[32.18, 44.44][20.11, 27.77][11.04, 12.96][30.65, 45.97][19.15, 28.73][10.80, 13.20][29.12, 47.50][18.19, 29.69][10.56, 13.44]
0.65[32.95, 43.67][20.59, 27.29][11.16, 12.84][31.61, 45.01][19.75, 28.13][10.95, 13.05][30.27, 46.35][18.91, 28.97][10.74, 13.26]
0.70[33.71, 42.91][21.07, 26.81][11.28, 12.72][32.57, 44.06][20.35, 27.53][11.10, 12.90][31.42, 45.20][19.63, 28.25][10.92, 13.08]
0.75[34.48, 42.14][21.55, 26.34][11.40, 12.60][33.52, 43.10][20.95, 26.93][11.25, 12.75][32.57, 44.06][20.35, 27.53][11.10, 12.90]
0.80[35.25, 41.37][22.02, 25.86][11.52, 12.48][34.48, 42.14][21.55, 26.34][11.40, 12.60][33.71, 42.91][21.07, 26.81][11.28, 12.72]
0.85[36.01, 40.61][22.50, 25.38][11.64, 12.36][35.44, 41.18][22.14, 25.74][11.55, 12.45][34.86, 41.76][21.78, 26.10][11.46, 12.54]
0.90[36.78, 39.84][22.98, 24.90][11.76, 12.24][36.40, 40.23][22.74, 25.14][11.70, 12.30][36.01, 40.61][22.50, 25.38][11.64, 12.36]
0.95[37.54, 39.08][23.46, 24.42][11.88, 12.12][37.35, 39.27][23.34, 24.54][11.85, 12.15][37.16, 39.46][23.22, 24.66][11.82, 12.18]
Table 3. The overall failure degree and failure probability of the slope using different allowable safety factors.
Allowable Safety FactorShape ParameterFuzzy Number Type of Geotechnical Parameters
TriangularTrapezoidalNormalLog-Normal
Failure DegreeFailure ProbabilityFailure DegreeFailure ProbabilityFailure DegreeFailure ProbabilityFailure DegreeFailure Probability
1.02.00.002380.000340.035760.073300.001670.000880.000610.00068
2.50.010710.004510.029900.054100.004250.002250.001910.00166
3.00.023850.018540.034370.044760.005610.003110.002650.00224
1.12.00.006610.002530.077820.122110.005410.004960.002800.00420
2.50.020030.015880.055820.097320.010050.009670.005570.00781
3.00.037650.044110.054420.084310.012160.012180.006860.00967
1.22.00.016540.013450.140110.190130.015700.021160.010380.01925
2.50.037010.046160.103040.161660.023460.033110.015660.02885
3.00.060130.092600.086620.145610.026650.038660.017800.03319
It is worth noting that for the trapezoidal fuzzy numbers, the shape parameter used in Table 3 is k2.
Table 4. Distribution ranges of non-probabilistic reliability indexes and their corresponding failure degrees.
Non-Probabilistic Reliability IndexesFailure Degrees
0.449~0.4990.2008~0.2371
0.500~0.5990.1345~0.2008
0.600~0.6990.0786~0.1345
0.700~0.7990.0389~0.0786
0.800~0.8990.0098~0.0389
0.900~0.9990~0.0098
The minimum value of the non-probabilistic reliability index for this slope is 0.449.
Disclaimer/Publisher’s Note: The statements, opinions and data contained in all publications are solely those of the individual author(s) and contributor(s) and not of MDPI and/or the editor(s). MDPI and/or the editor(s) disclaim responsibility for any injury to people or property resulting from any ideas, methods, instructions or products referred to in the content.

