Abstract
This study investigated the use of eco-friendly novel formulations of deep eutectic solvents (DESs) with water in ultrasound-assisted extraction (UAE) of antioxidant compounds from six spices, comparing them to traditional ethanol-based solvents. Significant differences in antioxidant capacity (AC) determined by 2,2-diphenyl-1-picrylhydrazyl (DPPH), 2,2′-azino-bis(3-ethylbenzothiazoline-6-sulfonic acid) (ABTS), ferric reducing antioxidant power (FRAP) assays, and total phenolic content (TPC) analysed using Folin-Ciocalteu (F-C) method were observed among the prepared extracts of spices. Regardless of the solvent used, clove extracts exhibited the highest antioxidant properties, whereas coriander presented the lowest values of AC and TPC. Choline chloride (ChCl)-based DES3 with propylene glycol (PG) as the hydrogen bond donor was more promising for effectively extracting antioxidants from the studied spices than ChCl-based DES1 and DES2 containing urea (U) and glycerol (Gly), respectively. Although DESs showed lower efficiency in this study, they represent a viable and environmentally sustainable approach for the extraction of bioactive compounds from spices. However, DES-based extracts can be recommended as potential sources of bioactive compounds and sustainable solvent systems for the plasticization and modification of active food packaging. This research offers valuable insights for the food, pharmaceutical, cosmetic, and spice industries, particularly for future developments in sustainable extraction techniques and potential applications in eco-friendly solutions and health-related areas.
1. Introduction
For centuries, spices have been valued for their abundance of bioactive compounds, which contribute to their antioxidant and anti-inflammatory properties. Various parts of dried plants, including seeds, fruits, leaves, roots, and bark that can be used as spices, play a crucial role in meal preparation. They are common additives responsible for enhancing culinary delicacies by improving the taste, flavor, color, and aroma of food products [1]. Apart from these sensory qualities, spices could substantially affect the shelf life of food. Due to the high content of bioactive substances, such as vitamins, flavonoids, terpenoids, carotenoids, and phenolic compounds, spices exhibit strong antioxidant and antimicrobial properties [2]. Given these attributes, numerous studies have focused on investigating the effects of spice extracts on the shelf life of food products in recent years. For instance, extracts from Syzygium aromaticum, Cinnamomum cassia, Origanum vulgare, and Brassica nigra were used to prolong the shelf life of raw chicken meat [3]. These results indicated that prepared spice extracts effectively retarded microbial growth, reduced lipid oxidation, and maintained or improved sensory attributes. Therefore, they could be applied as natural antioxidants and antimicrobial additives for meat. Liang et al. [4] investigated the influence of ethanol and n-butane subcritical extraction of four Cinnamomum species, including C. cassia, C. loureiroi, C. wilsonii, and C. burmannii, on the chemical compositions and antibacterial activity of the prepared extracts. The reported results suggest that n-butane extracts of C. cassia and C. loureiroi may be applied as natural preservatives for food products due to the presence of bioactive constituents, e.g., (E)-cinnamaldehyde, which is known for its strong antibacterial properties. In conclusion, it could be assumed that spice extracts have the potential to substitute synthetic additives in food products, which are becoming increasingly undesirable to consumers.
In previous studies, various conventional methods, such as maceration [5], Soxhlet extraction [6,7], and steam distillation [8], have been employed to obtain bioactive substances (oleoresins, alkaloids, and essential oils) from spices. However, using traditional approaches to prepare spice extracts can generate significant limitations, including long process times, the use of hazardous organic solvents, high solvent requirements, high energy consumption, and unsatisfactory extraction efficiency, prompting the search for more sustainable alternatives. Therefore, testing modern extraction methods is essential to overcome these difficulties. In recent years, ultrasound-assisted extraction (UAE) has gained popularity, especially in the food products sector. This preparation technique is based on using electromagnetic waves with higher frequencies than sound waves audible to the human ear [9]. Ultrasounds can be divided into high-frequency ultrasounds (5–10 MHz), which are mainly applied for analytical purposes, and low-frequency ultrasounds (20–100 kHz), used to assist food processing operations such as extraction [10]. The mechanism of ultrasonic action in the achievement of high extraction efficiency is assumed to be complex. In fact, the promising results obtained with UAE, associated with enhanced mass transfer and improved solute transfer rates, could be attributed to a combination of effects provided by several mechanisms. These mechanisms, which include fragmentation, erosion, sonoporation, and the destruction and detexturation of sample structures, are identified as acting on UAE [11]. Additionally, it was observed that regardless of the power used, the combination of thermal effects and mechanical damage induced by the cavitation phenomenon could lead to the dislocation of plant tissues, resulting in the release of more polyphenols into the solvent medium [12]. Moreover, the potential reduction in the use of toxic chemicals, lower energy requirements, and compactness render UAE a green, eco-friendly, and cost-effective technique [13].
Researchers have studied the application of UAE to isolate bioactive compounds from various spices for many years. For instance, Morsy et al. [5] used conventional maceration and UAE to extract the oleoresin from nutmeg. The obtained results revealed that applying UAE at 40% of the maximal power for 10 min led to a similar oleoresin yield (8.26%) compared to the yield achieved by maceration lasting three days (9.63%). Furthermore, UAE has enabled the enrichment of nutmeg oleoresin in β-sesquiphellandrene, piperitol isomer, and α-ionone, which were not found in oleoresin obtained by maceration. Interestingly, yields of coriander seed extracts prepared by conventional (maceration and Soxhlet extraction) and unconventional (UAE and rapid solid-liquid dynamic extraction) methods were significantly different [14]. In fact, the highest extraction yield was observed for the sample obtained using the UAE method (2.36% w/w), followed by maceration (2.17% w/w), Soxhlet (1.18–1.63% w/w), and rapid solid-liquid dynamic extraction (0.57–0.73% w/w). Additionally, pepper seed oil prepared by UAE for 50 min had a significantly higher antioxidant capacity (AC) determined by ferric reducing antioxidant power (FRAP = 315.92 µmol Trolox (TE)/L) assay than the sample obtained by Soxhlet extraction performed for 6 h (FRAP = 290.45 µmol TE/L) [15]. These outcomes clearly demonstrated the advantages of using UAE to isolate bioactive substances from different spices in a short time while maintaining satisfactory efficiency.
Recently, deep eutectic solvents (DESs) have been widely studied due to their unique properties, such as biodegradability, environmental friendliness, ease of preparation, and low cost [16,17]. Briefly, DESs are mixtures of compounds that act as hydrogen bond acceptors (HBAs) and hydrogen bond donors (HBDs), contributing to their lower melting points compared to the individual compounds [16]. Due to their beneficial features, DESs have found applications in various fields, including catalysis reactions, organic synthesis, electrochemical materials, and the extraction of bioactive compounds [17,18]. However, their high viscosity could be a significant obstacle in some fields, especially in analytical chemistry, as it can limit mass transfer and decrease extraction efficiency [19]. Therefore, caution is required, as excessive water dilution may disrupt the DES system by weakening the hydrogen bond interactions between HBA and HBD [20,21]. To support adjusting the properties of DESs to individual needs, experiments and simulations performed by Zhekenov et al. [21] demonstrated that exceeding a 50% molar fraction of water in the DES system dampened the intramolecular interactions in the DES.
In the area of extraction, DESs based on tetrabutylammonium bromide (N4444Br) and long-chain alcohols have proven effective for headspace single-drop microextraction of terpenes from spices, including cinnamon, cumin, fennel, clove, thyme, and nutmeg [22]. Notably, the DES based on N4444Br and dodecanol was the most effective, leading to its selection for further experiments. Other studies have explored the extraction process of bioactive substances from cinnamon and sappan wood using a DES based on choline chloride (ChCl) and glycerol (Gly), comparing this approach to conventional extraction processes such as maceration and reflux conducted with ethanol [23]. Results showed that samples extracted using this DES had a higher content of bioactive compounds. Lastly, a natural DES (NADES) composed of betaine, lactic acid, and water was found effective in the extraction of bioactive compounds from ginger, yielding a higher total phenolic content (TPC) compared to samples obtained using ethanol, water, or an ethanol and water mixture [24]. The study also found that the AC of the extract increased even after 120 min, suggesting that DES could act as a protective agent for the extracted compounds. However, further studies are necessary to tune the properties of DESs and their water content for optimized extraction efficiency.
Considering the previously mentioned articles, to the best of our knowledge, there seem to be a limited number of studies dedicated to the determination of the AC of the DES-based spice extracts. Therefore, the aim of the present work was to develop a green extraction process of bioactive compounds from six different spices: cinnamon, nutmeg, clove, ginger, cardamom, and coriander, using DESs as green and alternative extraction media to hazardous organic solvents. Three DESs composed of ChCl as HBA and urea (U), Gly, or propylene glycol (PG) as HBD, respectively, were prepared by a heating and mixing method. The adequate dilution of prepared solvents was performed to gain the ability to perform UAE. Spice extracts obtained using ethanol and a mixture of ethanol and water (70:30 v/v) were developed to compare the efficiency of extractions. The AC of all prepared extracts was determined by 2,2-diphenyl-1-picrylhydrazyl (DPPH), 2,2′-azino-bis (3-ethylbenzothiazoline-6-sulfonic acid) (ABTS), and ferric reducing antioxidant power (FRAP) assays, whereas the Folin-Ciocalteu (F-C) method was applied to measure TPC. Furthermore, chemometric methods such as principal component analysis (PCA) and hierarchical cluster analysis (HCA) were used to cluster the investigated spice extracts and analytical techniques, their characterization, and the detection of differences.
In addition to the extraction of bioactive compounds from spices, this research can potentially contribute to the development of sustainable packaging materials. The obtained DES-based extracts will be explored in future studies as green active additives for packaging materials by enhancing antioxidant properties and acting as plasticizers.
2. Materials and Methods
2.1. Reagents and Samples
All chemicals and solvents used in the experiments were supplied by Merck Sp. z o.o. (Warszawa, Poland). All the reagents were of analytical grade and have purity higher than 97%. Spices were purchased from Medium Company (Kalisz, Poland). Cinnamon, nutmeg, clove, ginger, cardamom, and coriander were initially shredded (universal shredder RU/S, Coffee Service Sp. z o.o., Warszawa, Poland), transferred to a grinder (universal grinder MUCS/S 800 DC, Coffee Service Sp. z o.o., Warszawa, Poland), and ground according to the assumed parameters. The grinding process was carried out in the confectionery factory (Fabryka Cukiernicza Kopernik S.A., Toruń, Poland). The ground spices were passed through a grinder sieve with a diameter of 1.4 mm. The prepared spices were stored in a PE zip bag at 20 °C away from light prior to analysis.
2.2. Preparation of Deep Eutectic Solvent Mixtures
In this study, DESs were synthesized using a heating and mixing approach. The constituent components, including HBA–ChCl and HBD–U, Gly, or PG, were measured at a molar ratio of 1:2 using an analytical balance (AS 220/C/2, Radwag, Radom, Poland). The components were combined and heated to 80 °C on a heating plate (06-MSH-PRO-T, Chemland, Stargard, Poland) while being stirred continuously at 200 rpm. This process continued until a homogeneous, transparent liquid was formed. Following the formation of the desired products, the mixtures were allowed to cool to room temperature. Subsequently, the DESs were combined with distilled water at an 80:20 volume ratio and mixed for an additional 15 min at a constant stirring speed of 100 rpm to ensure thorough blending.
2.3. Determination of Antioxidant Capacity
The AC of the obtained spice extracts was assayed by spectrophotometric DPPH, ABTS, and FRAP methods reported in our previous work [25] with some modifications. The absorbance measurements were taken using a 1-cm quartz cell in a Hitachi U-2900 spectrophotometer (Tokyo, Japan). All the AC results were expressed as µmol Trolox equivalents (TE) per g of dried matter (DM) of spice.
2.3.1. Spice Extract Preparation
A portion of ground spice (1.0 g) and 5 mL of each DES:water (80:20 v/v) solvent were transferred into the glass tube and placed in an ultrasonic cleaner bath (Sono Swiss, SW 6H, Labo Plus, Warszawa, Poland) with a power of 550 W and a sonication frequency of 37 kHz. The spice-solvent suspension was sonicated for 4 min at 50 °C. The same spice sample was extracted in triplicate. After extraction, samples were centrifuged at 5 °C for 5 min at 4500 rpm using a laboratory centrifuge (MPW-150R, MPW MED. INSTRUMENTS, Warszawa, Poland). The extracts were separated from the spices by decantation, transferred to the capped bottles, and stored in a refrigerator at 4 °C prior to analysis. The same extraction procedure was applied for ethanol and a mixture of ethanol and water (70:30 v/v), which were employed as alternative extraction solvents. A comprehensive list of all prepared samples, along with their abbreviations, is presented in Figure 1.
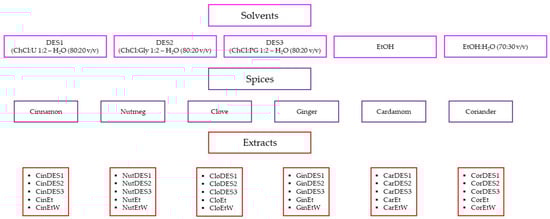
Figure 1.
Abbreviations of the obtained extracts. DES—deep eutectic solvent, ChCl—choline chloride, U—urea, Gly—glycerol, PG—propylene glycol, EtOH—ethanol, H2O—water, Et—pure ethanolic extract; EtW—70% ethanolic extract.
2.3.2. DPPH Method
In this process, the total volume of the extract and methanol was maintained at 2 mL, with the proportion of extract ranging from 0.1 to 0.5 mL. Next, 0.5 mL of DPPH methanolic solution (304 µmol/L) was added to each mixture. The mixtures were shaken vigorously and left in the dark for 15 min to complete DPPH radical quenching kinetics by antioxidants in the prepared extracts. The absorbance of each sample was measured at 517 nm against a reagent blank (2 mL of methanol mixed with 0.5 mL of DPPH methanolic solution).
The calibration curve was prepared with working solutions of Trolox (TE) in methanol, ranging from 0.02 to 0.10 µmol/mL. The equation for the calibration curve was %DPPH = (782.66 ± 20.31)cTE − (6.06 ± 1.33), with a determination coefficient of R² = 0.9953.
2.3.3. ABTS Method
Initially, the ABTS radical cation (ABTS•+) was produced by mixing a 7 mmol/L ABTS solution with 2.45 mmol/L potassium persulfate at a 1:0.5 ratio. The mixture was kept in the dark at 22 ± 2 °C for 16 h before use. The ABTS•+ solution was then diluted approximately 100 times with ethanol to an absorbance of 0.70 (±0.02) at 734 nm. Following this, spice extracts were added to the ABTS•+ solution, incubated at 40 °C for 1 min, and the absorbance was measured at 734 nm against a reagent blank (2.5 mL of ABTS•+ solution). The total volume of the extract and ABTS solution was always 2.5 mL, with the proportion of extract varying from 0.05 to 0.50 mL.
The calibration curve was prepared using working TE solutions in methanol between 0.025 and 0.15 µmol/mL. The equation for the calibration curve was %ABTS = (393.96 ± 5.69)cTE + (6.99 ± 0.50), with a determination coefficient of R2 = 0.9985.
2.3.4. FRAP Method
A freshly prepared FRAP reagent was obtained by mixing 2.5 mL of a 10 mmol/L 2,4,6-tris(2-pyridyl)-s-triazine (TPTZ) solution in 40 mmol/L HCl, 2.5 mL of 20 mmol/L FeCl3, and 25 mL of 0.1 mol/L acetate buffer (pH 3.6). This mixture was then incubated at 40 °C for 15 min. Following incubation, 0.01 to 1.0 mL of spice extracts and 2 mL of FRAP reagent were added to 10 mL volumetric flasks and diluted to the desired volume with distilled water. The resulting solutions were allowed to rest at room temperature for 20 min before their absorbance was measured at 593 nm against a reagent blank (2 mL of FRAP reagent, made up to 10 mL with distilled water).
The calibration curve was prepared with working solutions of TE in methanol, ranging between 0.001 and 0.018 μmol/mL. The equation for the calibration curve was A593 = (43.42 ± 0.67)cTE + (0.0112 ± 0.0069), with a determination coefficient of R² = 0.9990.
2.4. Determination of Total Phenolic Content
TPC in the prepared spice extracts was analyzed according to the F-C method in our previous work [26], with some modifications. In this method, 0.05–1.5 mL of spice extracts reacted with 0.5 mL of F-C reagent for 3 min. Then, 1 mL of saturated sodium carbonate solution (22.0%) was added to each reaction mixture, and the volume was adjusted to 10 mL with distilled water in a volumetric flask. After 1 h, the solutions were centrifuged at 10,000 rpm for 15 min using a centrifuge (MPW-150R, MPW MED. INSTRUMENTS, Warszawa, Poland), and the absorbance at 765 nm was measured against a reagent blank (0.5 mL of F-C reagent mixed with 1 mL of saturated sodium carbonate solution, made up to 10 mL with distilled water in a volumetric flask) using a Hitachi U-2900 spectrophotometer (Tokyo, Japan).
The calibration plot, A765 = (0.1941 ± 0.0050)cGA + (0.0064 ± 0.0184), was linear (R2 = 0.9967) in the concentration range between 0.35 and 7.00 µg/mL for methanolic solutions of gallic acid (GA). The TPC results were expressed as mg of GA per g of DM of spice.
2.5. Statistical Analysis
The obtained results of the AC and TPC in spice extracts were presented as mean ± standard deviation (SD). A one-way analysis of variance (ANOVA), followed by the Duncan test, was performed to analyze the significant differences between the data (p < 0.05).
PCA, using a covariance matrix, was employed in order to compare the antioxidant potential and TPC of the prepared extracts. The antioxidant properties were used as active variables in the derivation of the principal components, and the different spice extracts were projected onto the factor space. The scores and loadings of the data analyzed by PCA were displayed as a bi-plot. In addition, HCA with Ward’s method using Euclidean distances was applied (i) to identify spice extracts based on the degree of similarity among their AC and TPC, and (ii) to group different analytical methods and assess their effectiveness in the AC and TPC determination in prepared extracts by using three new DESs and two conventional solvents.
Statistical analyses of the data were carried out using the Statistica 8.0 software (StatSoft, Tulsa, OK, USA). However, the ggplot2 package was applied to visualize the data correlations.
3. Results and Discussion
3.1. Antioxidant Capacity of Spice Extracts
In this study, the AC of spice extracts obtained with different solvents was evaluated using three different analytical methods: DPPH, ABTS, and FRAP. The results are presented in Figure 2. As observed, the solvent type significantly correlated with the AC of the prepared extracts (p < 0.05, Duncan test), as did the particular spice used. When considering the AC values for individual extracts, it was found that mostly pure ethanolic samples exhibited the highest AC. The exceptions to this trend were CloEtW, CarEtW, and CorEtW, which demonstrated the highest DPPH values of 2199.5, 51.1, and 168.3 µmol TE/g DM, respectively. This can be explained by the fact that clove, cardamom, and coriander were richer sources of antioxidant components extracted in higher amounts in more polar solvents such as aqueous ethanol. These antioxidants, better solubilized in the 70% ethanol solution, were more capable of quenching the purple DPPH free radicals through hydrogen atoms or via electron donation, thereby converting them into a yellow-colored non-radical form.
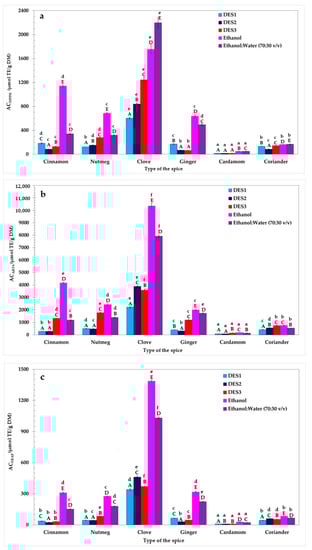
Figure 2.
The antioxidant capacity (AC) of spices determined by the DPPH (a), ABTS (b), and FRAP (c) methods. Bars with different lowercase letters (a–f) indicate significant differences between the AC of extracts obtained using the same solvent. Bars with different capital letters (A–E) represent significant differences in the AC of extracts obtained using the same spice (one-way ANOVA and Duncan test, p < 0.05).
Interestingly, these findings were consistent with earlier reported data. For instance, the AC of the same spices used in our study (cinnamon, clove, nutmeg, ginger, cardamom, and coriander) had been examined previously after extraction by a mixture of ethanol:water (1:1) and pure ethanol [27]. That analysis revealed that 50% ethanolic spice extracts exhibited higher ABTS (1119.9, 2071.1, 46.1, and 14.1 µmol TE/g DM for cinnamon, clove, cardamom, and coriander, respectively) than the ABTS of pure ethanolic extracts of these spices (1057.1, 926.8, 23.7, and 5.6 µmol TE/g DM for cinnamon, clove, cardamom, and coriander, respectively). The only exceptions were nutmeg and ginger, for which pure ethanolic extracts had higher ABTS (358.5 and 52.8 µmol TE/g DM) than ABTS of 50% ethanolic extracts (289.8 and 39.4 µmol TE/g DM) [27].
Importantly, the highest AC determined by all three analytical methods was observed for clove extracts (DPPH = 602.7–2199.5 µmol TE/g DM; ABTS = 2220.7–10350.3 µmol TE/g DM; FRAP = 341.1–1385.1 µmol TE/g DM). These observations align consistently with the results reported by other researchers. For example, Muzolf-Panek et al. [28] investigated the AC and phenolic profiles of a range of spices, including cloves, nutmeg, and cardamom. They found that of all the spices studied, clove extracts obtained by different solvents (50% ethanol, ethanol, and water) demonstrated the highest values of DPPH (546.88–1141.34 µmol TE/g), ABTS (1020.45–2495.85 µmol TE/g), and FRAP (447.37–1310.91 µmol TE/g). In another study, ultrasound-assisted surfactant micellar extraction was used to isolate phenolic antioxidants from spices such as cinnamon, clove, nutmeg, and black cardamom [29]. Similar to our results, it was observed that cinnamon and clove were characterized by the highest FRAP, total antioxidant capacity (TAC), and ceric reducing/antioxidant capacity (CRAC). In previous research, clove extracts were found to contain bioactive compounds such as protocatechuic acid, caffeic acid, and p-hydroxybenzoic acid. These phenolic acids are known for their strong antioxidant properties. Therefore, it may be assumed that the high AC determined for clove extracts may be attributed to the presence of these compounds in the extracts [28,30]. Conversely, cardamom extracts presented the lowest AC values determined by DPPH (15.2–51.1 µmol TE/g DM), ABTS (79.8–184.8 µmol TE/g DM), and FRAP (8.7–28.1 µmol TE/g DM) methods in comparison with the rest of the investigated samples. In a different study, extracts from various cardamom cultivars were developed using sonication and 80% ethanol or ethyl acetate as solvents [31]. The AC of these samples was tested using the cupric reducing antioxidant power (CUPRAC) and DPPH assays. Interestingly, the AC measured by the DPPH method ranged from 0.19 to 0.25 µmol TE/g and 0.26–0.40 µmol TE/g for ethanol and ethyl acetate extracts, respectively. These notable differences in comparison to our results may be attributed to various factors such as extraction time, solvent type, and particularly the use of different spice cultivars.
As shown in Figure 2, the AC of the DES-based extracts was significantly lower (p < 0.05, Duncan test) than the AC of the pure ethanolic and 70% ethanolic samples. The only exceptions were found for CinDES3, NutDES3, and CorDES3, measured by the ABTS assay. These results indicated that the ABTS of three DES3-based extracts was significantly higher (p < 0.05, Duncan test) than those prepared with an ethanol-water mixture (70:30 v/v). However, the extraction efficiency of antioxidants using DES3 as an extractant from the studied spices did not match that of pure ethanol.
Interestingly, similar DESs have been used for the extraction of bioactive compounds from various plant materials. For instance, a DES prepared with ChCl and Gly in different molar ratios and water content has been employed for the UAE of cinnamon and sappan wood [23]. Remarkably, even extracts obtained via response surface methodology, which yielded the lowest amounts of bioactive substances, demonstrated higher concentrations of trans-cinnamaldehyde, coumarin, and brazilin than maceration and reflux extracts prepared with ethanol. An onion peel sample, extracted by a DES based on ChCl, U, and water in a molar ratio of 1:2:4, exhibited 5 times higher FRAP (1457.19 µmol ascorbic acid equivalents (AAE)/g) than methanolic (FRAP = 291 µmol AAE/g) and water extracts (FRAP = 300 µmol AAE/g) [32]. Additionally, a DES based on ChCl and PG in a molar ratio of 1:2, containing 20% water, yielded a comparable amount of curcumin (22.3 mg/g) to extracts obtained using methanol and ethanol (22.7 and 21.6 mg/g, respectively) [33]. The findings reported by other authors suggest that DESs could act as more efficient extraction media than conventional solvents. However, it is essential to note that multiple factors, including extraction time, sonication power, solvent-to-sample ratio, and the polarity of the used solvents, significantly influence the efficient dissolution of desirable antioxidants present in spice powders.
3.2. Total Phenolic Content in Spice Extracts
Similar to the AC results, TPC in extracts of the various spices prepared using three DESs and two conventional solvents differed significantly (p < 0.05, Duncan test) (Figure 3).
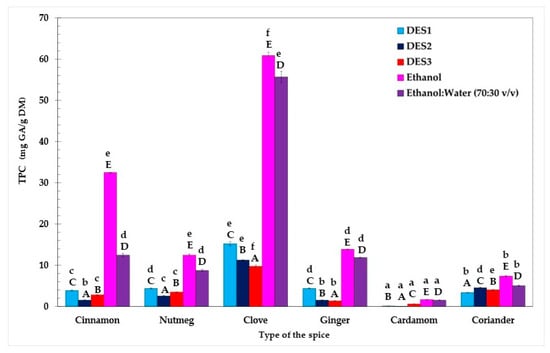
Figure 3.
Total phenolic content (TPC) in spices determined by the F-C method. Bars with different lowercase letters (a–f) indicate significant differences between the TPC of extracts obtained using the same solvent. Bars with different capital letters (A–E) represent significant differences in TPC of extracts obtained using the same spice (one-way ANOVA and Duncan test, p < 0.05).
Among all examined spices, clove was found to be the richest source of phenolic compounds (TPC = 9.8–60.9 mg GA/g DM), while TPC values (0.08–1.7 mg GA/g DM) were the lowest for cardamom extracts. Furthermore, the Duncan test revealed that, across all spices tested, ethanol proved to be the most efficient solvent for extracting phenolic compounds, yielding a range of 1.7–60.9 mg GA/g. Surprisingly, the TPC results presented by both Przygodzka et al. [27] and Muzolf-Panek et al. [28] indicated that spice extracts prepared with 50% ethanol (TPC = 140.80–167.22 mg GA/g DM and 160 mg GA/g DM for clove and cinnamon extracts, respectively) provided a more efficient extraction of phenolics than pure ethanol (TPC = 60.2–130.9 mg GA/g DM and 72.4 mg GA/g DM for clove and cinnamon extracts, respectively). On the other hand, pure ethanol, being less polar than 70% ethanol, might disrupt cell membranes more effectively, enhancing their permeability and resulting in superior extraction performance [34].
Moreover, as highlighted by Poliński et al. [35], factors such as the storage time of ground spices, the mesh size of the grinder sieve, and the peripheral velocity of grinding wheels can also significantly affect the TPC in spice extracts.
Similar to their performance with AC, DESs were found to be suboptimal solvents for isolating phenolic compounds from spices. Typically, DESs are characterized by relatively high viscosity, which could pose a significant challenge to their application due to hindered mass transfer [36]. The viscosity of DESs can vary depending on water content and temperature [37]. It was determined that DESs, based on ChCl and U or Gly at 30 °C, exhibited viscosities of 214 and 177 mPa·s, respectively. In contrast, the same mixtures with 20% water content at 20 °C displayed viscosities of 14.35 mPa·s and 23.48 mPa·s, respectively [36]. For comparison, traditional solvents such as ethanol and methanol have significantly lower viscosities (1.07 mPa·s and 0.9 mPa·s, respectively) [38]. This reduced viscosity may constitute a key advantage in the extraction of phenolic compounds from plant samples.
3.3. Multivariate Analysis
3.3.1. Principal Component Analysis
A PCA was conducted using the AC and TPC results obtained for extracts of six spices using three new DESs and two conventional solvents. The results of the score plot and loading plot of the PCA were presented as a bi-plot in Figure 4.
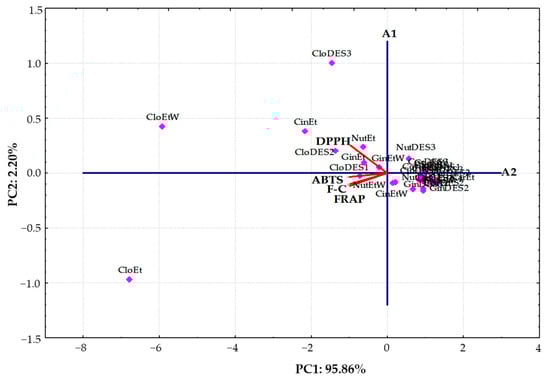
Figure 4.
Principal component analysis bi-plot of antioxidant capacity determination and total phenolic content in the studied extracts of different spices analyzed using DPPH, ABTS, FRAP, and F-C methods.
The first principal component (PC1) was 95.86% and had the highest eigenvalue of 3.83, while the second principal component (PC2) was 2.20% with a significantly lower eigenvalue of 0.088. As can be seen, PC1 was inversely correlated with all variables: DPPH (−0.9673), ABTS (−0.9893), FRAP (−0.9839), and F-C (−0.9757), whereas PC2 was positively contributed by DPPH (0.2521).
Moreover, the bi-plot showed that the clove extracts, as well as cinnamon and ginger extracts obtained using traditional solvents (ethanol and a mixture of ethanol and water (70:30 v/v)) with the highest AC and TPC, were located to the left in the score bi-plot and had negative values for PC1. However, other tested extracts with lower DPPH, ABTS, FRAP, and TPC values were clustered together on the right-hand side of the bi-plot. Interestingly, clove extracts were located some distance away from all of the other sample types. This suggests that their antioxidant composition differed significantly from the studied extracts. Additionally, spice extracts with low and moderate AC and ethanolic extract of clove (CloEt) with the highest ABTS, FRAP, and TPC determined by F-C method were situated under the A1 axis. In contrast, extracts of clove prepared with an ethanol:water (70:30 v/v) mixture (CloEtW) and the proposed DESs (CloDES1, CloDES2, and CloDES3), as well as ginger, nutmeg, and cinnamon obtained by using traditional solvents with the highest DPPH results, were located upper the A1 axis (Figure 4).
It is noteworthy that the investigated spice extracts fell into three distinct groups, respectively. Three clove extracts (CloEt, CloEtW, and CloDES3) and an ethanolic extract of cinnamon (CinEt) with the highest antioxidant properties created an evidently separate cluster. Moreover, five extracts of clove (CloDES1, CloDES2), nutmeg (NutEt), and ginger (GinEt and GinEtW) with similar moderate AC and TPC evidently separated from the third cluster, including all the other extracts with the lowest antioxidant properties.
3.3.2. Hierarchical Cluster Analysis
In order to evaluate the similarity measure, the spice extracts were classified using the methods of Wards and the Euclidean square. HCA was applied to quantify the correlations between all studied extracts and to display the similarities of 30 extracts based on their antioxidant characteristics determined by the modified DPPH, ABTS, FRAP, and F-C assays. The generated plots, called dendrograms, are presented in Figure 5.
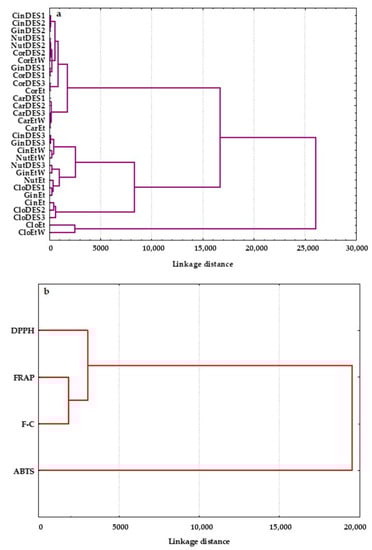
Figure 5.
Dendrograms of hierarchical cluster analysis for (a) spice extracts prepared using three deep eutectic solvents: DES1, DES2, and DES3 and common solvents: ethanol (Et) and ethanol:water (Et:W 70:30 v/v), and (b) the studied variables: DPPH, ABTS, FRAP, and F-C.
Similar to PCA, the 30 spice extracts were classified into three main clusters (Figure 5a). Twelve extracts of clove obtained from all prepared DESs (CloDES1, CloDES2, and CloDES3), extracts of nutmeg, ginger, and cinnamon prepared with DES3 (NutDES3, GinDES3, CinDES3), and extracts of these spices in ethanol and its mixture with water (70:30 v/v) (NutEt, GinEt, CinEt, NutEtW, GinEtW, and CinEtW) were arranged in one cluster characterized by similar moderate antioxidant properties. In addition, CloDES2, CloDES3, and CinEt with high AC were in the same inter-cluster, as shown in Figure 5a. However, a clear separation of two ethanolic clove extracts (CloEtW and CloEt) with the highest AC and TPC was observed. All investigated extracts of cardamom and coriander and extracts of nutmeg, ginger, and cinnamon obtained with two ecological solvents such as DES1 and DES2, having the lowest DPPH, ABTS, FRAP, and TPC values, formed an evidently distinct group. Moreover, the prepared cardamom extracts with the lowest AC and TPC created an inter-cluster (Figure 5a).
HCA was also applied to four analytical methods (DPPH, ABTS, FRAP, and F-C), and they were grouped in clusters in terms of their similarity and discrepancy (Figure 5b). As can be seen, the analytical assays used formed two statistically significant clusters. The first cluster comprised two subgroups: (I) DPPH and (II) FRAP and F-C tests, while the second group contained only the ABTS method. This can be explained by the fact that the ABTS radical scavenging assay allows the determination of both hydrophilic and lipophilic antioxidants present in spice extracts. However, FRAP and F-C methods are based on the redox reaction principle and measure the ability of the spice extracts to reduce Fe(III) to Fe(II) and Mo(VI) to Mo(V), respectively. These two analytical methods are particularly suitable for hydrophilic antioxidants. Although the DPPH assay uses a radical dissolved in organic media and has a higher affinity toward lipophilic than hydrophilic antioxidants, it is more closely connected to the FRAP and F-C tests.
It is noteworthy that AC and TPC in the studied spices were different from one another. The dendrograms revealed that the grouping of the 30 spice extracts was dependent on their origin and the properties of the extracting solvents, which would affect the total concentration of antioxidants.
3.3.3. Relationship between Antioxidant Capacity and Total Polyphenols in the Investigated Spice Extracts
Presuming that the phenolic antioxidants might contribute to the AC of plant materials, the correlation coefficients between the AC, determined by the DPPH, ABTS, and FRAP methods, and the TPC measured by the F-C method were calculated and are visually presented in Figure 6.
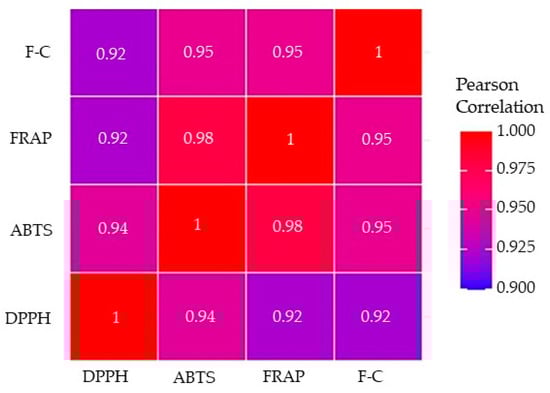
Figure 6.
Pearson’s correlation coefficients (r) between the antioxidant capacity (AC) determined by the DPPH, ABTS, and FRAP methods and total phenolic content (TPC) analyzed using the F-C assay. All correlation coefficients were statistically significant at p < 0.01.
All Pearson’s correlation coefficients were found to be statistically significant with p-values less than 0.01. Correlation coefficients varied between 0.92 and 0.98, with the strongest correlation being between the ABTS and FRAP methods (r = 0.98, p < 0.01). Correlations between ABTS and F-C and FRAP and F-C assays were comparably high (r = 0.95, p < 0.01), while the correlation between DPPH and ABTS was 0.94 (p < 0.01). The lowest correlation coefficients were calculated between the FRAP and DPPH as well as the F-C and DPPH methods (r = 0.92, p < 0.01). Muzolf-Panek et al. [28] observed comparable Pearson’s correlation coefficients (r = 0.95–0.99) that described the high linear relationships between antioxidant properties of the examined black seed, spices, and herbs determined by the same analytical methods (DPPH, ABTS, FRAP, and F-C). In contrast, significantly lower correlation coefficients (r = 0.47–0.63) assessed the association between these methods as found by Nikolic et al. [39]. The strong positive correlations between DPPH and ABTS assays suggested that compounds capable of neutralizing free radicals were present in the spice extracts. It also indicated the possibility that the polyphenols contributing to the free radical scavenging activity were similar compounds with analogous hydrophilicity [40]. The significant positive correlations of FRAP with DPPH and ABTS results suggest that the compounds in the plant extracts that could scavenge DPPH and ABTS free radicals also had the capacity to reduce ferric ions.
4. Conclusions
This study represents a novel exploration and comparison of three ChCl-based DESs with two conventional solvents, ethanol and a 70:30 (v/v) ethanol:water mixture, in the extraction of bioactive compounds from six common spices (cinnamon, nutmeg, clove, ginger, cardamom, and coriander) using the UAE technique. It was revealed that clove had the highest antioxidant levels, while cardamom displayed the lowest AC and TPC values. Interestingly, conventional solvents appeared to be more effective than DESs in isolating antioxidant compounds. This suggests that the high viscosity and polarity of the DESs were too high to provide satisfactory extraction efficiency. Moreover, significant positive correlations (r > 0.9, p < 0.01) were observed among all methods used to determine the antioxidant properties of the spices.
The research highlighted the potential of DESs as sustainable alternatives in the extraction process. However, further studies are needed to tailor these systems to enhance extraction efficiency. The presented results contribute valuable insights into the effectiveness of DESs in the isolation of bioactive compounds from spices, providing a foundation for further research in the food, pharmaceutical, cosmetic, and spice industries, as well as in green chemistry, to develop more efficient and sustainable extraction techniques. Furthermore, DES-based extracts could serve dual functions in sustainable packaging applications, acting both as green active additives and plasticizers.
Author Contributions
Conceptualization, A.T. and A.S.-C.; methodology, A.T. and A.S.-C.; software, A.T. and A.S.-C.; validation, A.T. and A.S.-C.; formal analysis, A.T. and J.K.; investigation, A.T. and A.S.-C.; resources, A.S.-C.; data curation, A.T. and A.S.-C.; writing—original draft preparation, A.T.; writing—review and editing, A.S.-C.; visualization, A.T. and A.S.-C.; supervision, A.S.-C.; project administration, A.S.-C.; funding acquisition, A.S.-C. All authors have read and agreed to the published version of the manuscript.
Funding
This research received no external funding.
Institutional Review Board Statement
Not applicable.
Informed Consent Statement
Not applicable.
Data Availability Statement
The data presented in this study are available on request from the corresponding author.
Conflicts of Interest
The authors declare no conflict of interest.
References
- Singh, N.; Yadav, S.S. A review on health benefits of phenolics derived from dietary spices. Curr. Res. Food Sci. 2022, 5, 1508–1523. [Google Scholar] [CrossRef] [PubMed]
- Shahidi, F.; Ambigaipalan, P. Phenolics and polyphenolics in foods, beverages and spices: Antioxidant activity and health effects—A review. J. Funct. Food. 2015, 18, 820–897. [Google Scholar] [CrossRef]
- Radha Krishnan, K.; Babuskin, S.; Babu, P.A.S.; Sasikala, M.; Sabina, K.; Archana, G.; Sivarajan, M.; Sukumar, M. Antimicrobial and antioxidant effects of spice extracts on the shelf life extension of raw chicken meat. Int. J. Food Microbiol. 2014, 171, 32–40. [Google Scholar] [CrossRef]
- Liang, Y.; Li, Y.; Sun, A.; Liu, X. Chemical compound identification and antibacterial activity evaluation of cinnamon extracts obtained by subcritical n-butane and ethanol extraction. Food Sci. Nutr. 2019, 7, 2186–2193. [Google Scholar] [CrossRef] [PubMed]
- Morsy, N.F.S. A comparative study of nutmeg (Myristica fragrans Houtt.) oleoresins obtained by conventional and green extraction techniques. J. Food Sci. Technol.-Mysore 2016, 53, 3770–3777. [Google Scholar] [CrossRef]
- Said, P.P.; Arya, O.P.; Pradhan, R.C.; Singh, R.S.; Rai, B.N. Separation of oleoresin from ginger rhizome powder using green processing technologies. J. Food Process Eng. 2015, 38, 107–114. [Google Scholar] [CrossRef]
- Gorgani, L.; Mohammadi, M.; Najafpour, G.D.; Nikzad, M. Sequential microwave-ultrasound-assisted extraction for isolation of piperine from black pepper (Piper nigrum L.). Food Bioprocess Technol. 2017, 10, 2199–2207. [Google Scholar] [CrossRef]
- Wei, M.-C.; Xiao, J.; Yang, Y.-C. Extraction of α-humulene-enriched oil from clove using ultrasound-assisted supercritical carbon dioxide extraction and studies of its fictitious solubility. Food Chem. 2016, 210, 172–181. [Google Scholar] [CrossRef]
- Bitwell, C.; Indra, S.S.; Luke, C.; Kakoma, M.K. A review of modern and conventional extraction techniques and their applications for extracting phytochemicals from plants. Sci. Afr. 2023, 19, e01585. [Google Scholar] [CrossRef]
- Teng, X.; Zhang, M.; Devahastin, S. New developments on ultrasound-assisted processing and flavor detection of spices: A review. Ultrason. Sonochem. 2019, 55, 297–307. [Google Scholar] [CrossRef]
- Chemat, F.; Rombaut, N.; Sicaire, A.-G.; Meullemiestre, A.; Fabiano-Tixier, A.-S.; Abert-Vian, M. Ultrasound assisted extraction of food and natural products. Mechanisms, techniques, combinations, protocols and applications. A review. Ultrason. Sonochem. 2017, 34, 540–560. [Google Scholar] [CrossRef] [PubMed]
- Abi-Khattar, A.-M.; Boussetta, N.; Rajha, H.N.; Abdel-Massih, R.M.; Louka, N.; Maroun, R.G.; Vorobiev, E.; Debs, E. Mechanical damage and thermal effect induced by ultrasonic treatment in olive leaf tissue. Impact on polyphenols recovery. Ultrason. Sonochem. 2022, 82, 105895. [Google Scholar] [CrossRef] [PubMed]
- Rao, M.V.; Sengar, A.S.; Sunil, C.K.; Rawson, A. Ultrasonication—A green technology extraction technique for spices: A review. Trends Food Sci. Technol. 2021, 116, 975–991. [Google Scholar] [CrossRef]
- Palmieri, S.; Pellegrini, M.; Ricci, A.; Compagnone, D.; Lo Sterzo, C. Chemical composition and antioxidant activity of thyme, hemp and coriander extracts: A comparison study of maceration, Soxhlet, UAE and RSLDE techniques. Foods 2020, 9, 1221. [Google Scholar] [CrossRef] [PubMed]
- Ma, Y.; Wu, X.; Zhao, L.; Wang, Y.; Liao, X. Comparison of the compounds and characteristics of pepper seed oil by pressure-assisted, ultrasound-assisted and conventional solvent extraction. Innov. Food Sci. Emerg. Technol. 2019, 54, 78–86. [Google Scholar] [CrossRef]
- Guo, H.; Liu, S.; Li, S.; Feng, Q.; Ma, C.; Zhao, J.; Xiong, Z. Deep eutectic solvent combined with ultrasound-assisted extraction as high efficient extractive media for extraction and quality evaluation of Herba Epimedii. J. Pharm. Biomed. Anal. 2020, 185, 113228. [Google Scholar] [CrossRef]
- Patil, S.S.; Pathak, A.; Rathod, V.K. Optimization and kinetic study of ultrasound assisted deep eutectic solvent based extraction: A greener route for extraction of curcuminoids from Curcuma longa. Ultrason. Sonochem. 2021, 70, 105267. [Google Scholar] [CrossRef]
- Zhang, Q.; De Oliveira Vigier, K.; Royer, S.; Jérôme, F. Deep eutectic solvents: Syntheses, properties and applications. Chem. Soc. Rev. 2012, 41, 7108. [Google Scholar] [CrossRef]
- Vilková, M.; Płotka-Wasylka, J.; Andruch, V. The role of water in deep eutectic solvent-base extraction. J. Mol. Liq. 2020, 304, 112747. [Google Scholar] [CrossRef]
- Rente, D.; Paiva, A.; Duarte, A.R. The role of hydrogen bond donor on the extraction of phenolic compounds from natural matrices using deep eutectic systems. Molecules 2021, 26, 2336. [Google Scholar] [CrossRef]
- Zhekenov, T.; Toksanbayev, N.; Kazakbayeva, Z.; Shah, D.; Mjalli, F.S. Formation of type III deep eutectic solvents and effect of water on their intermolecular interactions. Fluid Phase Equilib. 2017, 441, 43–48. [Google Scholar] [CrossRef]
- Triaux, Z.; Petitjean, H.; Marchioni, E.; Boltoeva, M.; Marcic, C. Deep eutectic solvent–based headspace single-drop microextraction for the quantification of terpenes in spices. Anal. Bioanal. Chem. 2020, 412, 933–948. [Google Scholar] [CrossRef] [PubMed]
- Sakti, A.S.; Saputri, F.C.; Mun’im, A. Optimization of choline chloride-glycerol based natural deep eutectic solvent for extraction bioactive substances from Cinnamomum burmannii barks and Caesalpinia sappan heartwoods. Heliyon 2019, 5, e02915. [Google Scholar] [CrossRef] [PubMed]
- Tzani, A.; Kalafateli, S.; Tatsis, G.; Bairaktari, M.; Kostopoulou, I.; Pontillo, A.R.N.; Detsi, A. Natural deep eutectic solvents (NaDESs) as alternative green extraction media for ginger (Zingiber officinale Roscoe). Sustain. Chem. 2021, 2, 576–599. [Google Scholar] [CrossRef]
- Szydłowska-Czerniak, A.; Łaszewska, A. Effect of refining process on antioxidant capacity, total phenolics and prooxidants contents in rapeseed oils. LWT-Food Sci. Technol. 2015, 64, 853–859. [Google Scholar] [CrossRef]
- Szydłowska-Czerniak, A.; Tułodziecka, A.; Szłyk, E. Determination of antioxidant capacity of unprocessed and processed food products by spectrophotometric methods. Food Anal. Methods 2012, 5, 807–813. [Google Scholar] [CrossRef]
- Przygodzka, M.; Zielińska, D.; Ciesarová, Z.; Kukurová, K.; Zieliński, H. Comparison of methods for evaluation of the antioxidant capacity and phenolic compounds in common spices. LWT-Food Sci. Technol. 2014, 58, 321–326. [Google Scholar] [CrossRef]
- Muzolf-Panek, M.; Stuper-Szablewska, K. Comprehensive study on the antioxidant capacity and phenolic profiles of black seed and other spices and herbs: Effect of solvent and time of extraction. J. Food Meas. Charact. 2021, 15, 4561–4574. [Google Scholar] [CrossRef]
- Ziyatdinova, G.; Ziganshina, E.; Cong, P.N.; Budnikov, H. Ultrasound-assisted micellar extraction of phenolic antioxidants from spices and antioxidant properties of the extracts based on coulometric titration data. Anal. Methods 2016, 8, 7150–7157. [Google Scholar] [CrossRef]
- Yeh, C.-T.; Yen, G.-C. Effects of phenolic acids on human phenolsulfotransferases in relation to their antioxidant activity. J. Agric. Food Chem. 2003, 51, 1474–1479. [Google Scholar] [CrossRef]
- Nurcholis, W.; Sya’bani Putri, D.N.; Husnawati, H.; Aisyah, S.I.; Priosoeryanto, B.P. Total flavonoid content and antioxidant activity of ethanol and ethyl acetate extracts from accessions of Amomum compactum fruits. Ann. Agric. Sci. 2021, 66, 58–62. [Google Scholar] [CrossRef]
- Pal, C.B.T.; Jadeja, G.C. Deep eutectic solvent-based extraction of polyphenolic antioxidants from onion (Allium cepa L.) peel. J. Sci. Food Agric. 2019, 99, 1969–1979. [Google Scholar] [CrossRef]
- Le, N.T.; Hoang, N.T.; Van, V.T.T.; Nguyen, T.P.D.; Chau, N.H.T.; Le, N.T.N.; Le, H.B.T.; Phung, H.T.; Nguyen, H.T.; Nguyen, H.M. Extraction of curcumin from turmeric residue (Curcuma longa L.) using deep eutectic solvents and surfactant solvents. Anal. Methods 2022, 14, 850–858. [Google Scholar] [CrossRef] [PubMed]
- Sepahpour, S.; Selamat, J.; Abdul Manap, M.; Khatib, A.; Abdull Razis, A. Comparative analysis of chemical composition, antioxidant activity and quantitative characterization of some phenolic compounds in selected herbs and spices in different solvent extraction systems. Molecules 2018, 23, 402. [Google Scholar] [CrossRef] [PubMed]
- Poliński, S.; Topka, P.; Tańska, M.; Kowalska, S.; Czaplicki, S.; Szydłowska-Czerniak, A. Effect of grinding process parameters and storage time on extraction of antioxidants from ginger and nutmeg. Molecules 2022, 27, 7395. [Google Scholar] [CrossRef]
- Zannou, O.; Koca, I. Greener extraction of anthocyanins and antioxidant activity from blackberry (Rubus Spp.) using natural deep eutectic solvents. LWT-Food Sci. Technol. 2022, 158, 113184. [Google Scholar] [CrossRef]
- Yadav, A.; Pandey, S. Densities and viscosities of (choline chloride + urea) deep eutectic solvent and its aqueous mixtures in the temperature range 293.15 K to 363.15 K. J. Chem. Eng. Data 2014, 59, 2221–2229. [Google Scholar] [CrossRef]
- Hsieh, Y.-H.; Li, Y.; Pan, Z.; Chen, Z.; Lu, J.; Yuan, J.; Zhu, Z.; Zhang, J. Ultrasonication-assisted synthesis of alcohol-based deep eutectic solvents for extraction of active compounds from ginger. Ultrason. Sonochem. 2020, 63, 104915. [Google Scholar] [CrossRef]
- Nikolic, J.S.; Mitic, V.D.; Stankov Jovanovic, V.P.; Dimitrijevic, M.V.; Stojanovic, G.S. Chemometric characterization of twenty three culinary herbs and spices according to antioxidant activity. J. Food Meas. Charact. 2019, 13, 2167–2176. [Google Scholar] [CrossRef]
- Gu, C.; Howell, K.; Dunshea, F.R.; Suleria, H.A.R. LC-ESI-QTOF/MS characterisation of phenolic acids and flavonoids in polyphenol-rich fruits and vegetables and their potential antioxidant activities. Antioxidants 2019, 8, 405. [Google Scholar] [CrossRef]


Disclaimer/Publisher’s Note: The statements, opinions and data contained in all publications are solely those of the individual author(s) and contributor(s) and not of MDPI and/or the editor(s). MDPI and/or the editor(s) disclaim responsibility for any injury to people or property resulting from any ideas, methods, instructions or products referred to in the content. |
© 2023 by the authors. Licensee MDPI, Basel, Switzerland. This article is an open access article distributed under the terms and conditions of the Creative Commons Attribution (CC BY) license (https://creativecommons.org/licenses/by/4.0/).