Abstract
This paper presents the results of an experimental and analytical study on the behavior of cold-formed thick-walled steel plates connected by a single bolt under double shear. Experimental studies were conducted on a total of 54 bolted connections fabricated from two thicknesses of cold-formed thick-walled steel plates, with nominal thicknesses of 6 mm and 10 mm. The effects of the end distance, edge distance, and steel plate thickness on the bolt bearing behavior were investigated. The codes of (modified) ANSI/AISC 360-22 and EN1993-1-8 were applied to predict the failure modes and bearing resistance of the connections, and the predictions were compared with those of the measurements. The studies show that fractures occurred on the shear planes of the specimens that failed because of the shear-out that occurred due to reduced ductility, which was caused by the cold forming process. The modified ANSI/AISC gives the most accurate predictions of the failure modes and bearing resistance. However, the bearing resistance will be overestimated if the reduction in the area of the shear planes caused by the occurrence of fractures is ignored in specimens with an end distance higher than 2.0d0, and a reduction factor is needed to calculate the bearing resistance of the connections.
1. Introduction
Cold-formed steel sections are widely used in civil engineering. In the early stages, only thin-walled steel could be manufactured. With the improved technology of cold forming, more and more cold-formed steel members have been applied in practice, with thicknesses beyond the traditional limitations specified in the codes of thin-walled steel members [1,2,3]. In the new version of the AISI standard (2016 edition) [4] and the Chinese GB standard (GB 50018-draft standard for discussion) [5], the thickness of cold-formed steel members was increased to 25.4 mm. However, design criteria based on the study results of hot-rolled steel was adopted in the codes when the thickness of the steel plates in bolted connections was beyond a certain limitation. For example, the standard of AISI S100 [4] specifies that, for bolted connections in which the thickness of the thinnest connected part is greater than 4.76 mm, ANSI/AISC 360 [6] shall apply. Similarly, EN 1993-1-3 [2] specifies that, for a thickness larger than or equal to 3 mm, the rules for bolts in EN 1993-1-8 [7] should be used.
Thick-walled steel is usually used in tubular members. The ductility of steel is expected to decrease with an increase in strength during the process of cold work. According to the research of Guo et al. [8] and Hu et al. [9], the ratios of tensile strength and elongation at the fracture between the flat element and the virgin material are in the range of 1.03–1.20 and 0.81–0.90, respectively, and these ratios are in the range of 1.44–1.64 and 0.32–0.44 for corner elements. In the design of bearing-type bolted connections, the strain hardening properties of the plate material are utilized, and the design is based on the ultimate tensile strength of the steel. Additionally, bearing resistance is developed, accompanied with significant plastic deformation around the bolt hole due to high stress concentration [10]. For hot-rolled steel, which has a favorable ductility, a fully developed bearing resistance can be ensured, and the ductility requirement of steel is implicitly included in the design criteria. Therefore, it is necessary to check whether the current calculation formulae, which are derived on the basis of the behavior of hot-rolled steel, are still applicable to the bolted connections of thick-walled steel.
Most studies have focused on the bearing behavior of the bolted connections of cold-formed thin-walled steel plates. For example, Kim et al. [11] investigated the effect of curling on the ultimate strength of a thin-walled steel single shear bolted connection. They proposed a revised design formula, accounting for the strength reduction effect of curling and the conditions of curling occurrences. Toussaint et al. [12] conducted full-field measurements to investigate the influence of the interactions between the holes in the plates of cover-plate steel bolted connections. Numerical models showed the complexity of the stress distribution around the holes. Teh et al. [13] and Xing et al. [14] studied the ultimate tilt-bearing capacity and shear-out capacity of the bolted connections of cold-reduced steel sheets, respectively, and proposed modified formulae. The former found that the tilt-bearing capacity is not significantly affected by the orientation of the bolt head or nut. The results of the latter showed that the edge distance of the bolt connection affects the failure mode, but it has insignificant effects on the shear-out capacity. Mai et al. [15] presented an application of the digital-image-correlation-based technique to investigate the block shear failure mode of bolted connections made of high-strength cold-reduced sheet steel. The experimental results provided a better understanding of how the failure of the bolted connections progressed. Mahmood et al. [16] studied the ultimate strength and failure sequence of the single shear bolted connections of thin-walled carbon steel. They found that the end distance had the greatest influence on the effective range.
There are very few reported research studies in the open literature on the bearing behavior of cold-formed thick-walled steel bolted connections. For example, Hu et al. [9] conducted experimental research and design calculations on cold-formed thick-walled steel with square and rectangular hollow sections. Their results indicate that both of the strengths predicted by the Australian/New Zealand standard using the material properties obtained from the flat coupon tests and the strengths forecasted by the Chinese standard, based on the mean design yield stress of the full section, are quite conservative. Xu et al. [17] investigated the true stress–strain curves of the flat and corner regions of the cold-formed channel section. Their study showed that the tensile secondary-hardening phenomenon in the plastic strain stage was observed in the true stress–strain curves of the flat coupons, which exhibited a significant improvement in true ultimate strength.
This paper reports the results of an experimental and analytical study on the behavior of cold-formed and thick-walled plates connected by a single bolt under double shear. The effects of the end/edge distance on the bolt bearing behavior were investigated. The bearing resistance values predicted by the (modified) ANSI/AISC 360 [6] and the EN1993-1-8 [7] were compared with that of the measurements.
2. Experimental Investigation
2.1. Subsection Specimen Preparation
Single-bolt connections in double shear were investigated in the tests. In total, 54 tests were conducted, and Table 1 lists the main parameters of test specimens. The tests were designed to investigate the effects of different end/edge distance combinations on failure modes of connections. These tests used 24 mm bolts with 26 mm bolt holes. Grade 8.8 and 10.9 bolts were applied to connect the test specimens with 6 mm and 10 mm thick steel plates, respectively. Figure 1 is the schematic diagram of the specimen.

Table 1.
Main parameters of test specimens.
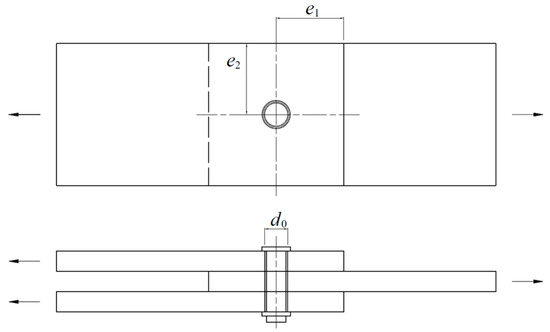
Figure 1.
Specimen diagram.
The specimen ID is expressed by the type of shear test, the thickness of steel plate, the ratio of end distance to bolt diameter, and the ratio of edge distance to bolt diameter. For example, D6.0-1.0-3.0 refers to double shear test (D), steel plate thickness of 6.0 mm, end distance e1 = 1.0d0, and edge distance e2 = 3.0d0. The remaining specimens were numbered the same way.
Steel plates used in the connections were taken from the middle of flat parts of hollow tubes that were cold-formed, with structural steel sheets with a nominal yield strength of 235 MPa. The nominal dimensions of hollow tubes were 200 × 200 × 10 mm and 150 × 150 × 6 mm, and the inside radii of rounded corners were 8 mm and 6 mm, respectively. The plates were all cut in the longitudinal direction.
2.2. Mechanical Properties of Cold-Formed Thick-Walled Steel
Steel plates used in the tensile coupon test were taken from the same batch and same location as that of lap shear test. For each thickness of cold-formed thick-walled steel plates, three tensile coupon tests were conducted in accordance with GB/T 228.1-2010 [18]. Mechanical properties were also tested for 10 mm virgin steel plates. Stress–strain relationships of all steel plates are presented in Figure 2, and the measured material properties are summarized in Table 2 in which E is the elasticity modulus, fy is the yield strength, fu is the tensile strength, εu is the strain corresponding to the tensile strength, and ∆ is the elongation ratio at fracture.
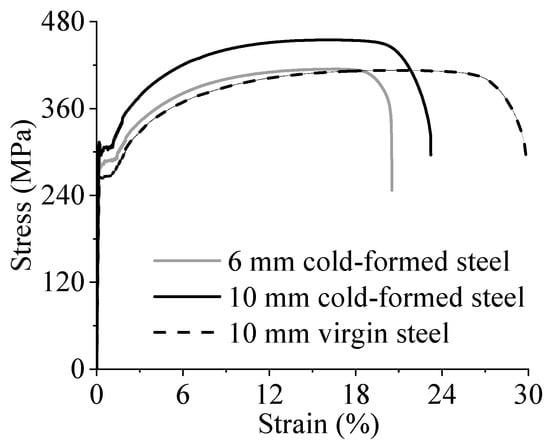
Figure 2.
Stress–strain relationships of cold-formed and virgin steel materials.
Table 2.
Mechanical properties of cold-formed and virgin steels.
Being different from cold-formed thin-walled steels, which are generally characterized by a rounded stress–strain response with no yield plateau, curves of stress–strain relationship of cold-formed thick-walled steel are similar to those of hot-rolled steels, which can be characterized by four ranges: being linearly elastic, yielding, hardening, and necking. However, cold-formed thick-walled steels have higher strength and smaller ductility than those of hot-rolled steels. For example, the tensile strength of 10 mm cold-formed steel increased by 9.6% compared to the corresponding value of 10 mm virgin steel.
2.3. Test Method
Lap shear tests were conducted on a servo-controlled hydraulic machine with a loading capacity of 1000 kN. The bolts were tightened in a way where firm contact between steel plates could be achieved, but no pretension was generated in the bolts, so the load was transferred primarily through bearing, instead of friction. The specimens were loaded at a prescribed displacement rate of 1.5 mm/min until failure of specimens occurred. The applied load was recorded by the sensor of a hydraulic loading machine. Bolt-hole elongation was measured with two linearly variable displacement transducers (LVDTs), as shown in Figure 3.
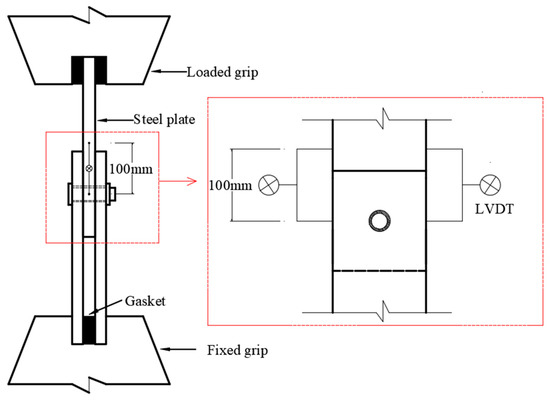
Figure 3.
Set-up of the lap shear test.
3. Experimental Observations and Test Results
3.1. Failure Modes
Similar failure modes were observed for the specimens with 6 mm and 10 mm thick steel plates. Therefore, only the 10 mm thick specimens were presented to show the effect of different end/edge distance combinations on the failure modes. Figure 4 shows the failure modes of the specimens under different end distances, and the edge distance is fixed at 3.0d0.
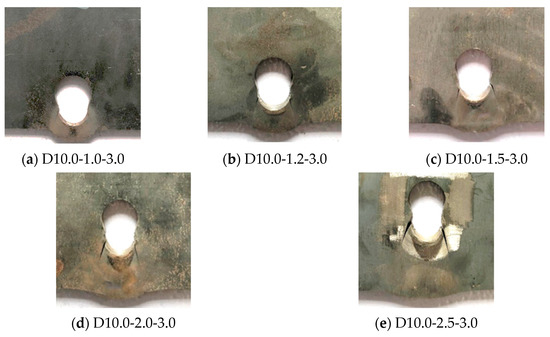
Figure 4.
Failure modes of 10 mm thick specimens with varying end distances.
The specimens in Figure 4 all failed due to excessive bearing stress in front of the bolt hole, and the failure of these specimens was accompanied by fractures at the edge of the elongated bolt hole in two symmetrical locations that were oriented at approximately 45 °C and 135 °C to the axis of loading. The elongation of the bolt hole was composed of two components of deformation, including the protrusion of the bolt from the plate material and the embedment of the bolt into the plate material. The largest bolt protrusion was observed in specimen D10-1.0-3.0. With an increase in the end distance, the proportion of the bolt protrusion was reduced, and the proportion of the bolt embedment grew. Both a large shear fracture and significant bearing deformation were observed in specimen D10-2.5-3.0.
Figure 5 presents the failure modes of the specimens under different edge distances and a constant end distance of 1.5d0. For the specimens in Figure 5, the failure modes and deformation of the bolt hole were governed by the value of the edge distance. With an increase in the edge distance from 1.0d0 to 2.0d0, the failure modes of the specimens were a net-section fracture to shear-out, and the deformed zone was from the longitudinal side of the bolt hole to the front side.
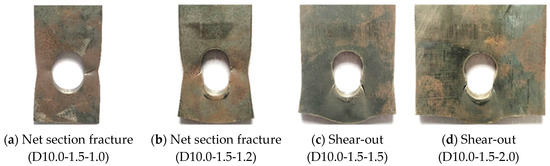
Figure 5.
Failure modes of 10 mm thick specimens with different edge distances.
Two typical failure modes were observed in our tests, including shear-out and a net-section fracture. Shear-out occurs when the end distance is relatively small. The material in front of the bolt yields and is pushed out from the plate, creating two shear planes. The connection fails when the material in the shear planes reaches its ultimate strength. The shear-out failure can be very ductile for hot-rolled specimens, and no fracture occurred [14]. Lower ductility is expected in cold-formed specimens due to less development of the local plastic deformation of cold-formed steel plates. Meanwhile, a fracture was observed along the shear planes of cold-formed connecting plates.
A net-section fracture occurs when the edge distance is relatively small, as shown in Figure 4b and Figure 5a. The fracture appeared after the necking of the net section during which bolt-hole elongation developed. The structural response of such failure has a relatively low ductility. With a further increase in the edge distance, the net-section strength of the steel plate was approaching shear-out strength, and a mixed deformation was observed along both the longitudinal side and the front side of the bolt hole, as shown in Figure 5c.
3.2. Bearing Resistance and Deformation
Figure 6 and Figure 7 show the load–displacement curves of the specimens with varying end distances and edge distances, respectively. The curves of the load–displacement relationship in Figure 6 and Figure 7 omit any possible slip phase and assume that the bolt bears directly against the back of the hole from the start of loading.
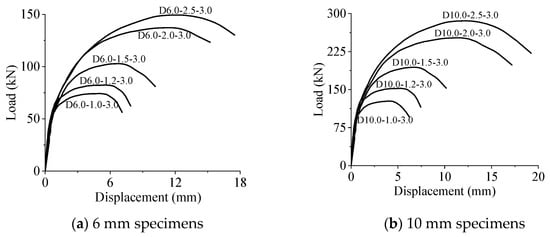
Figure 6.
Load–displacement curves of specimens with varying end distances.
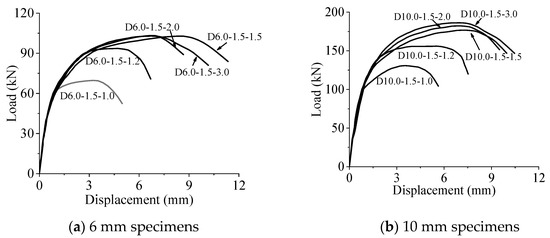
Figure 7.
Load–displacement curves of specimens with varying edge distances.
The load–displacement curves in Figure 6 and Figure 7 have an initial elastic region followed by a nonlinear hardening region. For the curves in Figure 6, the peak point of each curve was reached when the stress on the shear planes attained the ultimate strength of the steel material. The bearing resistance of each specimen is termed as Fu, and δu is the deformation, corresponding to Fu. Both Fu and δu increased with an increase in the end distance. For the curves in Figure 7, both Fu and δu increased with an increase in the edge distance when the edge distance was no more than 1.5d0. Beyond 1.5d0, an increase in the edge distance had little effect on the bearing resistance of the specimens. The measured Fu and δu are summarized in Table 3 and Table 4.
Table 3.
Test results for specimens with varying end distances.
Table 4.
Test results for specimens with varying edge distances.
Figure 8 and Figure 9 present the relationships of the ultimate load versus the end distance and the ultimate load versus the edge distance, respectively. Figure 8 shows that, with an adequate edge distance, the bearing resistance was linearly proportional to the end distance when the end distance was in the range of 1.0d0–2.0d0. The scale factor between the bearing resistance and the end distance decreased when the end distance was increased to 2.5d0. This may be caused by the decreased area of the shear planes after the fracture. Figure 8 shows that the bearing resistance of the specimens increased when the edge distance was increased from 1.0d0 to 1.5d0. Beyond 1.5d0, the bearing resistance of the specimens stayed constant. Given the same end distance of 1.5d0, the failure modes of a net-section fracture and shear-out were observed for the specimens with an edge distance of 1.2d0 and an edge distance of 1.5d0, respectively, and the bearing resistance increased by 15% when the edge distance was varied from 1.2d0 to 1.5d0.
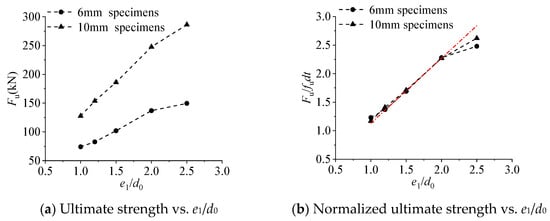
Figure 8.
Curves of relationship between (normalized) ultimate strength and normalized end distance.
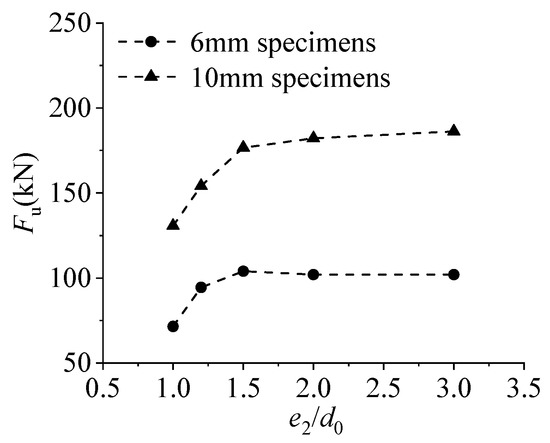
Figure 9.
Curves of the relationship between ultimate strength and normalized edge distance.
4. Discussion
According to the scope of the application specified in the design codes of AISI S100-16 [4] and EN 1993-1-3 [2], ANSI/AISC 360-22 [6] and EN 1993-1-8 [7] were applied to predict the bearing resistance of the specimens in our tests. The measured material properties were used in the calculations, and all the partial factors were set as 1.0. Before predicting the bearing resistance of the specimens, the failure modes need to be identified.
4.1. Comparison of Failure Modes
In the standard of ANSI/AISC 360-22 [6], ultimate capacities can be calculated using Equations (1)–(3) for specimens with the failure modes of a net-section rupture, as well as bearing and shear-out phenomena.
Here, fu is the tensile strength of the connected plates, Ae is the net area subject to tension, t is the base steel thickness of a section, d is the bolt diameter, and lc is the clear distance in the direction of the force. A bearing failure happens when Rb < Rs and Rb < Rn. From Equations (1)–(3), it can be obtained that a bearing failure occurs when e1 > 2d + 0.5d0 and e2 > 1.5d + 0.5d0. Similarly, a shear-out failure occurs when e1 < 2d + 0.5d0 and e2 > 0.75e1 + 0.125d0, and a net-section fracture occurs when e2 < min [1.5d + 0.5d0, 0.75e1 + 0.125d0].
When Equation (3) is used to calculate the ultimate capacity of a shear-out failure, assumptions are made that the steel plates fail along the centerlines of the bolt holes in the loading direction and that the limiting stress along the shear failure planes is 0.75fu. However, it is impossible that the shear failure plane coincides with the centerline of the bolt holes in the loading direction because the shear stress on this plane is zero when the bearing stress in front of the bolt is symmetrically distributed. This has been confirmed by the results of the finite element analysis of [19], the experimental observations of [20], and our tests. Therefore, Teh et al. [21] proposed a definition of the effective shear planes, which were the midways between the net and gross shear planes, and they were assumed to be the shear failure planes. Additionally, the maximum stress was assumed to be 0.60fu on the effective shear planes. Based on the studies of Teh et al. [21], the ultimate capacity of shear-out failures can be calculated using the following equation:
where; le is the effective shear length, which is the mean value of the net shear length (e1 − 0.5d0) and the gross shear length (e1).
Figure 10a presents the conditions of the end/edge distance combinations for different failure modes specified in the design code of ANSI/AISC 360-22 [6]. According to Equations (1), (2) and (4), the conditions of the end/edge distance combinations can be obtained for specimens failed by bearing, shear-out, and net-section fractures, as shown in Figure 10b.
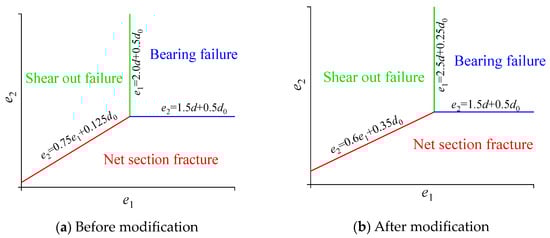
Figure 10.
Conditions of end/edge distance combinations of different failure modes according to ANSI/AISC 360-22 [6] before and after modification.
In the standard of EN1993-1-8 [7], the bearing resistance of the individual fastener is defined as follows:
where; αb and k1 are parameters related to the end and edge distances, respectively.
According to the different magnitudes of the end and edge distance, Equation (5) can be split into the following four equations:
- when e1 ≥ 3d0 and e2 ≥ 1.5d0,
- when e1 ≥ 3d0 and e2 < 1.5d0,
- when e1 < 3d0 and e2 ≥ 1.5d0,
- when e1 < 3d0 and e2 < 1.5d0,
Equations (8)–(11) correspond to the calculation formulas of the ultimate capacities of the specimens failed by bearing, a net-section fracture, as well as shear-out and mixed failure, respectively. Figure 11 shows the conditions of the end/edge distance combinations for the different failure modes.
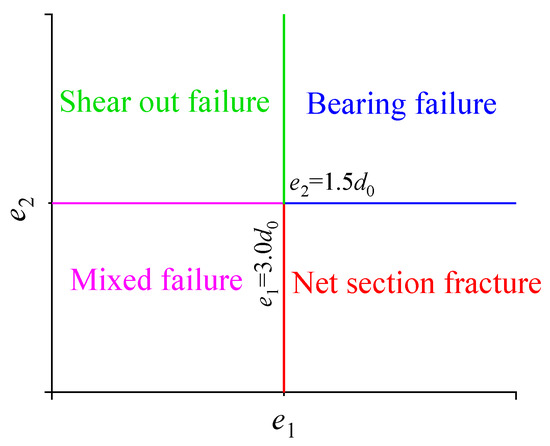
Figure 11.
Conditions of end/edge distance combinations for different failure modes according to EN1993-1-8 [7].
The failure modes could be predicted based on the analysis above, and the predicted failure modes were compared with those observed in our test. Table 5 lists the comparison results. On the basis of the results in Table 5, the percentage of specimens with different failure modes is presented in Figure 12.
Table 5.
Comparison of failure modes of test results and predictions.
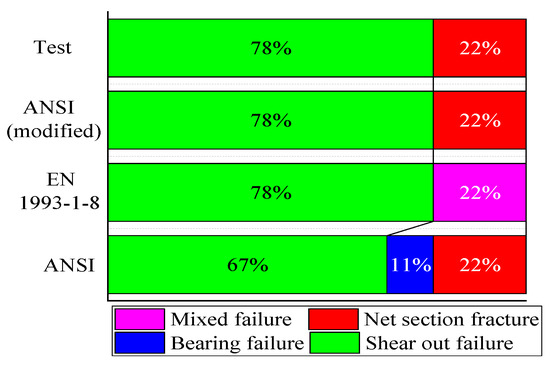
Figure 12.
Proportion of specimens with different failure modes [6,7].
The failure modes predicted by the modified ANSI/AISC 360-22 are identical to those of test results. Given an adequate edge distance, a bearing failure occurs when the end distance satisfies the conditions of e1 > 3.0d0 and e1 > 2.0d + 0.5d0 according to the EN1993-1-8 [7] and the ANSI/AISC 360-22 [6], respectively. Therefore, specimens with an end distance of 2.5d0 are predicted to have failed by shear-out and bearing, respectively. The mixed failure mode was predicted to occur for the specimens with an edge distance of 1.0d0 and 1.2d0 in accordance with the EN1993-1-8 [7]. However, a net-section fracture was observed for the specimens, as predicted by the ANSI/AISC 360-22 [6] and the modified ANSI/AISC 360-22. The correct decision for the failure modes is the basis of the accurate prediction of the bearing resistance. From the comparison above, it can be seen that the failure modes of the connections predicted by the modified ANSI/AISC 360-22 agree best with those of our test.
4.2. Comparison of Bearing Resistance
Table 6 lists the measured and predicted bearing resistance of all the specimens. The comparisons of the bearing resistance of the measurements and predictions are presented in Figure 13.
Table 6.
Comparison of failure modes of test results and predictions.
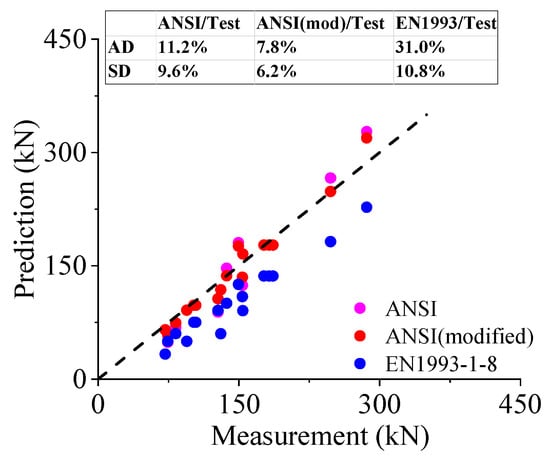
Figure 13.
Comparison of measured and predicted bearing resistance.
It can be seen that the bearing resistance predicted by the modified ANSI/AISC 360-22 agrees best with that of the test results, with an average difference and a standard deviation of 7.8% and 6.2%, respectively. The predictions of the EN1993-1-8 [7] are excessively conservative compared to the measurements, and the average difference and standard deviation are 31.0% and 10.8%, respectively.
For the specimens that failed by shear-out, the measured bearing resistance is generally lower than the predictions when the end distance of the specimens is less than 2.5d0. The ANSI/AISC 360-22 [6] and the modified ANSI/AISC 360-22 overestimate the bearing resistance by 17.6% and 14.7%, respectively, when the end distance of the specimens is equal to 2.5d0. This can be explained by the reduced area of the shear planes due to the fracture that occurred, as was mentioned in Section 3.2. In this case, a reduction factor of 0.85 is recommended, based on our test results.
From the comparison above, attention should be drawn to the calculation formula proposed on the basis of the test results of the hot-rolled steel specimens with a shear-out failure potentially overestimating the bearing resistance of the cold-formed steel connections because of the reduced area of the shear planes caused by a fracture. The existing test data are very limited, and further investigation is needed to confirm the proposed reduction coefficient.
5. Conclusions
This paper has presented the results of a comprehensive experimental and analytical study to investigate the bearing behavior of cold-formed thick-walled steel plates connected with a single bolt. The effects of the end distance, edge distance, and plate thickness on the failure modes and bearing resistance were investigated. The measured bearing resistance was compared with that calculated by (modified) ANSI/AISC 360-22 and EN1993-1-8. The main conclusions are as follows:
- (1)
- The bearing behavior of the specimens with 6 mm steel plates was similar to that with 10 mm steel plates. Shear-out and net-section fractures were the main failure modes in our test. Being different from the observations of the hot-rolled steel specimens, a fracture occurred on the shear planes of the thick-walled steel specimens because of the reduced ductility caused by the cold forming process.
- (2)
- The bearing resistance of specimens with a shear-out failure is linearly proportional to the end distance when the end distance is no more than 2.0d0. The scale factor between the bearing resistance and the end distance decreases when the end distance is beyond 2.0d0 because of the reduced area of shear planes caused by a fracture. In this case, the bearing resistance of the connections will be overestimated if the fracture that caused a reduction in the shear area is ignored, and a reduction factor of 0.85 is recommended based on our test results.
- (3)
- The measured failure mode is shear-out for the specimens with end distances of 2.5d0, and they are predicted to fail by bearing, according to ANSI/AISC 360-22. The measured failure mode is a net-section fracture for specimens with an edge distance of 1.0d0 and 1.2d0, and they are predicted to fail by a mixed failure according to the EN1993-1-8. The measured failure modes are exactly the same as those predicted by the modified ANSI/AISC 360-22. Meanwhile, the modified ANSI/AISC code gives the most accurate predictions of the bearing resistance, with an average difference of 3.7% and a standard deviation of 9.5%. The bearing resistance values predicted by the Eurocode are excessively conservative compared to the measurements, with an average difference of 31.1% and a standard deviation of 10.8%.
Author Contributions
Conceptualization, L.W.; Investigation, L.W. and X.Z. All authors have read and agreed to the published version of the manuscript.
Funding
This research was funded by Natural Science Foundation of Fujian Province (2022J01289).
Data Availability Statement
No new data were created or analyzed in this study. Data sharing is not applicable to this article.
Conflicts of Interest
The authors declare no conflict of interest.
References
- AISI S100-12; American Iron and Steel Institute. North American Specification for the Design of Cold-Formed Steel Structural Members. American Iron and Steel Institute: Washington, DC, USA, 2012.
- EN 1993-1-3; CEN. Eurocode 3: Design of Steel Structures. Part 1-3: General Rules-Supplementary Rules for Cold-Formed Members and Sheeting. European Committee for Standardization: Brussels, Belgium, 2006.
- GB 50018-2002; Technical Code of Cold-Formed Thin-Walled Steel Structures. Standardization Administration of the People’s Republic of China: Beijing, China, 2002. (In Chinese)
- AISI S100-16; American Iron and Steel Institute. North American Specification for the Design of Cold-Formed Steel Structural Members. American Iron and Steel Institute: Washington, DC, USA, 2016.
- GB 50018-2016; Technical Code of Cold-Formed Steel Structures; (Draft Standard for Discussion). Standardization Administration of the People’s Republic of China: Beijing, China, 2016. (In Chinese)
- ANSI/AISC 360-22; American Institute of Steel Construction. Specification for Structural Steel Buildings. American Institute of Steel Construction: Chicago, IL, USA, 2016.
- EN 1993-1-8; CEN. Eurocode 3: Design of Steel Structures. Part 1-8: Design of Joints. European Committee for Standardization: Brussels, Belgium, 2005.
- Guo, Y.J.; Zhu, A.Z.; Pi, Y.L.; Tin-Loi, F. Experimental study on compressive strengths of thick-walled cold-formed sections. J. Constr. Steel Res. 2007, 63, 718–723. [Google Scholar] [CrossRef]
- Hu, S.D.; Ye, B.; Li, L.X. Materials properties of thick-wall cold-rolled welded tube with a rectangular or square hollow section. Constr. Build. Mater. 2011, 25, 2683–2689. [Google Scholar] [CrossRef]
- Wang, Y.B.; Lyu, Y.F.; Li, G.Q.; Liew, J.R. Behavior of single bolt bearing on high strength steel plate. J. Constr. Steel Res. 2017, 137, 19–30. [Google Scholar] [CrossRef]
- Kim, T.S.; Kuwamura, H.; Kim, S.H.; Lee, Y.; Cho, T. Investigation on ultimate strength of thin-walled steel single shear bolted connections with tow bolts using finite element analysis. Thin-Walled Struct. 2009, 47, 1191–1202. [Google Scholar] [CrossRef]
- Toussaint, E.; Durif, S.; Bouchaïr, A.; Grédiac, M. Strain measurements and analyses around the bolt holes of structural steel plate connections using full-field measurements. Eng. Struct. 2017, 131, 148–162. [Google Scholar] [CrossRef]
- Teh, L.H.; Uz, M.E. Ultimate tilt-bearing capacity of bolted connections in cold-reduced steel sheets. J. Struct. Eng. 2017, 143, 04016206. [Google Scholar] [CrossRef]
- Xing, H.; Teh, L.H.; Jiang, Z.; Ahmed, A. Shear-out capacity of bolted connections in cold-reduced steel sheets. J. Struct. Eng. 2020, 146, 04020018. [Google Scholar] [CrossRef]
- Mai, B.V.; Pham, C.H.; Hancock, G.J.; Nguyen, G.D. Block shear strength and behaviour of cold-reduced G450 steel bolted connections using DIC. J. Constr. Steel Res. 2019, 157, 151–160. [Google Scholar] [CrossRef]
- Mahmood, M.; Elamin, A.; Tizani, W. Ultimate Strength and Fracture Sequence of Bolted Connections to Thin-Walled Carbon Steel. Structures; Elsevier: Amsterdam, The Netherlands, 2020; Volume 23, pp. 646–659. [Google Scholar]
- Xu, B.; Xia, J.; Ma, R.; Wang, J.; Chen, X.; Chang, H.; Zhang, L. Investigation on true stress-strain curves of flat and corner regions of cold-formed section using 3D digital image correlation method. Adv. Civ. Eng. 2019, 2019, 1–18. [Google Scholar] [CrossRef]
- GB/T 228.1-2010; Metallic Materials-Tensile Testing-Part 1: Method of Test at Room Temperature. Standardization Administration of the People’s Republic of China: Beijing, China,, 2010. (In Chinese)
- Clements, D.D.A.; Teh, L.H. Active shear planes of bolted connections failing in block shear. J. Struct. Eng. 2013, 139, 320–327. [Google Scholar] [CrossRef]
- Cai, Q.; Driver, R.G. Prediction of bolted connection capacity for block shear failures along atypical paths. Eng. J. AISC 2010, 47, 213–221. [Google Scholar]
- Teh, L.H.; Deierlein, G.G. Effective shear plane model for tearout and block shear failure of bolted connections. Eng. J. AISC 2017, 54, 181–194. [Google Scholar]


Disclaimer/Publisher’s Note: The statements, opinions and data contained in all publications are solely those of the individual author(s) and contributor(s) and not of MDPI and/or the editor(s). MDPI and/or the editor(s) disclaim responsibility for any injury to people or property resulting from any ideas, methods, instructions or products referred to in the content. |
© 2023 by the authors. Licensee MDPI, Basel, Switzerland. This article is an open access article distributed under the terms and conditions of the Creative Commons Attribution (CC BY) license (https://creativecommons.org/licenses/by/4.0/).