Article

Performance Analysis of University Collaborative Innovation Center Based on BPNN-Dominated K-Means–Random Forest Unsupervised Factor Importance Analysis Model

1
College of Economics and Management, Nanjing University of Aeronautics and Astronautics, Nanjing 211106, China
2
Scientific Research Department, Nanjing Audit University, Nanjing 211815, China
3
School of Safety Engineering, China University of Mining and Technology, Xuzhou 221116, China
*
Author to whom correspondence should be addressed.
Appl. Sci. 2023, 13(11), 6818; https://doi.org/10.3390/app13116818
Submission received: 20 April 2023 / Revised: 26 May 2023 / Accepted: 2 June 2023 / Published: 4 June 2023
(This article belongs to the Section Computing and Artificial Intelligence)

Abstract

:
The collaborative innovation plan for colleges and universities is one of the important plans for the construction of high-level universities in Jiangsu Province. A key aspect of this plan is the development of collaborative innovation centers in colleges and universities. Based on the second-phase construction of collaborative innovation centers in 76 colleges and universities in Jiangsu Province, this paper constructs performance evaluation indicators and proposes an unsupervised factor importance analysis model based on Back Propagation Neural Network (BPNN)-dominated K-means and random forests. According to the analysis results, suggestions for further promoting the development of high-quality collaborative innovation centers in colleges and universities are provided.

1. Introduction

Jiangsu Province began to implement a collaborative innovation plan for colleges and universities in 2012. Currently, based on annual selection and supplementation, there are five national “2011 Collaborative Innovation Centers” in colleges and universities in the province, ranking second in China. Moreover, the Ministry of Education has identified 10 provincial and ministerial collaborative innovation centers, ranking them first in the country in total. The universities in Jiangsu are home to 76 collaborative innovation centers. As part of the construction of high-level universities in Jiangsu, the Jiangsu University collaborative innovation plan has been listed as one of the four major projects and is continually being implemented in depth.
The purpose of this type of performance evaluation is to evaluate and promote construction, gain a comprehensive understanding of the project development and management situation, and determine the obtained output benefits. In addition, it aims to establish a more standardized evaluation system for the performance of the collaborative innovation center project. It serves as a decision-making reference for improving fund management in the third phase of the collaborative innovation plan and promoting the advancement of the collaborative innovation projects. The scientific and reasonable nature of the performance evaluation determines the effectiveness and quality of the implementation of the entire university’s collaborative innovation plan.
Performance evaluation holds significant practical value in various industries. The selection of appropriate performance evaluation indicators and algorithms further contributes to enhancing industry standards [1,2,3]. During performance evaluation, the weight of each characteristic factor needs to be determined. This can be conducted using the analytic hierarchy process (AHP), which is a systematic and hierarchical analysis method that combines qualitative and quantitative analysis. It serves as a model and decision-making method for complex systems that are difficult to quantify completely [4]. Fashoto et al. employed AHP in a business employee performance evaluation system to determine employee performance based on individual goals required by the organization [5]. Anto et al. integrated the AHP algorithm with the TOPSIS algorithm to construct a performance evaluation system. The authors determined weights using the AHP algorithm and implemented the TOPSIS algorithm for ranking [6]. Rajabpour et al. used the fuzzy analytic hierarchy process to translate expert opinions into factors and assess the relationships between them [7]. However, the AHP algorithm requires some manual intervention because different weights may be set for varying situations.
Principal Component Analysis (PCA) is another widely used technique in performance evaluation, particularly in scenarios with a large number of features. The PCA algorithm maps a high-dimensional feature space to lower dimensions to achieve the purpose of simplification [8]. Lv et al. developed a performance evaluation system tailored to the circumstances of Higher Vocational College teachers, using a combination of the PCA and AHP algorithms for evaluation [9]. Wu et al. used the PCA algorithm and envelop analysis to determine the energy security performance of each country in their research on the trend of energy security performance [10]. However, although the PCA algorithm is widely used in data dimension reduction, the interpretability of the resulting principal components is slightly weaker.
Multiple criteria decision-making (MCDM) techniques can provide optimal solutions and help find alternatives suitable for specific complex situations. The analytic hierarchy process (AHP), as a globally recognized methodology, is the success of MCDM technology. In particular, Kumar, A., et al. review the application of AHP to various agriculture-related problems [11]. Rawat, S.S., et al. provide a contrast to the emergence of AHP applications. Between 2011 and 2022, it was widely used. Disciplines include renewable energy, sustainable manufacturing, natural disasters, environmental pollution, landfill waste management, and many other issues that fall explicitly or implicitly under the theme of sustainable development [12].
The entropy method, rooted in information theory, is an unsupervised weight determination method that is widely used in performance evaluation [13]. Archer et al. used entropy analysis and the TOPSIS method for employee performance evaluation, which improved the interpretability of the evaluation and helped to identify the strengths and weaknesses of each employee, thus furthering the development of the employees [14]. Chen et al. used an evaluation model that combined entropy weight with improved D-S evidence theory to evaluate the performance of large infrastructure projects in terms of their operation and maintenance [15]. Feng et al. applied the entropy method to the fuzzy comprehensive evaluation of the investment performance of electric power companies, which provided a theoretical basis for government performance evaluation [16].
The regression model based on machine learning algorithms has an absolute effectiveness frontier, surpassing traditional packet analysis methods in terms of analysis efficacy. Zhong et al. integrated the neural network model with the performance evaluation method to reduce the impact of statistical noise in the data and address the inherent issues with the data packets [17]. Deng et al. improved the importance–performance analysis (IPA) algorithm by integrating the back-propagation neural network (BPNN) and the three-factor theory for effective performance analysis [18].
Therefore, this paper presents a BPNN-dominated K-means–random forest unsupervised factor importance analysis model for the performance analysis of university collaborative innovation centers. This study is aimed at the 76 collaborative innovation centers in Jiangsu Province, constructs evaluation indicators based on the performance statistics of the second phase, and assigns an importance index to each characteristic factor based on the model. Based on this importance index, this paper provides suggestions on how to promote the high-quality connotative development of the collaborative innovation center and further improve the construction efficiency, acting as a reference for the management and construction of the collaborative innovation center in the future.

2. Material and Methods

2.1. Building an Evaluation Index System for the Construction of Universities’ Collaborative Innovation Center

Based on the second phase performance statistics of the Jiangsu University Collaborative Innovation Center, we give the main factors that affect the construction of this institution, including operation guarantee ability, capital input and output, scientific research and innovation ability, social services and contributions, personnel training and team building, and international cooperation and exchange. This set of evaluation indicators is rich, cutting-edge, and instructive, which is reflected in the fact that it covers all the indicators required for the effective operation of the collaborative innovation center in colleges and universities. The evaluation results of these attribute indicators can objectively reflect the operation of an efficient collaborative innovation center. The frontier of the indicators reflects that they have certain requirements for the international cooperation and communication ability of the university collaborative innovation center, which requires an international perspective at an advanced level. The guidelines of the indicators are reflected in their importance; they play an important role in directing the future development focus of each university’s collaborative innovation center. For the purpose of this study, under each first-level index, we refine the second- and third-level indicators, for a total of 61 third-level indicators, as shown in Table 1.

2.2. Unsupervised Factor Importance Analysis Model for the Construction of Universities’ Collaborative Innovation Centers

The evaluation index system for the construction of collaborative innovation centers in colleges and universities in Jiangsu Province is composed of six first-level indicators, 19 second-level indicators, and 61 third-level indicators. The sample data refers to 76 collaborative innovation centers in colleges and universities in Jiangsu Province. To analyze the importance of different indicators in the evaluation index, we use a random forest model to classify the collaboration centers and evaluate each of the three-level indicators. However, the random forest model lacks prior monitoring information. Therefore, we first use the K-means unsupervised clustering algorithm to construct the prior clustering information needed for random forests, after which we use the random forest model to analyze the importance of each three-level index. The structure of our proposed method is shown in Figure 1.

2.2.1. Data Preprocessing Based on BPNN

Principles of Neural Network and BPNN

The neural network is a computing model that is composed of a large number of interconnected neurons. In addition to the input neurons, each neuron represents a distinct output function, which is also known as the excitation function. The connection between each pair of nodes represents a weighted value of the signal passing through the connection, which is called the weight and is equivalent to the memory of the artificial neural network. The output of the network varies with the connection mode, weight value, and excitation function of the network. In general, neural networks can be classified into the forward type, feedback type, random type, and competitive type.
BPNN is a kind of feedforward neural network. It includes a back-propagation algorithm in addition to the standard structure of the feedforward neural network, which is used to adjust the weights and thresholds of the network during training.

Optimize Data Validity Using the BPNN Training Model

The existence of noise in the training sample data may cause unpredictable deviations in the importance assessment. The training model based on BPNN can check and fill the data and simultaneously classify and rearrange the effective data against the evaluation index system to improve the validity of the data. The output data is then normalized to minimize the error between data and improve the accuracy of the results.

2.2.2. K-Means and K-Means++ Clustering Algorithms

K-Means Algorithm

The K-means algorithm is an unsupervised clustering algorithm [19]. It divides the data into k clusters, where the centroid, also referred to as the center of each cluster, is determined by the mean of the data in that cluster. Set the dataset to be clustered to  X = { x 1 , x 2 , , x n } , and the ith cluster to be divided to D_i; then the steps of the K-means algorithm are as follows:
  • Randomly select k centroids  u 1 , u 2 , , u k    in  X .
  • Calculate the distance from  x i  to each centroid  | x i u k | 2 , select the centroid  u p  with the minimum distance from  x i  to each centroid, and update the cluster  D p = u p   x i .
  • Calculate the mean within each cluster and update the centroids.
  • Repeat steps 2 and 3 to obtain the cluster  { D i } i = 1 k .

K-Means++ Algorithm

The K-means algorithm has been proven to be convergent. However, the random selection of the initial centroids in this algorithm has a great impact on the final result and running speed. Therefore, the K-means++ algorithm has been designed to optimize the selection of the initial centroids [20]. The steps of the K-means++ algorithm are as follows:
  • Randomly choose an initial centroid  u 1 .
  • Calculate the minimum distance  d i  from  x i  to the selected centroid.
  • Select the next centroid according to the probability; the sample with larger  d i  has a greater probability of being selected.
  • Repeat steps 2 and 3 until k centroids are selected.

Method for Determining Cluster Number K

Within the K-means series of algorithms, the number of clusters, denoted by K, is a very important parameter that plays a crucial role in the division of the data into multiple clusters. The selection of k typically involves two methods: the elbow method and the silhouette coefficient method.
The core idea of the elbow method is to evaluate the sum of squares of errors (SSE):
SSE = i = 1 k x D i | x u i | 2  
As the number of clusters k increases, the degree of aggregation in each cluster increases as well. Consequently, the squared error and SSE become smaller. When the decline in the SSE is no longer significant, the benefits of increasing the k-value are minimal. The diagram shows the inflection point of the SSE image.
The elbow method usually requires manual observation of the location of the inflection point to select the k value, while the contour factor method determines the rationality of the clustering method by calculating the silhouette coefficient of the clustering result. The steps for the contour factor method are as follows:
  • For  x i  of cluster  D p , calculate the dissimilarity  a ( i )  within the cluster:
a ( i ) = 1 c a r d ( D p ) x D p | x i x | 2
2.
Calculate the inter-cluster dissimilarity  b ( i )  of  x i  of the cluster  D p :
b ( i ) = m i n { 1 c a r d ( D s ) x D s | x i x | 2 } s p
3.
Calculate the silhouette coefficient  s ( i )  of  x i :
  s ( i ) = b ( i ) a ( i ) m a x { a ( i ) , b ( i ) }
4.
The average of the silhouette coefficients  s ( i )  of all samples is calculated as the silhouette coefficient of the clustering result. A larger silhouette coefficient of the clustering result indicates a more reasonable clustering result.

2.2.3. Random Forest Algorithm

Decision Tree

The decision tree is a tree-like prediction model in machine learning that is widely used in various fields because its output results are easy to understand [21]. It has a flowchart-like structure in which each branch represents a choice. Moreover, each leaf node corresponds to a classification and produces a rule that consists of the conditions along all the paths from the root node to the leaf node. The conclusions presented on the leaf node represent the conclusions derived from the corresponding rules. In machine learning, the decision tree is a prediction model that represents a mapping relationship between the attributes and values of an object.

Random Forest

Random forests are classifiers that use multiple decision trees to train and predict samples [22]. Each classifier in a random forest is a decision tree. At each node, a decision tree is generated by splitting randomly selected attributes. Subsequently, when performing classification, the outcomes are determined through a voting process involving multiple decision trees. Based on the above mechanism, random forests are less prone to overfitting and are more stable when dealing with error points and outliers.
The random forest algorithm builds each tree according to the following steps:
  • Let N represent the number of training cases (samples), and M represent the number of features. The number of input features m is used to determine the decision result of a node on the decision tree, where m should be much smaller than M.
  • From the N training samples in the way of sampling with replacement, sampling N times to form a training set, and using the unsampled samples as predictions to evaluate the error.
  • For each node, m features are randomly selected, and the decision of each node on the decision tree is determined based on these features. According to the m features, calculate the optimal splitting method.
  • Each tree grows fully without pruning.

Feature Importance Evaluation Based on Random Forest Algorithm

Since the random forest algorithm uses random sampling with replacement, about one-third of the data is not used and does not participate in the establishment of the decision tree. This part of the data can be used to evaluate the performance of the decision tree and calculate the prediction error rate of the model, which is called out-of-bag (OOB). The importance of a characteristic factor can be judged by calculating the change in OOB.
Let  x = [ x i ] i = 1 n  be the training dataset, where  x p = ( a 1 ( p ) , a 2 ( p ) , , a m ( p ) ) . In order to study the importance of the ith feature, we are essentially studying the influence of this feature on the overall classification effect. Specifically, the method used to calculate the importance of a feature in the random forest is as follows:
  • First train a random forest classifier  y = f ( x )  and calculate  O O B 1 .
  • Apply random perturbation  ε  to the ith feature, that is,  x = [ x i ] i = 1 n , where  x p = ( a 1 ( p ) , a 2 ( p ) , , a i ( p ) + ε p , , a m ( p ) ) .
  • Train a random forest classifier  y = g ( x )  and calculate  O O B 2 .
Then the importance of the ith feature is:
  imp ( i ) = O O B 2 O O B 1
After calculating the importance of each feature, the ranking of all feature factors can be assigned.
The complete algorithm flow is shown in Algorithm 1.
Algorithm 1:
Based on BPNN-dominated K-means-Random Forest Unsupervised Factor Importance Analysis Model
Input: Sample data and evaluation indicators.
Output: Evaluate the importance results of each feature.
  • Input sample data and evaluation indicators into the BPNN model for data preprocessing.
  • Obtain normalized data Z.
  • Input normalized Z into the K-means++ algorithm model (use the elbow method and the silhouette coefficient method to determine the k value).
  • Obtain unsupervised results  Y .
  • Use Z Y  to construct classified training data  ( Z , Y ) .
  • Input the training data into the random forest model (determine the number of estimators using the 5-fold cross-validation method).
  • The importance results of each feature are obtained after the classification of random forests is completed.

2.2.4. Major Limitations of the Model and Wider Applicability

Major Limitations of the Model

The main limitations of the model are mainly reflected in the following three aspects: For high-dimensional data, the results of factor importance analysis may be affected by dimensional disaster, leading to inaccurate analysis results. For nonlinear data, the expression ability of the BPNN model may be insufficient, leading to inaccurate factor importance analysis results. For large-scale data, the computational complexity of the K-means algorithm may be very high, resulting in low analysis efficiency.

The Wide Applicability of the Model

Although the model has some limitations, it also has a wide range of applicability. For data sets whose data distribution is not obvious or irregular, the K-means algorithm can effectively perform clustering, thus improving the accuracy of factor importance analysis. The BPNN model can model nonlinear data to improve the accuracy of factor importance analysis. The random forest algorithm can effectively avoid overfitting and improve the accuracy of factor importance analysis.

3. Results and Discussion

3.1. Data Source and Preprocessing

This paper uses the second-phase performance statistics of 76 university collaborative innovation centers in Jiangsu Province as sample data. According to the evaluation index system for the construction of a university collaborative innovation center, the sample data is first validated; the data points that do not conform to the statistical characteristics and are unreasonable are eliminated, and the missing values are filled using the median method.
In order to eliminate the feature deviation caused by different data dimensions and ranges, we normalize the data in the preprocessing stage. Let  X = [ x i j ] m × n  represent the index value matrix of all collaborative innovation centers; then, the normalized data matrix Z is given by:
Z = x i j x ¯ j s j
where:
        x ¯ j = 1 m i = 1 m x i j
                              s j = 1 m 1 i = 1 m ( x i j x ¯ j ) 2

3.2. Unsupervised Data Clustering with K-Means++

In this paper, we use K-means++ to perform unsupervised clustering on standardized data to identify the category of each collaborative innovation center. The clustering results are transferred to a random forest model for feature importance analysis.
To determine the number of clusters k, we combine the elbow method, and the silhouette coefficient method. Figure 2 shows the result obtained from the elbow method, and Figure 3 shows the result of the silhouette coefficient method. Combining the results of these two methods to determine the k value, we choose k = 2 in this paper, that is, divide all the data into two categories. After the clustering is complete, the result  Y = ( y 1 , y 2 , , y m )  corresponding to each data is provided to the random forest algorithm.

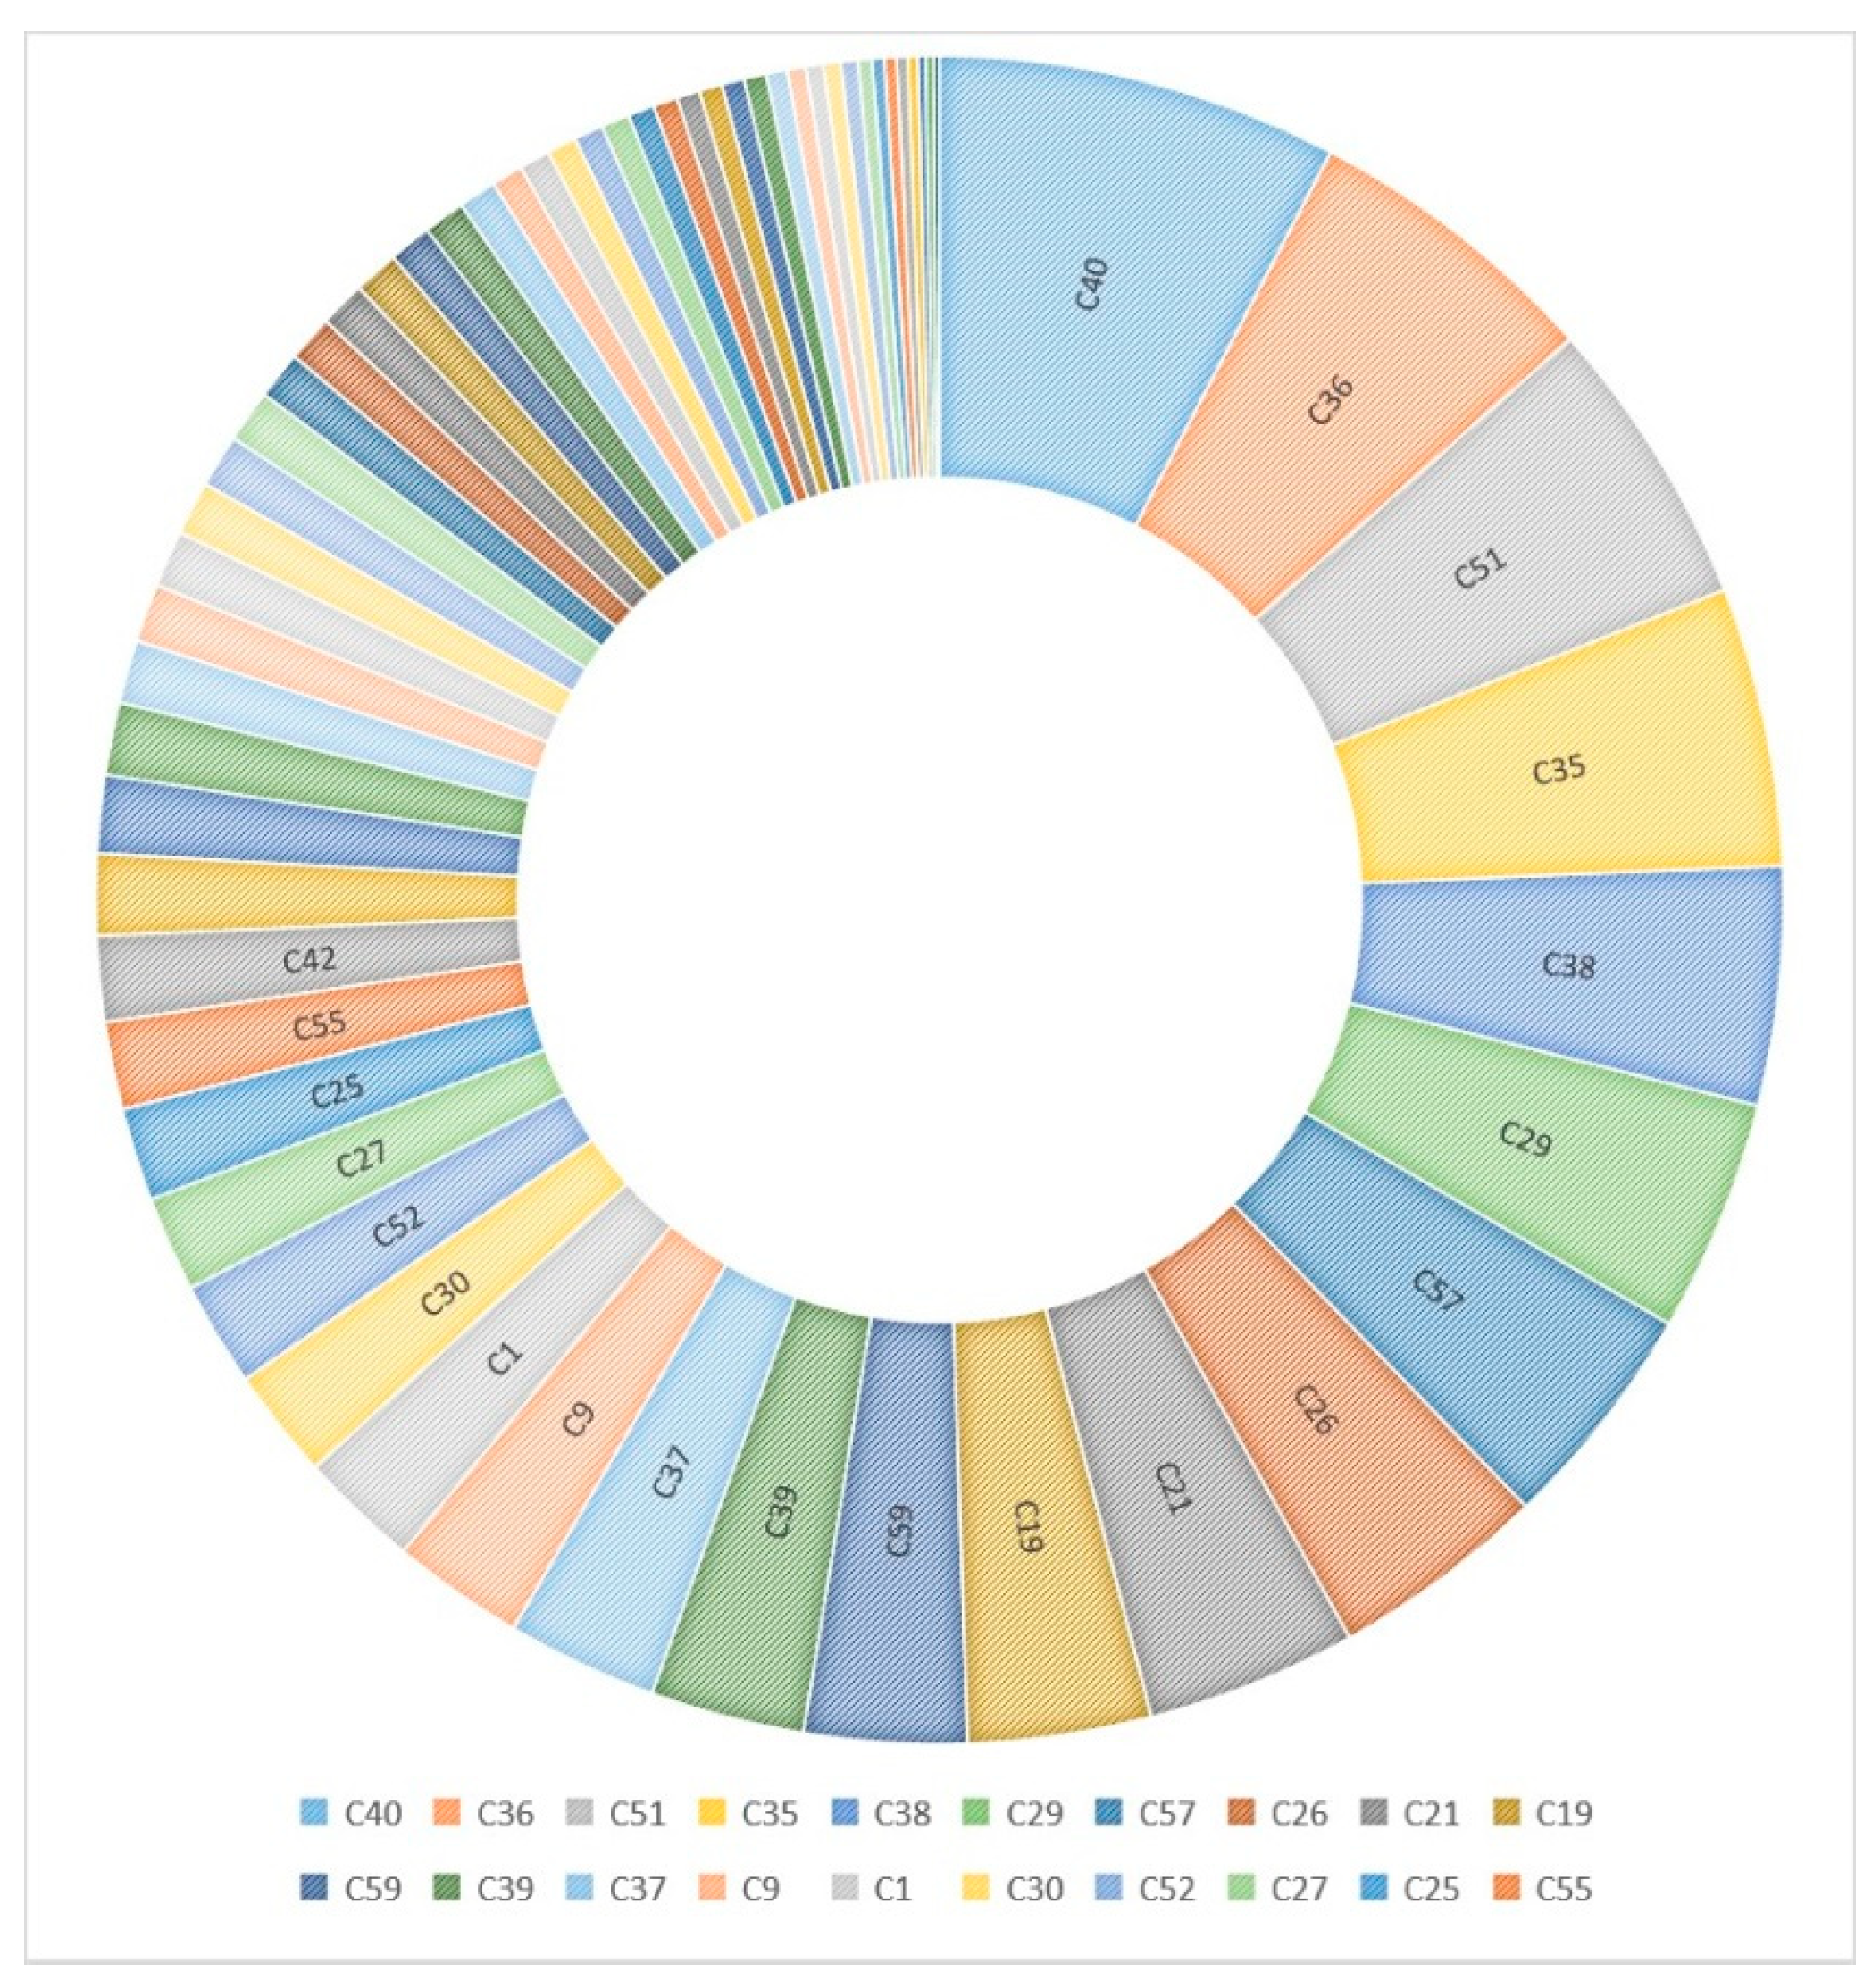
3.3. Random Forest Algorithm Feature Importance Analysis

We use the normalized data  Z  and unsupervised clustering result  Y  to construct the classification training data  ( Z , Y )  and input the training data into the random forest model. In random forest models, the number of estimators is an important parameter. Based on the specific situation of the data, we adopt the method of 5-fold cross-validation, traverse all the evaluators in the set  { e | e = 100 + 50 p , p N , 0 p 18 } , and select the one with the best effect. Figure 4 shows the results of the experiment that considered the estimator number as a parameter. Based on the experimental results, the number of evaluators we choose is 600. In addition, the results of cross-validation are good, indicating that the random forest model has good interpretability for the clustering results of the K-means algorithm.
Once the random forest model completes the classification, the importance results for each feature are obtained, as shown in Figure 5.

3.4. Analysis of the Construction of Universities’ Collaborative Innovation Center in Jiangsu

According to the analysis results of the model, we can draw the following conclusions:
  • Scientific research innovation and output are important first-level indicators for evaluating collaborative innovation centers. The results of the analysis indicate that the significance levels of multiple three-level indicators based on this indicator are relatively high. In particular, all the third-level indicators under the second-level indicators of scientific research projects are higher than the average level. These findings suggest that in the later construction process, the collaborative innovation center should further improve the quantity and quality of scientific research projects. Moreover, the government should continue to promote research and development as well as provide financial support for the project. In addition, the importance of the scientific research awards of the leading universities is relatively high, indicating that these universities should maintain their leading role, ensure collaborative work with the member universities, and continue to produce high-quality output. This output should constitute not only academic papers but also independent intellectual property rights.
  • Funding input and output are crucial to the operation of any collaborative innovation center. The support of industries and local governments constitutes an important funding source. To ensure the development of an innovative country, industries and local governments should establish a reasonable funding scale and cycle for the project based on current reality. Additionally, they should strengthen the macro-control of the project discipline layout. It is essential to provide guidance for the unpopular, weak, and “shrinking” disciplines and areas that are significant in the context of long-term economic and social development. For the collaborative innovation center, establishing a long-term mechanism and a relatively clear policy funding period scheme can create a stable and predictable environment, which is more conducive to the strategic design of collaborative innovation and the selection of a long-term roadmap.
  • In terms of talent training and team building, each collaborative innovation center should pay attention to the talent plan at the provincial, ministerial, and higher levels, as well as focus on the talents that are the source of continuous innovation within the collaborative innovation center. This is because the essence of the collaborative innovation drive is talent. Each collaborative innovation center should take responsibility for the introduction and cultivation of talents, break the constraints of the original system, continuously enhance the vitality and competitiveness of the center in terms of scientific research, condense the research direction, and form a high-level team.
  • A modern university collaborative innovation center should have an international vision. Aiming for high-level results on an international scale can improve the quality and global recognition of the research at the collaborative innovation center. Moreover, actively organizing and conducting major international collaborative research projects and obtaining advanced experience through exchange programs can further improve the quality of the collaborative innovation center.

4. Conclusions

This study is aimed at the 76 collaborative innovation centers in Jiangsu Province and constructs evaluation indicators based on the performance statistics of the second phase. Specifically, this paper presents a BPNN-dominated K-means–random forest unsupervised factor importance analysis model for the performance analysis of university collaborative innovation centers and assigns an importance index to each characteristic factor based on the model. The research shows that the feature analysis method based on this model does not require manual intervention, and the obtained results have good interpretability, which helps to provide a policy reference for government departments to improve performance management and evaluation methods. Additionally, it provides decision support for collaborative innovation centers to improve performance. Last but not least, the proposed model has certain limitations for high-dimensional data, nonlinear data, and large-scale data. Subsequent work will focus on model optimization in this area.

Author Contributions

Methodology, D.Z.; Writing – original draft, D.Z.; Visualization, S.W.; Funding acquisition, S.W. All authors have read and agreed to the published version of the manuscript.

Funding

This research received no external funding.

Data Availability Statement

No data statement.

Conflicts of Interest

The authors declare no conflict of interest.

References

  1. Lohman, L. Evaluation of university teaching as sound performance appraisal. Stud. Educ. Eval. 2021, 70, 101008. [Google Scholar] [CrossRef]
  2. Morley, M.J.; Murphy, K.R.; Cleveland, J.N.; Heraty, N.; McCarthy, J. Home and host distal context and performance appraisal in multinational enterprises: A 22 country study. Hum. Resour. Manag. 2021, 60, 715–736. [Google Scholar] [CrossRef]
  3. Ullah, Z.; Alvarez-Otero, S.; Sulaiman, M.A.; Bait, A.; Sial, M.S.; Ahmad, N.; Scholz, M.; Omhand, K. Achieving organizational social sustainability through electronic performance appraisal systems: The moderating influence of transformational leadership. Sustainability 2021, 13, 5611. [Google Scholar] [CrossRef]
  4. Chang, D.Y. Applications of the extent analysis method on fuzzy AHP. Eur. J. Oper. Res. 1996, 95, 649–655. [Google Scholar] [CrossRef]
  5. Fashoto, S.G.; Amaonwu, O.; Afolorunsho, A. Development of A Decision Support System on Employee Performance Appraisal using AHP Model. JOIV: Int. J. Inform. Vis. 2018, 2, 262–267. [Google Scholar] [CrossRef] [Green Version]
  6. Pohan, A.B.; Hadi, S.W.; Rahmatullah, S.; Zuama, R.A.; Rifai, A.; Gunawan, D. Employee Performance Apparaisal Using Decision Support System by AHP and TOPSIS Methods. J. Tek. Komput. 2021, 7, 100–105. [Google Scholar] [CrossRef]
  7. Rajabpour, E.; Mohammad, R.F.; Mohsen, T. Analysis of factors affecting the implementation of green human resource management using a hybrid fuzzy AHP and type-2 fuzzy DEMATEL approach. Environ. Sci. Pollut. Res. 2022, 29, 48720–48735. [Google Scholar] [CrossRef] [PubMed]
  8. Anowar, F.; Samira, S.; Bassant, S. Conceptual and empirical comparison of dimensionality reduction algorithms (pca, kpca, lda, mds, svd, lle, isomap, le, ica, t-sne). Comput. Sci. Rev. 2021, 40, 100378. [Google Scholar] [CrossRef]
  9. Lv, J. Research on the Construction of Scientific Research Evaluation System for Teachers in Higher Vocational Colleges Based on Computer PCA and ANP. In Proceedings of the EAI International Conference, Virtual Event, 1–3 August 2021; pp. 327–335. [Google Scholar]
  10. Wu, T.; Chung, Y.F.; Huang, S.W. Evaluating global energy security performances using an integrated PCA/DEA-AR technique. Sustain. Energy Technol. Assess. 2021, 45, 101041. [Google Scholar] [CrossRef]
  11. Kumar, A.; Pant, S. Analytical hierarchy process for sustainable agriculture: An overview. MethodsX 2022, 10, 101954. [Google Scholar] [CrossRef] [PubMed]
  12. Rawat, S.S.; Pant, S.; Kumar, A.; Ram, M.; Sharma, H.K.; Kumar, A. A State-of-the-Art Survey on Ana-lytical Hierarchy Process Applications in Sustainable Development. Int. J. Math. Eng. Manag. Serv 2022, 7, 883–917. [Google Scholar]
  13. Cui, X.Y.; Zhao, T.; Wang, J. Allocation of carbon emission quotas in China’s provincial power sector based on entropy method and ZSG-DEA. J. Clean. Prod. 2021, 284, 124683. [Google Scholar] [CrossRef]
  14. Archer, B.B.; Tetteh, A. Can entropy and TOPSIS be used to analyse personnel effectiveness appraisal scheme in an organization? Int. J. Decis. Sci. 2021, 10, 78–92. [Google Scholar]
  15. Chen, D.; Xiang, P.C.; Jia, F.Y. Performance Measurement of Operation and Maintenance for Infrastructure Mega-Project Based on Entropy Method and DS Evidence Theory. Ain Shams Eng. J. 2022, 13, 101591. [Google Scholar] [CrossRef]
  16. Feng, L.; Li, W.; Zhao, L.; Yang, Y.; Zhang, W.; Liu, Y.J.; Li, M.Y. Investment Performance Model of Regional Power Grid Based on Entropy Weight Fuzzy Comprehensive Evaluation. In Innovative Computing; Springer: Singapore, 2022; pp. 1275–1287. [Google Scholar]
  17. Zhong, K.Y.; Wang, Y.F.; Pei, J.M.; Tang, S.M.; Han, Z.L. Super efficiency SBM-DEA and neural network for performance evaluation. Inf. Process. Manag. 2021, 58, 102728. [Google Scholar] [CrossRef]
  18. Deng, W.J.; Chen, W.C.; Pei, W. Back-propagation neural network based importance-performance analysis for determining critical service attributes. Expert Syst. Appl. 2008, 34, 1115–1125. [Google Scholar] [CrossRef]
  19. Krishna, K.; Murty, M.N. Genetic K-means algorithm. IEEE Trans. Syst. Man Cybern. Part B (Cybern.) 1999, 29, 433–439. [Google Scholar] [CrossRef] [PubMed] [Green Version]
  20. Arthur, D.; Vassilvitskii, S. K-Means++: The Advantages of Careful Seeding; Stanford University: Santa Clara, CA, USA, 2007; pp. 1027–1035. [Google Scholar]
  21. Myles, A.J.; Feudale, R.N.; Liu, Y.; Woody, N.A.; Brown, S.D. An introduction to decision tree modeling. J. Chemom. A J. Chemom. Soc. 2004, 18, 275–285. [Google Scholar] [CrossRef]
  22. Speiser, J.L.; Miller, M.E.; Tooze, J.; Ip, E. A comparison of random forest variable selection methods for classification prediction modeling. Expert Syst. Appl. 2019, 134, 93–101. [Google Scholar] [CrossRef] [PubMed]
Figure 1. Structure of unsupervised factor importance analysis model.
Applsci 13 06818 g001
Figure 2. Results of determining k value by elbow method.
Applsci 13 06818 g002
Figure 3. The result of determining the value of k by the silhouette coefficient method.
Applsci 13 06818 g003
Figure 4. The experimental results of different numbers of estimators.
Applsci 13 06818 g004
Figure 5. Results of the factor importance analysis of the construction of the universities’ collaborative innovation center. The figure shows the three-level indicators, and detailed information can be obtained in Table 1.
Applsci 13 06818 g005
Table 1. Evaluation indicators.
First-Level IndicatorsSecond-Level IndicatorsThird-Level Indicators
A1: Operation and GuaranteeB1: EmployeeC1: Total number
C2: Full-time
C3: Part-time and double employment
C4: Visiting and mobile
C5: Academicians
C6: Yangtze River scholars
C7: Distinguished youths
C8: National Overseas High-Level Talent Program
C9: Talent plan for provincial, ministerial, and higher levels
B2: Condition guaranteeC10: Construction area
C11: Existing provincial and ministerial level and above base platforms
C12: The number of large equipment
C13: Value of large equipment
B3: Publicity reportsC14: Provincial and ministerial level and above publicity reports
C15: Jiangsu University Collaborative Innovation Program Briefing Released
A2: Funds input and expenditureB4: Funds inputC16: Total funds input
C17: Provincial Special Funds
C18: National funds for education, science, and technology
C19: Industry Departments and Local Government Support Funds
C20: Enterprise Input, University Self-raising, and International Cooperation Funds
B5: Funds expenditureC21: Total funds expenditure
C22: Provincial special funds
A3: Scientific research innovation and outputB6: Research awardsC23: Winning the national scientific research achievement award
C24: National awards for scientific research achievements hosted by leading universities
C25: Winning the provincial and ministerial level scientific research achievement awards
C26: Provincial and ministerial scientific research achievements hosted by leading universities
B7: Academic papersC27: International authoritative journal papers
C28: Top-ranking domestic periodical papers
B8: Intellectual propertyC29: Number of authorized patents
C30: Patents for intentions
C31: International patents for inventions
C32: Transfer or license patents
C33: Amount of patent contract for assignment or license
C34: Lay down a criterion
B9: Research projectC35: New research projects
C36: New research project funds
C37: New major research projects
C38: National research projects
C39: Provincial and ministerial research projects
C40: Total funds for research projects at or above the provincial level
B10: Base PlatformC41: New Key Research Platform
C42: Research platforms for provincial, ministerial, and higher levels
A4: Social services and contributionsB11: Achievement transformationC43: Transfer and transformation of major scientific research achievements
C44: Directly driving new industrial output value
B12: Social servicesC45: Carrying out industrial technology training
C46: Provision of think tanks for decision-making and addressing critical issues
A5: Talent Training and Team BuildingB13: Training and Importing TalentsC47: Academicians
C48: Yangtze River scholars
C49: Distinguished youths
C50: National Overseas High-Level Talent Program
C51: Talent plan for provincial and ministerial levels and above
B14: Personnel trainingC52: Train students with master’s or above degrees
B15: New Innovation TeamC53: New Innovation Team
C54: Innovation Teams at and above the provincial level
A6: International Cooperation and ExchangeB16: New Major International Cooperation StudiesC55: New Major International Cooperation Studies
B17: To host (undertake) international academic conferencesC56: To host (undertake) international academic conferences
B18: New positions in international academic institutions and international academic journalsC57: Total numbers
C58: New positions in international academic institutions
C59: New positions in international academic journals
B19: International exchange and mutual visits of personnelC60: Dispatch personnel
C61: Visitors
Disclaimer/Publisher’s Note: The statements, opinions and data contained in all publications are solely those of the individual author(s) and contributor(s) and not of MDPI and/or the editor(s). MDPI and/or the editor(s) disclaim responsibility for any injury to people or property resulting from any ideas, methods, instructions or products referred to in the content.

