Article

Assessing Non-Intrusive Wearable Devices for Tracking Core Body Temperature in Hot Working Conditions

1
Department of Construction Science, Texas A&M University, 574 Ross St., College Station, TX 77840, USA
2
Department of Chemical and Biological Engineering, The University of Alabama, 7th Avenue, Tuscaloosa, AL 35487, USA
*
Author to whom correspondence should be addressed.
Appl. Sci. 2023, 13(11), 6803; https://doi.org/10.3390/app13116803
Submission received: 13 April 2023 / Revised: 1 June 2023 / Accepted: 1 June 2023 / Published: 3 June 2023

Abstract

:
Heat-related illness is a growing concern for workers in temperate climates as rising temperatures and heatwaves put them at risk of exertional heat stroke. Monitoring biometrics that predict heat stroke, such as core temperature, is increasingly important. To monitor biometrics, wearable sensing technologies have been proposed as an alternative to the ingestible telemetric pill. However, limited studies have validated the accuracy of these sensors in different temperature conditions. Therefore, this study aims to assess the validity of wearable devices placed on different areas of the body for measuring core body temperature (CT) during repetitive physical activity in high temperature conditions. Ten male participants performed dumbbell curling exercises at 33 °C and roughly 50% relative humidity, and data from the pill (the criterion standard) were compared to data from two wearable sensors–Slate Safety and Zephyr. Results showed that Slate Safety [Bias (Precision) = 0.20 (0.35) °C) and Zephyr [Bias (Precision) = −0.03 (0.35) °C] recorded bias and precision within acceptable limits. The correlation analysis showed that wearable sensors are suitable for real-time monitoring of an individual’s level of heat stress in high temperatures. However, there was a proportional bias with these CT measuring devices, meaning that the reported temperature values are consistently deviated from the true values. The results of this study contribute to the ongoing discussion of the most appropriate methods for monitoring heat stress and provide valuable information for practitioners working in this field.

1. Introduction

1.1. Heat Stress and Mitigation Techniques in Occupational Settings

Workers in hot environments or those who are exposed to extreme heat may be at risk for heat stress [1]. Extreme heat poses a significant threat to workers and can result in decreased job efficiency, heightened risk of accidents, and a host of heat-related illnesses including life-threatening heat stroke [2]. There were 43 reported heat-related fatalities in the United States in 2019 [3]. While this figure represents a decrease from the peak of 61 deaths recorded in 2011, it remains higher than the majority of years between 2012 and 2018 [3]. The construction industry is a significant employer in the United States and construction workers make up a staggering 36% of all heat-related deaths in the workplace over the past 25 years, according to the Construction Research and Training (CPWR) [4]. Heat stress occurs when the body’s core temperature rises to a level that exceeds its normal range (36.2–37.9 °C) [5], causing discomfort and potentially leading to more serious health conditions [1]. For example, Glaser et al. [6] explained that performing manual tasks in hot environments that cause heat stress and recurrent dehydration could lead to chronic kidney disease.
The risk of heat-related illnesses, such as heat exhaustion and heat stroke, increases as temperatures rise, making it important for employers to monitor their employees’ heat tolerance. Given current projections about global climate change and the increasing frequency of heat waves [6], the prevalence of heat-related illnesses in the workplace is expected to increase. Traditionally, heat stress risk is controlled by monitoring environmental factors such as humidity, air temperature, radiant heat sources, and air flow with a WetBulb Globe Temperature (WBGT) thermometer and heat stress meters [7]. Notley et al. [8] explained that environmental factors and clothing worn by workers have been used to determine the likelihood of heat-related illnesses and to decide the most effective approach to controlling risk through the hierarchy of heat stress controls (listed in order of effectiveness: elimination or substitution, engineering controls, administrative controls, and personal protective equipment (PPE) [7]) or hygiene practices. Each strategy aims to prevent workers from being exposed to heat strain threshold limit value (TLV) as specified by the American Conference of Governmental and Industrial Hygiene (ACGIH). However, while this approach can provide an estimated predication of a worker’s heat strain level, it cannot accurately determine the worker’s real-time heat strain level in response to heat stress [8]. This is because workers have unique interindividual factors such as body mass index, gender, age, genetics, and health status, and intraindividual factors such as hydration status, work shift duration, sweat rate, heart rate, and medication usage [8]. In other words, different individuals may have different responses to heat stress, and the same individual may respond differently to heat stress under different conditions. These varying factors can lead to an inaccurate estimation of the worker’s heat strain level, which could negatively impact their work productivity, safety [8], and ultimately result in financial loss for the employer.
The risks associated with inaccurate heat strain estimates can be mitigated by considering both environmental factors and worker-specific factors such as physiological, psychophysical, and performance responses [8]. This requires a comprehensive assessment that considers individual factors that affect heat tolerance and sensitivity. Such assessments can help employers identify workers who may be at a higher risk of heat-related illnesses and implement appropriate interventions to prevent such illnesses. The development of wearable sensors for monitoring one or more physiological indicators, such as core body temperature, is gaining popularity [9]. An individual’s core body temperature (CT) is the best indicator of their heat strain as it reflects their body’s internal temperature [10], which is tightly regulated by the hypothalamus [11].
An elevated core temperature exceeding 40 °C can lead to organ failure, heat stroke or death [12]. To ensure the safety and well-being of workers, the American Conference of Governmental Industrial Hygienists (ACGIH) recommends that core body temperature should not exceed 38 °C for non-acclimatized workers and 38.5 °C for acclimatized workers [13]. However, to obtain the most clinically relevant measurements of core body temperature, such as those taken from the rectal, esophageal, and pulmonary arteries, wired recording devices are required, which is not always feasible in the workplace. The invasive nature of core body temperature sensors will negatively affect work productivity. Due to this limitation, using an ingestible telemetric pill that records gastrointestinal temperature from the time of ingestion until it is expelled has been reported as another way of monitoring the core temperature [14,15,16]. Research has shown that the temperature measurements taken by these telemetric pills are comparable to measurements taken from the esophagus and rectum during physical activity in hot environments [17]. One example of this pill is the Ingestible Core Body Temperature Sensor (ICTS) developed by CorTemp®. When the ICTS has been ingested, the signal from the sensor is harmlessly transmitted to the CorTemp® Data Recorder, which is worn outside of the individual’s body [18]. These CorTemp® devices were developed as a more convenient alternative for both field and laboratory experiments, and they are generally considered to be a valid and accurate (±0.1 °C) measure of core temperature [14,15,18]. Nonetheless, the ICTS have limitations with respect to users’ comfort from swallowing an ingestible pill, continuous monitoring of users from a long range, and non-reusability which makes the pills uneconomical [19]. These challenges have prompted the development of non-invasive wearable devices for monitoring an individual’s physiological response to heat stress in real-time in various settings, over a long range, and at a low cost.

1.2. Wearable Sensing Devices for Core Temperature Measurement

Early detection of heat stress is crucial for preventing occupational illnesses and fatalities caused by environmental factors such as heat. Wearable sensors like Slate Safety (SS) and ZephyrTM show potential to address early detection needs by identifying individuals at risk and allowing appropriate interventions.
Slate Safety (SS): The SS system is a wireless wearable device that can be attached to a worker’s arm and is designed to monitor their heart rate, core temperature, and exertion level with the aim of identifying and preventing potential heat-related illnesses or injuries [20]. The SS device incorporates a heart rate sensor to monitor physiological data. Using Slate Safety algorithms, the device extrapolates additional biometrics including exertion, CT, calories burned per minute, steps per minute based on readings from the sensor [20]. It provides continuous updates at fifteen-second intervals for multiple workers with a battery life of over 24 h. Signals are transmitted via cellular connection and can be stored for later uploading. Safety alert limits can be set independently for each worker [20].
ZephyrTM Bioharness (Zephyr): The United States Food and Drug Administration-approved Zephyr is a brand of wearable wireless sensors that records physiological parameters including heart rate, respiratory rate, core temperature, activity levels, and posture for up to 26 h [21]. It utilizes the Kalman Filter algorithm which was developed using a large dataset of ambulatory heart rate to provide estimated CT [22]. It is composed of a BioModuleTM that weighs 85 g and an adjustable strap with skin conductive electrodes that fit on the chest at the lower sternum for both men and women. The BioModuleTM is also capable of measuring respiratory rate through Smart Fabric sensors [21].
There is limited research evaluating the efficacy of these wearable sensors. Prior studies [19,23,24] reported that the sensors are accurate but identified systematic differences between the wearable sensors and the ICTS, yet the source of these differences was not clearly explained. Our study aims to address this gap by examining the effectiveness of these wearable sensors and assessing their output within clinically acceptable limits of bias (≤±0.5 °C) and precision (≤±1 °C), as defined by previous studies [5,25,26,27]. The criterion that a device should not exceed a 0.5 °C difference is rooted in the fact that 0.5 °C is the minimum temperature difference that has been linked to the occurrence of complications caused by hypothermia [27]. Therefore, adhering to the limits of bias (≤±0.5 °C) and precision (≤±1 °C) ensures that the core temperature measuring devices can provide measurements that are sufficiently close to the true values, with a low level of systematic bias and reasonable precision [5,25,26,27]. Adopting these limits of bias and precision for core temperature measurements can help protect a significant portion of the workforce [25,27]. Accurate and reliable measurements are crucial for monitoring occupational heat stress and preventing heat-related illnesses among workers. By using a measuring device that meets these accepted limits, employers can better assess the risk of heat-related illnesses and implement appropriate preventive measures to protect workers’ health and well-being. In situations where individuals are exposed to extreme heat or engage in strenuous physical activities, a higher level of accuracy may be required to ensure early detection of heat-related conditions and timely intervention. Nonetheless, as technology advances and new research emerges, it is crucial to continuously evaluate and improve core temperature measuring devices. To achieve the goal of this study, the following hypotheses were tested:
  • H1a: SS wearable sensor CT data are within the clinically acceptable limits.
  • H1b: There is a linear association between SS and ICTS, ρ ≠ 0.
  • H1c: Individual differences have a significant effect on the SS CT measurement.
  • H2a: ZephyrTM wearable sensor CT data are within the clinically acceptable limits.
  • H2b: There is a linear correlation between ZephyrTM and ICTS, ρ ≠ 0.
  • H2c: Individual differences have a significant effect on the Zephyr CT measurement.
This study will contribute to the existing knowledge on CT monitoring, investigate how individual differences impact CT measurements, and provide insight for the development of effective heat stress preventive measures. Additionally, evaluating the effectiveness of wearable sensors for monitoring core body temperature aligns with the Occupational Safety and Health Administration (OSHA) goal of preventing and lowering the number of work-related injuries, illnesses, and deaths caused by hazardous heat exposure. By using wearable sensors, workers can be closely monitored for changes in their CT, allowing for early detection and intervention to prevent heat-related illnesses and fatalities [7]. These wearable sensors are especially critical in industries where workers are exposed to high heat stress, such as construction, manufacturing, and agriculture.

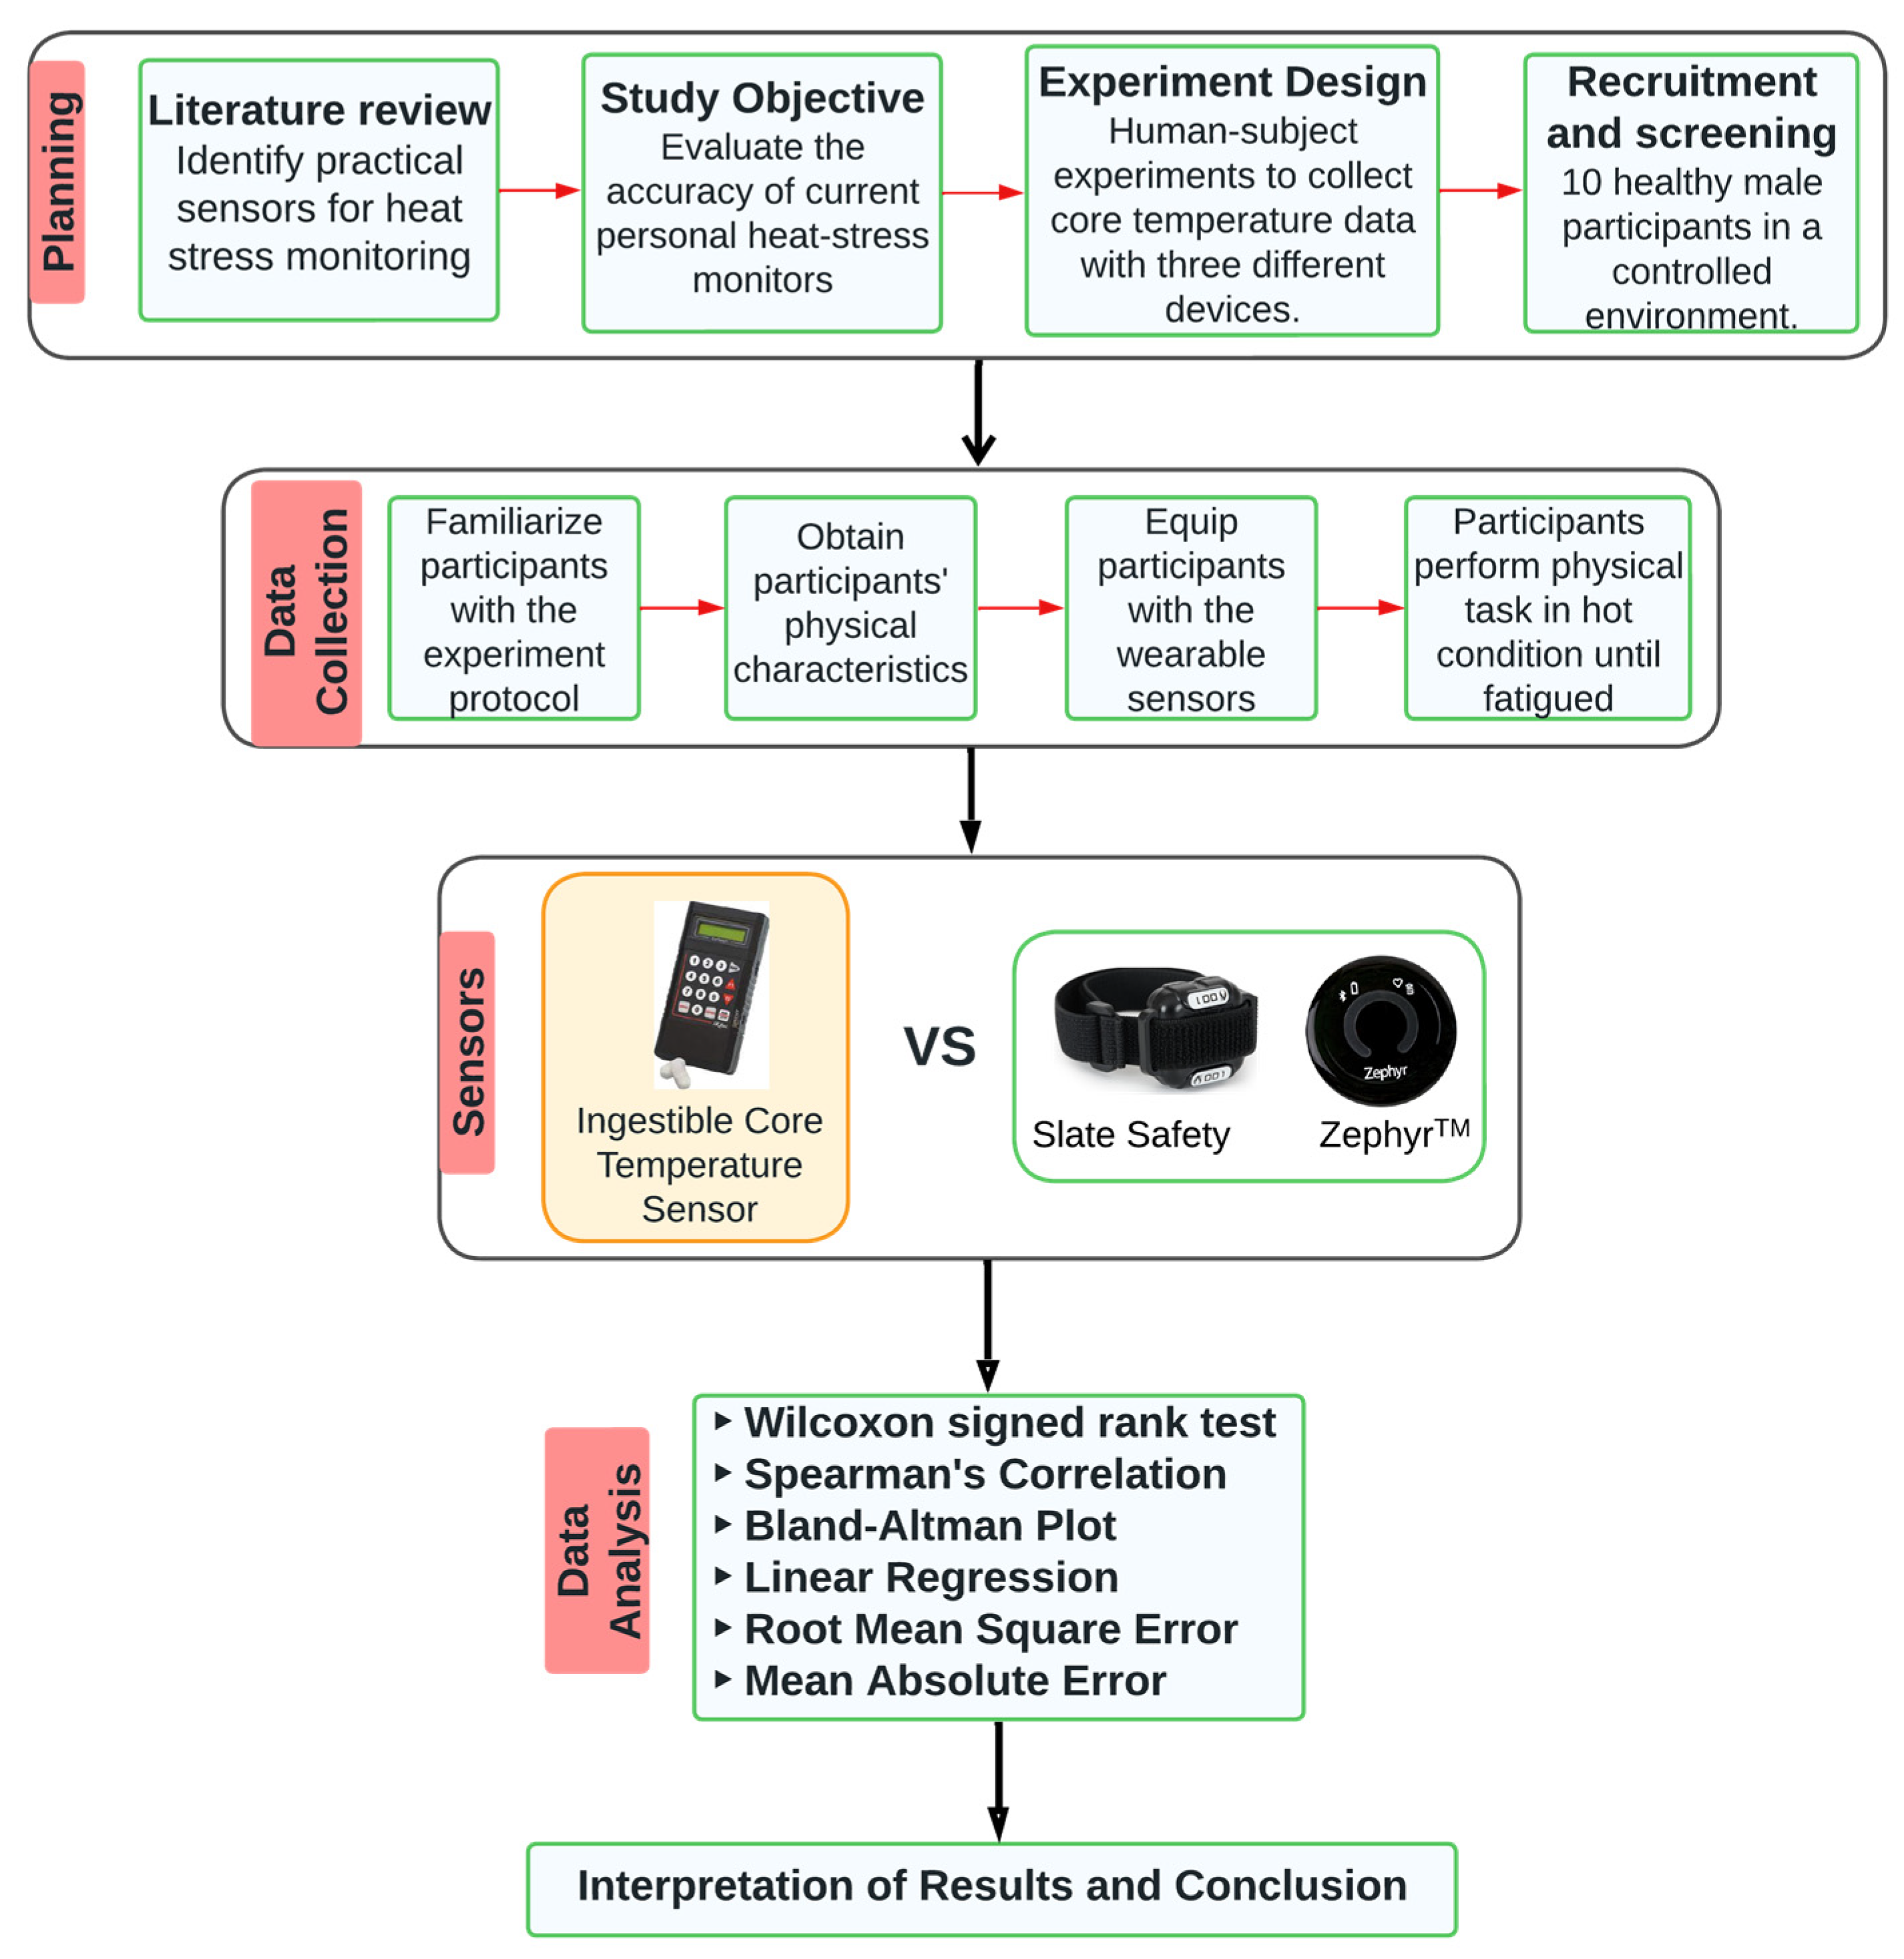
2. Materials and Methods

To achieve the aim of the present study, the researchers designed an experiment aimed at fatiguing individuals under hot temperature conditions. Figure 1 shows the research framework for this study.
The University of Alabama’s Institutional Review Board (IRB) approved this study, and twenty-five (25) healthy male subjects between the ages of 18 and 30 volunteered. Those subjects who did not meet the study criteria were eliminated through telephone screening, including those who had medical problems, smoked, experienced severe lower back, shoulder, and leg pain, experienced heat stress, or did not agree to use an ingestible CorTemp® Sensor 3 h before the assessment. Ten (10) participants qualified and completed the study. The participants were familiarized with the research protocol, and they read the experiment pre-test instructions after which their consent to participate in the study was obtained in writing. On the day of the experiment, the participants were invited to the lab at least 3 h before their assessment and handed the Ingestible CorTemp® Sensor to be taken like a regular pill. In line with previous studies, a dumbbell exercise was utilized to physically fatigue participants [28].

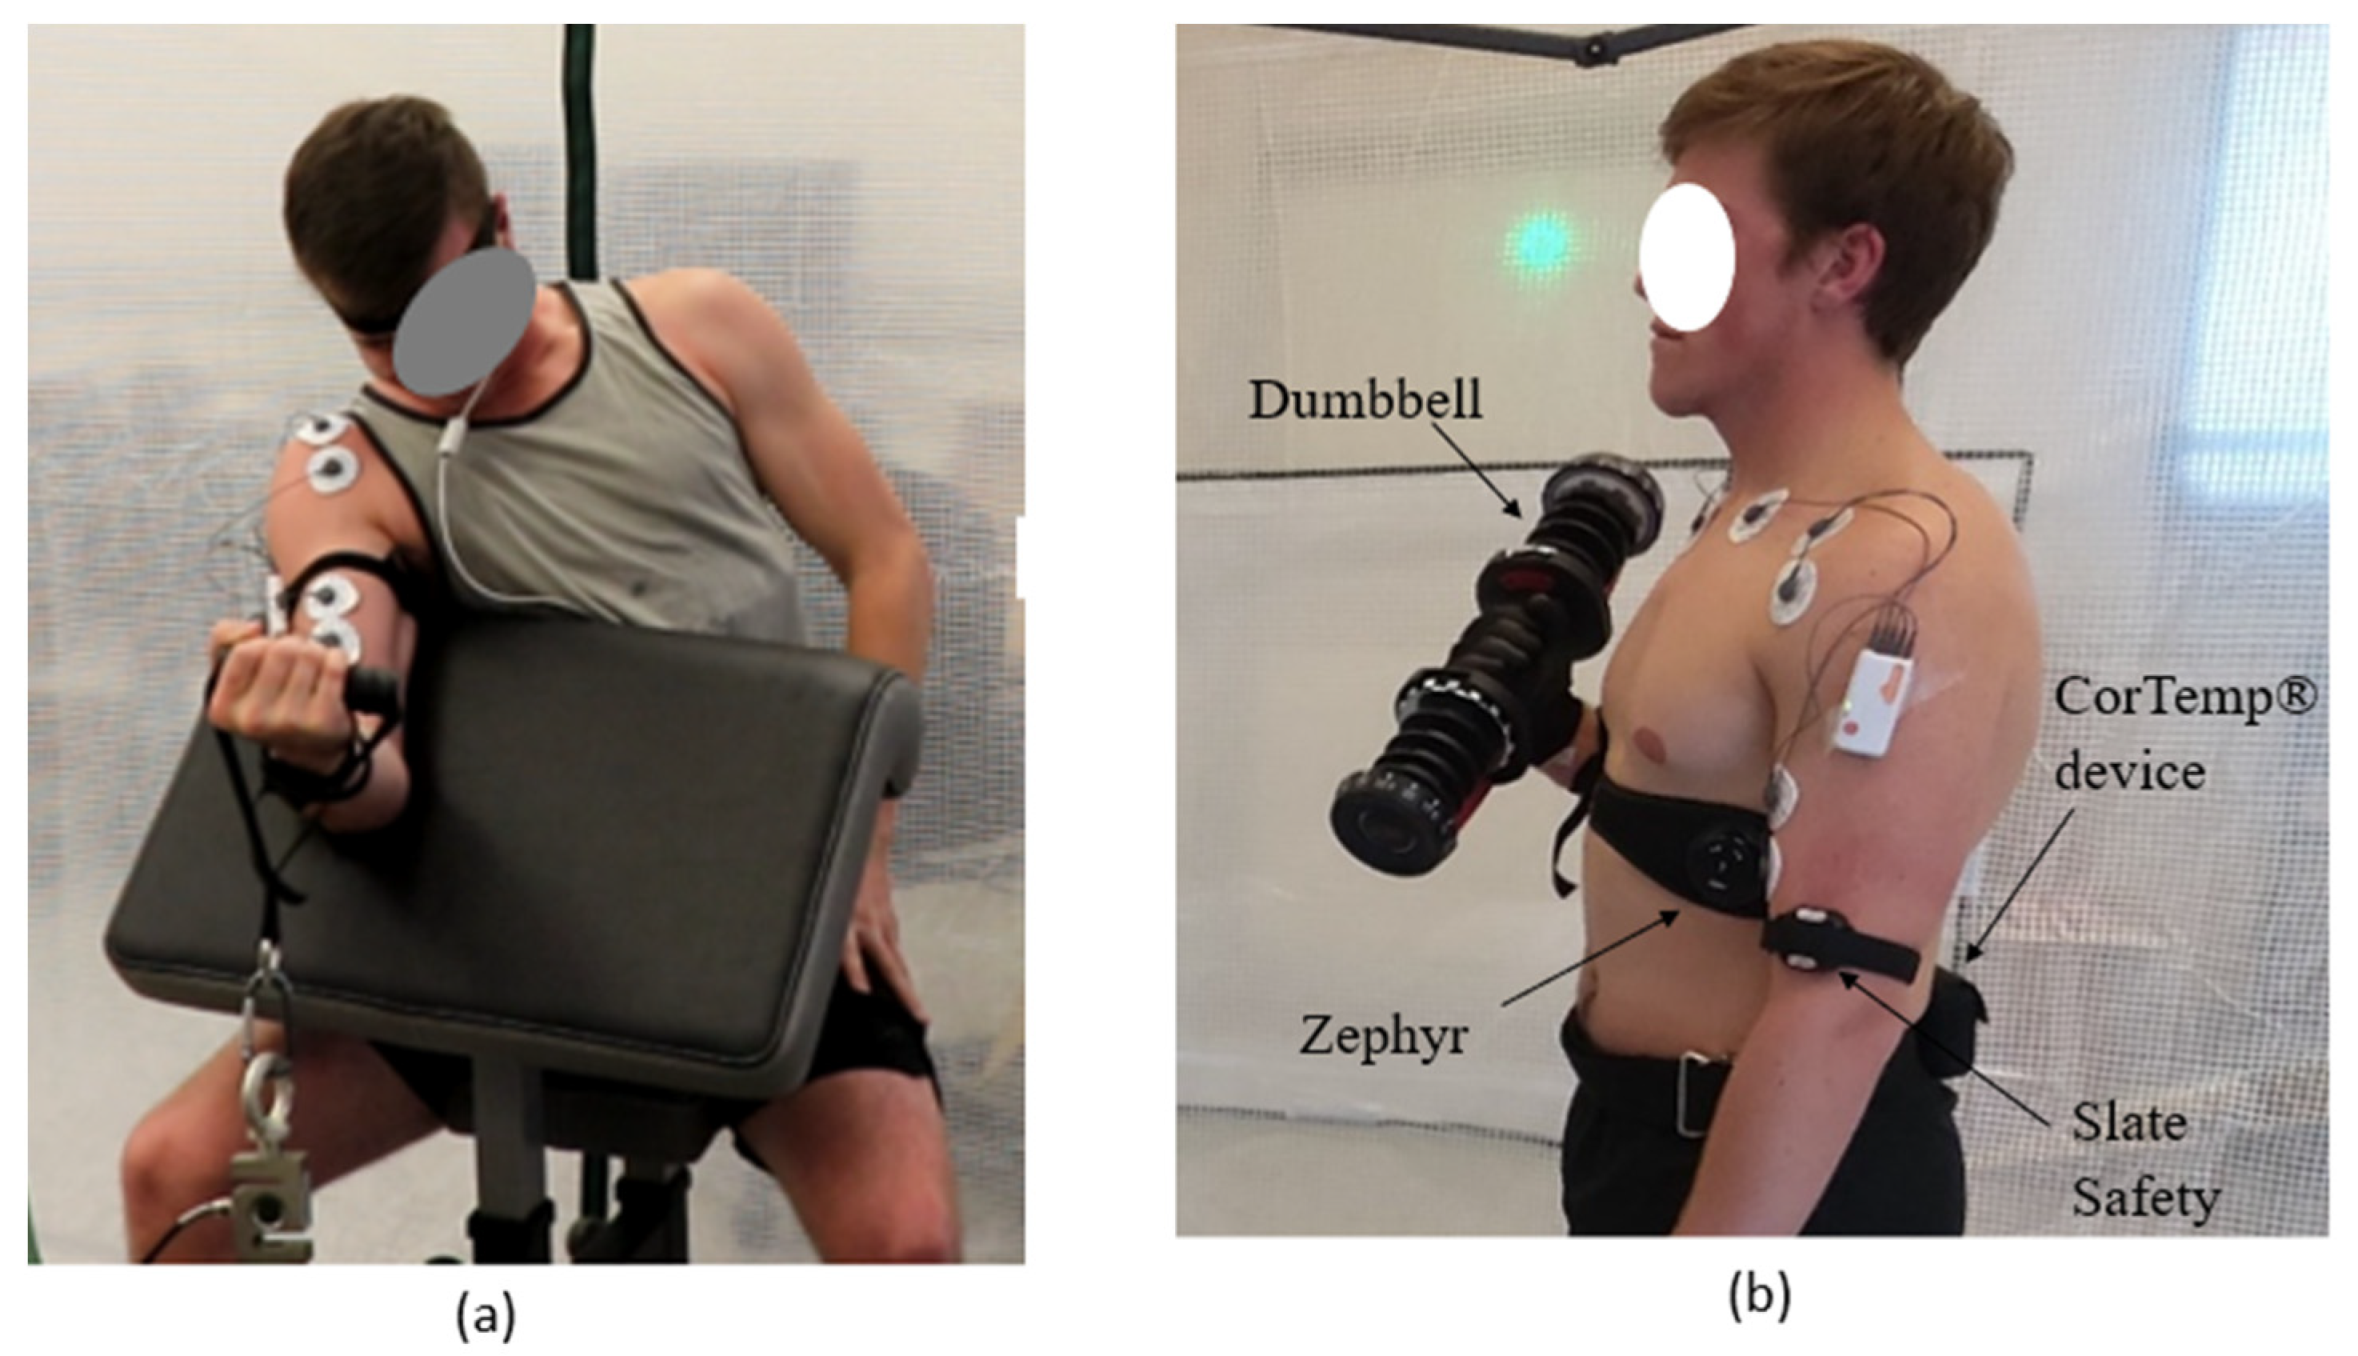
2.1. Experimental Design

This study involved conducting a dumbbell exercise in hot conditions to induce fatigue in the upper body muscles, specifically targeting the hands and shoulders. This repetitive physical task mimicked manual handling tasks commonly performed in labor-intensive industries like construction, which heavily impact the biceps brachii and anterior deltoid muscles [29,30]. The study took place in a temperature-controlled laboratory with a high temperature (33 °C) and relative humidity (50%) designed to replicate hot working environments. Prior to the experiment, participants were required to complete a 24 h history form, which researchers reviewed to ensure compliance with pre-test guidelines. These guidelines included maintaining hydration, refraining from consuming food, caffeine, supplements, tobacco, and alcohol for at least 3 h before the assessment, avoiding strenuous physical activity or exercise on the assessment day, and obtaining sufficient sleep (8 h) the night before the experiment.
In addition, participants completed a wellness form to ensure they were in good health and free from any bodily discomfort. Following this, their height and weight were measured using a seca digital column, and their body mass index (BMI) was calculated using an Omron HBF-514C device. To assess participants’ physical strength, their maximal voluntary contraction (MVC) was measured. This measurement involved participants exerting their maximum force by pulling a load cell for seven seconds. MVC serves as a benchmark for evaluating participants’ physical capabilities and is considered the standard measure of muscle fatigue [31]. A research assistant provided guidance on how to perform MVC using an exercise bench equipped with a load cell (refer to Figure 2a), and MVC values were recorded for each participant. To familiarize participants with the fatiguing protocol, they practiced the dumbbell curling exercise with a 5 lb weight until they adapted to the demands of the exercise, as depicted in Figure 2b. A summary of the participants’ physiological data is presented in Table 1.
Prior to the commencement of the experiment, participants were given a resting period. During this phase, the participants were fitted with three devices: the Zephyr Bioharness placed on their chest, the Slate Safety wearable sensor attached to their upper arm, and the CorTemp® data recorder affixed to their lower back. Baseline core temperature data were collected during the 10 min resting phase of the experiment. After the resting period, participants were instructed to perform arm curls with weights equivalent to 25% of their maximum voluntary contraction (MVC) under hot temperature conditions. Using a dumbbell and a metronome set at 15 repetitions per minute, participants were guided to curl their arm through its full range of motion [28]. They were instructed to continue performing dumbbell curls until they reached their maximum capability and were no longer able to sustain the exercise. The experiment concluded when participants indicated their inability to continue and safely released the dumbbell.

2.2. Data Analysis

The research team exported the data for each participant from the respective core temperature measuring devices to test the hypotheses of this study. The devices had different sampling frequency. Core temperature data were extracted from the CorTemp® data recorder (0.1 Hz sampling frequency), SS sensor (0.1 Hz sampling frequency), and Zephyr sensor (1 Hz sampling frequency). Thus, all the data were resampled to 30 s datapoints for ease of data comparison. The 30 s datapoints were then imported to IBM SPSS statistical tool [32] to verify that the data met the assumption for a univariate statistical analysis method. The core temperature measurement from each of the wearable sensors were independent of each other and they had no systematic relationship. The participants’ core temperature data were measured on a continuous scale. The temperature data were subjected to a Shapiro–Wilk normality test that returned a p-value < 0.05, which showed that the data violated the assumption of normality. A scatterplot was utilized to visualize the data, allowing for a clear identification of any data points that deviated significantly from the overall pattern or distribution. To further ensure the integrity of the dataset, the interquartile range (IQR) method was employed. This method assisted in identifying data points that exhibit unusual distances from the median of the dataset, indicating their potential as significant outliers. In this study, three such data points were identified and subsequently eliminated from the analysis. The occurrence of these significant outliers can be attributed to factors such as participants’ sweat, which may have affected the contact between the sensor and the participants’ skin. Additionally, participants rubbing their upper arm on the Zephyr sensor, which was positioned around their chest, as they curled the dumbbell could have also influenced the sensor-skin contact. By carefully identifying and eliminating these outliers, we aimed to minimize any potential distortions or biases that could arise from irregular data points. If these outliers were not eliminated, they could introduce considerable errors and bias which would undermine the accurate evaluation of the device’s performance. Consequently, this can result in inaccurate assessments, misleading interpretations, reduced device reliability, and pose potential risks to the health and safety of individuals. The Spearman rank-order correlation coefficient (Spearman’s correlation, ρ) was conducted to test the strength of the relationship between the ICTS and the SS as well as the ICTS and the Zephyr wearable sensor. A one-sample Wilcoxon signed-rank test was conducted to test the agreement between the data from the ICTS and the other wearable sensors. To describe the level of agreement among the devices, a Bland–Altman analysis was conducted for all the recording from each participant at 30 s epochs. Linear regression was used to assess the significance of the bias between the ICTS and the other wearable sensors. The root mean squared error (RMSE) and the mean absolute error (MAE) both evaluate the similarity of the data generated by the wearable sensors and the ICTS. It is noteworthy that low RSME and MAE values indicate greater reliability and accuracy of the data. Furthermore, the analysis encompassed an assessment of the average temperature trends over time, considering the variability and dispersion of temperature measurements among the participants. The average temperature values were calculated by taking the mean of temperature readings within 30 s epochs for each participant. Subsequently, these mean values, obtained from the 30 s epochs, were further averaged over 2 min intervals for each participant. These averaged values over 2 min were then subjected to statistical analysis, and the resulting average temperature values were plotted against time. To evaluate the variability in temperature tracking among the 10 participants at specific time points, the figures included bars along the average temperature trendline. These bars represent the standard deviation, providing a visual representation of the spread of temperature values around the average.
The present study also examined the influence of various individual characteristics on CT measurements. Specifically, factors such as participants’ BMI, past experience exercising in hot conditions, and the intensity of their workouts were gathered and considered in the analysis. BMI categories were established according to the CDC classification as underweight (BMI < 18.5), healthy weight (18.5 < BMI < 24.9), overweight (25 < BMI < 29.9), and obese (BMI > 29.9) [33]. To assess the impact of these individual factors on the mean and maximum CT recorded by the Zephyr and SS devices, a Mann–Whitney U test and Kruskal–Wallis Test were employed. A significance level of α = 0.05 was used to determine the statistical significance of the results. The results are presented in the following section.

3. Results

Table 2 shows the participants’ task duration as well as the mean and max core temperature as recorded from the ICTS and other wearable sensors. The physical task duration varied from 8 to 47 min and the average mean temperatures recorded by the ICTS, SS, and Zephyr were 37.36 °C, 37.60 °C, and 37.30 °C, respectively. Additionally, the average max temperatures recorded by the ICTS, SS, and Zephyr were 37.39 °C, 37.74 °C, and 37.50 °C, respectively.
Table 3 is an excerpt from Table 2. It shows the number of participants that were within the clinically acceptable limits and those that were above the limits for the mean and maximum temperature recorded by the SS and Zephyr. Table 4 shows the results from the Bland Altman plots. The results of the comparison between these devices are presented in the following subsections.

3.1. Slate Safety Wearable Sensor

There was a strong positive correlation between the ICTS and the SS, which was statistically significant (ρ (421) = 0.543, p < 0.001). Thus, hypothesis H1B was met. The one-sample Wilcoxon signed-rank test showed that there was a statistically significant difference between the data from the ICTS and the SS device (Z = −11.197, p < 0.001). This indicates that there is a systematic difference between the devices. Figure 3a showed the outcome of the Bland–Altman plot, which showed a proportional bias and explained where the differences occurred. The red line represents the bias while the green lines represent the upper limit and the lower limit, respectively. The bias was 0.20 °C, and the RMSE and MAE were evaluated to measure the difference in the CT data from SS and the ICTS. The RMSE value of 0.398 suggests that there is an average difference of 0.398 °C between the two devices. Similarly, the MAE value of 0.334 indicates that both sensors differ by 0.334 °C. Equally, linear regression indicated that there is a proportional bias under the distribution of data around the mean difference line (t = −4.684, p < 0.001).
Figure 3b illustrates the average temperature trends over time for both the SS and ICTS data, considering the variability and dispersion of temperature measurements among participants for the first 20 min. The large variability observed in the participants’ SS CT measurement, shown in Figure 3b, prompted the investigation of the impact of individual differences on the CT measurement. The results of the Mann–Whitney U test (Mean_SS CT: U = 7.0, p = 0.424; Max_SS CT: U = 4.0, p = 0.138) revealed that participants who never avoided performing exercise in hot condition recorded higher CT (Mean_SS CT Median = 37.58 °C; Max_SS CT Median = 38.14 °C) than other participants who sometimes avoid performing exercise in hot condition (Mean_SS CT Median = 37.43 °C; Max_SS CT Median = 37.78 °C). However, these differences were found to be statistically insignificant. Next, the Kruskal–Wallis test results indicated that there was no statistically significant effect of exercise intensity on the CT measurements (Mean_SS CT: χ2(2) = 0.78, p < 0.676; Max_SS CT: χ2(2) = 3.07, p < 0.215). However, it is worth noting that participants who engaged in moderate-intensity exercise had the highest CT measurements (Mean_SS CT Median = 37.58 °C; Max_SS CT Median = 38.14 °C), followed by those who performed low-intensity exercise (Mean_SS CT Median = 37.55 °C; Max_SS CT Median = 37.93 °C), and lastly, participants who engaged in vigorous-intensity exercise (Mean_SS CT Median = 37.43 °C; Max_SS CT Median = 37.74 °C). The Kruskal–Wallis test was conducted to examine the relationship between participants’ BMI and CT measurements. The results indicated that BMI did not have a statistically significant effect on CT measurement (Mean_SS CT: χ2(2) = 1.23, p < 0.541; Max_SS CT: χ2(2) = 0.45, p < 0.798). However, it is noteworthy that overweight participants had the highest CT measurements (Mean_SS CT Median = 37.68 °C; Max_SS CT Median = 38.07 °C), followed by healthy weight participants (Mean_SS CT Median = 37.55 °C; Max_SS CT Median = 37.88 °C). Conversely, underweight participants recorded the lowest CT measurements (Mean_SS CT Median = 37.48 °C; Max_SS CT Median = 37.86 °C). This showed that there is sufficient evidence to reject hypothesis H1c.
Table 4 shows that when average temperature is considered, 80% of the participants using the SS device were within the clinically acceptable limits for tracking core body temperature during physical tasks in hot conditions. However, when the maximum temperature was considered, only half of the participants were within the acceptable limits. On close examination of Figure 3a, it was observed that there was an agreement between the two devices when the temperature was between 37.20 °C and 37.75 °C. Outside of this temperature range, the data points were not consistent. It can be argued that below 37.20 °C, the SS was recording higher core temperature than the ICTS while above 37.75 °C, the SS was recording CT lower than the ICTS. The limits of agreement (LoA) estimated an interval of −0.47 to 0.88 °C.

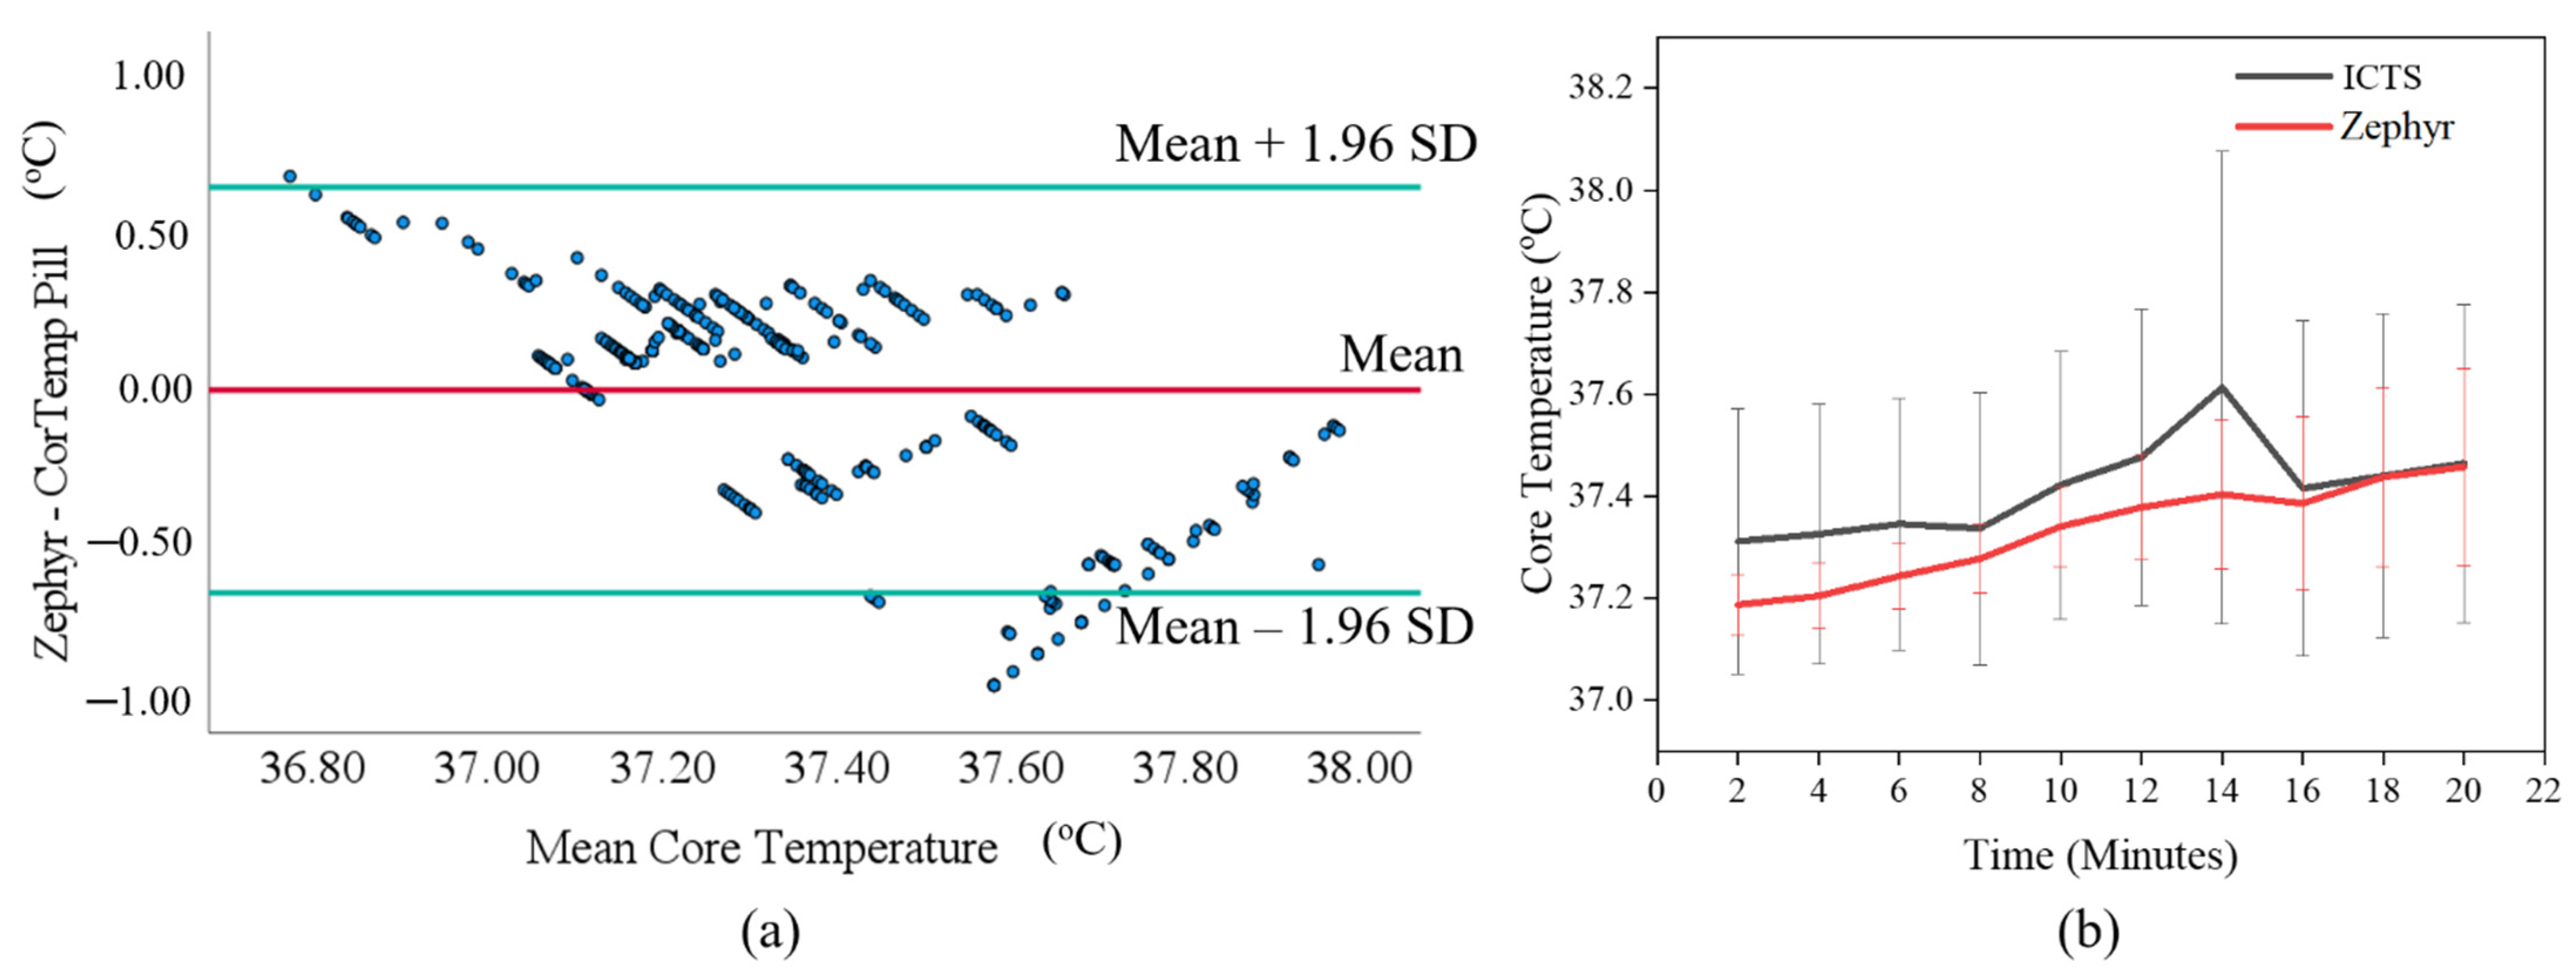
3.2. Zephyr Wearable Sensor

A statistically significant, strong, positive relationship was observed between the Zephyr and the ICTS, (ρ (421) = 0.524, p < 0.001). Therefore, hypothesis H2B was true. Wilcoxon signed-rank test showed that there was an agreement between the CT data recorded from the ICTS and the Zephyr, (Z = −0.661, p = 0.509). The Bland–Altman plot for comparing the CT data from both devices is shown in Figure 4a. The bias was −0.03 °C and the hypothesis testing was insignificant, indicating that although Zephyr read on average 0.03 °C less than the pill, there was agreement between the two devices. Therefore, Zephyr can be considered a good option for measuring CT. A comparison of the average temperature over time for both the Zephyr and the ICTS data is shown in Figure 4b, taking into consideration the variability and dispersion of temperature measurements among participants during the first 20 min of the study. The significant variability observed in the participants’ Zephyr CT measurements, as depicted in Figure 4b, led to an investigation into the impact of individual differences on CT measurement. The results of the Mann–Whitney U test revealed a statistically significant effect of participants’ past experience of working in hot conditions on Zephyr mean CT measurements (U = 0.0, p = 0.017). However, there was no significant difference in Zephyr max CT measurements (U = 2.0, p = 0.067). Participants who never avoided exercising in hot conditions had higher CT values (Mean_Zephyr CT Median = 37.39 °C; Max_Zephyr CT Median = 37.80 °C) compared to those who occasionally avoided such exercise (Mean_Zephyr CT Median = 37.26 °C; Max_Zephyr CT Median = 37.40 °C). Additionally, the Kruskal–Wallis test results demonstrated a statistically significant effect of exercise intensity on Mean_Zephyr CT measurements (χ2(2) = 5.98, p = 0.050). However, no significant effect was observed for Max_Zephyr CT measurements (Max_Zephyr CT: χ2(2) = 4.85, p = 0.089). Participants engaging in moderate-intensity exercise exhibited the highest CT measurements (Mean_Zephyr CT Median = 37.39 °C; Max_Zephyr CT Median = 37.80 °C), followed by those performing low-intensity exercise (Mean_Zephyr CT Median = 37.45 °C; Max_Zephyr CT Median = 37.28 °C), and lastly, participants engaging in vigorous-intensity exercise (Mean_Zephyr CT Median = 37.22 °C; Max_Zephyr CT Median = 37.22 °C). Furthermore, the Kruskal–Wallis test was conducted to assess the effect of participants’ BMI on CT measurements, revealing no statistically significant effect (Mean_Zephyr CT: χ2(2) = 1.59, p = 0.453; Max_Zephyr CT: χ2(2) = 1.00, p = 0.606). For mean Zephyr CT measurements, healthy weight and underweight participants recorded similar CT values (Median = 37.34 °C), while overweight participants exhibited the lowest CT values (Median = 37.26 °C). In terms of Max_Zephyr CT measurements, underweight participants recorded the highest CT values (Median = 37.65 °C), followed by healthy weight participants (Median = 37.50 °C), while overweight participants had the lowest CT values (Median = 37.40 °C). Based on the findings of this study, there is substantial evidence to fail to reject hypothesis H2c.
Similarly, the RMSE value of 0.328 showed that there is an average difference of 0.328 °C between the two devices. The MAE value of 0.258 indicates that the two methods of measuring CT differ by 0.258 units. However, linear regression indicated that there is a proportional bias under the distribution of data around the mean difference line (t = −18.560, p < 0.001). This prompted a closer examination of Figure 4a, and it was observed that there was an agreement between the two devices when the temperature was between 37.25 °C and 37.60 °C. When the temperature was below 37.25 °C, Zephyr measured a higher temperature than the pill, but when the temperature was above 37.60 °C, Zephyr measured a lower temperature than CTS.
Table 4 shows that when transitioning from mean to maximum CT over the course of a physical task conducted by a participant, the datapoints within acceptable limits increased from 70% to 90%. Furthermore, LoA estimated an interval of −0.67 to 0.62 °C.

4. Discussion

4.1. Clinically Acceptable Limits

This study was undertaken to investigate the effectiveness of CT wearable sensors relative to the ICTS. The Bland–Altman plot indicated that SS read on average 0.20 °C higher than the ICTS, which is consistent with the data trend observed in Figure 3b which showed that the SS CT measurement was higher than the ICTS measurement. The hypothesis testing (Wilcoxon test) determined that the mean difference (bias) was significantly different from zero. The Bland–Altman plot also showed a proportional bias indicating that the difference between SS and ICTS measurements was not consistent across the range of values. Therefore, adjusting the SS CT measurements by subtracting 0.20 °C (mean bias) might not necessarily make SS agree more closely with the ICTS because of the proportional bias. The proportional bias indicates that the bias in measurements varies systematically with the magnitude of the CT measurements. When proportional bias is observed, it becomes inappropriate to simply apply the mean bias (or fixed bias) to correct the measurements because it may lead to inaccurate adjustments, as the bias itself varies across different CT measurement levels. Therefore, alternative approaches should be considered to address the proportional bias. For instance, regression models or correction algorithms that consider the relationship between the measurements and the bias can be developed to make more accurate adjustments and improve the reliability of the CT measurements.
In Table 4, when transitioning from mean to maximum CT, it was observed that the number of datapoints reduced from 80% to 50%, indicating that the SS device may have more variability in accurately tracking core body temperature during more intense physical activities. Additionally, the LoA showed that SS may measure 0.47 °C below and 0.88 °C above ICTS. Therefore, it may be necessary to calibrate or validate SS against ICTS or other reference devices before using them in applications that require very precise temperature monitoring. These results align with the outcome reported by Callihan et al. [19] that indicate that a SS wearable sensor is on average 0.03 °C higher than ICTS with standard deviation of 0.3 °C. However, the different bias, RSME, and MAE values reported in this study and the study conducted Callihan et al. could be due to different versions of SS devices being explored. The present study used the BAND V1 while Callihan et al. investigated BAND V2. The bias, RSME, and MAE value were also lower in the outcome reported by Callihan et al. relative to the outcome of this study, indicating that SS has improved on their BAND V2 wearable sensor. Based on the available evidence, it appears that SS has shown to be reliable and accurate in measuring individuals’ CT.
When exploring the efficacy of the Zephyr CT wearable sensor, the Bland–Altman plot showed that Zephyr read on average 0.03 °C less than ICTS, which is also evident in Figure 4b. However, the Bland–Altman Plot and linear regression showed that there is proportional bias; therefore, the mean bias (−0.03 °C) can not simply be applied to correct the CT measurements because the bias itself varies across different CT measurement levels. Therefore, regression models or correction algorithms that consider the relationship between the measurements and the bias can be developed to improve the reliability of the CT measurements. Furthermore, the LoA indicated that Zephyr may measure 0.67 °C below and 0.62 °C above the ICTS. Therefore, in situations where very accurate CT is required, it is important to consider the potential for measurement error and take additional measures such as multiple readings. Figure 4b depicted that during the initial 18 min, the Zephyr CT measurement was lower than the ICTS measurement. However, after 18 min, both devices recorded similar measurements. Table 4 showed that Zephyr has a higher accuracy in measuring CT when the maximum temperature over the course of a physical task is considered compared to when the average temperature is considered. This result is consistent with the outcome of the studies conducted by Hagen et al. [34] and Seo et al. [23] that Zephyr CT consistently underestimated ICTS. However, Hagen et al. recorded −0.192 °C as the bias value. The difference in the bias value could be because Hagen et al.’s study was conducted in an outdoor environment and the participants were football athletes. Athletes and average humans may generate different CT during physical exertions [35,36] and testing the efficacy of core temperature devices in different environmental conditions could affect their measurement [37]. Similarly, Seo et al. [23] evaluated the accuracy of the Zephyr sensor in four distinct conditions and reported bias ranging from −0.2 to 0.3 °C, indicating that Zephyr underestimated and overestimated CT across the four conditions explored in the study. While the bias reported in this study fell within the range reported by Seo et al. [23], it is important to note that Seo et al. validated the accuracy of Zephyr CT against rectal probe temperature data while this study used a telemetry pill. Based on available evidence, Zephyr is a practical tool for tracking an individuals’ CT in real time and can serve as a substitute for ICTS under certain circumstances that allows for ≤±0.5 °C bias in temperature measurement.
The proportional bias found in the SS and Zephyr CT monitoring devices implied that the reported temperature values consistently deviate from the true values. This introduces the possibility of inaccurate readings, which can misinform supervisors about the actual thermal condition of the workers. The practical implications of the proportional bias are two-fold. Firstly, if the device consistently overestimates the CT, it may lead to unnecessary interventions or work interruptions, resulting in disruptions to productivity and potentially affecting worker morale. Conversely, if the devices consistently underestimate the CT, they may fail to detect hazardous thermal conditions and delay necessary interventions, thereby putting workers at risk of heat-related illnesses. Therefore, to ensure the practical effectiveness of the monitoring devices, addressing and rectifying the issue of proportional bias is of utmost importance. This may involve examining the sensor technology, calibration methods, or other environmental and physiological factors that could contribute to the observed bias. Understanding the sources of bias can guide future improvements in wearable sensor technology and measurement techniques.

4.2. Relationship between Wearable Sensors and ICTS

The correlation coefficient of 0.543 suggests that there is a moderate positive relationship between SS and ICTS. This is similar to the correlation coefficient 0.595 reported by Callihan et al. [19]. This means that as the temperature recorded by ICTS increases, the temperature recorded by the SS tends to increase as well. The significant p-value of less than 0.001 indicates that the correlation is not due to chance, and the large sample size of 421 further strengthens the statistical power of the analysis. Overall, the results suggest that ICTS and SS may be comparable and interchangeable for certain applications, but caution should still be exercised when interpreting the results. For example, if ICTS and SS are being used in a medical setting where precise temperature measurements are critical, the correlation coefficient may not be high enough to justify using the ICTS and SS interchangeably.
For Zephyr, a moderately positive association was observed between Zephyr and ICTS, and hypothesis testing indicated that there is agreement between both devices indicating that Zephyr may be a reliable alternative to ICTS. This is because as the temperature recorded by the ICTS increases, so does the temperature recorded by Zephyr. However, the correlation coefficient of 0.524 suggests that there is still a significant amount of variation between the measurements of the two devices. This means that there may be other factors that are influencing the measurements, such as differences in calibration or placement of the devices. The significant p-value of less than 0.001 indicates that the correlation is not due to chance, and the sample size of 421 further strengthens the statistical power of the analysis. This result aligns with the findings of past studies that evaluated the relationship between Zephyr and a gold standard and reported moderate positive association (correlation coefficient = 0.643 [34]) and moderate–strong association (correlation coefficient range from 0.679 to 0.858 [23]). The correlation coefficient recorded in this study (ρ = 0.524) was lower than that recorded in other studies probably because of the differences in the kind of participants, activities, environments [23,34], or gold standards [23] that were used. Furthermore, Hintz et al. [38] explored Zephyr efficacy in severe heat stress. The study found that out of 499 individuals identified as potential cases of exertional heat stroke, only 10 were confirmed to have the condition. These findings indicate that Zephyr has a significant number of false positive and false negative results when used in this particular situation [38]. Overall, these findings suggest that while the Zephyr and ICTS may be comparable, they cannot be used interchangeably without caution.
Further research may be needed to explore the reasons for the differences between the devices and the ICTS and to determine the extent to which they can be substituted in practice. Factors such as calibration, placement of the devices, and other environmental variables may also affect the measurements and should be taken into consideration. Additional research may be needed to further explore the reliability and validity of the devices being compared, especially regarding variable workload as it can be found in a typical occupational setting [23].

4.3. Individual Differences

Despite controlling the hot environment, standardized outfit, and exercise protocol, individuals displayed diverse responses to the different sensors used and the CT measurement. This prompted the analysis of participants’ individual differences, such as their past experience exercising in hot conditions, workout intensity, and BMI. The result revealed that there was no statistically significant impact on the CT measurement when using the SS device. However, despite the lack of statistical significance, noteworthy observations were made. Firstly, participants who never avoided exercising in hot conditions exhibited the highest CT compared to those who sometimes avoided exercising in hot conditions. This finding suggests that individuals with a history of exercising in hot environments may have developed heat acclimatization, allowing their bodies to adapt and regulate temperature more effectively [39]. Secondly, when examining the influence of exercise intensity on CT, participants engaging in moderate-intensity exercise displayed the highest CT, followed by those performing low-intensity exercise, and finally, participants engaging in vigorous-intensity exercise exhibited the lowest CT. This pattern could be attributed to the increased muscular activity and energy expenditure associated with moderate-intensity exercise, leading to greater heat production [39,40]. Furthermore, participants performing moderate-intensity exercise likely sustained the dumbbell curling task for a longer duration, resulting in prolonged exposure to the generated heat from both muscular activity and the surrounding environment. Previous studies have demonstrated that during moderate–high intensity exercise, the body generates heat at a faster rate due to elevated metabolic activity, leading to a notable rise in CT [40,41,42]. Lastly, participants who were overweight exhibited the highest CT measurements, while underweight participants had the lowest CT. This observation aligns with previous research indicating that individuals with higher body mass tend to have a higher metabolic rate, resulting in increased heat production [43,44,45]. Additionally, adipose tissue, which is more prevalent in overweight individuals, acts as insulation and impedes the dissipation of heat from the body to the environment [43]. There is a need to investigate other factors such as hydration status, fitness level, acclimatization, resting metabolism rate, among others that have the potential to statistically significantly influence SS CT measurement and cause large individual variability.
Similar factors were considered when investigating participants’ individual differences that could affect CT measurement using the Zephyr device. It was found that past experience exercising in hot conditions and the intensity of workouts had a significant impact on Zephyr CT measurements, while BMI did not show a significant effect. Specifically, participants who never avoided exercising in hot conditions recorded significantly higher CT than those who sometimes avoided exercising in such conditions. This suggests that individuals with a history of exercising in hot environments exhibit distinct CT responses, possibly due to enhanced heat acclimatization and improved thermoregulation capabilities. Additionally, participants engaging in moderate-intensity exercise exhibited the highest CT, followed by those involved in low-intensity exercise, while participants performing vigorous-intensity exercise recorded the lowest CT. This finding suggests that the level of exercise intensity impacts Zephyr CT measurement dynamics, with greater muscular activity and energy expenditure contributing to elevated CT levels (CITE2). Regarding BMI, although we did not find a significant effect on Zephyr CT measurements, it is worth noting that overweight participants recorded the lowest CT measurements compared to underweight and healthy weight participants. This trend is contrary to past studies that reported that those who are overweight record the highest CT [43,44,45], therefore, it warrants further investigation. Past experience exercising in hot conditions and the intensity of workouts are among the factors that caused large individual variability in the Zephyr CT measurements. This showed that individual variations can influence the accuracy and reliability of CT measurements using the Zephyr device, which underscores the need for personalized approaches in temperature monitoring.
These insights contribute to our understanding of how various factors interact and impact CT measurement with different devices. Additionally, it is important to recognize that in this study, the SS and Zephyr technologies were evaluated within a normothermic range of temperature readings (36.2−37.9 °C) [5]. As a result, the findings of this study may not provide a comprehensive understanding of how these technologies would perform under conditions of extreme thermal stress. Consequently, there is a need for additional research to investigate the capabilities of these technologies in accurately detecting critical thermal states associated with severe heat-related illnesses. Further exploration in this area will contribute to enhancing the reliability and applicability of these technologies in high-stress thermal environments.

4.4. Limitation

While this study has provided valuable insight, there are some limitations that should be considered. One of the limitations is the small sample size, which consisted of only 10 participants and did not include any female participants. This suggests caution in generalizing the findings to larger populations. Future studies should consider larger sample sizes and more diverse samples, including both male and female participants to ensure greater representation. Additionally, the study was conducted in a controlled environment, which may not be representative of all outdoor environmental conditions. Thus, the generalizability of the findings to uncontrolled environments should be considered with caution and future studies should consider longer periods of time and different temperature conditions to improve external validity. Finally, the study only considered young male participants, which may not be representative of diverse populations. Therefore, future studies should include participants of different ages, gender, and socio-demographics to gain a more comprehensive understanding of the effectiveness of the wearable sensors.
The duration of the repetitive task performed by the participants in this study was relatively short compared to the typical 8 h workday experienced by industry workers. Additionally, the workout outfits worn by the participants were chosen to maintain consistency and minimize confounding factors that could affect heat dissipation and measurement accuracy. However, these outfits may not accurately represent the personal protective equipment (PPE) worn by industry workers during their job tasks. Therefore, future studies should explore longer durations of repetitive tasks to better simulate the working conditions of industry workers. Furthermore, incorporating the use of appropriate PPE in future studies will provide a more realistic assessment of wearable core temperature measuring devices’ performance under real-world working conditions.
Future studies should aim to include a more comprehensive assessment of individual differences with larger and more diverse participants. This could involve investigating factors such as hydration status, fitness level, acclimatization to heat, resting metabolism rate, and other relevant variables that may contribute to variations in SS and Zephyr CT measurements. By incorporating a wider range of factors, a more comprehensive understanding of the relationship between these variables and CT measurements can be achieved.

5. Conclusions

This study aimed to address the growing concern of heat-related illness in workers due to increasing temperatures and potential heat waves. Non-intrusive wearable devices were developed to monitor workers’ core body temperature (CT) and provide early warning signs of heat-related illness. The effectiveness of Slate Safety and Zephyr devices were evaluated in a lab experiment with ten participants performing a dumbbell curling task in hot temperature conditions (temperature = 33 °C; humidity = 50%). Results showed that Slate Safety device had a bias of 0.20 °C and a precision of 0.35 °C, while the Zephyr device had a bias of −0.03 °C and a precision of 0.33 °C. As their precision and bias fell within clinically acceptable limits, both the Slate Safety and Zephyr devices may be acceptable alternatives for monitoring workers’ core body temperature in hot conditions. However, there was a proportional bias with these CT measuring devices, meaning that the reported temperature values are consistently deviated from the true values. In situations where precise temperature measurements are necessary, applying a simple mean bias correction may not be appropriate. Therefore, regression models or correction algorithms that consider the relationship between the measurements and the bias can be developed to improve the reliability of the CT measurements. This study adds to the existing research on using technology to prevent heat-related illnesses and enhance worker safety in hot environments. It also provides possible substitutes to the ingestible Core Body Temperature Sensor, which is often uncomfortable for users. Additionally, it raises awareness and promotes the adoption of wearable devices in workplace safety programs. This, in turn, could decrease heat-related illnesses and injuries among workers in high-temperature environments.

Author Contributions

Conceptualization, C.N. and A.A.I.; methodology, A.A.I.; software, A.A.I.; validation, A.A.I., M.K. and C.N.; formal analysis, A.A.I.; investigation, A.A.I.; resources, C.N. and A.S.K.; data curation, M.K.; writing—original draft preparation, A.A.I.; writing—review and editing, A.A.I., C.N. and A.S.K.; visualization, A.A.I.; supervision, C.N.; project administration, M.K.; funding acquisition, A.S.K. and C.N. All authors have read and agreed to the published version of the manuscript.

Funding

This research was funded, in part, by the US Department of Defense (Grant number: W81XWH2010030).

Institutional Review Board Statement

The study was conducted in accordance with the Declaration of Helsinki, and approved by the Institutional Review Board of The University of Alabama (protocol ID 19025-ME-R2 approved on 10 February 2022).

Informed Consent Statement

Informed consent was obtained from all subjects involved in the study.

Data Availability Statement

The data presented in this study are available on request from the corresponding author. The data are not publicly available due to IRB restrictions.

Acknowledgments

The research team would like to acknowledge the contributions of Donald Elswick and the UA SafeState. Donald Elswick provided expert insight on heat stress management and access to the Slate Safety data management platform. UA SafeState provided the research team with the Slate Safety devices used for this study.

Conflicts of Interest

The authors declare that they have no conflict of interest.

References

  1. The National Institute for Occupational Safety and Health (NIOSH). Heat Stress. Workplace Safety and Health Topics. 2020. Available online: https://www.cdc.gov/niosh/topics/heatstress/default.html (accessed on 13 February 2023).
  2. Zink, A.; Wurstbauer, D.; Rotter, M.; Wildner, M.; Biedermann, T. Do outdoor workers know their risk of NMSC? Perceptions, beliefs and preventive behaviour among farmers, roofers and gardeners. J. Eur. Acad. Dermatol. Venereol. 2017, 31, 1649–1654. [Google Scholar] [CrossRef] [Green Version]
  3. U.S. Bureau of Labor Statistics. 43 Work-Related Deaths Due to Environmental Heat Exposure in 2019. The Economics Daily, 2021. Available online: https://www.bls.gov/opub/ted/2021/43-work-related-deaths-due-to-environmental-heat-exposure-in-2019.htm (accessed on 13 February 2023).
  4. CPWR. The Construction Chart Book; The Center for Construction Research and Training: Silver Spring, MD, USA, 2016. [Google Scholar]
  5. Fitzwater, J.; Johnstone, C.; Schippers, M.; Cordoza, M.; Norman, B. A Comparison of Oral, Axillary, and Temporal Artery Temperature Measuring Devices in Adult Acute Care. MedsurgNursing 2019, 28, 35–41. [Google Scholar]
  6. Glaser, J.; Lemery, J.; Rajagopalan, B.; Diaz, H.F.; García-Trabanino, R.; Taduri, G.; Madero, M.; Amarasinghe, M.; Abraham, G.; Anutrakulchai, S.; et al. Climate change and the emergent epidemic of CKD from heat stress in rural communities: The case for heat stress nephropathy. Clin. J. Am. Soc. Nephrol. 2016, 11, 1472–1483. [Google Scholar] [CrossRef] [Green Version]
  7. Centers for Disease Control and Prevention. Heat Stress Controls. 2022. Available online: https://www.cdc.gov/niosh/topics/heatstress/controls.html (accessed on 2 April 2023).
  8. Notley, S.R.; Kenny, G.P.; Flouris, A.D. On the use of wearable physiological monitors to assess heat strain during occupational heat stress. Appl. Physiol. Nutr. Metab. 2018, 43, 869–881. [Google Scholar] [CrossRef]
  9. Sawka, M.N.; Friedl, K.E. Emerging Wearable Physiological Monitoring Technologies and Decision Aids for Health and Performance. J. Appl. Physiol. 2018, 124, 430–431. [Google Scholar] [CrossRef]
  10. Haldane, J.S. The Influence of High Air Temperatures No. I. Epidemiol. Infect. 1905, 5, 494–513. [Google Scholar] [CrossRef] [PubMed]
  11. Institute for Quality and Efficiency in Health Care (IQWiG). How Is Body Temperature Regulated and What Is Fever?—InformedHealth.org—NCBI Bookshelf. 2016. Available online: https://www.ncbi.nlm.nih.gov/books/NBK279457/ (accessed on 21 March 2023).
  12. Leon, L.R.; Bouchama, A. Heat Stroke. Compr. Physiol. 2015, 5, 611–647. [Google Scholar] [CrossRef] [PubMed] [Green Version]
  13. American Conference of Governmental Industrial Hygienists (ACGIH). TLVs and BEIs Based on the Documentation of the Threshold Limit Values for Chemical Substances and Physical Agents & Biological Exposure Indices; American Conference of Governmental Industrial Hygienists (ACGIH): Cincinnati, OH, USA, 2017. [Google Scholar]
  14. Petersen, C.J.; Portus, M.R.; Pyne, D.B.; Dawson, B.T.; Cramer, M.N.; Kellett, A.D. Partial Heat Acclimation in Cricketers Using a 4-Day High Intensity Cycling Protocol. Int. J. Sports Physiol. Perform. 2010, 5, 535–545. [Google Scholar] [CrossRef] [PubMed] [Green Version]
  15. Neff, L.M.; Hoffmann, M.E.; Zeiss, D.M.; Lowry, K.; Edwards, M.; Rodriguez, S.M.; Wachsberg, K.N.; Kushner, R.; Landsberg, L. Core body temperature is lower in postmenopausal women than premenopausal women: Potential implications for energy metabolism and midlife weight gain. Cardiovasc. Endocrinol. 2016, 5, 151. [Google Scholar] [CrossRef] [Green Version]
  16. Petry, A.; McGilvray, W.; Rakhshandeh, A.R.; Rakhshandeh, A. Technical note: Assessment of an alternative technique for measuring body temperature in pigs. J. Anim. Sci. 2017, 95, 3270–3274. [Google Scholar] [CrossRef]
  17. Casa, D.J.; Becker, S.M.; Ganio, M.S.; Brown, C.M.; Yeargin, S.W.; Roti, M.W.; Siegler, J.; Blowers, J.A.; Glaviano, N.R.; Huggins, R.A.; et al. Validity of Devices That Assess Body Temperature During Outdoor Exercise in the Heat. J. Athl. Train. 2007, 42, 333. [Google Scholar] [CrossRef] [PubMed]
  18. HQ, Inc. CorTemp. 2022. Available online: https://www.hqinc.net/cortemp/ (accessed on 14 February 2023).
  19. Callihan, M.; Cole, H.; Stokley, H.; Gunter, J.; Clamp, K.; Martin, A.; Doherty, H. Comparison of Slate Safety Wearable Device to Ingestible Pill and Wearable Heart Rate Monitor. Sensors 2023, 23, 877. [Google Scholar] [CrossRef] [PubMed]
  20. SlateSafety. Connected Worker Safety. 2021. Available online: https://slatesafety.com/ (accessed on 5 January 2022).
  21. Zephyr Technology. Omnisense Analysis and Help; Zephyr Technology: Annapolis, MD, USA, 2016. [Google Scholar]
  22. Kalman, R.E. A New Approach to Linear Filtering and Prediction Problems. J. Basic Eng. 1960, 82, 35–45. [Google Scholar] [CrossRef] [Green Version]
  23. Seo, Y.; DiLeo, T.; Powell, J.B.; Kim, J.H.; Roberge, R.J.; Coca, A. Comparison of estimated core body temperature measured with the BioHarness and rectal temperature under several heat stress conditions. J. Occup. Environ. Hyg. 2016, 13, 612–620. [Google Scholar] [CrossRef] [PubMed]
  24. Daanen, H.A.M.; Kohlen, V.; Teunissen, L.P.J. Heat flux systems for body core temperature assessment during exercise. J. Therm. Biol. 2023, 112, 103480. [Google Scholar] [CrossRef]
  25. Iden, T.; Horn, E.P.; Bein, B.; Böhm, R.; Beese, J.; Höcker, J. Intraoperative temperature monitoring with zero heat flux technology (3M SpotOn sensor) in comparison with sublingual and nasopharyngeal temperature. Eur. J. Anaesthesiol. 2015, 32, 387–391. [Google Scholar] [CrossRef]
  26. Rubia-Rubia, J.; Arias, A.; Sierra, A.; Aguirre-Jaime, A. Measurement of body temperature in adult patients: Comparative study of accuracy, reliability and validity of different devices. Int. J. Nurs. Stud. 2011, 48, 872–880. [Google Scholar] [CrossRef]
  27. Edwards, B.; Waterhouse, J.; Reilly, T.; Atkinson, G. A comparison of the suitabilities of rectal, gut, and insulated axilla temperatures for measurement of the circadian rhythm of core temperature in field studies. Chronobiol. Int. 2009, 19, 579–597. [Google Scholar] [CrossRef]
  28. Hwang, H.J.; Chung, W.H.; Song, J.H.; Lim, J.K.; Kim, H.S. Prediction of biceps muscle fatigue and force using electromyography signal analysis for repeated isokinetic dumbbell curl exercise. J. Mech. Sci. Technol. 2016, 30, 5329–5336. [Google Scholar] [CrossRef]
  29. Antwi-Afari, M.F.; Li, H.; Edwards, D.J.; Pärn, E.A.; Seo, J.; Wong, A.Y.L. Biomechanical analysis of risk factors for work-related musculoskeletal disorders during repetitive lifting task in construction workers. Autom. Constr. 2017, 83, 41–47. [Google Scholar] [CrossRef]
  30. Al-Ashaik, R.A.; Ramadan, M.Z.; Al-Saleh, K.S.; Khalaf, T.M. Effect of safety shoes type, lifting frequency, and ambient temperature on subject’s MAWL and physiological responses. Int. J. Ind. Ergon. 2015, 50, 43–51. [Google Scholar] [CrossRef]
  31. Place, N.; Maffiuletti, N.A.; Martin, A.; Lepers, R. Assessment of the reliability of central and peripheral fatigue after sustained maximal voluntary contraction of the quadriceps muscle. Muscle Nerve 2007, 35, 486–495. [Google Scholar] [CrossRef] [PubMed]
  32. IBM Corporation. IBM SPSS Statistics for Windows; IBM Corporation: Armonk, NY, USA, 2019. [Google Scholar]
  33. CDC. Assessing Your Weight. Healthy Weight, Nutrition, and Physical Activity. Available online: https://www.cdc.gov/healthyweight/assessing/index.html (accessed on 22 May 2023).
  34. Hagen, J.; Himmler, A.; Clark, J.; Ramadan, J.; Stone, J.; Divine, J.; Mangine, R. Test and Evaluation of Heart Rate Derived Core Temperature Algorithms for Use in NCAA Division I Football Athletes. J. Funct. Morphol. Kinesiol. 2020, 5, 46. [Google Scholar] [CrossRef] [PubMed]
  35. Fortney, S.M.; Vroman, N.B. Exercise, performance and temperature control: Temperature regulation during exercise and implications for sports performance and training. Sports Med. 1985, 2, 8–20. [Google Scholar] [CrossRef]
  36. Lim, C.L.; Byrne, C.; Lee, J.K. Human Thermoregulation and Measurement of Body Temperature in Exercise and Clinical Settings. Ann. Acad. Med. Singap. 2008, 37, 347–353. [Google Scholar] [CrossRef]
  37. Dolson, C.M.; Harlow, E.R.; Phelan, D.M.; Gabbett, T.J.; Gaal, B.; McMellen, C.; Geletka, B.J.; Calcei, J.G.; Voos, J.E.; Seshadri, D.R. Wearable Sensor Technology to Predict Core Body Temperature: A Systematic Review. Sensors 2022, 22, 7639. [Google Scholar] [CrossRef] [PubMed]
  38. Hintz, C.; Presley, D.M.; Butler, C.R. Heat Stroke Burden and Validity of Wearable-Derived Core Temperature Estimation during Elite Military Training. Physician Sportsmed. 2023, 1–6. [Google Scholar] [CrossRef]
  39. Tyler, C.J.; Reeve, T.; Hodges, G.J.; Cheung, S.S. The Effects of Heat Adaptation on Physiology, Perception and Exercise Performance in the Heat: A Meta-Analysis. Sports Med. 2016, 46, 1699–1724. [Google Scholar] [CrossRef]
  40. McGowan, C.J.; Pyne, D.B.; Thompson, K.G.; Rattray, B. Warm-Up Strategies for Sport and Exercise: Mechanisms and Applications. Sports Med. 2015, 45, 1523–1546. [Google Scholar] [CrossRef]
  41. Coris, E.E.; Ramirez, A.M.; Van Durme, D.J. Heat Illness in Athletes: The Dangerous Combination of Heat, Humidity and Exercise. Sports Med. 2004, 34, 9–16. [Google Scholar] [CrossRef]
  42. Epstein, Y.; Roberts, W.O. The pathopysiology of heat stroke: An integrative view of the final common pathway. Scand. J. Med. Sci. Sports 2011, 21, 742–748. [Google Scholar] [CrossRef] [PubMed]
  43. Savastano, D.M.; Gorbach, A.M.; Eden, H.S.; Brady, S.M.; Reynolds, J.C.; Yanovski, J.A. Adiposity and human regional body temperature. Am. J. Clin. Nutr. 2009, 90, 1124–1131. [Google Scholar] [CrossRef] [PubMed] [Green Version]
  44. Cannon, B.; Nedergaard, J. Brown Adipose Tissue: Function and Physiological Significance. Physiol. Rev. 2004, 84, 277–359. [Google Scholar] [CrossRef] [PubMed]
  45. Dulloo, A.G.; Jacquet, J. An adipose-specific control of thermogenesis in body weight regulation. Int. J. Obes. 2001, 25, S22–S29. [Google Scholar] [CrossRef] [PubMed]
Figure 1. Research framework.
Applsci 13 06803 g001
Figure 2. Participant conducting (a) MVC and (b) dumbbell curling task.
Applsci 13 06803 g002
Figure 3. (a) A Bland–Altman plot and (b) CT data output for the comparison of SS and ICTS (n = 10 participants).
Applsci 13 06803 g003
Figure 4. (a) A Bland–Altman plot and (b) CT data for the comparison of Zephyr and ICTS (n = 10 participants).
Applsci 13 06803 g004
Table 1. Summary of participants’ physiological information.
ParticipantMeanMedianStandard DeviationMinimumMaximum
Age (years)21.7203.918.029.0
Height (inches)70.5703.265.176.4
Weight (pounds)160.4166.425.5112.8201.6
BMI22.723.23.317.229.0
MVC (pounds)43.242.512.526.572.2
Table 2. Duration, mean, and max CT as collected from the CT devices.
IDIntensityBMIAvoid HeatDuration (mins)Mean_ICTSMax_ICTSMean_SSMax_SSMean_ZephyrMax_Zephyr
1VigorousHealthysometimes3737.1337.3937.4337.7437.3437.50
2moderate HealthyNo4737.1937.5337.5538.0337.3537.80
3moderate Healthyno1437.2837.3337.7438.2237.3937.50
4Lowoverweightsometimes1638.0639.6338.1638.5937.3137.70
5moderate underweightno2838.0238.0737.5838.1437.4337.90
6Vigorousoverweightsometimes936.6036.7837.4137.6837.1237.20
7LowHealthysometimes2337.5737.7037.4237.7837.2937.50
8VigorousHealthysometimes837.5137.5837.6837.8837.2237.22
9Lowunderweightsometimes4337.1437.2637.3737.5837.2437.40
10Lowoverweightsometimes1037.1237.1937.6838.0737.2637.40
Average37.3637.3937.6037.7437.3037.50
Table 3. Frequency of mean temperature difference.
Temperature DifferenceMeanMaximum
Slate SafetyZephyrSlate SafetyZephyr
≤±0.5 °C8759
>±0.5 °C to ±1.0 °C2351
Table 4. Bias, precision, lower and upper limits value as computed from the Bland–Altman plot.
CT DevicesBiasPrecision (SD)95% Limits of Agreement
LowerUpper
Slate Safety0.2010.345−0.4740.877
Zephyr−0.0250.328−0.6680.618
SD: standard deviation, CT: core temperature.
Disclaimer/Publisher’s Note: The statements, opinions and data contained in all publications are solely those of the individual author(s) and contributor(s) and not of MDPI and/or the editor(s). MDPI and/or the editor(s) disclaim responsibility for any injury to people or property resulting from any ideas, methods, instructions or products referred to in the content.

