Abstract
The high penetration of inverter-based distributed generations (IBDGs) leads to traditional distribution networks’ complex and variable fault characteristics. Traditional passive detection protection methods can hardly meet the stability and reliability requirements. To solve this problem, an injection harmonic current differential protection (IHCDP) scheme based on the idea of control-protection synergy is proposed in this paper. By analyzing the circuit structure, control strategy, low-voltage-ride-through characteristics of IBDGs, and short-circuit currents provided by IBDGs, an injection-control strategy of characteristic harmonic currents (CHCs) based on the d-axis and q-axis is proposed. According to the change of short-circuit currents provided by the IBDG, the amplitude of CHCs is adaptively corrected to strengthen the fault characteristics and ensure that the distribution network harmonic injection protocols are always satisfied. An IHCDP criterion based on the distortion rate of the negative-sequence component of CHCs is proposed by analyzing the fault characteristics of the CHCs after injection. To effectively eliminate the dead-zone problem during symmetrical short-circuit faults, the proposed IHCDP utilizes the distortion rate of A-phase CHCs. The feasibility of the proposed protection scheme is demonstrated by the theoretical analysis and simulation results in this paper.
1. Introduction
After a large number of distributed generations (DGs) are connected to the distribution network, the topology of the traditional distribution network has been dramatically transformed from the original single-power supply radial network structure to a complex network structure with multiple-power supplies. The operation mode, power flow, and short-circuit current fault characteristics of the distribution network are complex and variable [1], making its protection face significant challenges [2].
Depending on the grid-connected interface, DGs can be divided into synchronous-based DGs (SBDGs) directly connected to the grid and IBDGs connected to the grid by inverters [3]. Among them, the fault characteristics of IBDGs differ from traditional synchronous generators due to the low inertia, high controllability, and poor overcurrent capability of inverters [4]. The output currents of IBDGs are affected by their inverter control strategy, low voltage ride-through (LVRT), and fault conditions. The uncertainty of IBDGs’ output currents makes the setting and delay coordination of traditional passive-detection-type protection face significant challenges in the distribution network with IBDGs [5], especially in the case of high penetration of IBDGs.
Most available studies have improved traditional passive-detection protection methods to make them applicable to distribution networks with DGs. Traditional overcurrent protection is improved in [6,7,8], modifying the protection setting values according to the DG output’s fault characteristics. This method is simple to implement and has high sensitivity. However, it is difficult to set and coordinate the protection in the active distribution network due to its variable operation modes, complex branches, and numerous DG access points. To solve the above problems, an overcurrent protection scheme based on wide-area communication is proposed in [9,10,11,12]. After receiving current information, the centralized controller adaptively calculates the set value of each protection, which requires high communication requirements. In [13], an efficient protection method is proposed by comprehensively using the local fault voltage and current information without communication, but is only applicable to the distribution network with SBDGs.
Compared with single-end protection based on local information, pilot protection using electrical information at both ends of the feeder has superior operational performance in multi-power networks. Adjacent impedance information is used to construct protection criteria in [14,15,16] for fault identification and isolation with high protection reliability. All of the above methods use voltage information. However, the practical medium/low voltage distribution network feeders are generally not equipped with voltage transformers, which limits the application of these schemes. In [17,18], current differential protection applied in transmission lines is improved and introduced into the distribution network, which has good selectivity, but high requirements for data time synchronization.
Traditional passive protection methods seldom consider the influence of the control strategy of IBDG. However, the control strategy of IBDG directly determines its fault characteristics, which is critical for protection. In [19], the idea of control-protection synergy is first proposed: fault detection is achieved using the control strategy of the IBDG. In [20], a protection scheme based on controlling the negative-sequence current of the IBDG output is proposed, but fault types must be judged first to determine the given value of the negative-sequence current. Reference [21] reviews active detection-based fault identification methods, and the feasibility and physical limitations of the injection detection signal operation are described. In [22], a differential protection scheme based on non-rated frequency injection is proposed to detect and isolate faults. In [23], an overcurrent protection scheme based on harmonic voltage injection is proposed, and fault detection and isolation are achieved by integrating the amplitude and phase of harmonic currents. The methods proposed in [22,23] mainly apply to microgrids under islanding operation mode. However, they provide a new idea for studying control-protection synergy in active distribution networks: active injection detection type protection.
Considering that the system power supply will generate harmonics during faults in the distribution network and the distribution network has strict requirements for harmonic injection, whether the injection protection method can be applied to the distribution network needs further study. This paper revisits the feasibility of active injection detection protection in distribution networks with IBDGs and proposes an injection harmonic current differential protection (IHCDP) scheme based on control-protection synergy. The remainder of this paper is organized as follows. Section 2 deeply studies the equivalent model of IBDG, including its circuit structure, control strategy, and LVRT characteristics. Section 3 analyzes the change of short-circuit currents provided by IBDG before and after injecting characteristic harmonic signals. Section 4 describes the principle of IHCDP. On this basis, the implementation scheme of IHCDP is presented in Section 5. The feasibility of the proposed protection scheme is verified by PSCAD/EMTDC in Section 6. Section 7 summarizes the results and the contributions of this paper.
2. Equivalence Model of IBDG
2.1. Typical Structure of IBDG
The fault characteristics of the distribution network with IBDGs are closely related to the fault response of IBDGs, so it is necessary to study the typical structure and control strategy of IBDGs in depth before designing an injection protection scheme.
The typical structure of IBDG operating at the fundamental frequency signal consists of three parts [24]: the DC source, power electronic inverter, and filter circuit, as shown in Figure 1a. Cdc is the DC voltage regulator capacitor, Rf is the filter resistor, Lf is the filter inductor, and Cf is the filter capacitor.
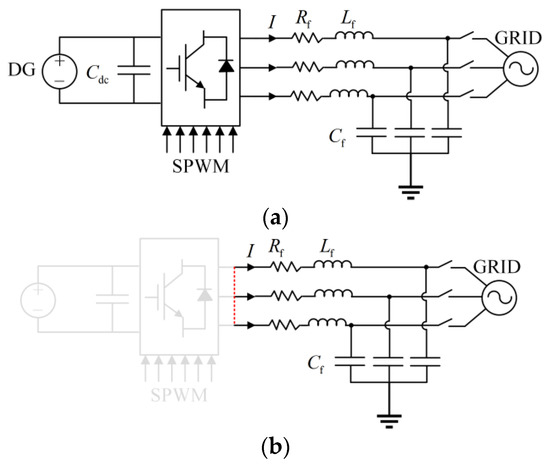
Figure 1.
Typical structure of IBDG (a) under fundamental frequency signals, and (b) under characteristic frequency signals.
The frequency of characteristic signals selected by existing injection protection schemes is generally far from the fundamental frequency (50 Hz). For the IBDG operating at the fundamental frequency signal, the gain of its controller on the characteristic signal is meager. It can be assumed that the outlet voltage of the IBDG inverter does not contain the characteristic frequency signal. Therefore, regardless of the control strategy of the IBDG, for the characteristic frequency signal, the IBDG can be equated to an RLC parallel circuit, as shown in Figure 1b.
The resonant frequency of the RLC parallel circuit shown in Figure 1b can be derived as
where fc is the resonant frequency, whose value is determined by the filter parameters Rf, Lf, and Cf.
2.2. PQ Control Strategy of IBDGs
Most IBDGs in the existing distribution network are controlled by a constant power (PQ) control strategy [25]. Under normal operation, the control system directs the universal voltage phasor of the grid connection point to the d-axis (assuming that the d-axis phase is ahead of the q-axis phase). The power outer loop control link of the PQ control strategy can be expressed as [26,27].
where, Pout and Qout are the active and reactive power provided by the IBDG and Pref and Qref are the given active and reactive reference power. To maximize the use of clean energy, the IBDG is usually constrained to output only active power, i.e., such that Qout = Qref = 0; Upcc_d is the d-axis component of the universal voltage phasor of the grid connection point; and Id_ref and Iq_ref are the current reference values of the d-axis and q-axis in the current inner loop control link, representing the active and reactive currents, respectively.
2.3. Control Characteristics of Low Voltage Ride-Through
According to the new international and Chinese standards for grid connection [28,29], medium and large IBDGs must have LVRT capability. When the grid is disturbed, or a fault occurs, IBDGs need to inject reactive current as a priority to support the grid voltage during LVRT. Taking the standard of the latest Chinese grid connection as an example, the dynamic reactive current injected during LVRT operation can be expressed as [29,30]
where Iq_ref is the reference value of the injected reactive current during LVRT; U∗pcc is the per-unit value of grid connection point voltage; K1 is the reactive support factor, K1 ≥ 1.5; K2 determines the maximum value of reactive current injection at low voltage, K2 ≥ 1.05; and IN is the output rated current of IBDG; Imax is the maximum fault current allowed to be output by the IBDG, generally limited to two times the rated current. From Equation (3), when U∗pcc is greater than 0.9, Iq_ref = 0, the IBDG outputs only active current; when U∗pcc drops to the range of 0.2–0.9, in order to support the system voltage, the IBDG should output as much reactive current as possible, providing at least 1.5% reactive current for every 1% voltage drop while not exceeding the maximum allowable current output by the IBDG; when U∗pcc is less than 0.2, the maximum reactive current value allowed to be output by the IBDG is K2IN, whose value is equal to the value of reactive current output when U∗pcc = 0.2.
In addition, as much active power should be output during the LVRT as possible while satisfying the reactive power output. In summary, the output current of IBDG can be expressed as [31]
where, IIBDG_d and IIBDG_q are the active and reactive currents provided by IBDG, respectively, and IIBDG is the amplitude of the output current of IBDG. From Equation (4), the LVRT control strategy of IBDG gives priority to reactive power output, and the output of the reactive current tracking reference value should be ensured first. In order for the inverter to emit the maximum active power without exceeding the maximum allowed current, the active current reference is taken as the smaller value between and [26].
When the grid operates asymmetrically, the IBDG generates negative-sequence currents. Negative-sequence currents for control systems of IBDGs based on the synchronous rotating frame can deteriorate the control system performance, increase inverter losses, and exacerbate the degree of grid asymmetry. Therefore, most IBDGs adopt the PQ control strategy while suppressing the negative-sequence components. The electrical quantities in Equations (2)–(4) refer to the positive-sequence components.
3. Analysis of Output Short-Circuit Currents of IBDG
3.1. Analysis of Output Fundamental Frequency Short-Circuit Currents
According to the analysis in Section 2, the phase relationship between the universal phasor IIBDG of the IBDG output current and the universal phasor Upcc_d of positive-sequence voltage at the grid connection point can be obtained, as shown in Figure 2.
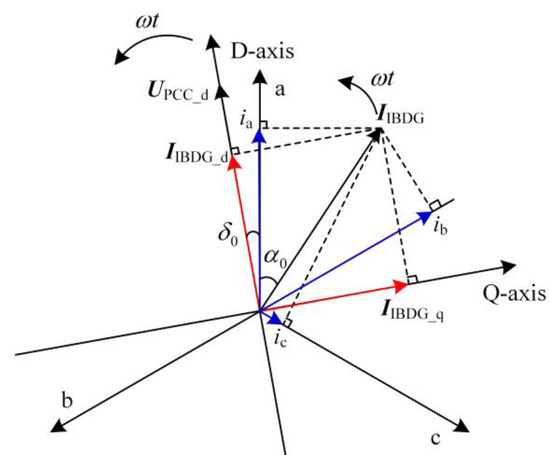
Figure 2.
The phase relationship between IIBDG and Upcc_d.
After faults occur, the IBDG mainly outputs inductive reactive power [32], i.e., the Upcc_d phase is ahead of the IIBDG phase. According to the phase relationship in Figure 2, the instantaneous values of the three-phase current provided by the IBDG can be found as
where, IIBDG and α0 are the amplitude and initial phase of the IBDG output current universal phasor IIBDG, respectively, and ω is the grid angular frequency.
By triangulating the A-phase instantaneous current in Equation (5), it can be expressed as
where δ0 is the initial phase of Upcc_d, due to suppressing negative-sequence currents, the three-phase current provided by the IBDG is symmetrical.
According to Equation (6), the instantaneous values of B-phase and C-phase currents expressed in terms of d-axis and q-axis components can be introduced as
From Equations (5)–(7), IIBDG can be derived as
According to the phasor relation in Figure 2, it can be seen that
3.2. Analysis of Output Short-Circuit Currents after Injection
At the instant after faults, it is assumed that the characteristic frequency signals acosθ1 and asinθ1 are injected into the d-axis and q-axis reference currents of the current internal loop control link in the IBDG control system, respectively. The instantaneous values of the three-phase current provided by IBDG after injection are obtained according to Equations (5) and (6), and Park transformation, as shown in Equation (10).
where, θ = ωt + δ0, θ1 = ω1t, ω1 is the characteristic angular frequency and a is the amplitude of the injected characteristic frequency signal.
Comparing Equations (5), (6) and (9), after injection, there will be new characteristic frequency signals in the output currents of IBDG. The new characteristic frequency signals are also called characteristic harmonic currents (CHCs). They are three-phase symmetrical. Taking the output current of the A-phase as an example analysis, the CHC is
where f1 is the frequency of the characteristic signals injected into the d-axis and q-axis reference currents; f is the fundamental frequency. From Equation (11), the amplitude of the CHC is a, and the frequency of CHC is (f1 − f) Hz.
4. Principle of Characteristic Harmonic Current Differential Protection
Protection adopts three-phase reclosing in distribution networks, which does not need to determine the fault type. To reduce the amount of data transmitted by communication, this paper prioritizes the sequence component to construct the protection criterion. The CHCs in the short-circuit currents on the IBDG side are decomposed to obtain the positive, negative, and zero sequence components, as shown in Equation (12).
As seen from Equation (12), the decomposed CHCs contain only the negative-sequence component. The following is an analysis of the negative-sequence component of the characteristic harmonic currents (NSCCHCs) in the short-circuit currents.
In Figure 3, R1 and R2 are protective relays. After a fault occurs at point f, both the short-circuit currents provided by the GRID and the short-circuit currents provided by the IBDG flow to point f. The short-circuit currents at R2 contain the injected CHCs, while the short-circuit currents at R1 do not contain or contain fewer CHCs. In order to reduce the interference caused by the harmonics generated at the moment of fault, this paper constructs the differential protection criterion based on the distortion rate of NSCCHCs. The distortion rate of the NSCCHC is defined as
where If(h) is the amplitude of the NSCCHC; If(1) is the amplitude of the negative-sequence component of the fundamental frequency current (NSCFFC). The calculation of the distortion rate of the A-phase CHC is similar to this and will not be repeated here.
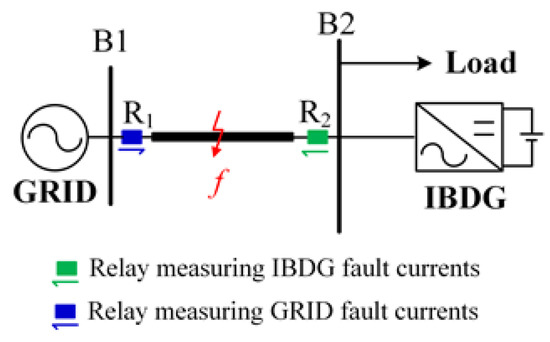
Figure 3.
Schematic diagram of the distribution network with IBDG.
It should be noted that when symmetrical faults occur, NSCFFCs are about 0 within a short time after faults, and the differential protection criterion based on the distortion rate of NSCCHC is no longer applicable. In order to effectively eliminate the dead-zone problem of this criterion in symmetrical faults, the difference in the distortion rate of the A-phase CHCs on both sides of the protected feeder is used as an additional criterion. In summary, the injection CHC differential protection criteria are as follows.
- In the case of asymmetrical faults:
- In the case of symmetrical faults:
In Equations (14) and (15), ΔDRfset and ΔDRAset are the action thresholds of the CHC differential protection criteria, generally taken as 0.3–0.5 times the total harmonic current distortion rate at the IBDG outlet.
5. Implementation Scheme of Injection Harmonic Current Differential Protection
5.1. Selection of the Frequency and Amplitude of the Characteristic Harmonic Current
For the injection protection scheme, the selection of the frequency of the CHC is crucial, and the following constraints need to be considered.
- The characteristic frequency should not exceed ten times the fundamental frequency. The resonant frequencies of IBDG filters are generally widely distributed from 10 times the fundamental frequency to 0.5 times the carrier frequency. The characteristic frequency is less than ten times the fundamental frequency, which can avoid the resonance of CHCs with IBDG filters and thus ensure the safe and stable operation of IBDG. In order to suppress the shunting effect of the non-injected source IBDG on CHCs, the characteristic frequency cannot be much smaller than the resonant frequency.
- The characteristic frequency should be as far from the fundamental frequency as possible. When the distribution network is disturbed, or after a fault occurs, the harmonics will inevitably be generated, mainly low-order harmonics. If the characteristic frequency is far from the fundamental frequency, it can minimize the interference of the generated harmonics to the injection protection.
- The characteristic frequency should be taken as an integer multiple of the fundamental frequency. The selection of integer multiples of the fundamental frequency facilitates the extraction, analysis, and processing of the Fast Fourier Transform (FFT), wavelet transform, and other standard time-frequency analysis methods, shortens the signal processing delay, and improves the engineering practicality of the injection protection method.
For the selection of the amplitude of the CHC, according to the latest Chinese regulations [33], the total harmonic distortion rates of the current injected into the grid are limited to 5% when the grid-connected inverter is operating at rated power. Therefore, the amplitude of the injected CHC needs to be less than 5% of the output current of IBDG.
In this paper, the eighth harmonic (with a frequency of 400 Hz) currents are injected into the d-axis and q-axis reference currents of the IBDG current inner loop control link. There will be seventh harmonic (with a frequency of 350 Hz) currents in the output currents of IBDG. The CHC injected into the grid remains at 4% of the IBDG output current amplitude in normal operation and under various fault scenarios. The amplitude a of the characteristic harmonic current should satisfy the following relation.
5.2. Principle of Injection Starting of Characteristic Harmonic Currents
In order to avoid harm to users from the CHCs injected under normal operation of the distribution network, this paper designs a corresponding starting module to initiate the injection of CHCs only after a fault. From Figure 4, the fault is detected by collecting the phase voltage and current at the IBDG outlet. When the starting criterion is satisfied, an enable signal is injected into the internal harmonic injection unit of the IBDG controller.
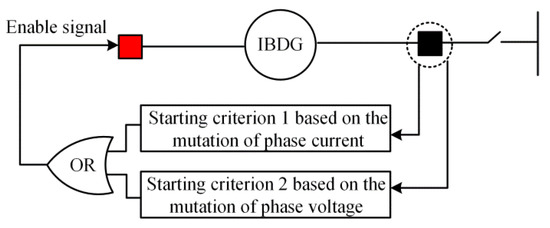
Figure 4.
Starting schematic of the IBDG injection unit.
In Figure 4, the starting criterion 1 based on the mutation of phase current is as follows:
where i(k) is the sampling value of phase current at time k; N is the total number of sampling points per cycle; KS is the starting coefficient and takes the value of 0.1–0.3; IN is the rated current of the protected feeder; and “| |” are the signs for absolute value. The starting criterion 2 based on the mutation of phase voltage is similar to the starting criterion 1 and will not be repeated here.
5.3. Total Control System of IBDG with the CHC Injection
In Figure 5, the letters in the upper right corner of each module represent:
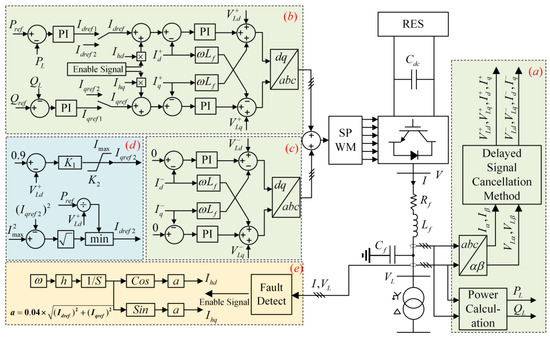
Figure 5.
Overall control system structure of IBDG.
(a) the positive and negative-sequence separation link, which uses the delayed signal cancellation method [34] to realize the positive- and negative-sequence separation of electrical quantities;
(b) the PQ control link based on positive-sequence components, with power control in the outer loop and current control in the inner loop;
(c) the control link for suppressing negative-sequence currents;
(d) the LVRT link; and
(e) the fault detection and harmonic injection control link.
From Figure 5, when a fault occurs in the distribution network, module (e) of the IBDG control system detects the fault and injects an enable signal to module (b); after receiving the enable signal, module (b) injects characteristic harmonic signals into the d-axis and q-axis reference currents of the current inner loop control link, respectively. The amplitude of characteristic harmonic signals adaptively changes with the output currents of IBDG, always keeping it at 4% of the amplitude of output currents, so that it can strengthen the fault characteristics and still meet the grid connection regulations under fault conditions, and finally completes the CHCs injection. The implementation process of the injection harmonic current differential protection scheme is shown in Figure 6.
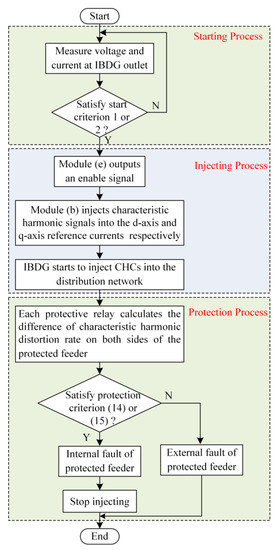
Figure 6.
Implementation flowchart of the injection harmonic current differential protection scheme.
6. Simulation and Analysis
6.1. Test System under Study
To test the performance of the proposed protection scheme, a 10 kV distribution network with IBDGs simulation model was built using PSCAD/EMTDC, as shown in Figure 7. According to the China National Standard [35], the test system has three voltage levels: 35 kV (GRID), 10 kV (medium-voltage distribution network) and 0.38 kV (IBDGs). In Figure 7, GRID is the grid source; B1, B2, and B3 represent system buses; L1, L2, and L3 represent loads; R1, R2, R3, and R4 represent protective relays; and points f1 and f2 are located at the midpoints of feeder sections B1B2 and B2B3. The IBDGs in the test system adopt the PQ control strategy in Section 2 and have a low-voltage ride-through function. When asymmetric faults occur, the IBDGs can suppress the output of negative-sequence currents. In addition, the maximum output currents of IBDGs are 1.5 times the rated currents. The parameters of this simulation model are given in Table 1.
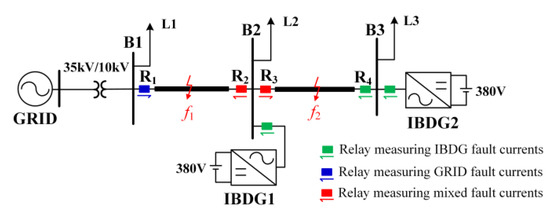
Figure 7.
Simulation model of 10 kV distribution network with IBDGs.

Table 1.
Parameters of the simulation model.
6.2. Verifying the Correctness of CHCs Injection
6.2.1. During Normal Operation, CHCs Are Artificially Injected at 0.3 s
Under the normal operation of the distribution network with IBDGs, IBDG1 and IBDG2 artificially start injecting CHCs at 0.3 s according to the injection strategy in Section 5. The currents at the outlet of IBDG1 before and after injection are shown in Figure 8. The amplitude of the A-phase fundamental frequency current and CHC (350 Hz) are extracted using the FFT, and the distortion rate of A-phase CHC is calculated. The distortion rate of A-phase CHC at the IBDG1 outlet is shown in Figure 9. Figure 10 shows the amplitude Mag17 of A-phase CHC and the waveforms of characteristic harmonic (400 Hz) signals Ihd and Ihq injected d-axis and q-axis reference currents.
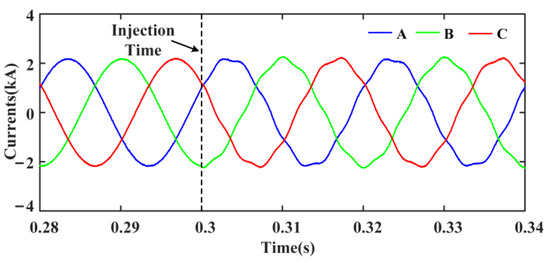
Figure 8.
Currents at the outlet of IBDG1 before and after injection.
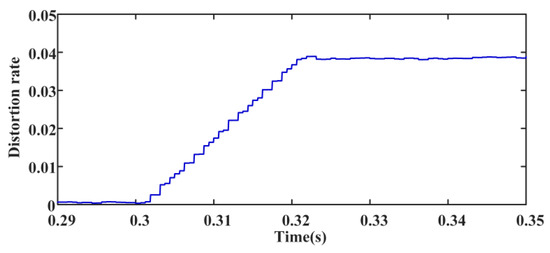
Figure 9.
Distortion rate of A-phase CHC at the outlet of IBDG1.
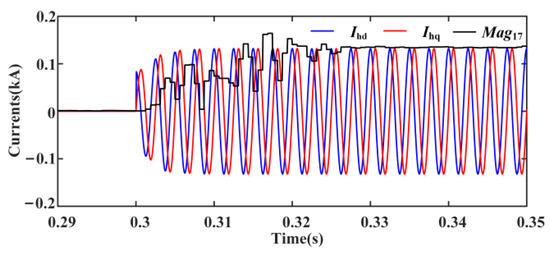
Figure 10.
The amplitude of A-phase CHC and the waveforms of characteristic harmonic signals.
From Figure 8, it can be seen that there is a harmonic component in the current at the outlet of IBDG1 after 0.3 s, and this harmonic component is analyzed by using FFT. Due to the inherent delay of the FFT operation, the amplitude of the detected characteristic harmonic current reaches stability after one cycle (0.02 s), and its stable value is approximately equal to the amplitude of characteristic harmonic signals, as shown in Figure 10. As shown in Figure 9, the distortion rate of CHC at the outlet of IBDG1 is stabilized at 4% after one cycle, which meets the harmonic injection regulation of the distribution network. The above simulation results are consistent with the theoretical analysis in Section 3 and can verify the correctness of the CHCs injection system under normal operation.
6.2.2. Phase-to-Phase (A–B) Faults with 0.1 Ω Fault Resistance Occur at f2
When a phase-to-phase (A–B) fault with 0.1 Ω fault resistance occurs at f2, IBDG1 and IBDG2 detect the fault and initiate the injection of CHCs according to the injection strategy. The currents at the outlet of IBDG1 before and after the fault are shown in Figure 11. The distortion rate of A-phase CHC at the IBDG1 outlet is shown in Figure 12. The amplitude Mag17 of A-phase CHC and the characteristic harmonic signals Ihd and Ihq are shown in Figure 13.
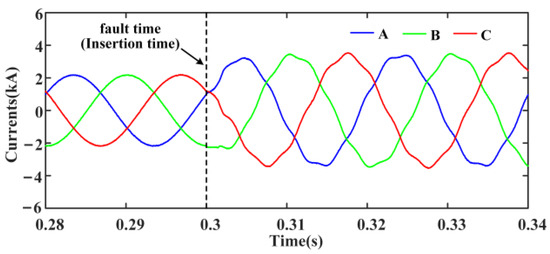
Figure 11.
Currents at the outlet of IBDG1 before and after the fault.
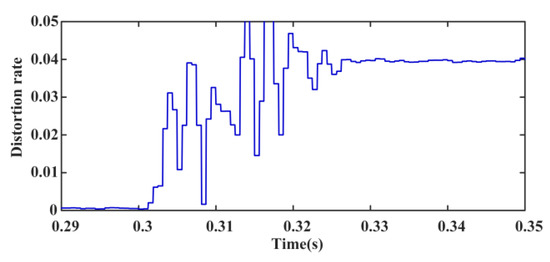
Figure 12.
Distortion rate of A-phase CHC at the outlet of IBDG1 before and after the fault.
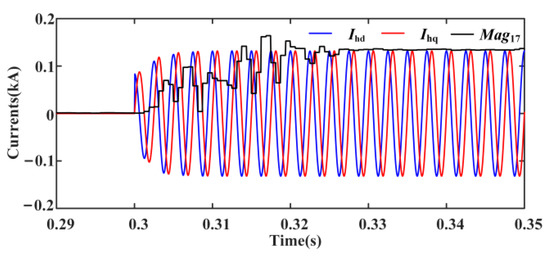
Figure 13.
The amplitude of A-phase CHC and the waveforms of characteristic harmonic signals under the fault.
From Figure 11, IBDG1 performs LVRT at 0.3 s, and the currents at the outlet increase to 1.5 times the original one. There are CHCs in the output currents of IBDG1 after 0.3 s. Due to the inherent delay of FFT operation, the amplitude of the CHC reaches stability after one cycle, and the stable value is approximately equal to the amplitude of characteristic harmonic signals, as shown in Figure 13. From Figure 12, the distortion rate of CHC is stabilized at 4%. The above simulation results are consistent with the theoretical analysis in Section 3 and can verify the correctness of the CHCs injection system under the fault.
6.3. Verifying the Correctness of IHCDP
6.3.1. Case 1: Asymmetrical Short-Circuit Faults with 0.1 Ω Fault Resistance Occur at f1
At 0.3 s, set single-phase-to-ground (A–G) faults, two-phase-to-ground (AB–G) faults, and phase-to-phase (A–B) faults with 0.1 Ω fault resistance occur at f1, respectively. After detecting faults, IBDG1 and IBDG2 inject CHCs into the distribution network according to the injection strategy. The distortion rates of NSCCHCs on both sides of protected feeder B1B2 after faults are shown in Figure 14.
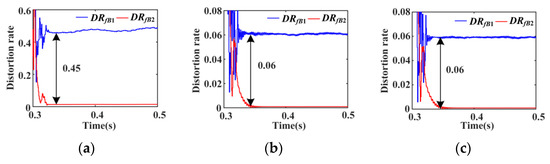
Figure 14.
Distortion rate records of asymmetric faults with 0.1 Ω fault resistance. (a) A–G fault, (b) AB–G fault, and (c) A–B fault.
In Figure 14, DRfB1 and DRfB2 represent the distortion rates of NSCCHCs on the GRID and IBDG sides of protected feeder B1B2, respectively. The action threshold of NSCCHCs differential protection criterion is set to 2%. From Figure 14, when the A–G, AB–G, and A–B faults occur at f1, the distortion rate difference values of NSCCHCs on both sides of feeder B1B2 are about 0.45, 0.06, and 0.06 after one cycle. It can be seen that the IHCDP can sensitively trip under various asymmetric faults, especially under single-phase-to-ground faults.
6.3.2. Case 2: Symmetrical Short-Circuit Faults with 0.1 Ω Fault Resistance Occur at f1
On the basis of Case 1, the fault types at point f1 are changed to three-phase faults with 0.1Ω fault resistance. Distortion rates of A-phase CHCs on both sides of feeder B1B2 after the fault are shown in Figure 15.
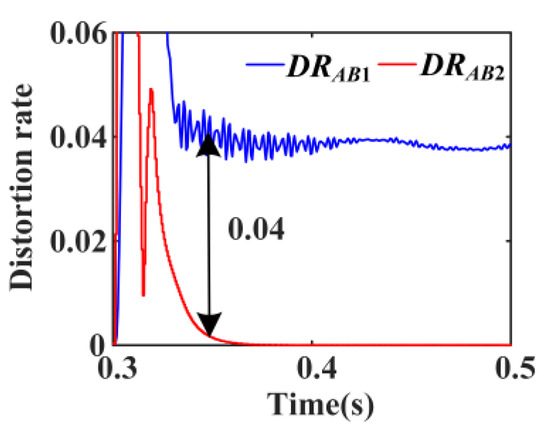
Figure 15.
Distortion rates of the A-phase CHCs under the three-phase fault with 0.1 Ω.
In Figure 15, DRAB1 and DRAB2 represent the distortion rates of A-phase CHCs on the GRID and IBDG sides, respectively. The action threshold of the A-phase CHC differential protection criterion is set to 2%. From Figure 15, when a three-phase fault occurs at f1, the distortion rate difference value of A-phase CHCs on both sides of feeder B1B2 is about 0.04 after stabilization, which is greater than the action threshold. The above simulation results are consistent with the theoretical analysis in Section 5, and IHCDP can reliably trip under symmetrical short-circuit faults.
6.3.3. Case 3: Asymmetrical Short-Circuit Faults with 20 Ω Fault Resistance Occur at f1
On the basis of Case 1, the fault resistance at point f1 is changed to 20 Ω. Distortion rates of NSCCHCs on both sides of feeder B1B2 after faults are shown in Figure 16.
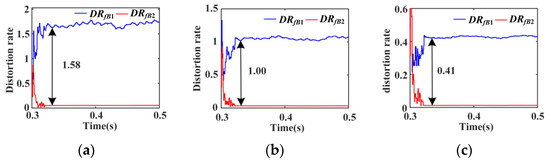
Figure 16.
Distortion rate records of asymmetric faults with 20 Ω fault resistance. (a) A–G fault, (b) AB–G fault, and (c) A–B fault.
From Figure 16, when the A–G, AB–G, and A–B faults occur at f1, the distortion rate difference values of NSCCHCs on both sides of feeder B1B2 are about 1.58, 1.00, and 0.45 after one cycle. The distortion rate difference values under high-resistance asymmetric faults are much larger than the action threshold. Due to the large fault resistance leading to a small NSCFFC, the distortion rate of NSCCHC on the IBDG side is larger. In conclusion, the IHCDP, under various asymmetric faults with high fault resistance, can reliably trip with high sensitivity.
6.3.4. Case 4: Symmetrical Short-Circuit Faults with 20 Ω Fault Resistance Occur at f1
On the basis of Case 2, the fault resistance at point f1 is changed to 20 Ω. The distortion rates of A-phase CHCs on both sides of feeder B1B2 after the fault are shown in Figure 17.
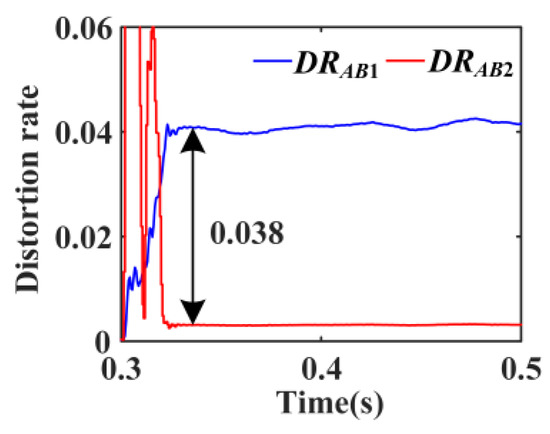
Figure 17.
Distortion rates of the A-phase CHCs under the three-phase fault with 20 Ω fault resistance.
From Figure 17, the difference value of the A-phase CHC distortion rates on both sides is about 3.8% after stabilization, slightly lower than 4%. This is due to the large fault resistance at the fault point, which makes most CHCs flow to the fault point f1 and another small part to the GRID downstream of the fault point. The IHCDP can trip reliably under symmetrical faults with high fault resistance.
Taking feeder B2B3 as the protected section, different types (A–G, AB–G, A–B, and ABC) of faults with different fault resistances (0.1 Ω, 20 Ω, and 50 Ω) are set at point f2 and the simulation results are shown in Table 2. It can be seen from Table 2 that the proposed protection scheme can sensitively and reliably trip under different fault conditions and has a strong ability to withstand fault resistance.
Table 2.
Simulation results of faults with high fault resistance occur at f2.
7. Conclusions
Based on the idea of control-protection synergy, this paper investigates the CHC injection protection scheme for the distribution network with IBDGs. The contribution of this paper can be summarized as follows:
- (1)
- The CHC injection-control strategy of IBDG based on the d-axis and q-axis is proposed. Injection starting criteria are established based on the mutation of phase current and voltage.
- (2)
- The fault characteristics of CHCs after injection are analyzed. For asymmetrical short-circuit faults, a differential protection criterion based on the distortion rate of NSCCHCs is proposed; for symmetrical short-circuit faults, the proposed differential protection criterion utilizes the distortion rate of A-phase CHCs.
Theoretical analysis and simulation experiments show that the proposed CHC injection system can accurately and reliably operate under normal operation or fault conditions; the proposed IHCDP can sensitively and reliably trip under symmetrical or asymmetrical faults and has a solid ability to withstand high transition resistance.
Author Contributions
Conceptualization, C.Y. and Z.G.; data curation, C.Y. and Z.L.; formal analysis, C.Y., Z.G. and Z.T.; funding acquisition, Z.G.; methodology, C.Y., Z.G. and Z.L.; project administration, Z.G.; software, C.Y.; validation, C.Y. and Z.G.; visualization, C.Y. and Z.T.; writing original draft, C.Y.; writing review and editing, C.Y., Z.G. and Z.L. All authors have read and agreed to the published version of the manuscript.
Funding
This work was supported in part by the Science and Technology Project of State Grid Corporation of China (52060019001H).
Institutional Review Board Statement
Not applicable.
Informed Consent Statement
Not applicable.
Data Availability Statement
The data presented in this study are available in the article.
Conflicts of Interest
The authors declare no conflict of interest. The funders had no role in the design of the study; in the collection, analyses, or interpretation of data; in the writing of the manuscript or in the decision to publish the results.
References
- Barani, M.; Aghaei, J.; Akbari, M.A.; Niknam, T.; Farahmand, H.; Korpas, M. Optimal Partitioning of Smart Distribution Systems into Supply–Sufficient Microgrids. IEEE Trans. Smart Grid 2019, 10, 2523–2533. [Google Scholar] [CrossRef]
- Telukunta, V.; Pradhan, J.; Agrawal, A.; Singh, M.; Srivani, S.G. Protection Challenges Under Bulk Penetration of Renewable Energy Resources in Power Systems: A Review. CSEE J. Power Energy Syst. 2017, 3, 365–379. [Google Scholar] [CrossRef]
- Jamali, S.; Borhani–Bahabadi, H. Protection Method for Radial Distribution Systems with DG Using Local Voltage Measurements. IEEE Trans. Power Del. 2019, 34, 651–660. [Google Scholar] [CrossRef]
- Zhang, F.; Mu, L.; Wang, Z.; Zhou, H.; Zhang, X. Optimal Fault Control Strategy of Master–slave Controlled Islanding Microgrid. Proc. CSEE 2020, 40, 1241–1248. [Google Scholar]
- Eskandari, M.; Savkin, A.V. On the Impact of Fault Ride–Through on Transient Stability of Autonomous Microgrids: Nonlinear Analysis and Solution. IEEE Trans. Smart Grid 2021, 12, 999–1010. [Google Scholar] [CrossRef]
- Coffele, F.; Booth, C.; Dysko, A. An Adaptive Overcurrent Protection Scheme for Distribution Networks. IEEE Trans. Power Del. 2015, 30, 561–568. [Google Scholar] [CrossRef]
- Kumar, D.S.; Srinivasan, D.; Reindl, T. A Fast and Scalable Protection Scheme for Distribution Networks with Distributed Generation. IEEE Trans. Power Del. 2016, 31, 67–75. [Google Scholar] [CrossRef]
- Shen, S.; Lin, D.; Wang, H.; Hu, P.; Jiang, K.; Lin, D.; He, B. An Adaptive Protection Scheme for Distribution Systems with DGs Based on Optimized Thevenin Equivalent Parameters Estimation. IEEE Trans. Power Del. 2017, 32, 411–419. [Google Scholar] [CrossRef]
- Darabi, A.; Bagheri, M.; Gharehpetian, G.B. Highly reliable overcurrent protection scheme for highly meshed power systems. Int. J. Electr. Power Energy Syst. 2020, 119, 105874. [Google Scholar] [CrossRef]
- Ma, J.; Liu, J.; Yang, G.; Phadke, A.G. Research on regional centralized protection scheme for distribution network integrated with electric vehicles. Int. J. Electr. Power Energy Syst. 2020, 119, 105903. [Google Scholar] [CrossRef]
- Ghotbi–Maleki, M.; Chabanloo, R.M.; Zeineldin, H.H.; Miangafsheh, S.M.H. Design of Setting Group–Based Overcurrent Protection Scheme for Active Distribution Networks Using MILP. IEEE Trans. Smart Grid 2021, 12, 1185–1193. [Google Scholar] [CrossRef]
- Mirshekali, H.; Dashti, R.; Keshavarz, A.; Torabi, A.J.; Shaker, H.R. A Novel Fault Location Methodology for Smart Distribution Networks. IEEE Trans. Smart Grid 2021, 12, 1277–1288. [Google Scholar] [CrossRef]
- Jamali, S.; Borhani–Bahabadi, H. Non–communication protection method for meshed and radial distribution networks with synchronous–based DG. Int. J. Electr. Power Energy Syst. 2017, 93, 468–478. [Google Scholar] [CrossRef]
- Jia, K.; Bi, T.; Ren, Z.; Thomas, D.W.P.; Sumner, M. High Frequency Impedance Based Fault Location in Distribution System with DGs. IEEE Trans. Smart Grid 2018, 9, 807–816. [Google Scholar] [CrossRef]
- Chen, G.; Liu, Y.; Yang, Q. Impedance Differential Protection for Active Distribution Network. IEEE Trans. Power Del. 2020, 35, 25–36. [Google Scholar] [CrossRef]
- Sharma, N.K.; Samantaray, S.R. PMU Assisted Integrated Impedance Angle–Based Microgrid Protection Scheme. IEEE Trans. Power Del. 2020, 35, 183–193. [Google Scholar] [CrossRef]
- Gao, H.; Li, J.; Xu, B. Principle and Implementation of Current Differential Protection in Distribution Networks with High Penetration of DGs. IEEE Trans. Power Del. 2017, 32, 565–574. [Google Scholar] [CrossRef]
- Zhou, C.; Zou, G.; Du, X.; Zang, L. Adaptive current differential protection for active distribution network considering time synchronization error. Int. J. Electr. Power Energy Syst. 2022, 140, 108085. [Google Scholar] [CrossRef]
- Laaksonen, H.J. Protection Principles for Future Microgrids. IEEE Trans. Power Electron. 2010, 25, 2910–2918. [Google Scholar] [CrossRef]
- Azzouz, M.A.; Hooshyar, A. Dual Current Control of Inverter–Interfaced Renewable Energy Sources for Precise Phase Selection. IEEE Trans. Smart Grid 2019, 10, 5092–5102. [Google Scholar] [CrossRef]
- Song, G.; Wang, T.; Zhang, B.; Dong, X.; Kang, X. Analysis and Prospect of Detective Fault Identification Technologies Using Power Electronic Device. Autom. Electr. Power Syst. 2020, 44, 173–188. [Google Scholar]
- Soleimanisardoo, A.; Karegar, H.K.; Zeineldin, H.H. Differential Frequency Protection Scheme Based on Off–Nominal Frequency Injections for Inverter–Based Islanded Microgrids. IEEE Trans. Smart Grid 2019, 10, 2107–2114. [Google Scholar] [CrossRef]
- El–Sayed, W.T.; Azzouz, M.A.; Zeineldin, H.H.; El–Saadany, E.F. A Harmonic Time–Current–Voltage Directional Relay for Optimal Protection Coordination of Inverter–Based Islanded Microgrids. IEEE Trans. Smart Grid 2021, 12, 1904–1917. [Google Scholar] [CrossRef]
- Guo, W.; Mu, L.; Zhang, X. Fault Models of Inverter-Interfaced Distributed Generators within a Low-Voltage Microgrid. IEEE Trans. Power Del. 2017, 32, 453–461. [Google Scholar] [CrossRef]
- Blaabjerg, F.; Teodorescu, R.; Liserre, M.; Timbus, A.V. Overview of control and grid synchronization for distributed power generation systems. IEEE Trans. Power Electron. 2006, 53, 1398–1409. [Google Scholar] [CrossRef]
- Kong, X.; Zhang, Z.; Yin, X.; Wang, F.; He, M. Study on Fault Current Characteristics and Fault Analysis Method of Power Grid with Inverter Interfaced Distributed Generation. Proc. CSEE 2013, 33, 65–74. [Google Scholar]
- Zhang, F.; Mu, L. A Fault Detection Method of Microgrids with Grid–Connected Inverter Interfaced Distributed Generators Based on the PQ Control Strategy. IEEE Trans. Smart Grid 2019, 10, 4816–4826. [Google Scholar] [CrossRef]
- Bae, Y.; Trung–Kien, V.; Kim, R. –Y. Implemental Control Strategy for Grid Stabilization of Grid–Connected PV System Based on German Grid Code in Symmetrical Low–to–Medium Voltage Network. IEEE Trans. Energy Convers. 2013, 28, 619–631. [Google Scholar] [CrossRef]
- China National Standard GB/T 19964–2012; Technical Requirements for Connecting Photovoltaic Power Station to Power System. Standardization Administration of China: Beijing, China, 2012.
- Zhao, F.; Meng, Z.; Li, Y.; Liu, C. Pilot Protection Scheme for Active Distribution Network Based on Fault Components. High Volt. Eng. 2019, 45, 3092–3100. [Google Scholar]
- Han, H.; Mu, L.; Zhang, F.; Guo, W. Microgrid Protection Considering Low Voltage Ride-through of IIDG. Proc. CSEE 2017, 37, 110–119. [Google Scholar]
- Han, B.; Li, H.; Wang, G.; Zeng, D.; Liang, Y. A Virtual Multi–Terminal Current Differential Protection Scheme for Distribution Networks with Inverter–Interfaced Distributed Generators. IEEE Trans. Smart Grid 2018, 9, 5418–5431. [Google Scholar] [CrossRef]
- China National Standard NB/T 32004–2018; Technical Specification of PV Grid–Connected Inverter. Standardization Administration of China: Beijing, China, 2018.
- Svensson, J.; Bongiorno, M.; Sannino, A. Practical implementation of delayed signal cancellation method for phase–sequence separation. IEEE Trans. Power Del. 2007, 22, 18–26. [Google Scholar] [CrossRef]
- China National Standard GB/T 156-2017; Standard Voltages. Standardization Administration of China: Beijing, China, 2017.
Disclaimer/Publisher’s Note: The statements, opinions and data contained in all publications are solely those of the individual author(s) and contributor(s) and not of MDPI and/or the editor(s). MDPI and/or the editor(s) disclaim responsibility for any injury to people or property resulting from any ideas, methods, instructions or products referred to in the content. |
© 2023 by the authors. Licensee MDPI, Basel, Switzerland. This article is an open access article distributed under the terms and conditions of the Creative Commons Attribution (CC BY) license (https://creativecommons.org/licenses/by/4.0/).