
A Quantitative Detection Method for Surface Cracks on Slab Track Based on Infrared Thermography

Abstract
1. Introduction
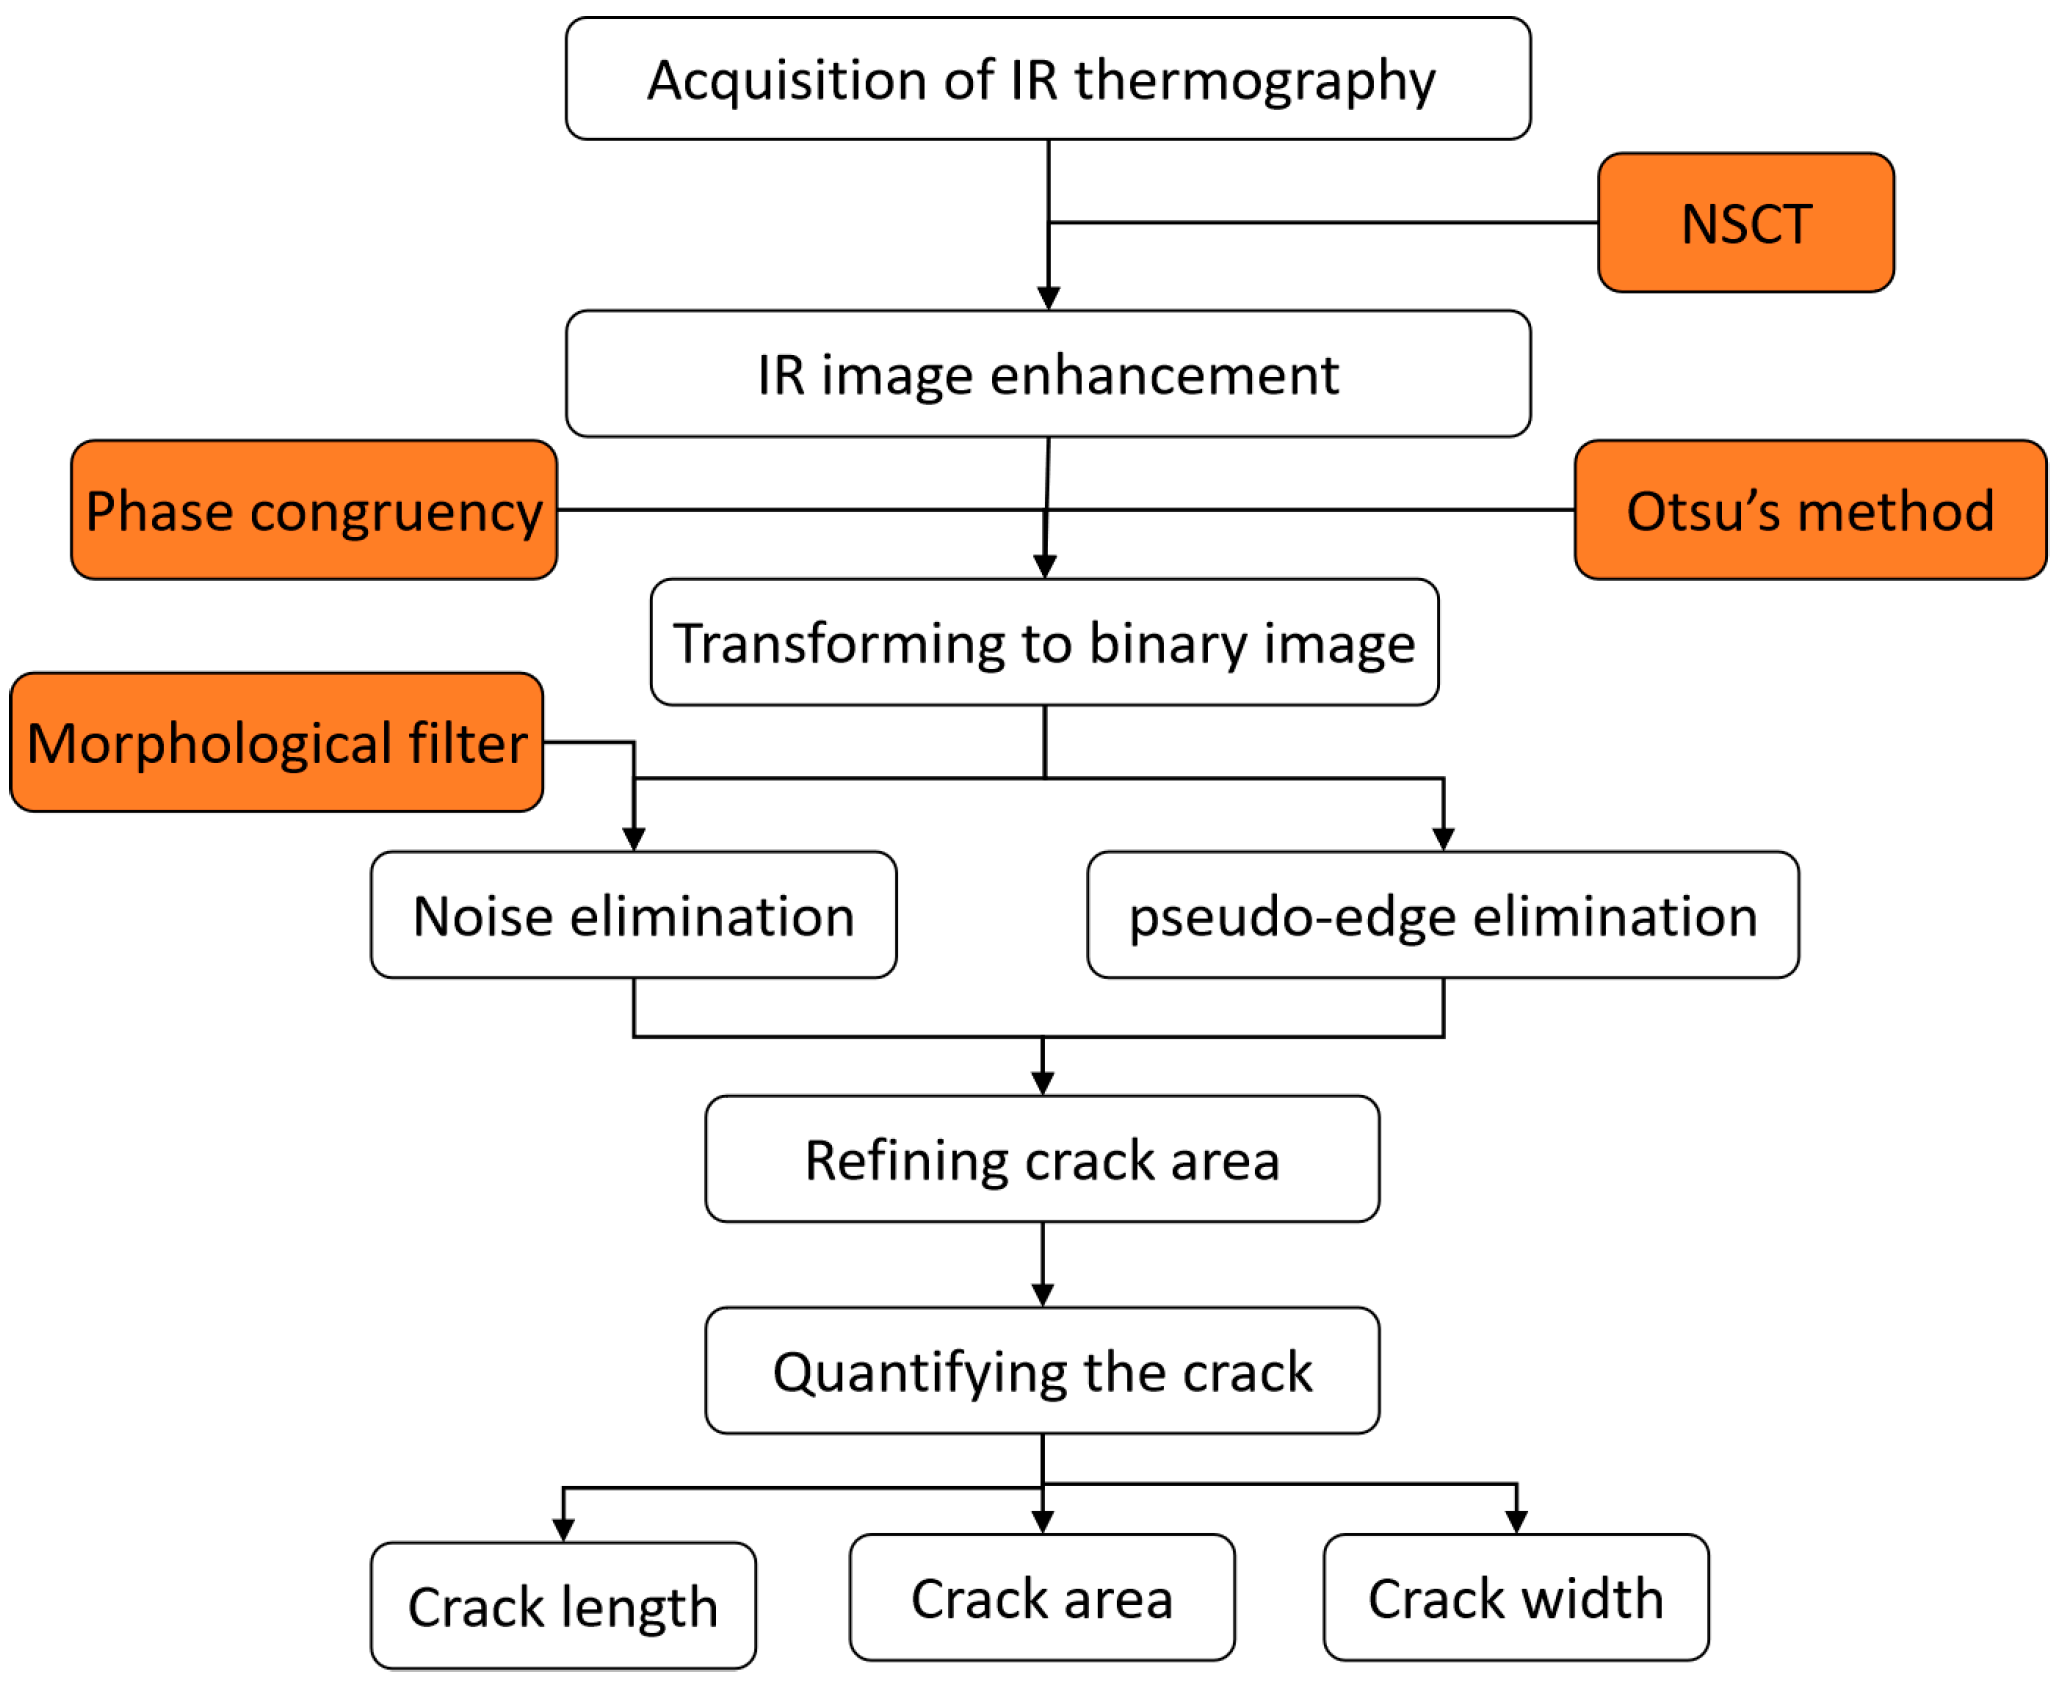
2. Infrared-Thermogram Processing
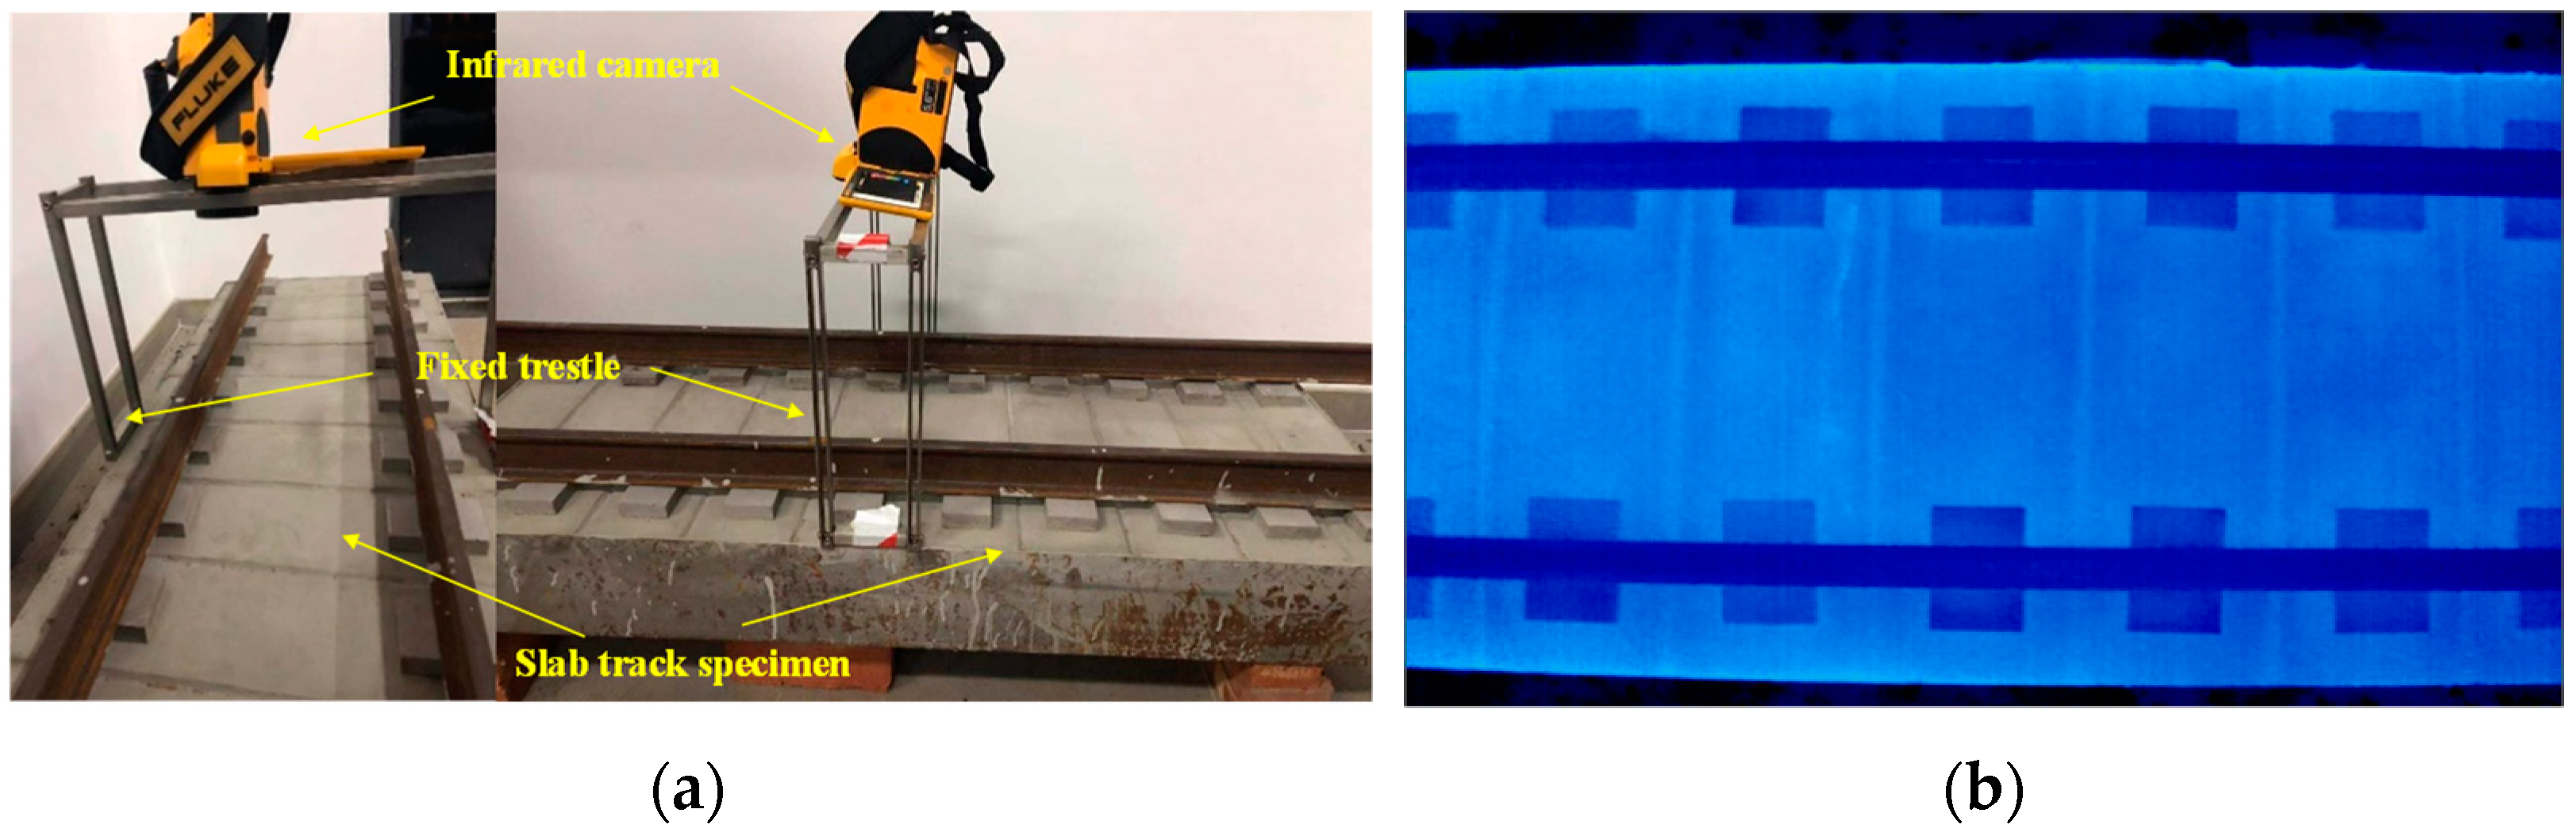
2.1. Acquisition of the Infrared Thermography
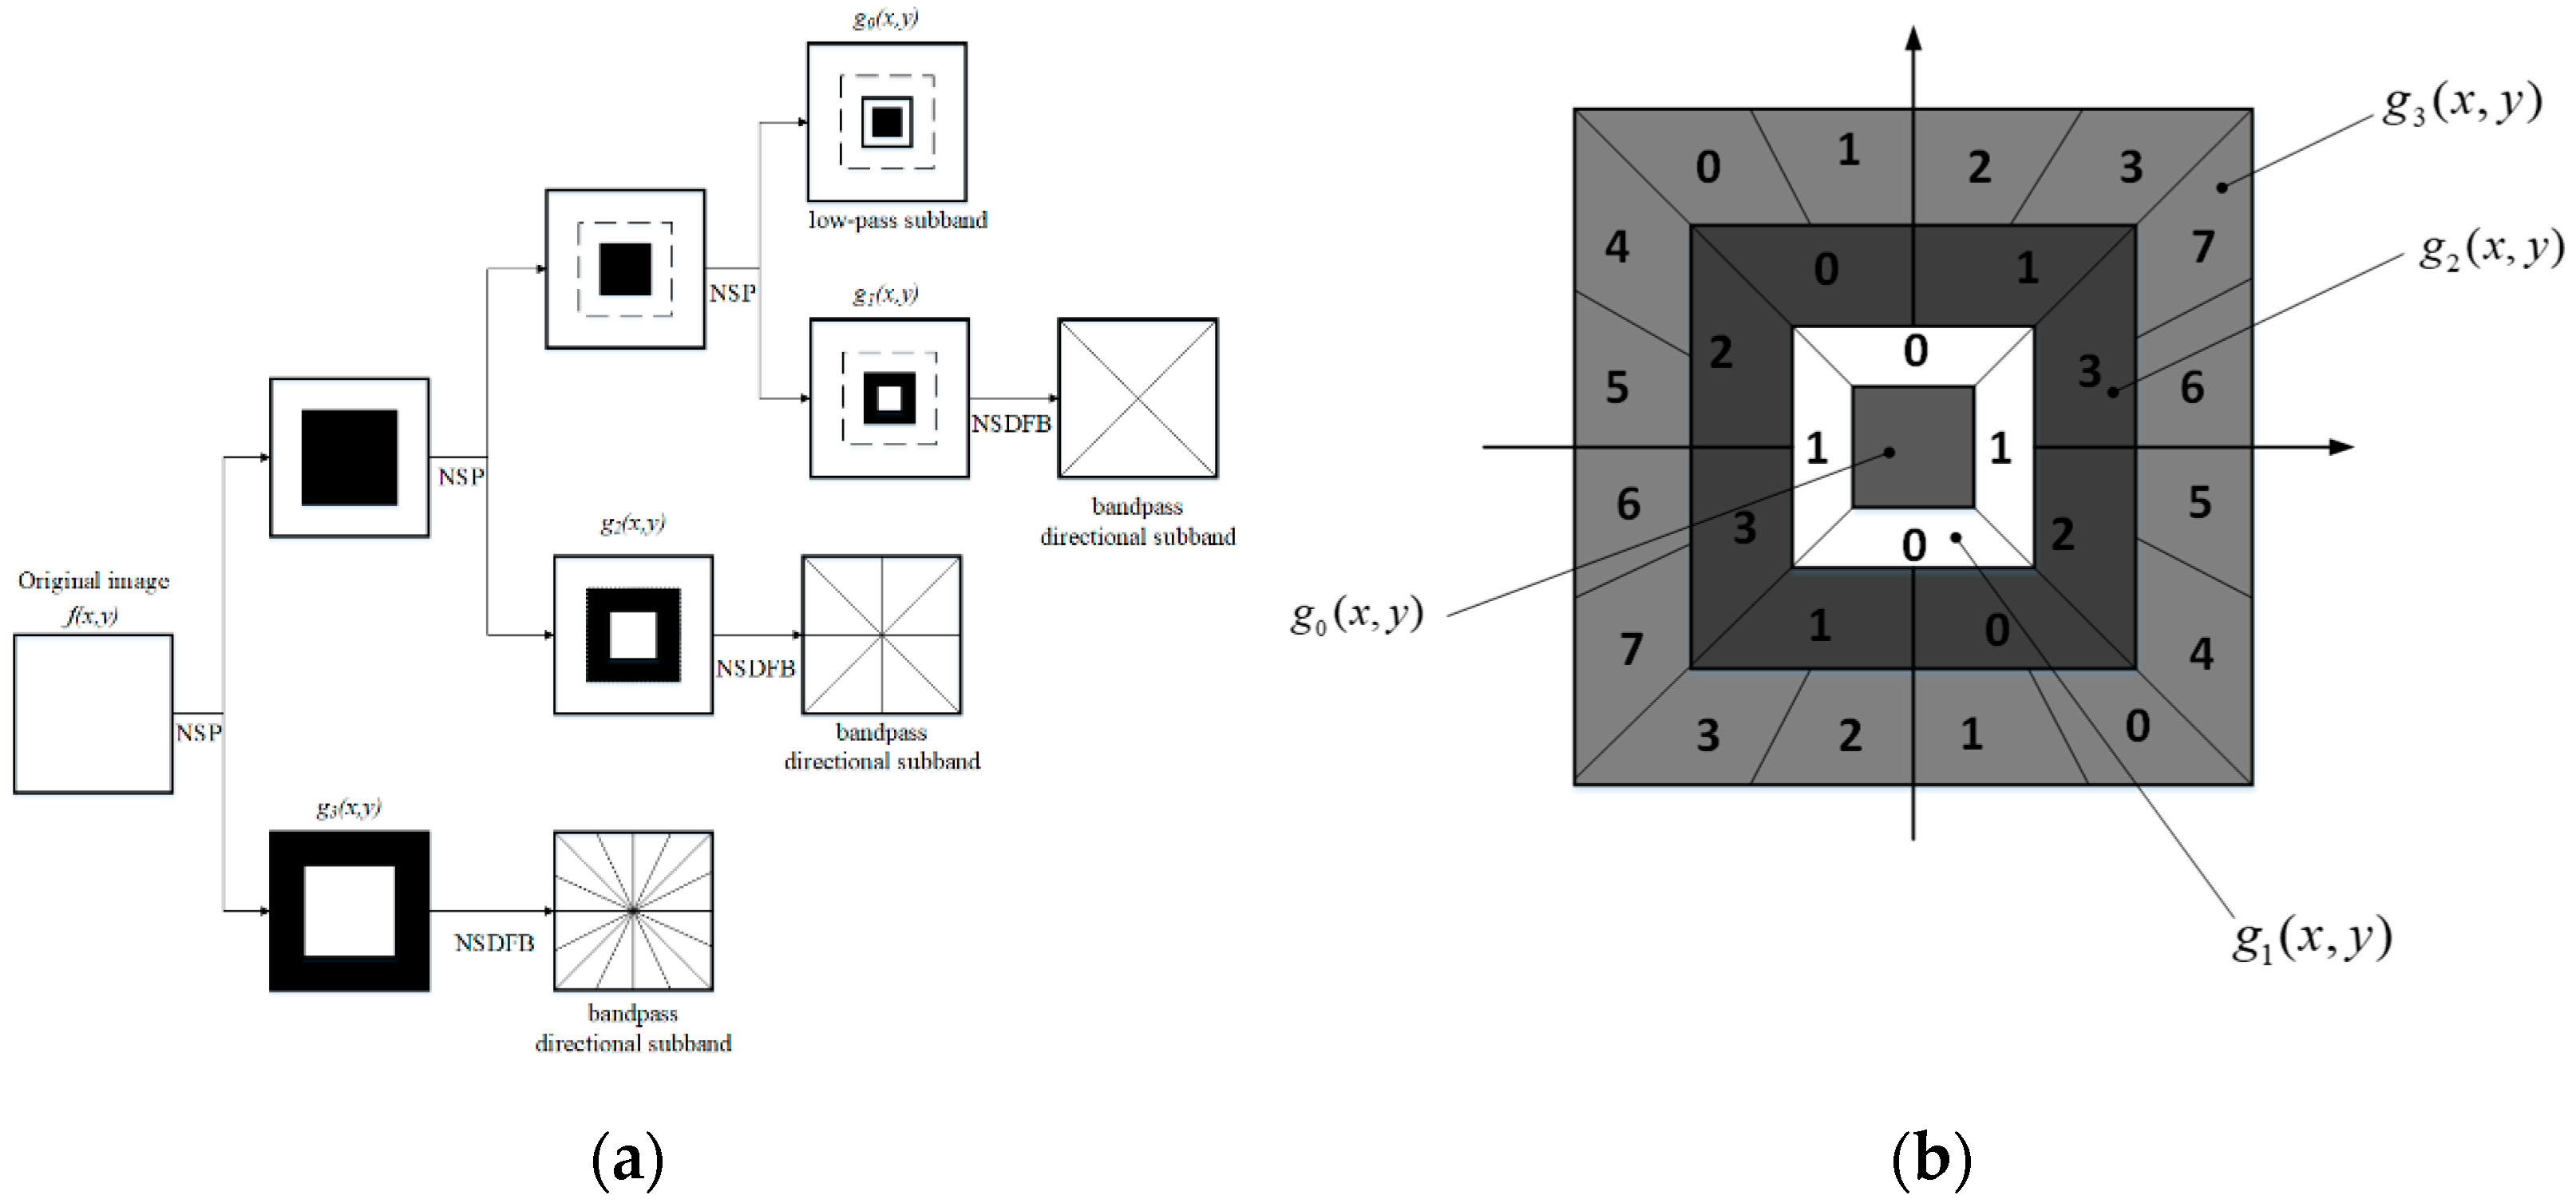
2.2. Non-Subsampled Contourlet Transform (NSCT)-Based Image-Enhancement Algorithm
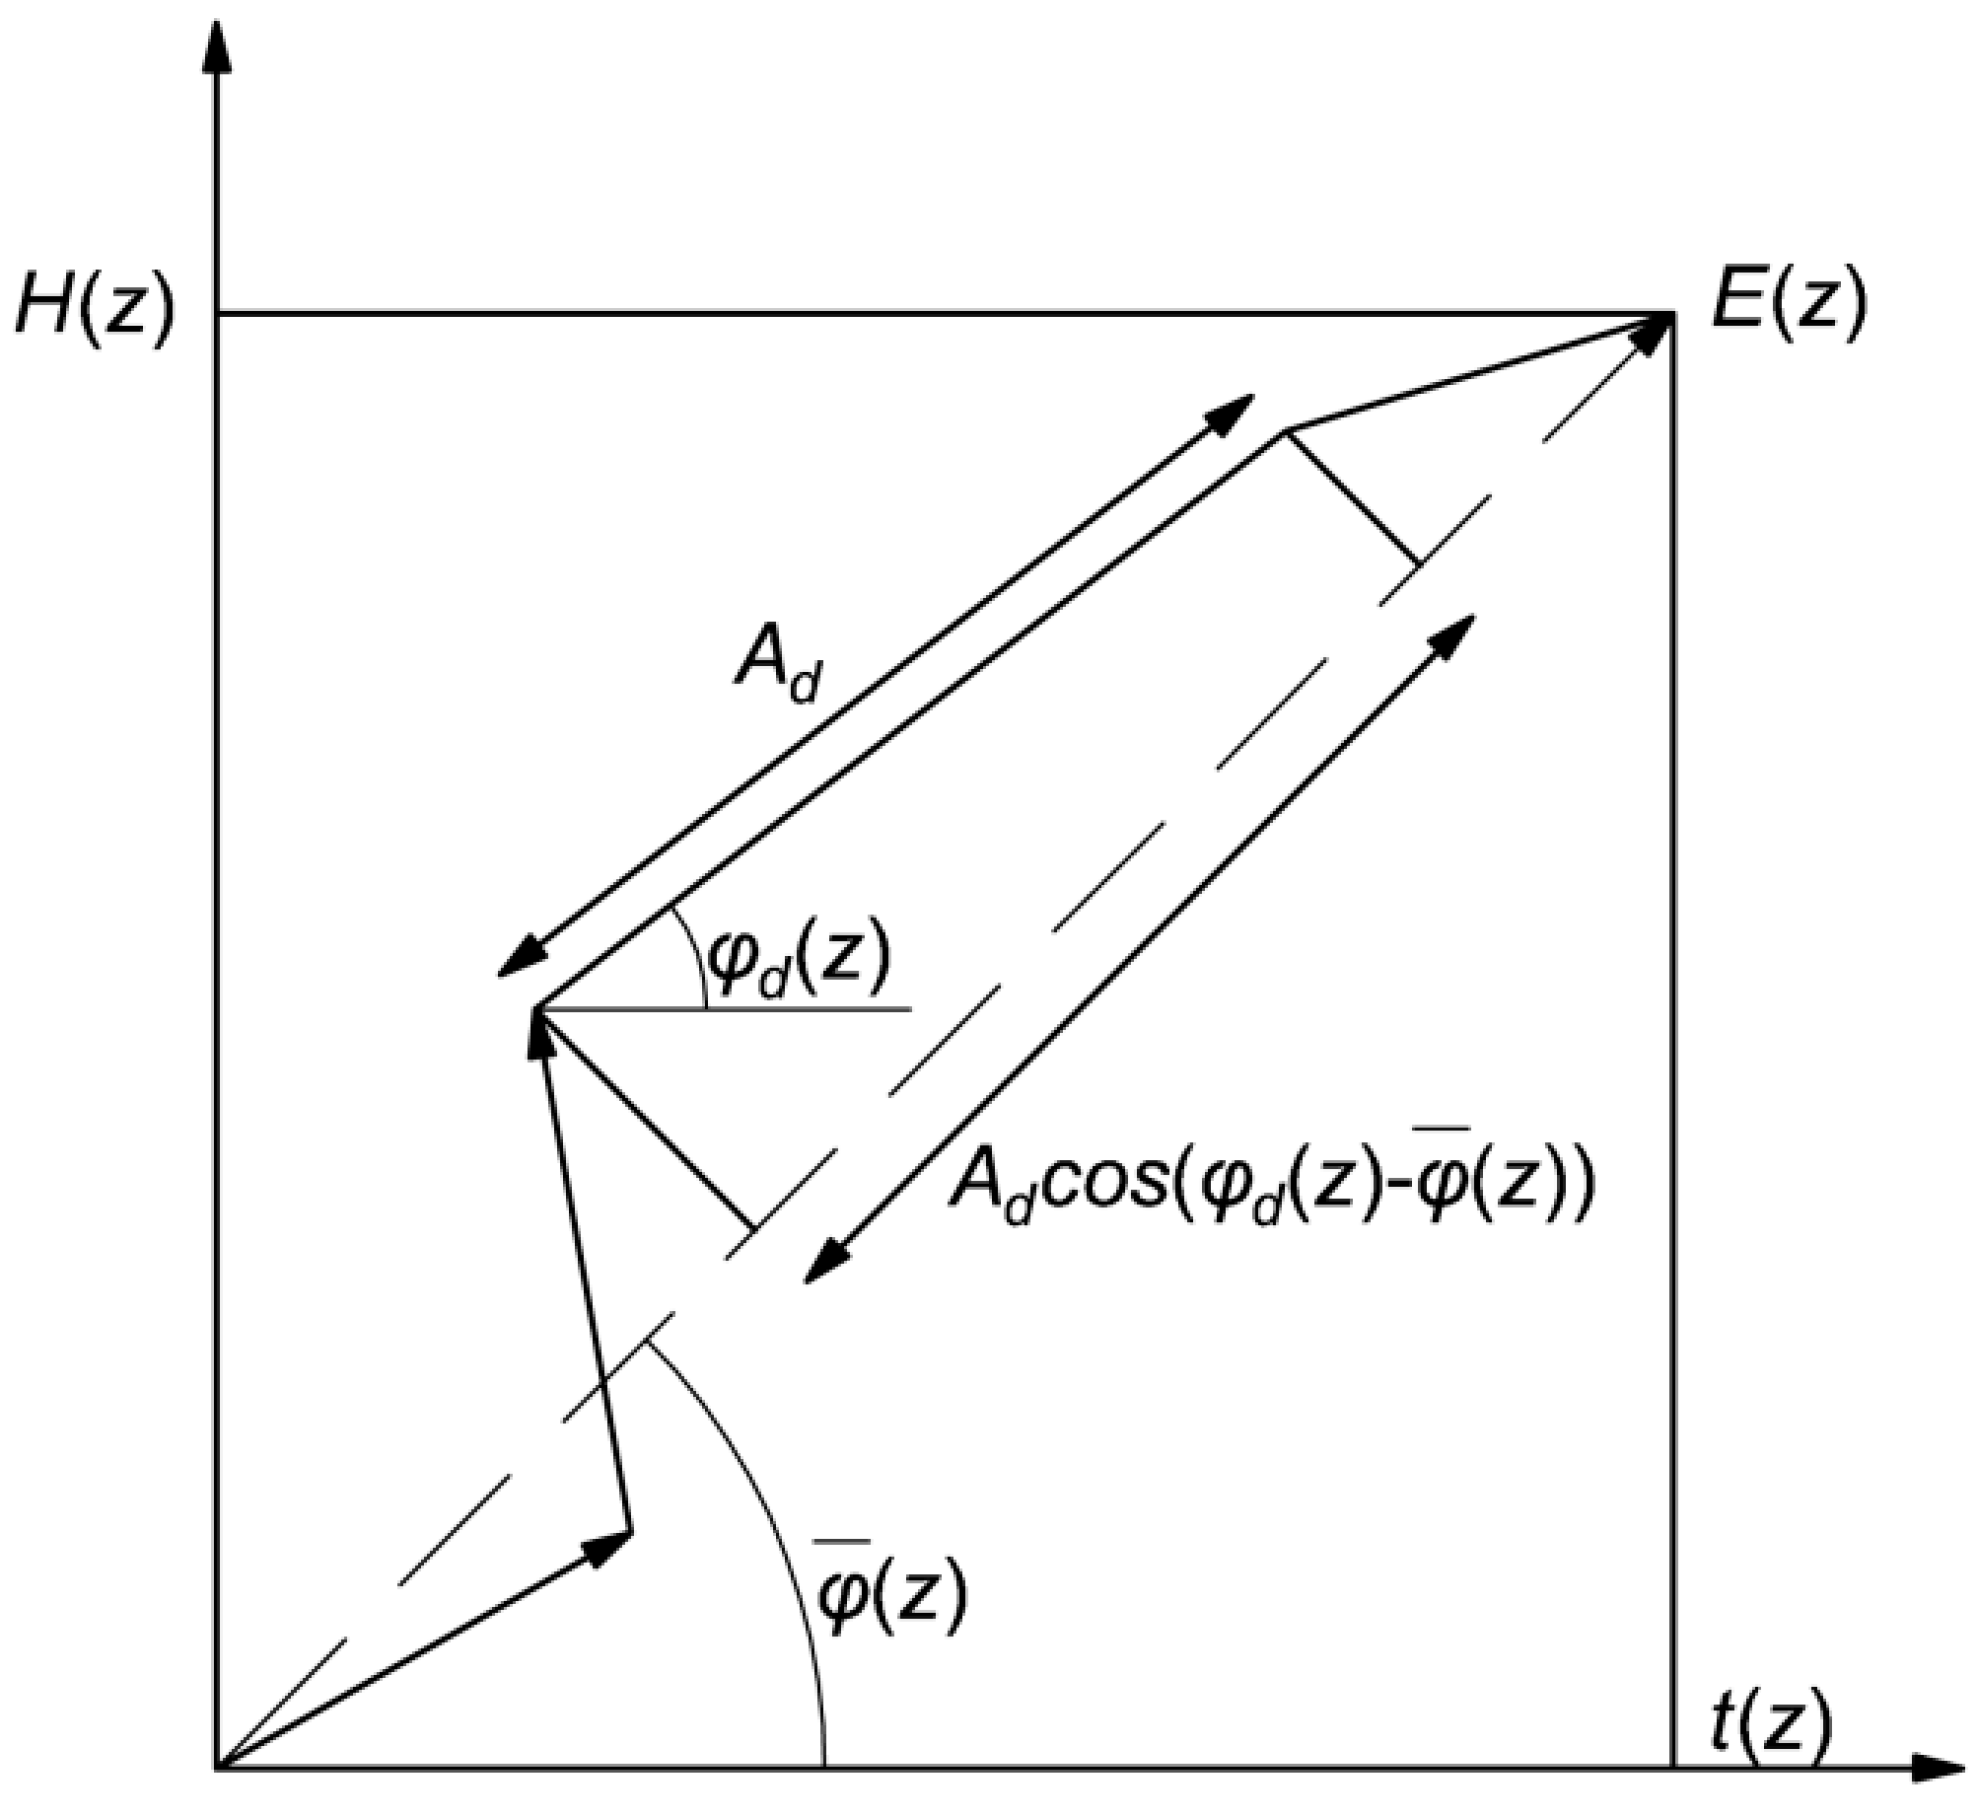
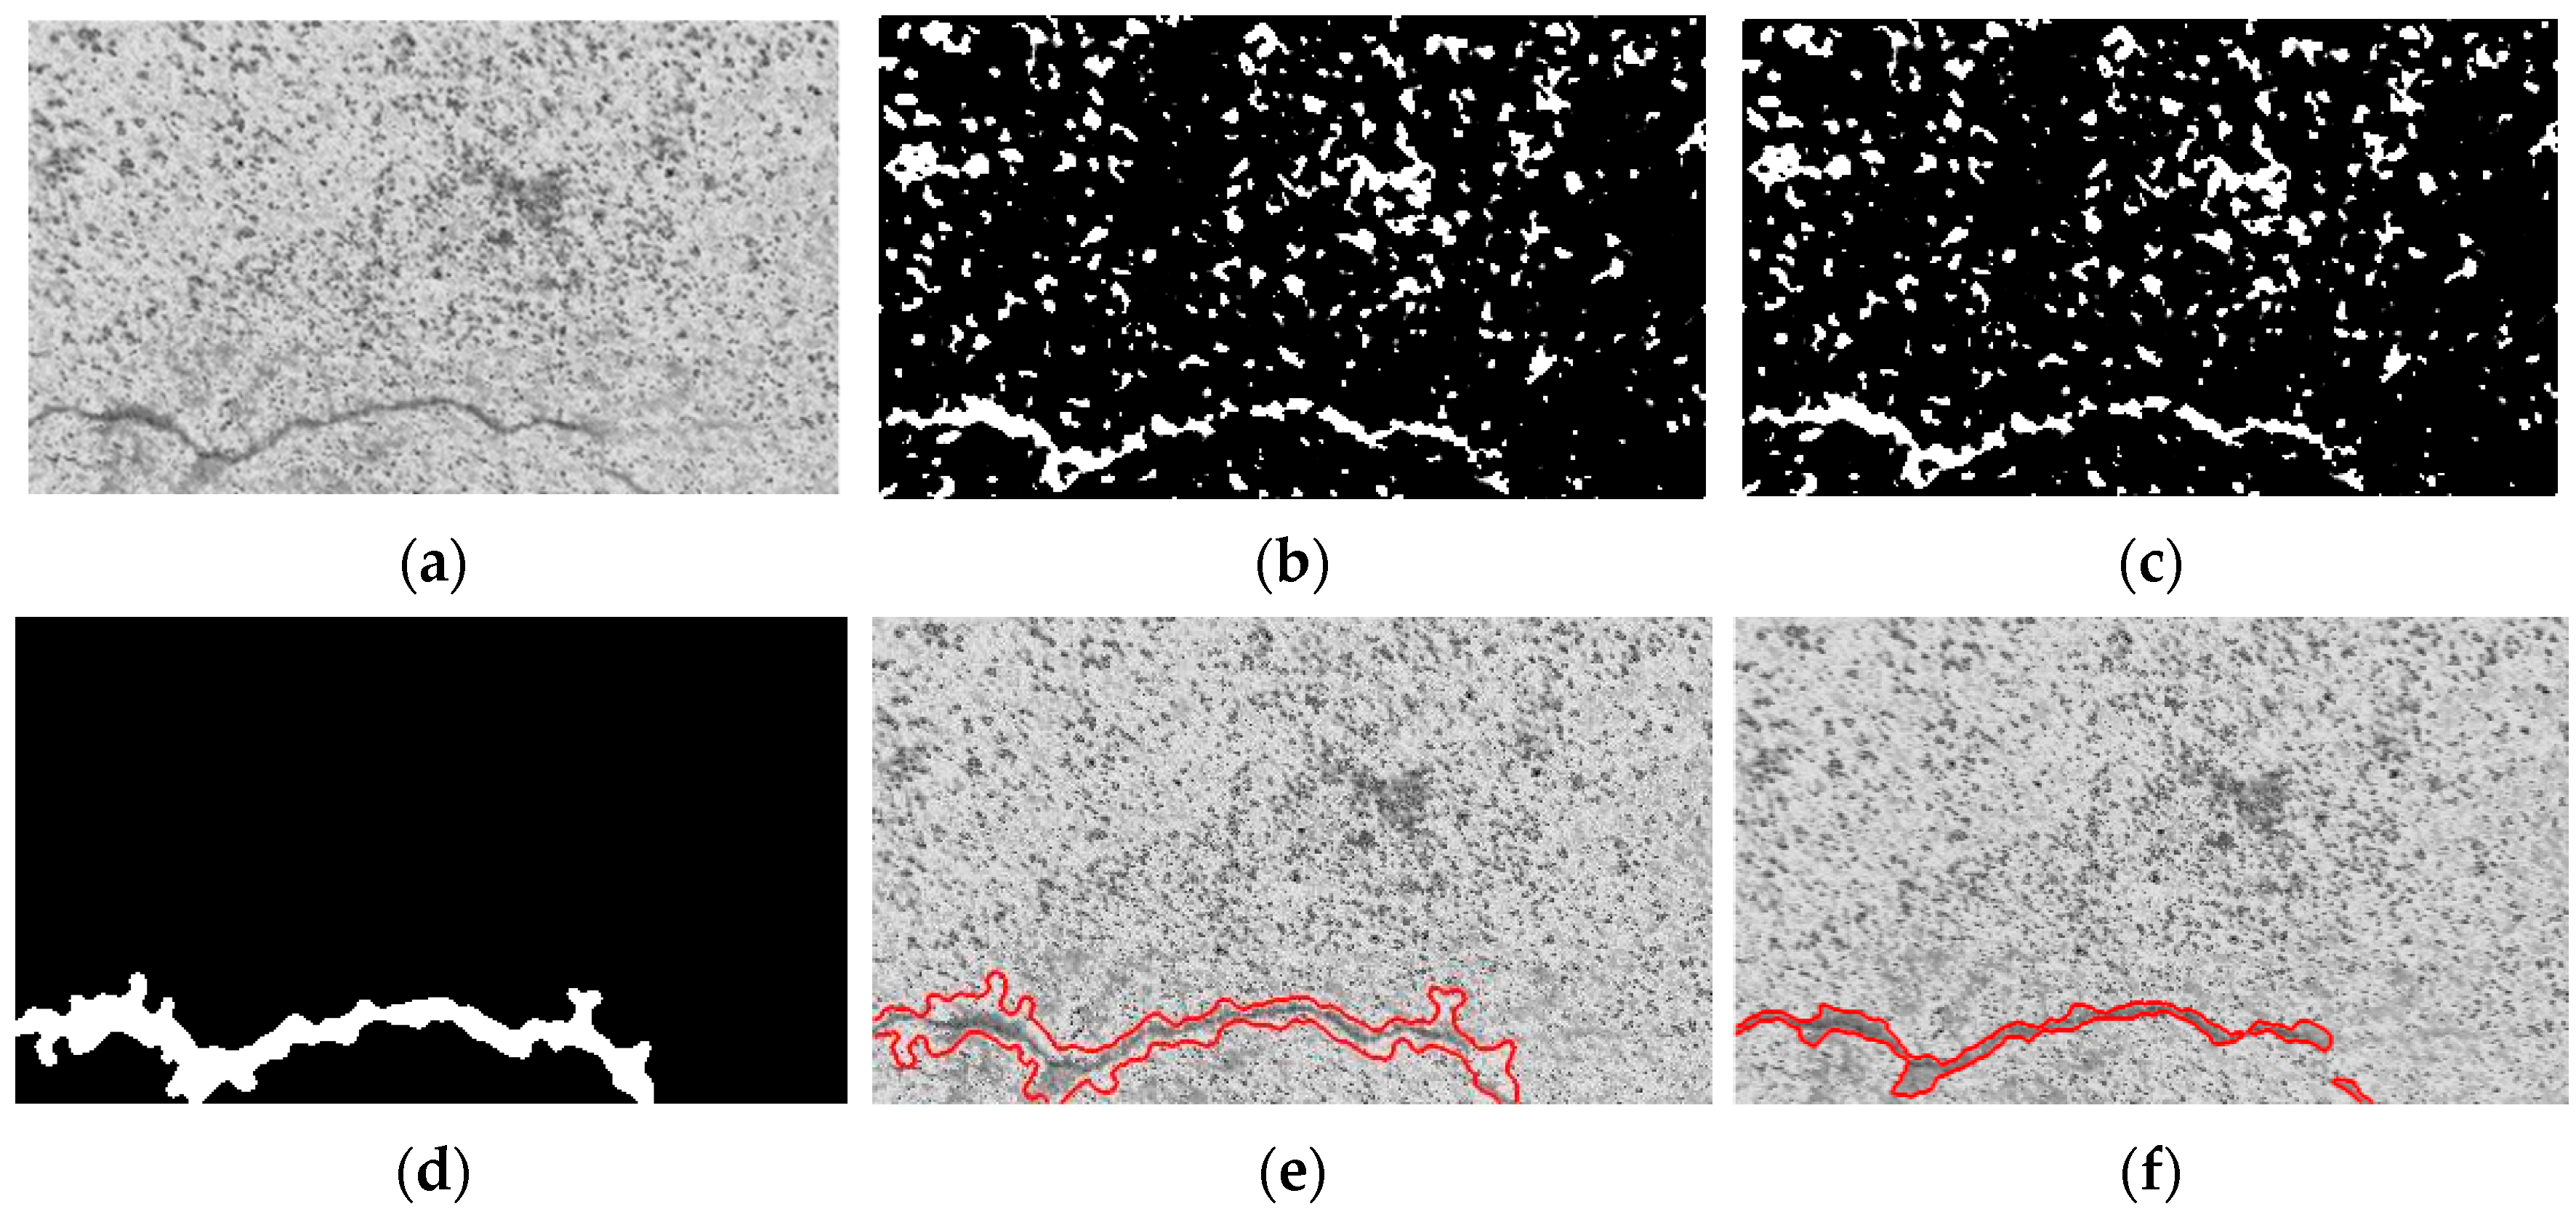
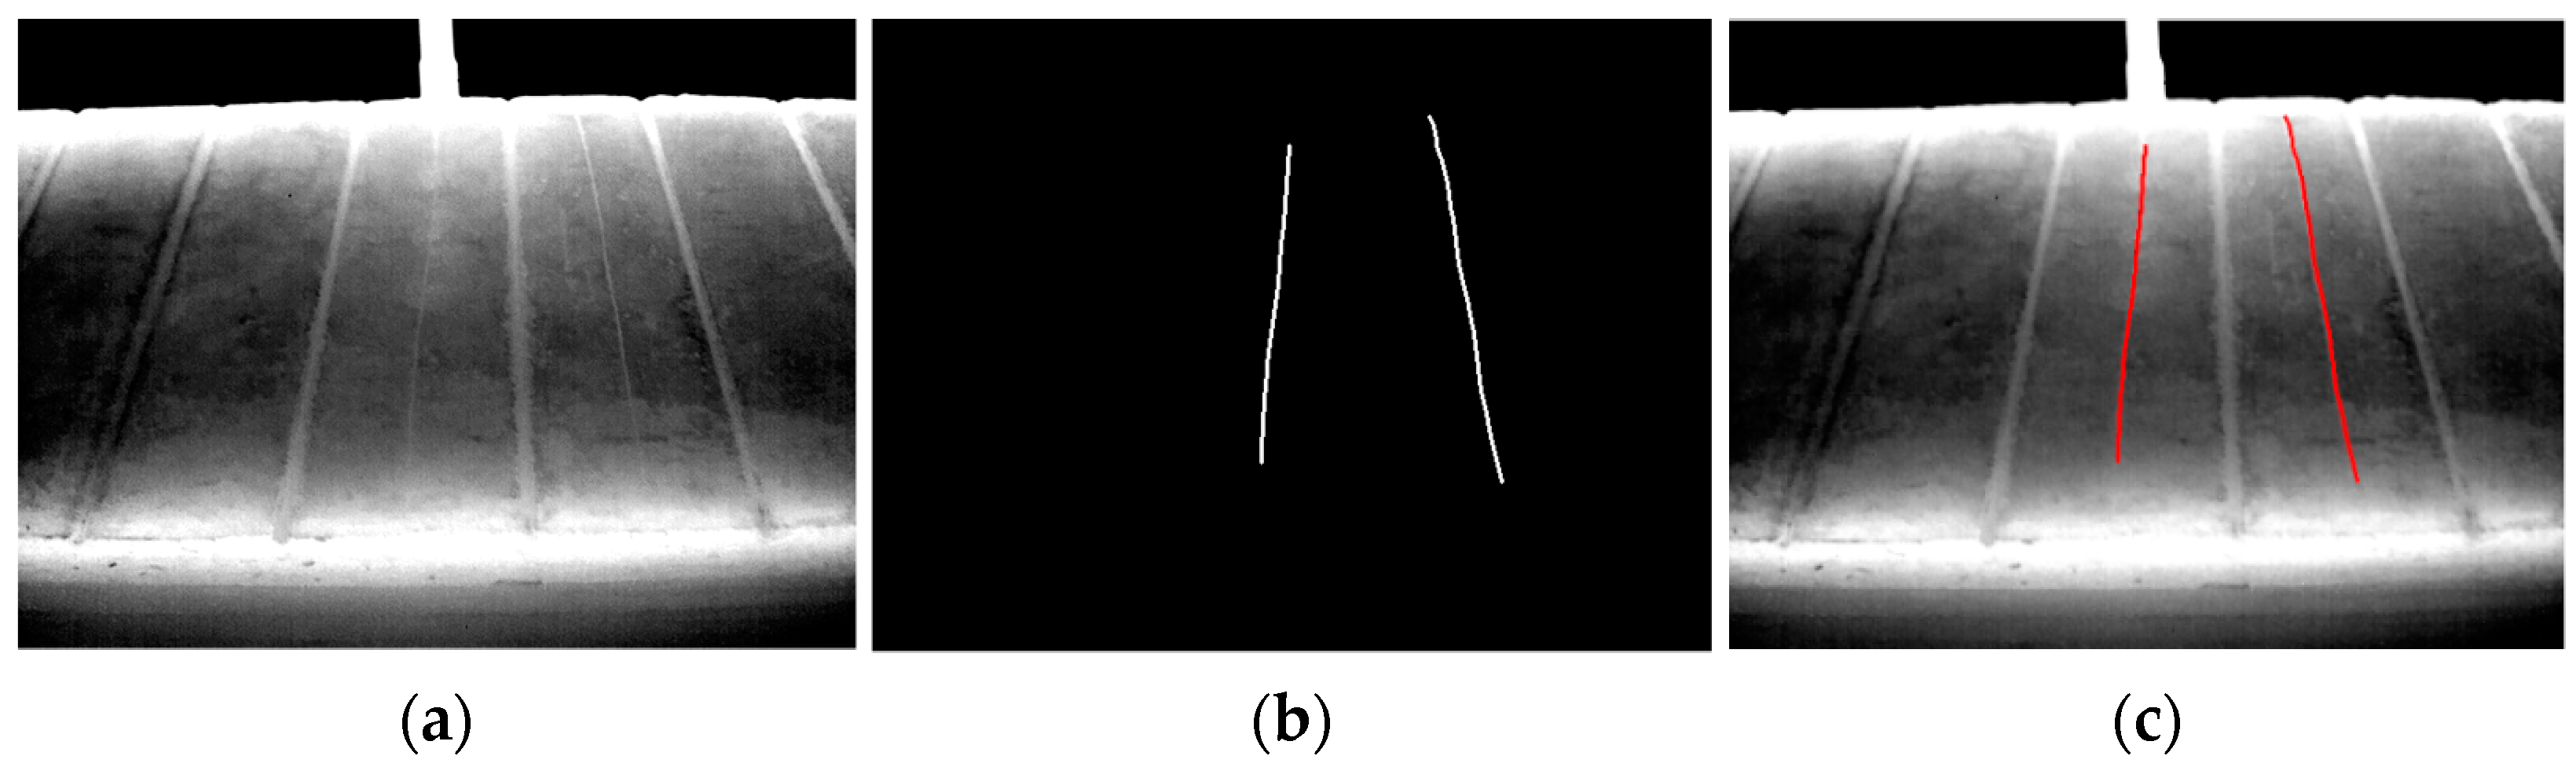
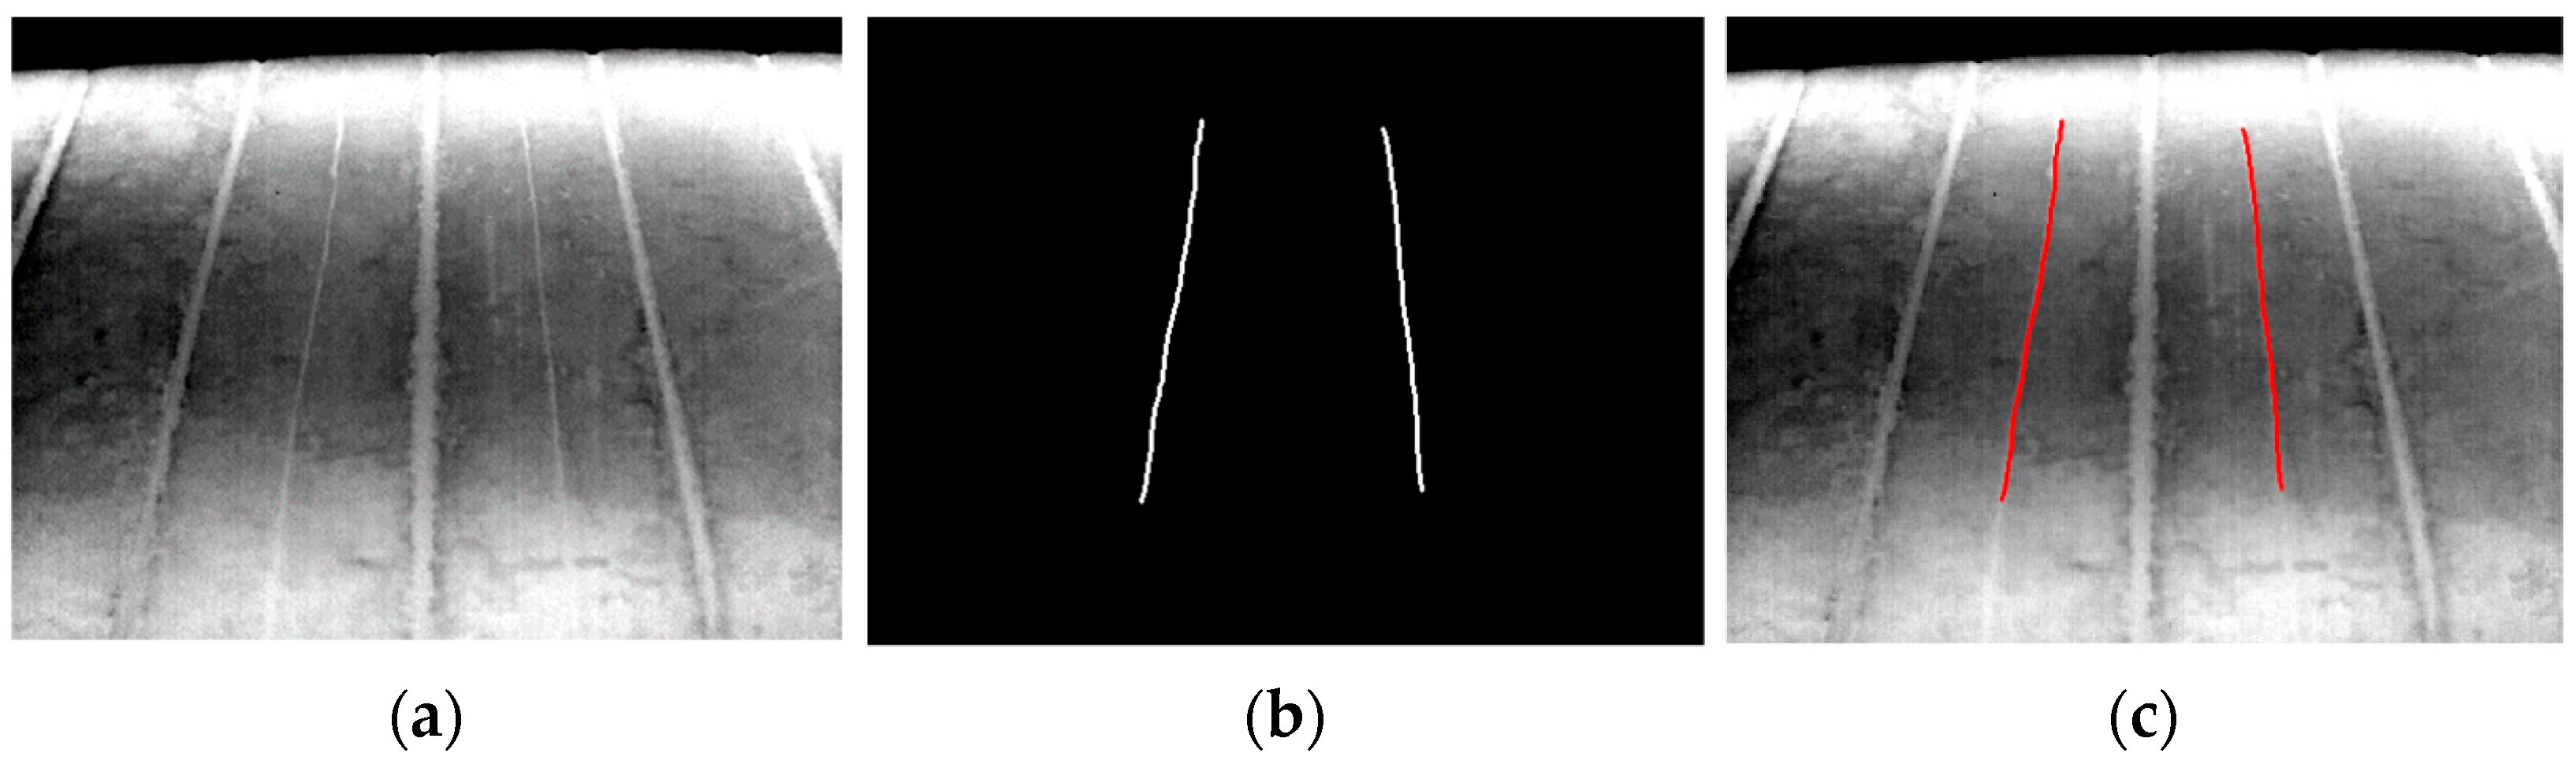
2.3. Edge Detection of Infrared Thermogram
3. Quantitative Detection Method of Crack Area
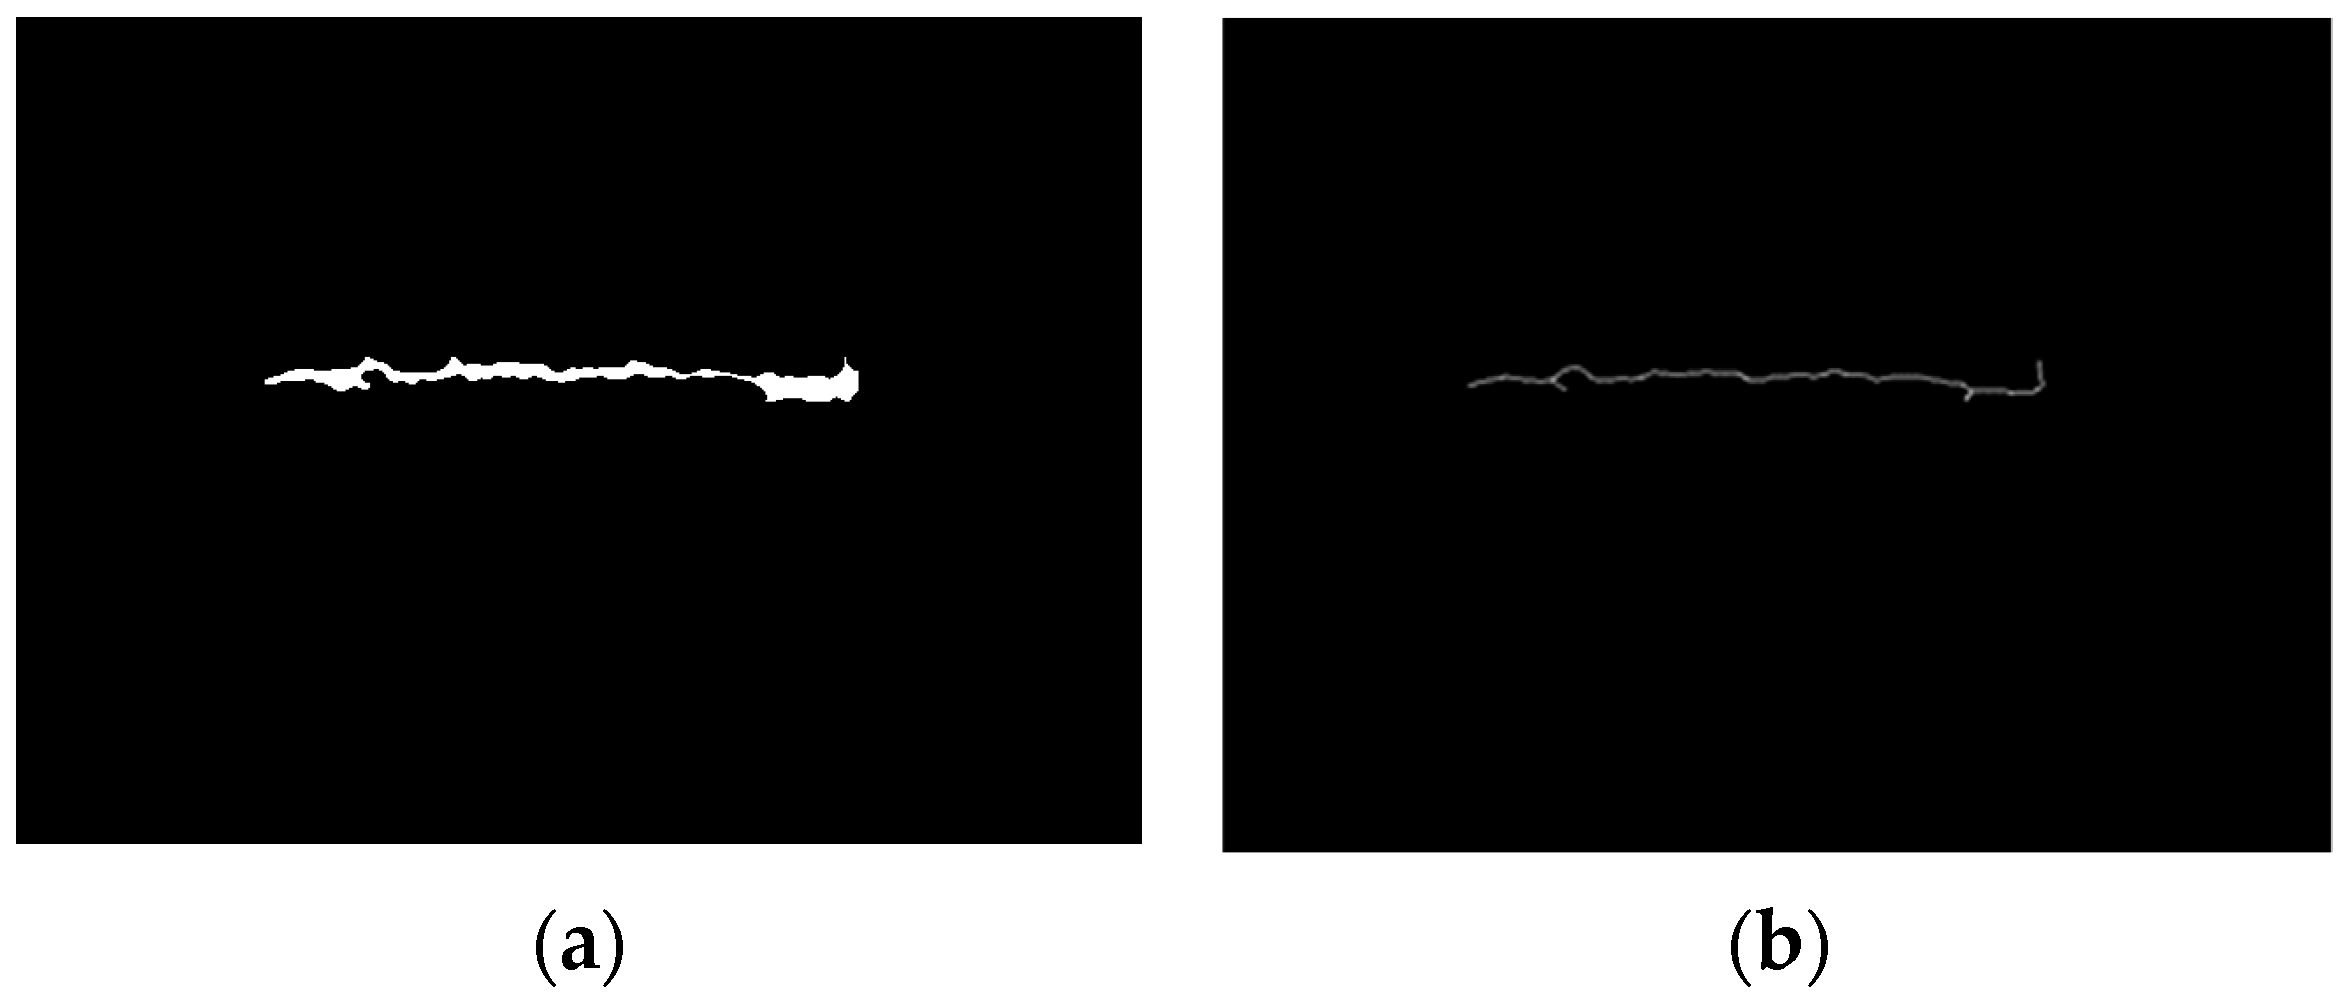
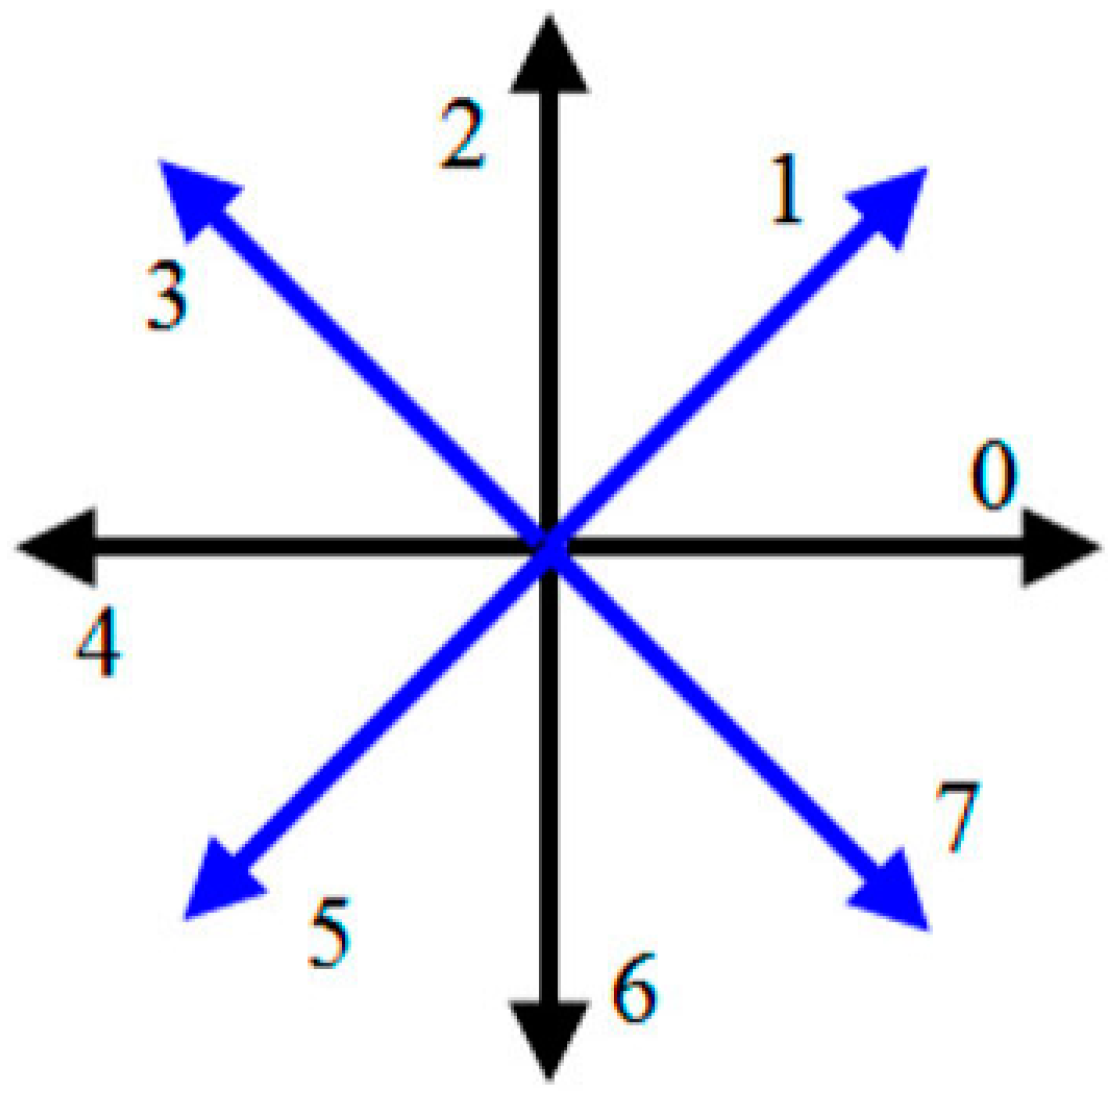
3.1. Pixel Length of the Crack
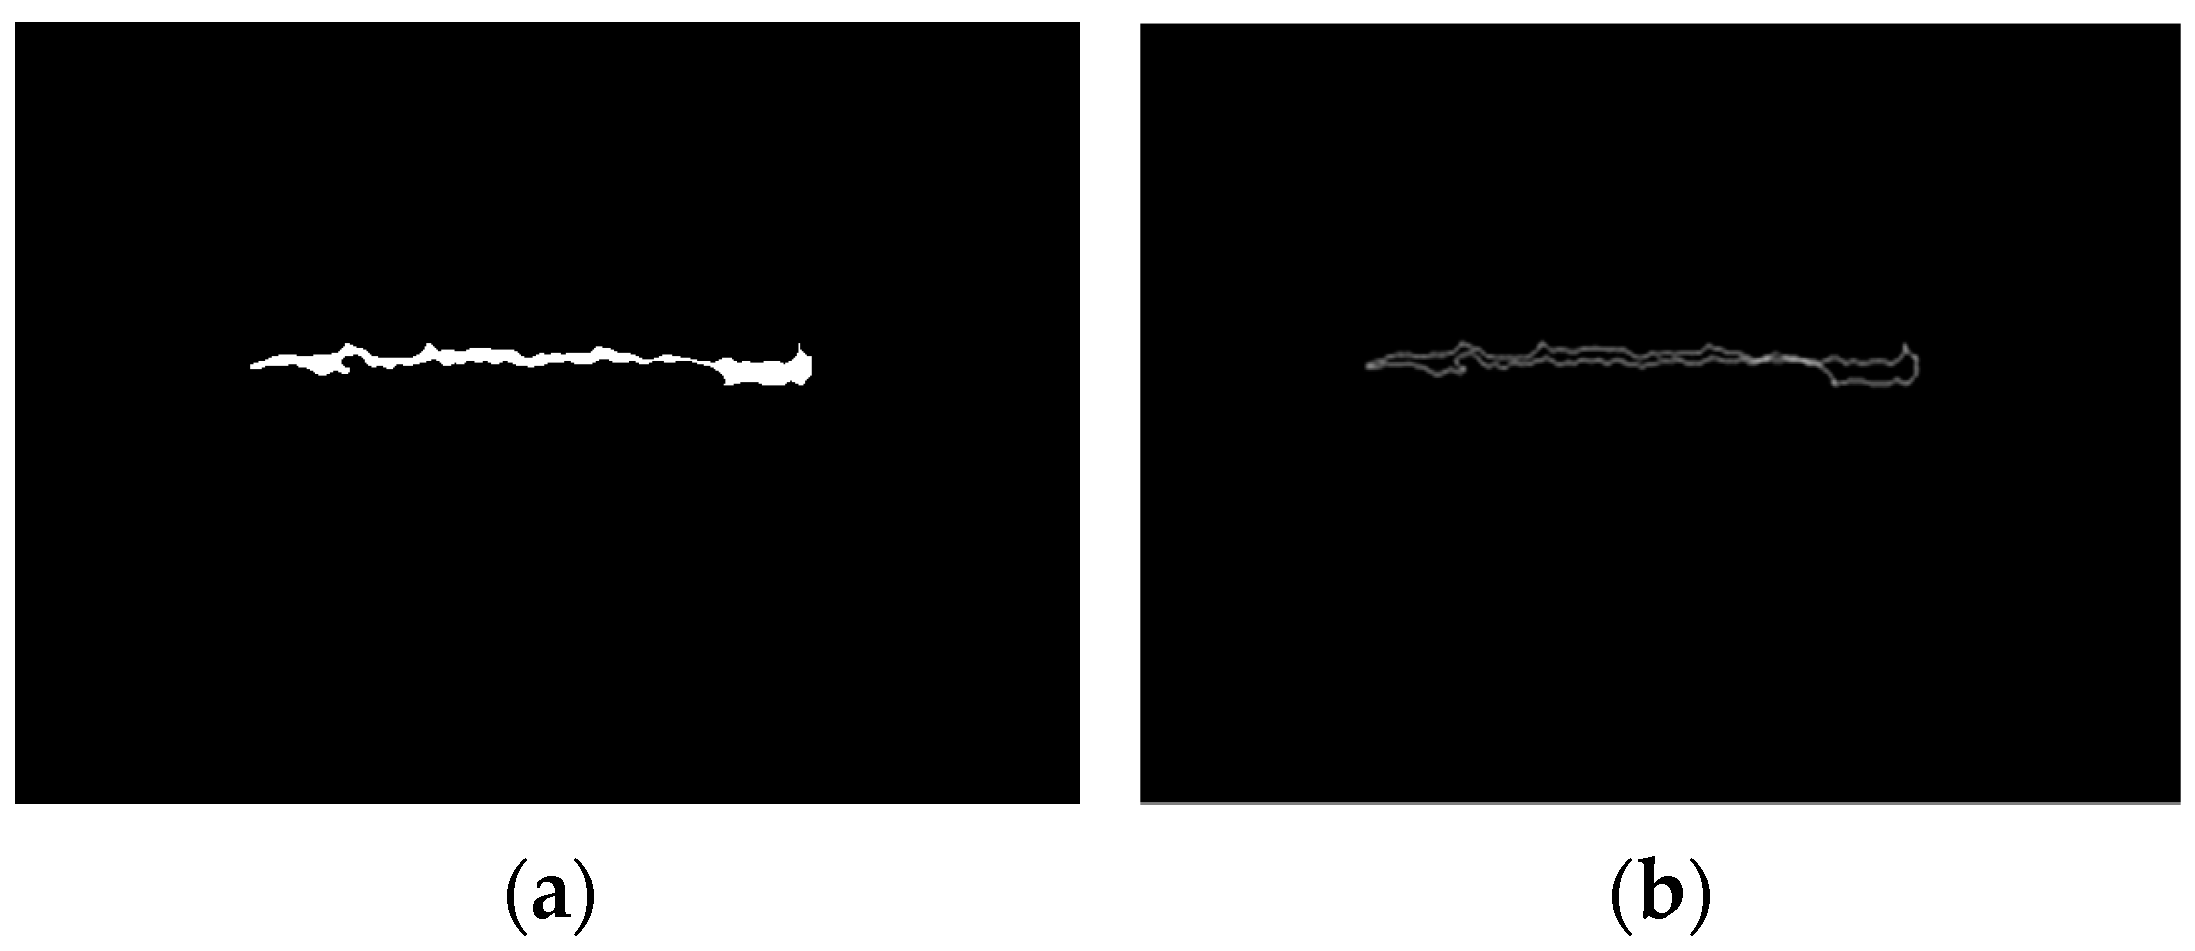
3.2. Pixel Area of the Crack
3.3. Pixel Width of the Crack
3.4. Pixel Calibration in Crack Region
4. Case Study
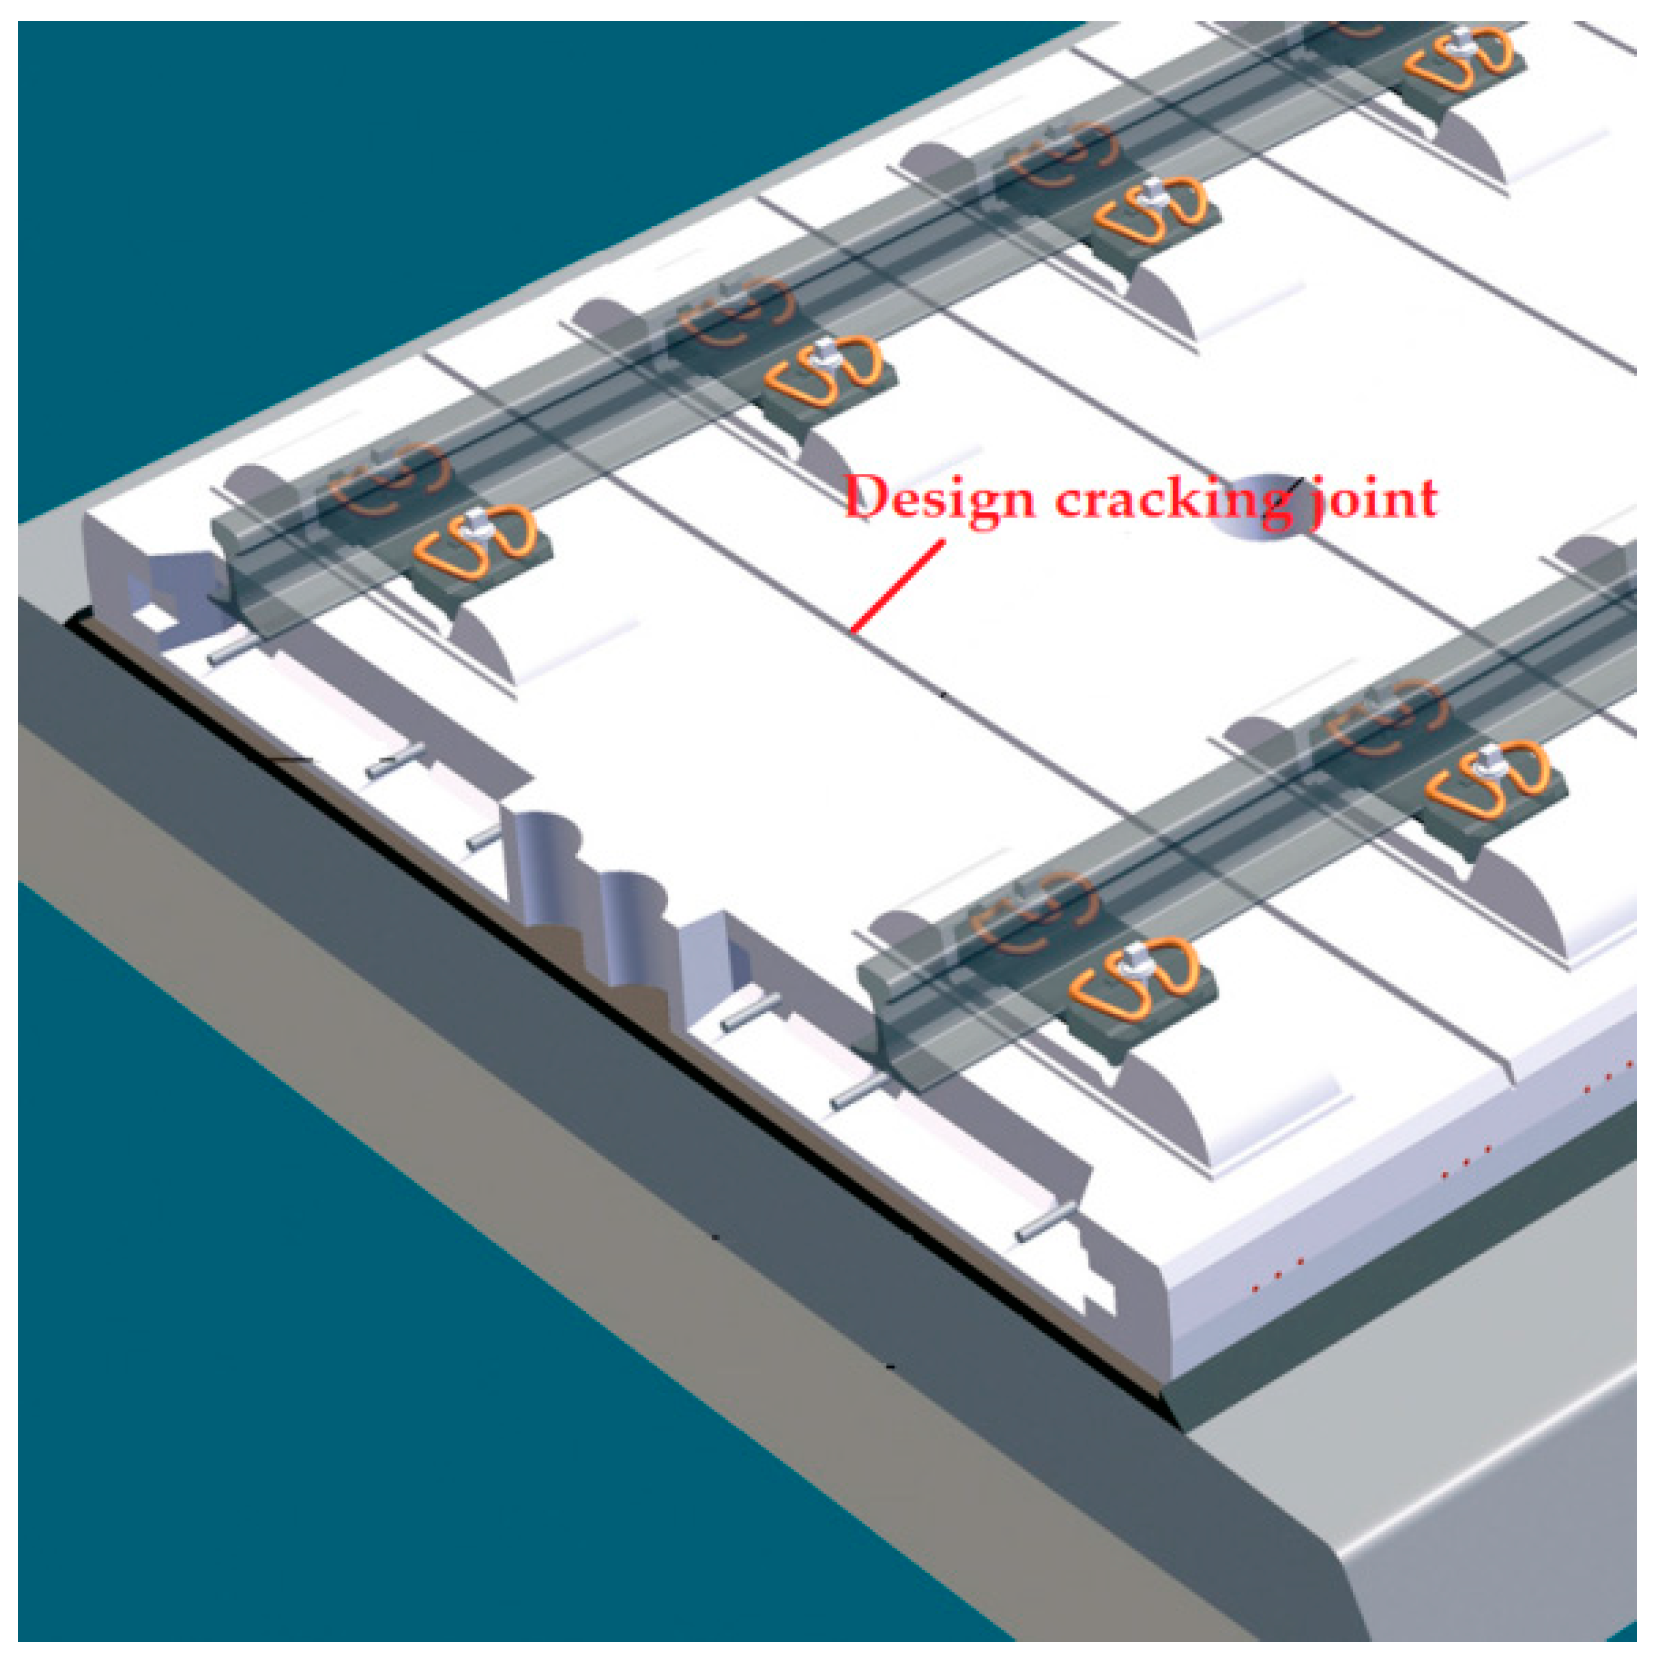
4.1. Model Test
- (1)
- Size of the scaled model
- (2)
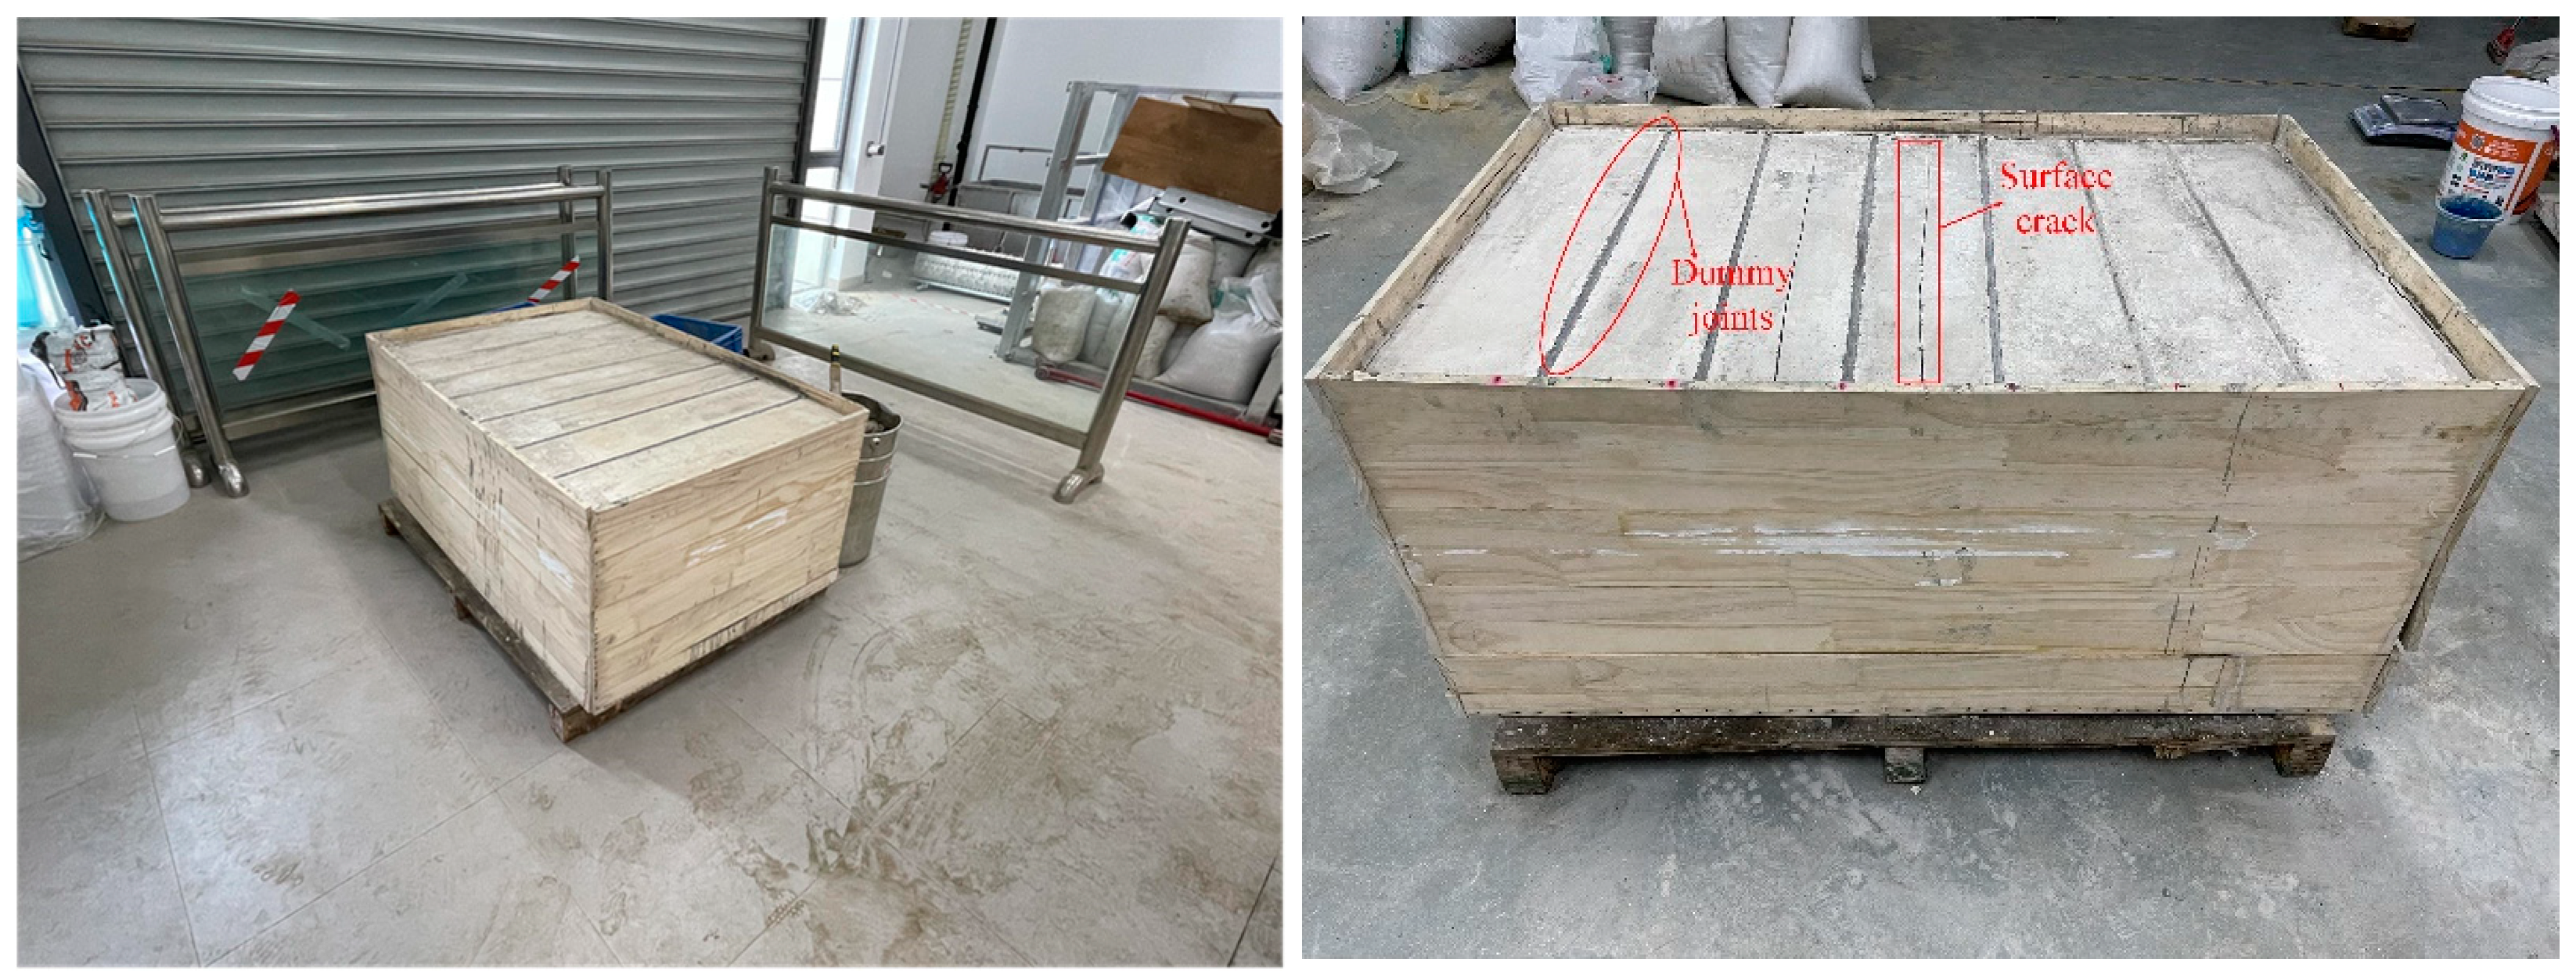
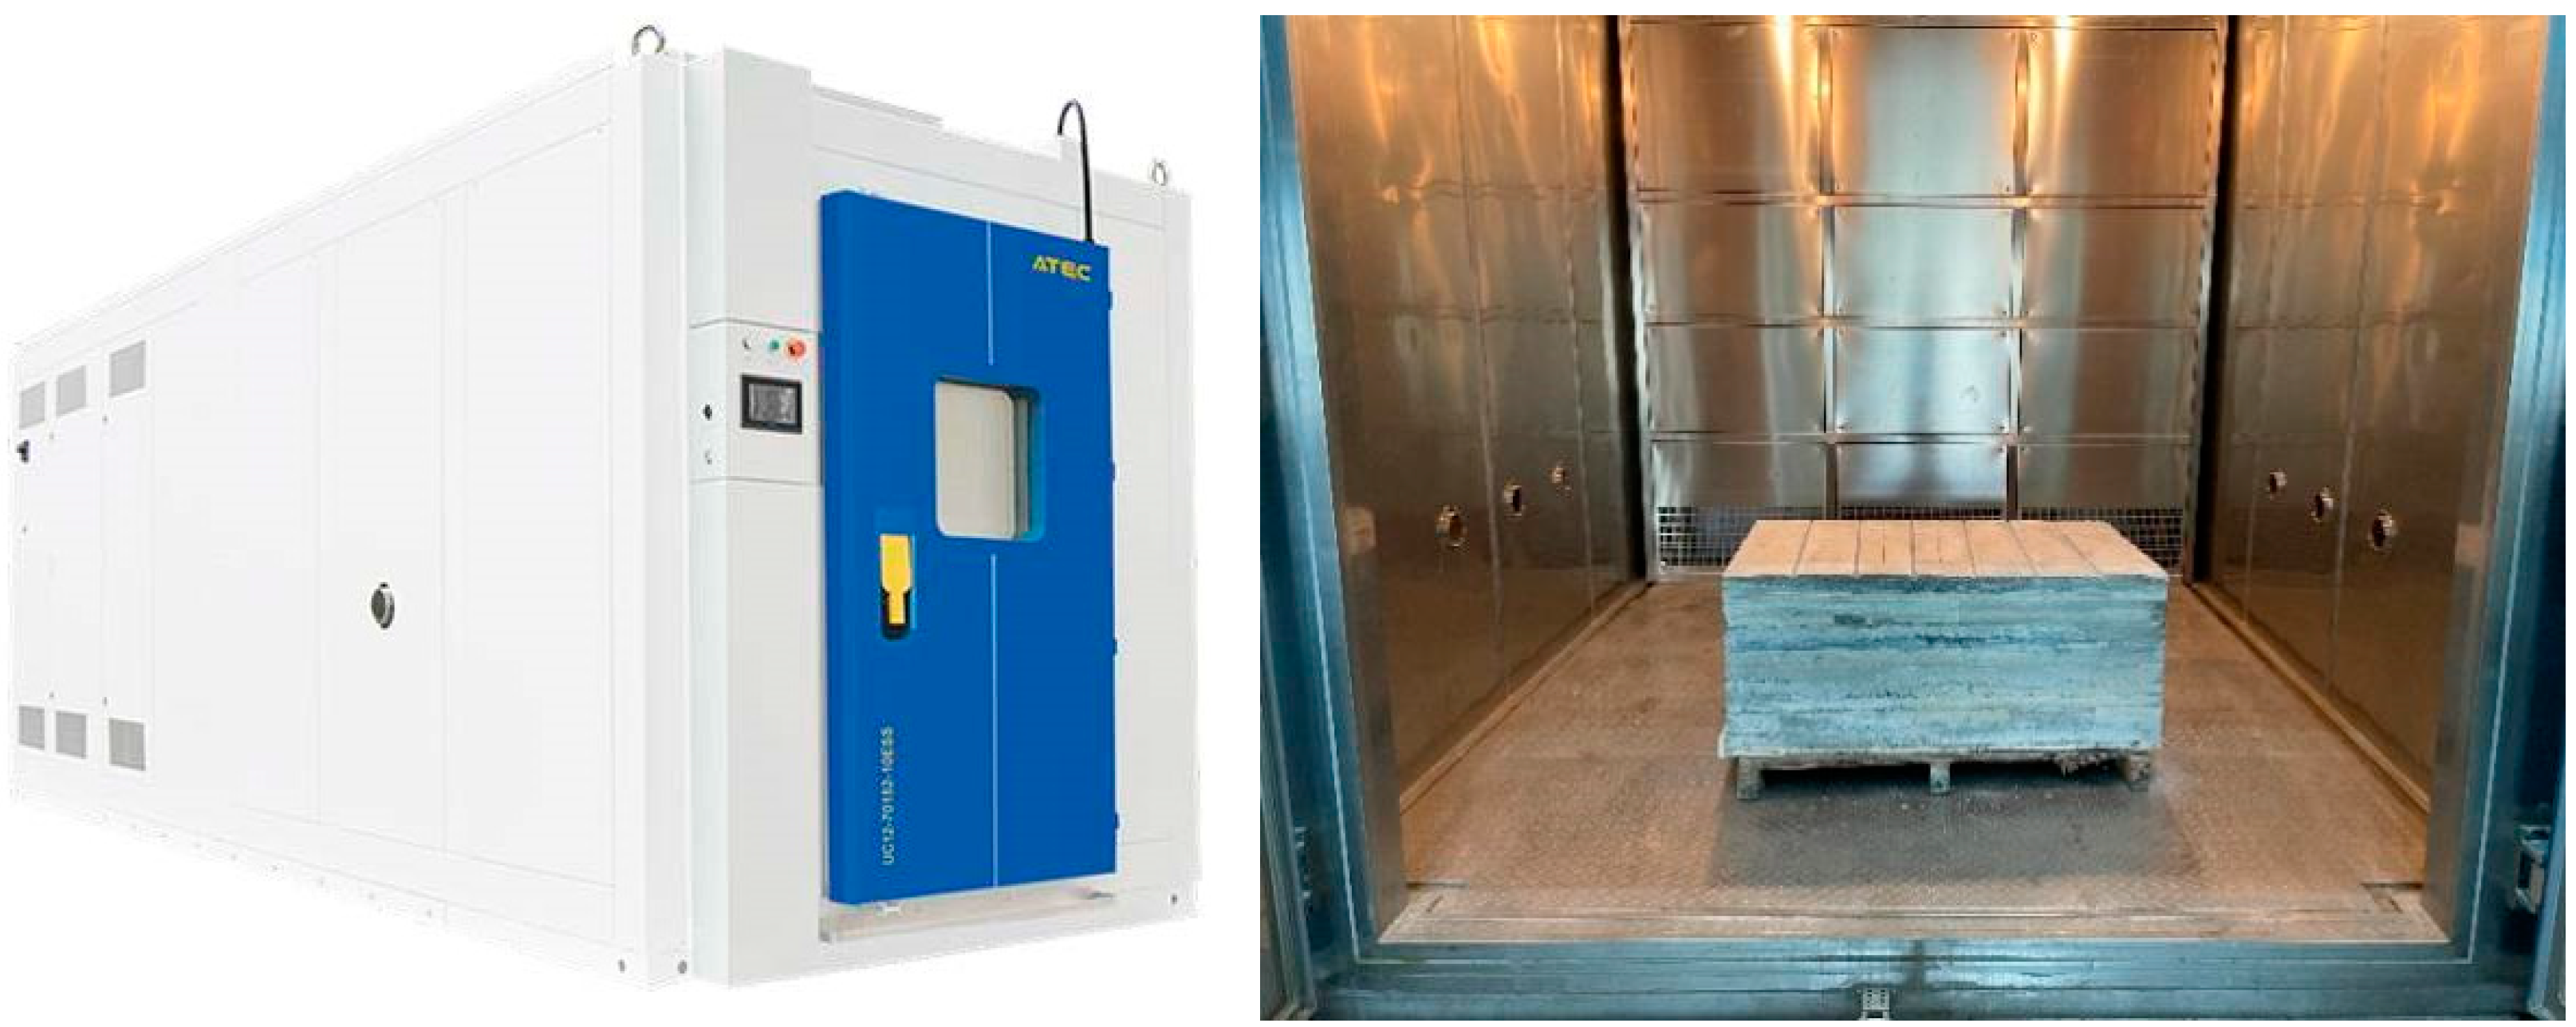
- Track model and relevant experimental equipment
- (3)
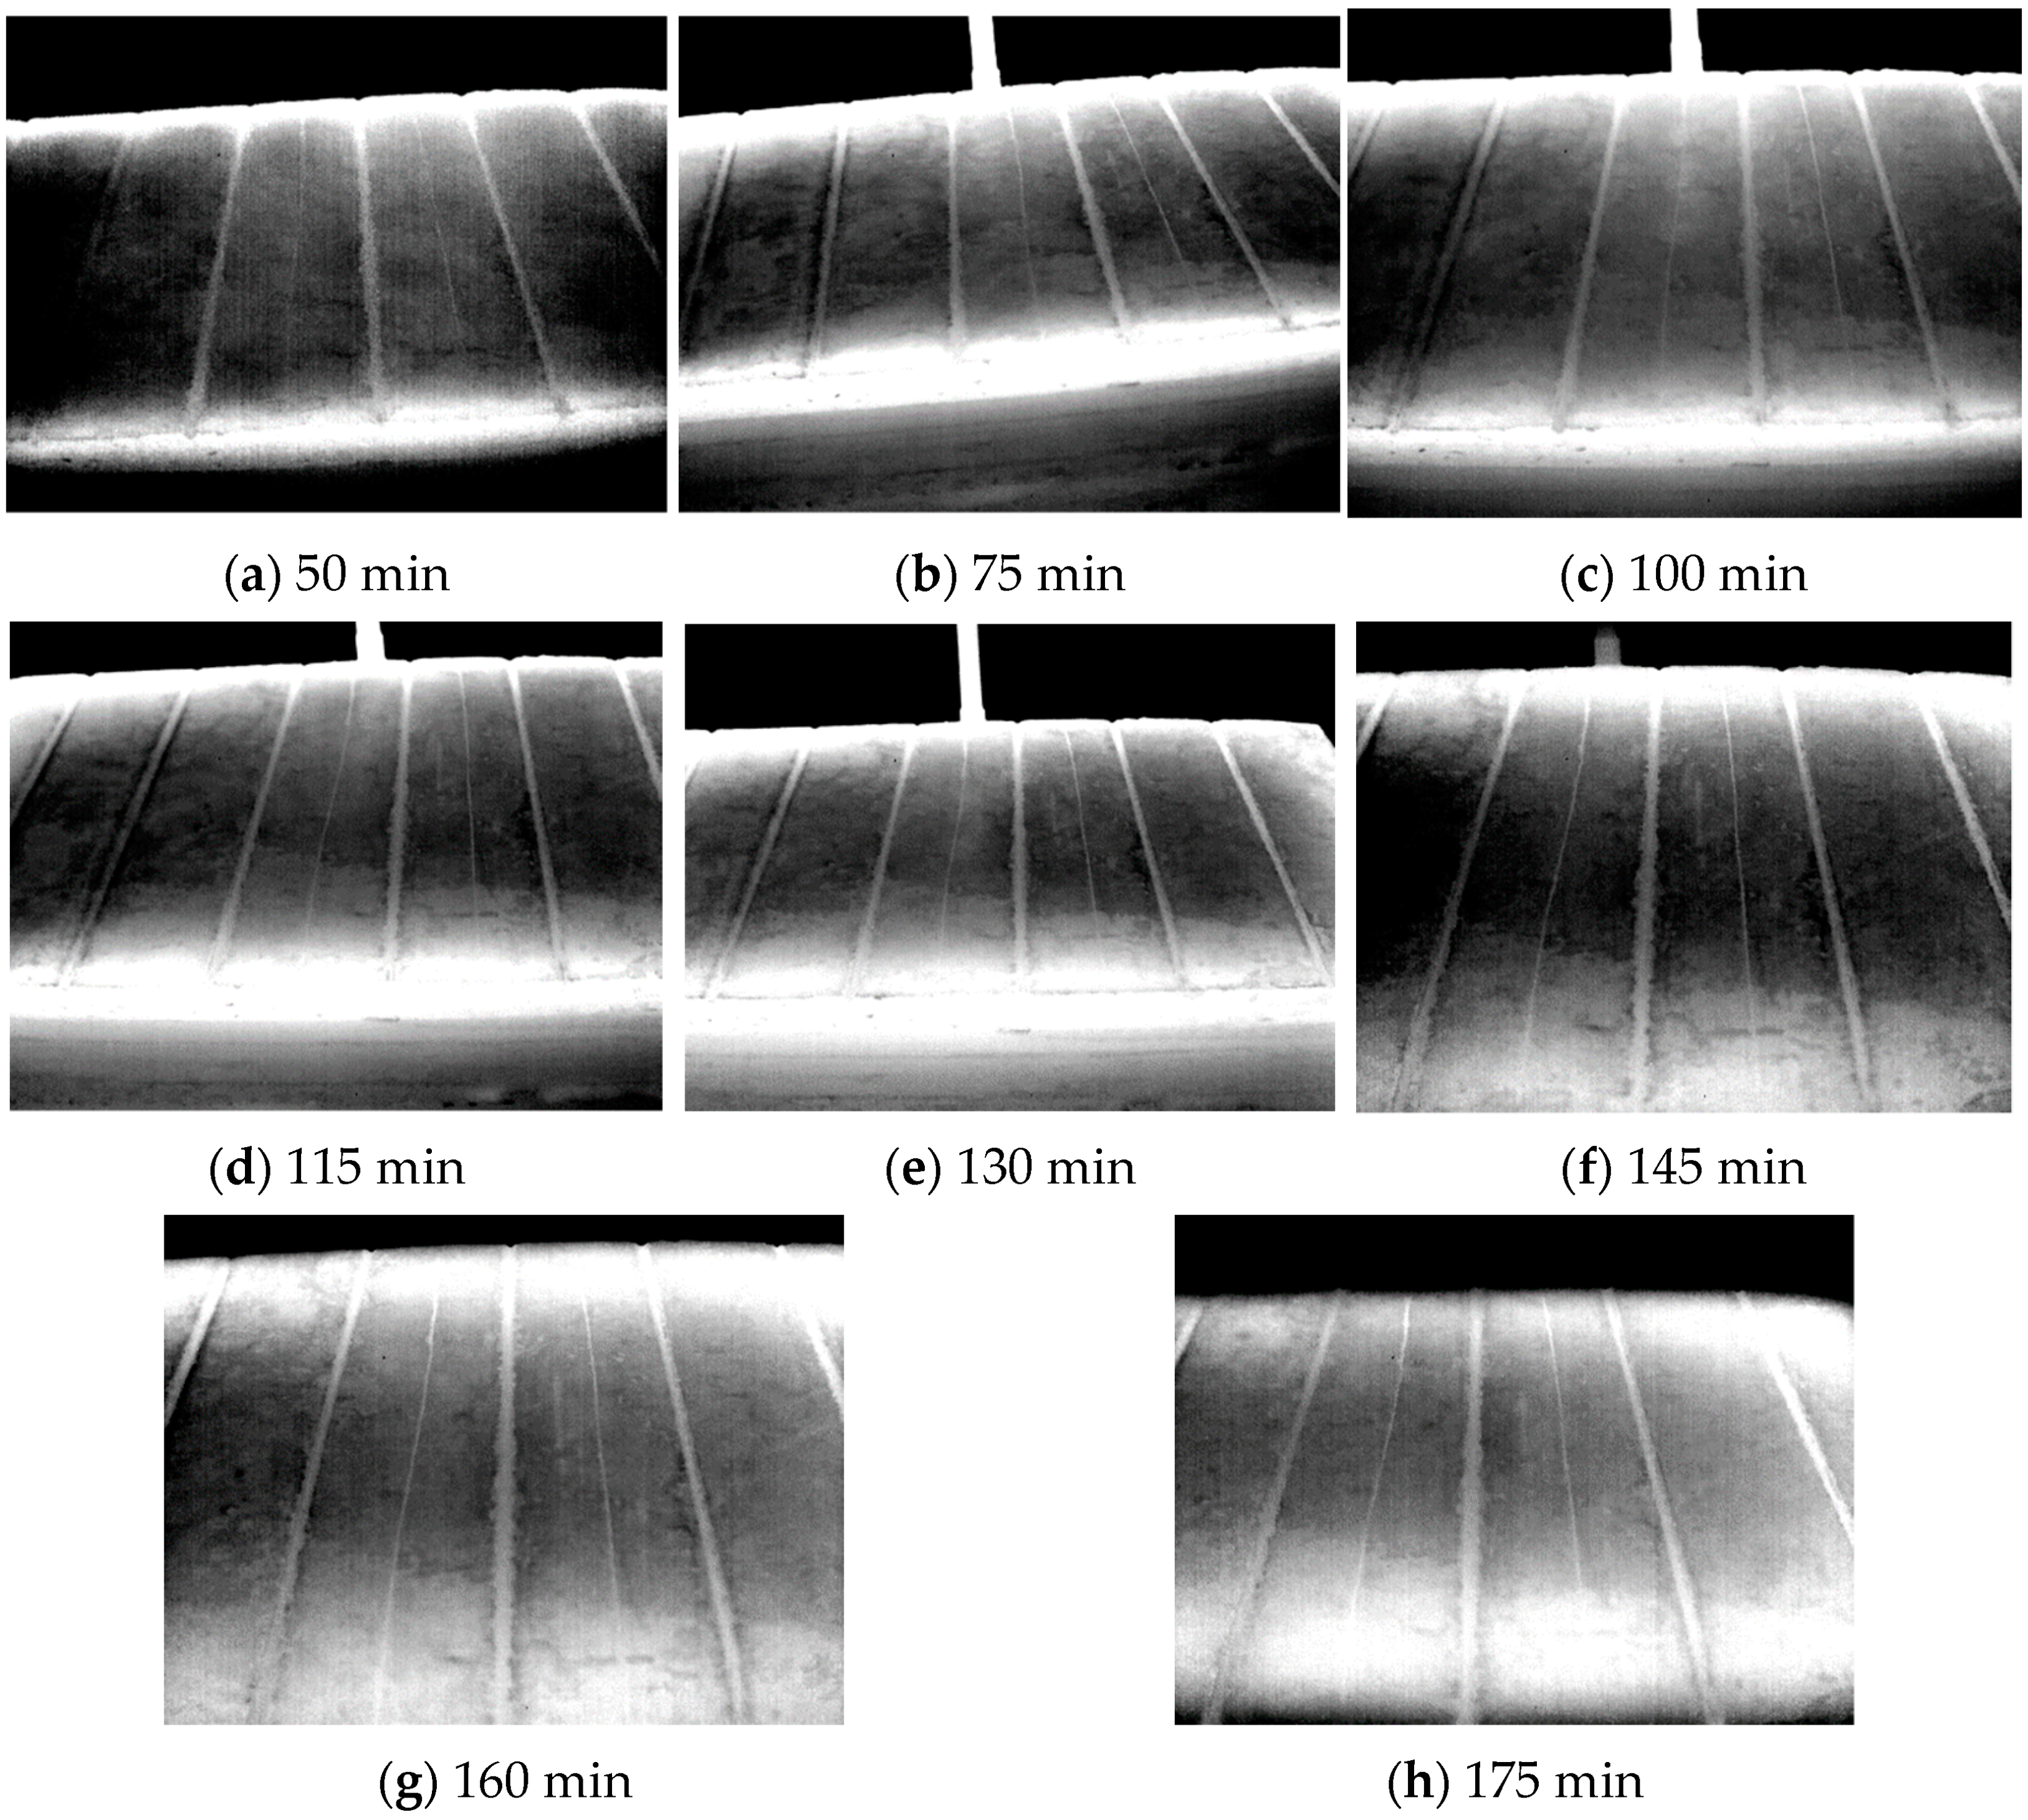
- Temperature-change process and infrared thermogram
4.2. Results Analysis
5. Concluding Remarks
- (1)
- The proposed infrared-image enhancement algorithm can effectively solve the problem of fuzzy edge details and low contrast in the infrared thermograms of slab tracks and strengthen the crack-edge details in the image;
- (2)
- The crack area can be located from the infrared thermogram via the edge-detection algorithm and morphological processing algorithm; the morphological processing method can be used to effectively remove the isolated noise and false edge areas in the image;
- (3)
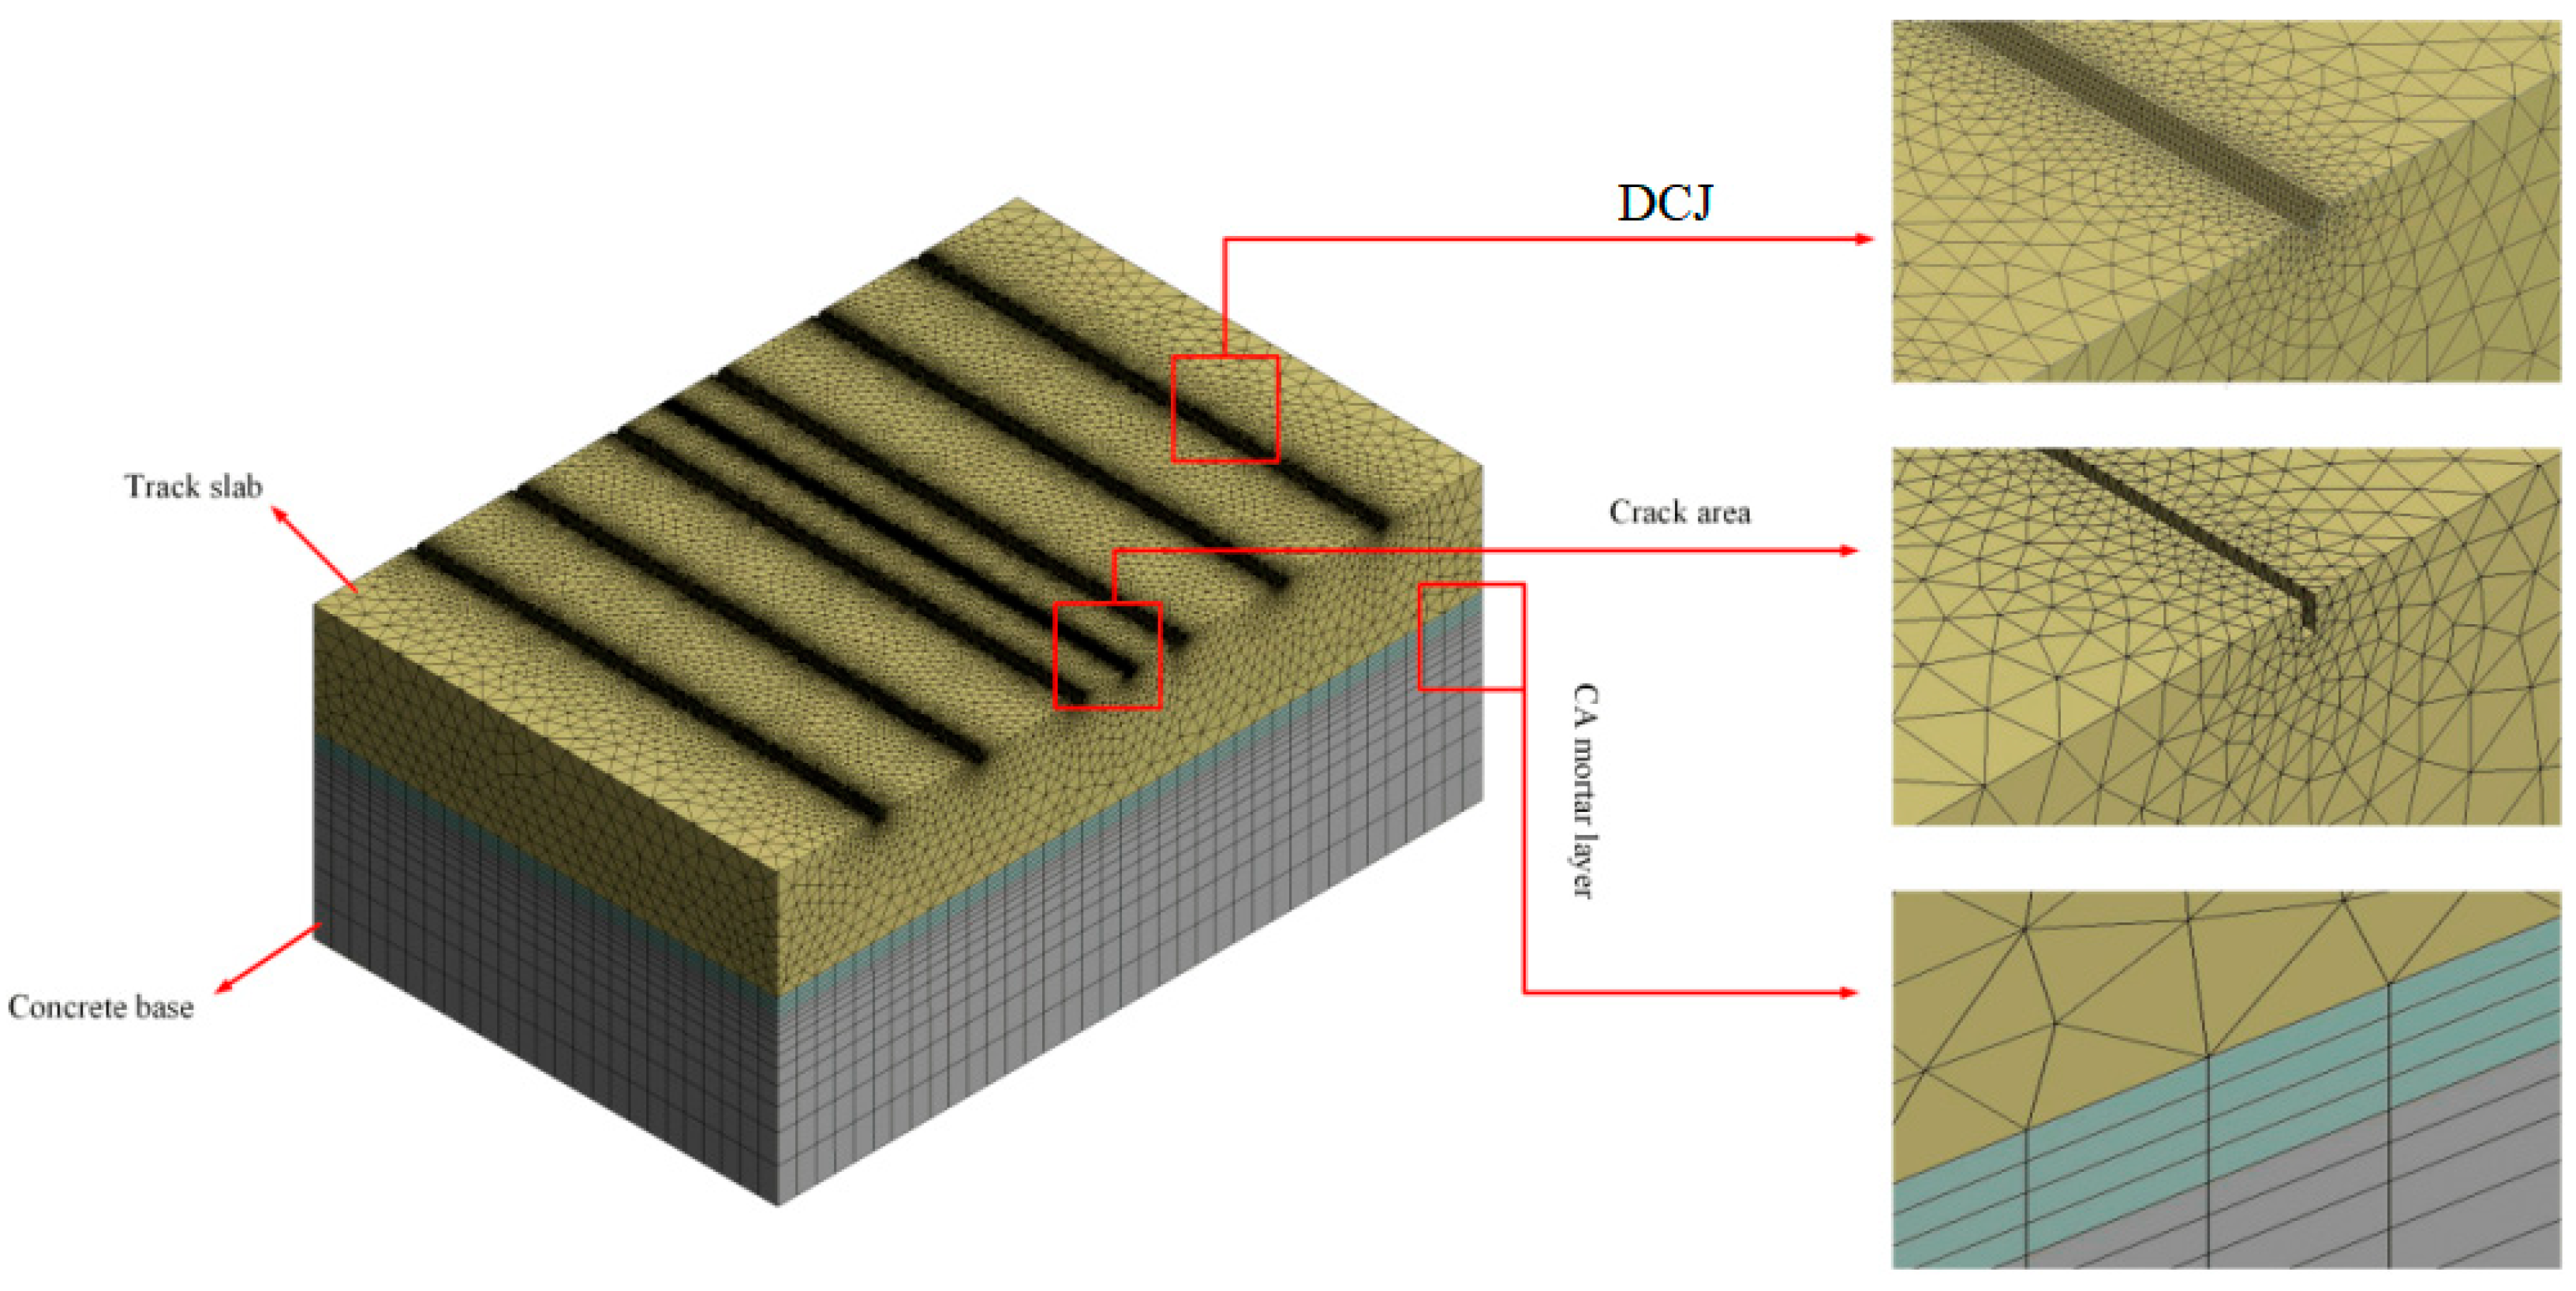
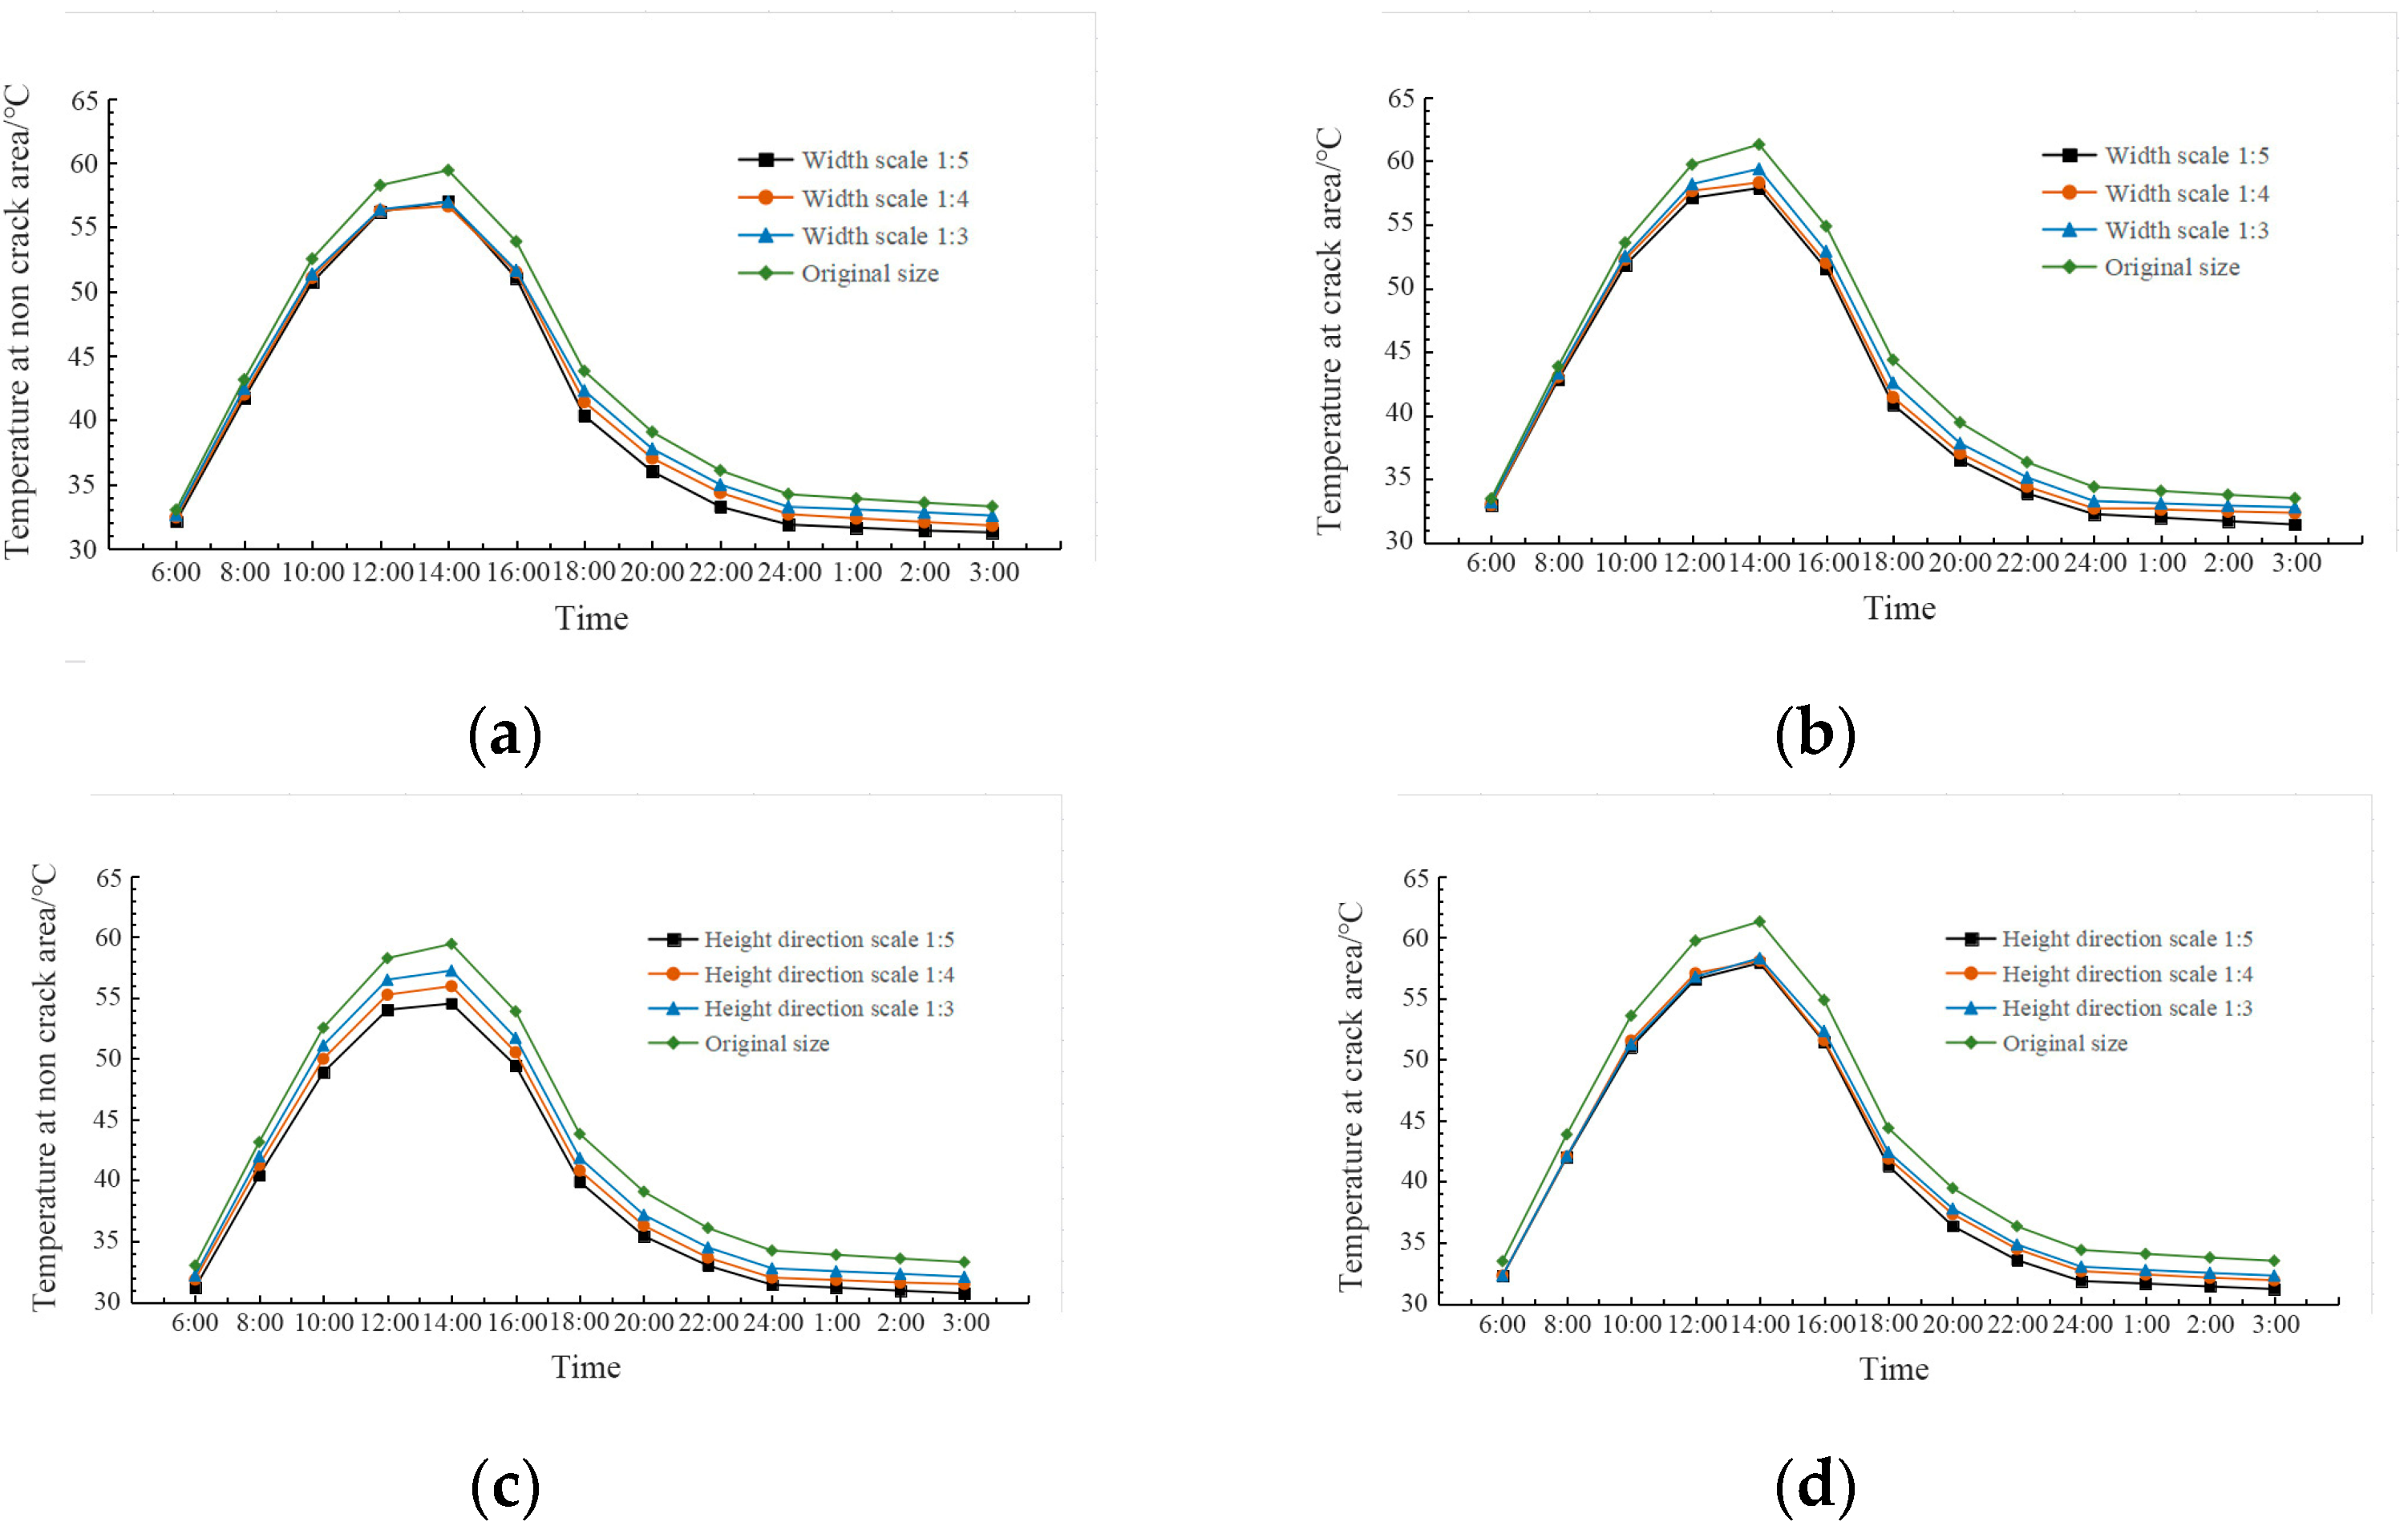
- The scale model of the track slab designed in this study can reflect the surface-temperature field of the original slab-track structure based on the results of the FE simulation of the slab-temperature field;
- (4)
- As verified by the laboratory test, the quantitative accuracy of the detection of crack width by the proposed algorithm can be higher than 90%, whilst the accuracy of the algorithm’s length and area detection is 85%, which essentially meets the requirements of current track maintenance for HSRs.
Author Contributions
Funding
Institutional Review Board Statement
Informed Consent Statement
Data Availability Statement
Conflicts of Interest
References
- Liu, X.; Zhang, W.; Xiao, J.; Liu, X.; Li, W. Damage Mechanism of Broad-narrow Joint of CRTSII Slab Track under Temperature Rise. KSCE J. Civ. Eng. 2019, 23, 2126–2135. [Google Scholar]
- Wolf, H.E.; Qian, Y.; Edwards, J.R.; Dersch, M.S.; Lange, D.A. Temperature-induced curl behavior of prestressed concrete and its effect on railroad crossties. Constr. Build. Mater. 2016, 115, 319–326. [Google Scholar] [CrossRef]
- Zhong, Y.; Gao, L.; Zhang, Y. Effect of daily changing temperature on the curling behavior and interface stress of slab track in construction stage. Constr. Build. Mater. 2018, 185, 638–647. [Google Scholar] [CrossRef]
- Gautier, P. Slab track: Review of existing systems and optimization potentials including very high speed. Constr. Build. Mater. 2015, 92, 9–15. [Google Scholar] [CrossRef]
- ZLi, Z.-W.; Liu, X.-Z.; Lu, H.-Y.; He, Y.-L.; Zhou, Y. Surface Crack Detection in Precasted Slab Track in High-Speed Rail via Infrared Thermography. Materials 2020, 13, 4837. [Google Scholar]
- Tian, X.; Zhao, W.; Du, Y.; Wang, B. Detection of mortar defects in ballastless tracks of high-speed railway using transient elastic wave method. J. Civ. Struct. Health Monit. 2018, 8, 151–160. [Google Scholar] [CrossRef]
- Xu, J.; Wang, P.; An, B.; Ma, X.; Chen, R. Damage detection of ballastless railway tracks by the impact-echo method. Proc. Inst. Civ. Eng. Transp. 2018, 171, 106–114. [Google Scholar] [CrossRef]
- Janeliukstis, R.; Clark, A.; Papaelias, M.; Kaewunruen, S. Flexural cracking-induced acoustic emission peak frequency shift in railway prestressed concrete sleepers. Eng. Struct. 2019, 178, 493–505. [Google Scholar]
- Zhang, X.; Feng, N.; Wang, Y.; Shen, Y. Acoustic emission detection of rail defect based on wavelet transform and Shannon entropy. J. Sound Vib. 2015, 339, 419–432. [Google Scholar] [CrossRef]
- Wu, C.; Sun, K.; Xu, Y.; Zhang, S.; Huang, X.; Zeng, S. Concrete crack detection method based on optical fiber sensing network and microbending principle. Saf. Sci. 2019, 117, 299–304. [Google Scholar] [CrossRef]
- Chapeleau, X.; Sedran, T.; Cottineau, L.-M.; Cailliau, J.; Taillade, F.; Gueguen, I.; Henault, J.-M. Study of ballastless track structure monitoring by distributed optical fiber sensors on a real-scale mockup in laboratory. Eng. Struct. 2013, 56, 1751–1757. [Google Scholar] [CrossRef]
- Gibert, X.; Patel, V.M.; Chellappa, R. Deep Multitask Learning for Railway Track Inspection. IEEE Trans. Intell. Transp. Syst. 2017, 18, 153–164. [Google Scholar]
- Ai, C.; Qiu, S.; Xu, G.; Zhang, A.; Wang, K.C. A Nonballasted Rail Track Slab Crack Identification Method Using a Level-Set-Based Active Contour Model. Comput. Aided Civ. Infrastruct. Eng. 2018, 33, 571–584. [Google Scholar] [CrossRef]
- Yang, Y.; Zhao, W. Curvelet transform-based identification of void diseases in ballastless track by ground-penetrating radar. Struct. Control. Health Monit. 2019, 26, e2322. [Google Scholar]
- Tabatabaei SA, H.; Delforouzi, A.; Khan, M.H.; Wesener, T.; Grzegorzek, M. Automatic Detection of the Cracks on the Concrete Railway Sleepers. Int. J. Pattern Recognit. Artif. Intell. 2019, 33, 1955010. [Google Scholar] [CrossRef]
- Zhang, X.; Rajan, D.; Story, B. Concrete crack detection using context-aware deep semantic segmentation network. Comput.-Aided Civ. Infrastruct. Eng. 2019, 34, 951–971. [Google Scholar] [CrossRef]
- Kim, J. Non-Destructive Characterization of Railway Materials and Components with Infrared Thermography Technique. Materials 2019, 12, 4077. [Google Scholar] [CrossRef]
- Pathirathna, K.A.B.; Dhanushka, R.M.; Rathnayake, M.; Hathanguruge, W.; Fernando, G.D. Use of thermal imaging technology for locomotive maintenance in Sri Lanka Railways. In Proceedings of the 2018 International Conference on Intelligent Rail Transportation (ICIRT), Singapore, 12–14 December 2018; p. 20181-4. [Google Scholar]
- Da Cunha, A.L.; Zhou, J.; Do, M.N. The Nonsubsampled Contourlet Transform: Theory, Design, and Applications. IEEE Trans. Image Process. 2006, 15, 3089–3101. [Google Scholar]
- Morrone, M.C.; Owens, R.A. Feature detection from local energy. Pattern Recognit. Lett. 1987, 6, 303–313. [Google Scholar] [CrossRef]
- Venkatesh, S.; Owens, R.A. An energy feature detection scheme. In Proceedings of the International Conference on Image Processing, Warwick, UK, 18–20 July 1989; pp. 553–557. [Google Scholar]
- Li, Z.-W.; Liu, X.-Z.; Lu, H.-Y.; He, Y.-L. Narrowing longitudinally coupled prefabricated slab track maintenance duration with field data analysis of slab deformation under high temperature. Proc. Inst. Mech. Eng. Part F J. Rail Rapid Transit 2021, 235, 1099–1109. [Google Scholar] [CrossRef]
- Zhang, T.Y.; Suen, C.Y. A fast parallel algorithm for thinning digital patterns. Commun. ACM 1984, 27, 236–239. [Google Scholar] [CrossRef]
- Qu, Z.; Guo, Y.; Ju, F.-R.; Liu, L.; Lin, L.-D. The algorithm of accelerated cracks detection and extracting skeleton by direction chain code in concrete surface image. Imaging Sci. J. 2016, 64, 119–130. [Google Scholar] [CrossRef]
- Liu, D.; Su, C.; Ren, J.; Wang, L.; Kendrick, B.; Liu, X. Numerical analysis of new pre-installed steel modular railroad track assembly. Constr. Build. Mater. 2017, 134, 269–278. [Google Scholar] [CrossRef]
- Su, C.; Liu, D.; Ding, C.; Gong, C.; Zhao, P.; Liu, X. Experimental Study on Bond Performances of Track Slab and Mortar Based on DIC Technology. KSCE J. Civ. Eng. 2018, 22, 3546–3555. [Google Scholar] [CrossRef]
- Yakhot, V.; Orszag, S.A. Renormalization group analysis of turbulence. I. Basic theory. J. Sci. Comput. 1986, 1, 3–51. [Google Scholar] [CrossRef]


| Category | Value |
|---|---|
| Image resolution | 640 × 480 (307,200 pixels) |
| Instantaneous field of view (IFOV) | 0.85 mRad |
| Field of view (FOV) w/standard 30 mm lens | 32.7° × 24.0° |
| Frame rate (@ max. image resolution) | 30 and 9 Hz |
| Thermal sensitivity (NETD) | <0.04 °C at 30 °C target temp (40 mK) |
| Measurement range | −40 °C to 600 °C (−40 °F to 1112 °F) |
| Measurement accuracy | ±2 K or ±2% |
| Photo |  |
| Time | Scale Model | Full-Scale Model | ||||
|---|---|---|---|---|---|---|
| Temperature in Non-Crack Areas/°C | Error | Temperature in Crack Areas/°C | Error | Temperature in Non-Crack Areas/°C | Temperature in Crack Areas/°C | |
| 6:00 | 33.00 | 0.07% | 33.48 | 0.04% | 26.71 | 26.59 |
| 8:00 | 42.96 | 0.45% | 43.66 | 0.48% | 35.91 | 33.39 |
| 10:00 | 52.23 | 0.59% | 53.06 | 1.00% | 47.3 | 41.13 |
| 12:00 | 57.70 | 0.96% | 59.11 | 1.04% | 55.23 | 46.16 |
| 14:00 | 58.87 | 0.94% | 60.45 | 1.38% | 56.53 | 46.7 |
| 16:00 | 52.96 | 1.73% | 53.77 | 2.03% | 51.32 | 42.55 |
| 18:00 | 43.02 | 1.82% | 43.39 | 2.26% | 41.14 | 35.46 |
| 20:00 | 38.25 | 2.12% | 38.59 | 2.24% | 36.4 | 33.01 |
| 22:00 | 35.34 | 2.07% | 35.56 | 2.19% | 34.24 | 32.01 |
| 24:00 | 33.54 | 2.04% | 33.66 | 2.19% | 32.88 | 31.28 |
| 1:00 | 33.23 | 1.95% | 33.49 | 1.75% | 32.32 | 30.97 |
| 2:00 | 32.96 | 1.85% | 33.32 | 1.39% | 31.83 | 30.69 |
| 3:00 | 32.71 | 1.75% | 33.18 | 1.02% | 31.39 | 30.43 |
| Ingredients | Track Slab | Concrete Base | CA Mortar |
|---|---|---|---|
| Concrete Grade: C55 | Concrete Grade: C15 | ||
| Cement | 432 | 140 | 506 |
| Fly ash | 48 | 60 | - |
| Emulsified asphalt | - | - | 265 |
| Sand | 717 | 830 | 984 |
| Gravel | 1121 | 1244 | - |
| Aluminium powder | - | - | 0.06 |
| Water | 125 | 125 | 158 |
| Water reducer | 7.2 | 1 | 5.5 |
| Expander | - | - | 86 |
| Defoamer | - | - | 0.5 |
| Time (min) | Internal Temp. (°C) | Temp. in Crack Areas (°C) | Temp. in Non-Crack Areas (°C) | Temp. Difference between Crack and Non-Crack Areas (°C) | Temp. at DCJs (°C) |
|---|---|---|---|---|---|
| 0 | 20 | 19.6 | 19.6 | 0 | 19.6 |
| 50 | 40 | 24.3 | 23.73 | 0.57 | 24.42 |
| 75 | 50 | 27.9 | 27.24 | 0.66 | 28.26 |
| 100 | 60 | 33.96 | 32.54 | 1.42 | 34.13 |
| 115 | 50 | 32.69 | 31.79 | 0.9 | 32.91 |
| 130 | 40 | 31.69 | 30.95 | 0.74 | 31.73 |
| 145 | 30 | 28.45 | 27.92 | 0.53 | 28.84 |
| 160 | 20 | 26.97 | 26.8 | 0.17 | 27.03 |
| 175 | 10 | 23.68 | 23.58 | 0.1 | 23.76 |
| Time/min | Width Detected/mm | Actual Width/mm | Acc. | Length Detected/mm | Actual Length/mm | Acc. | Area Detected/mm2 | Actual Area/mm2 | Acc. |
|---|---|---|---|---|---|---|---|---|---|
| 50 | 1.193 | 1.2 | 99.4% | 689 | 857 | 80.4% | 821.9 | 1028.4 | 80.1% |
| 75 | 1.184 | 98.7% | 749 | 87.4% | 886.8 | 86.2% | |||
| 100 | 1.197 | 99.8% | 722 | 84.2% | 864.2 | 84.0% | |||
| 115 | 1.198 | 99.8% | 721 | 84.1% | 863.8 | 84.0% | |||
| 130 | 1.199 | 99.9% | 719 | 83.9% | 862.1 | 83.8% | |||
| 145 | 1.196 | 99.7% | 731 | 85.3% | 874.3 | 85.0% | |||
| 160 | 1.189 | 99.1% | 720 | 84.0% | 856.1 | 83.2% | |||
| 175 | 1.191 | 99.3% | 738 | 86.1% | 878.9 | 85.5% |
Disclaimer/Publisher’s Note: The statements, opinions and data contained in all publications are solely those of the individual author(s) and contributor(s) and not of MDPI and/or the editor(s). MDPI and/or the editor(s) disclaim responsibility for any injury to people or property resulting from any ideas, methods, instructions or products referred to in the content. |
© 2023 by the authors. Licensee MDPI, Basel, Switzerland. This article is an open access article distributed under the terms and conditions of the Creative Commons Attribution (CC BY) license (https://creativecommons.org/licenses/by/4.0/).
Share and Cite
Ye, X.-Y.; Luo, Y.-Y.; Li, Z.-W.; Liu, X.-Z. A Quantitative Detection Method for Surface Cracks on Slab Track Based on Infrared Thermography. Appl. Sci. 2023, 13, 6681. https://doi.org/10.3390/app13116681
Ye X-Y, Luo Y-Y, Li Z-W, Liu X-Z. A Quantitative Detection Method for Surface Cracks on Slab Track Based on Infrared Thermography. Applied Sciences. 2023; 13(11):6681. https://doi.org/10.3390/app13116681
Chicago/Turabian StyleYe, Xuan-Yu, Yan-Yun Luo, Zai-Wei Li, and Xiao-Zhou Liu. 2023. "A Quantitative Detection Method for Surface Cracks on Slab Track Based on Infrared Thermography" Applied Sciences 13, no. 11: 6681. https://doi.org/10.3390/app13116681
APA StyleYe, X.-Y., Luo, Y.-Y., Li, Z.-W., & Liu, X.-Z. (2023). A Quantitative Detection Method for Surface Cracks on Slab Track Based on Infrared Thermography. Applied Sciences, 13(11), 6681. https://doi.org/10.3390/app13116681