Abstract
This paper presents an alternative approach to predict rockburst using Machine Learning (ML) algorithms. The study used the Decision Tree (DT) algorithm and implemented two approaches: (1) using DT model for each rock type (DT-RT), and (2) developing a single DT model (Unique-DT) for all rock types. A dataset containing 210 records was collected. Training and testing were performed on this dataset with 5 input variables, which are: Rock Type, Depth, Brittle Index (BI), Stress Index (SI), and Elastic Energy Index (EEI). Other ML algorithms, such as Random Forest (RF), Support Vector Machine (SVM), Artificial Neural Network (ANN), K-Nearest Neighbor (KNN), and Gradient-Boosting (AdaboostM1), were implemented as a form of comparison to the DT models developed. The evaluation metrics and relative importance were utilized to examine some characteristics of the DT methods. The Unique-DT model showed a promising result of the two DT models, giving an average of (F1 = 0.65) in rockburst condition prediction. Although RF and AdaboostM1 (F1 = 0.66) performed slightly better, Unique-DT is recommended for predicting rockburst conditions because it is easier, more effective, and more accurate.
1. Introduction
Underground activities, such as mining, railway, and road constructions, are complex geotechnical works. These could be attributed to the limited understanding of the subsurface, which makes it difficult for underground constructions, due to the variability of geology. Even though more effort has been made to perfect underground constructions, where underground operations at 2000 m below the surface have been common, several uncertainties do pop up occasionally, which can lead to the wastage of resources (time, money, and properties) and, sometimes, loss of life. One such uncertainty is the instability of rock mass, as stated by Askaripour et al. and Aydan et al. [1,2]. Meng et al. [3] and Zhu et al. [4] explained that the instability of a rock mass in deep excavations depends on the inherent properties of the rock mass, such as the type of rock, its strength and brittleness, and external conditions, such as the magnitude of in situ stresses, geological structures, dynamic perturbations, and excavation sequences during underground operations. Consequently, based on understanding the above factors and how they influence rock mass instability, the magnitude of in situ stresses and the rock mass quality have been of more impact [1,5].
Accordingly, rockburst, which is a dynamic phenomenon, is considered a type of rock mass failure around deep excavations of hard and brittle rocks and in a high-stress environment [1,3,6,7]. Rockburst occurs as a result of overstressing the rock mass or intact brittle rock, when the stresses exceed the compressive strength of the material [1,8,9,10,11,12]. Rockburst can also be defined as sudden and intense movement, accompanied by rock failure, in underground spaces under high-stress conditions [1,13,14,15,16]. Given the fact that rockburst is an unexpected mechanism, it poses more problems in terms of vulnerability. These are the loss of lives of mining personnel, destruction of mining equipment, and, in some cases, financial loss and time loss. Therefore, it is a must to understand this mechanism and predict how it is triggered to prevent these vulnerabilities from occurring. Owing to its complexity, rockburst can be classified into various types, based on its intensity (rockburst condition), seismicity, the shape of the ejected rock, and others. Rockburst classification is divided into three groups: first, the type of rockburst (features of failure plane observed in underground excavation), rockburst intensity, and the mechanism of the rockburst and evaluation of seismic events [1,8,17]. The present paper uses a rockburst intensity, or rockburst conditions (RBC), grading system, with four predefined classes based on rock displacement, damage, and failure characteristics, as shown in Table 1 [18,19,20,21].

Table 1.
Standard classification of rockburst intensities.
Rockburst mechanisms and their predictions have been under serious research over the years, and have achieved thoughtful and profound results, as shown by the works produced by several authors. Among the rockburst forecasting methods, including laboratory, numerical, analytical, and empirical, the empirical approach is the most commonly used, due to its low cost, fast procedure, and simplicity [22].
Recent studies focusing on Machine Leaning (ML) algorithms are reviewed in Table 2, and results suggest that different methods have varying performances, and some methods have shown better accuracy in predicting rockburst occurrence than others [23]. Therefore, improving the accuracy of rockburst prediction is essential for mitigating risks and enhancing mining safety during the preliminary design phase [24]. These models have successfully operated using sets of input and output data from historical rockburst cases, affirming their capability in this context [24].

Table 2.
Summary of previous studies on ML predictions on rockburst conditions with input variables and results.
Table 2.
Summary of previous studies on ML predictions on rockburst conditions with input variables and results.
| Reference | Number of Data | Input Variables | Algorithm | Results/Description |
|---|---|---|---|---|
| J. Zhou et al. [20] | 132 | D(m), σt, σc, σθ, σθ/σc, σc/σt, EEI | SVM | The results indicated that SVM was feasible for rockburst conditions by indicating an average accuracy of 80% |
| Dong et al. [25] | 46 | σt, σc, σθ, EEI | RF, ANN and SVM | The results showed that the RF rockburst prediction model outperformed those of SVM and ANN, based on the misjudgment ratios |
| Adoko et al. [26] | 174 | σt, σc, σθ, σθ/σc, σc/σt, EEI | FIS, ANFIS | The performance of ANFIS, based on the metrics adopted, was better in predicting rockburst conditions |
| Liu et al. [27] | 164 | σθ/σc, σc/σt, EEI | cloud modelling, MLR, ANN | The cloud model adopted performed better than MLR, but has superior generalization ability of the ANN in rockburst prediction |
| J. Zhou et al. [28] | 254 | PPV, SCF, GSSC, ES, GS | stochastic gradient-boosting (SGB) | The SGB showed an average accuracy of 0.61 and a kappa of 0.43, indicating a very good performance in predicting rockburst conditions |
| K. Zhou et al. [29] | 209 | D(m), σt, σc, σθ, σθ/σc, σc/σt, EEI | cloud calculation and entropy weight, KNN, BN, RF | The results obtained from the considered model showed high performance of this model compared to the other ML algorithms |
| J. Zhou et al. [30] | 246 | D(m), σt, σc, σθ, σθ/σc, σc/σt, EEI | ANN, SVM, RF, GBM, LDA, QDA, NB, KNN, CT, PLSDA | The accuracy and Cohen’s kappa revealed that GBM and RF performed better than the others in predicting rockburst conditions |
| Li et al. [31] | 137 | D(m), σt, σc, σθ, EEI | BN with NB classifier | The result suggests that the error rate of the proposed BN is the lowest among traditional criteria, and it can resolve incomplete data |
| Ribeiro e Sousa et al. [10] | TSUP, K, σc, Deq, ORIENT | BN classifiers | The results revealed high accuracy and good relationships between variables to be identified | |
| Adoko and Zvarivada [32] | 174 | σt, σc, σθ, EEI | BN classifiers | Overall, the results indicate that BN performs well in predicting rockburst intensity |
| Li and Jimenez [33] | 135 | D(m), σt, σc, σθ, EEI | Logistic Regression classifier (LRC) | The results, based on AUC and error rates, indicate that LRC is effective in predicting rockburst intensity |
| Xu et al. [34] | 60 | σθ, σθ/σc, σc/σt, EEI | ideal-point method | The results revealed minimum error rate and a very high prediction for rockburst intensity |
| Pu et al. [35] | 108 | σt, σc, σθ, EEI | Decision Tree (DT) | The results show that moderate rockburst intensity has the best agreement with the actual circumstances |
| Faradonbeh and Taheri [36] | 134 | σt, σc, σθ, EEI | ENN, GEP, DT | The results showed the high accuracy and applicability of all three new models. However, the GA-ENN and the GEP methods outperformed the C4.5 method |
| Afraei et al. [37] | 188 | D(m), σt, σc, σθ, σθ/σc, σc/σt, EEI | NB, DT, SVM, ANN, KNN | The developed models show a high performance compared to the previous application of the empirical criteria |
| Pu et al. [38] | 246 | D(m), σt, σc, σθ, σθ/σc, σc/σt, EEI | Support Vector Classifier (SVC) | Promising results in forecasting the rockburst intensity at the Kimberlite mine in Canada were achieved |
| Kadkhodaei and Ghasemi [39] | 174 | σθ/σc, σc/σt, EEI | DT | The results show the significantly high performance of the models |
| J. Zhou et al. [21] | 196 | σt, σc, σθ, σθ/σc, σc/σt, EEI | FA, ANN, and (FA-ANN) | The results show a significantly high performance for all three models, based on RMSE and R2 |
| J. Zhou et al. [24] | 102 | σt, σc, σθ, σθ/σc, σc/σt, EEI | CART, Boosting, and Bagging | The results, based on accuracy, indicated that the ensemble techniques proved better for the prediction, especially the bagging |
NB.: σθ is the maximum tangential stress of the surrounding rock, MPa, σc is the uniaxial compressive strength of the surrounding rock, MPa, σt is the tensile strength of the rock, MPa, EEI is the Elastic Energy Index, Brittle index (BI) = (σc/σt), Stress index/Stress Concentration Factor (SI/SCF) = (σθ/σc), Peak Particle Velocity (PPV), Ground Support System Capacity (GSSC), Excavation Span (ES), Geological Structure (GS), Type of Support (TSUP), horizontal vs vertical stress ratio (K), equivalent diameter (Deq), orientation of the burst in the periphery of the excavation, Support Vector Machine (SVM), Random Forest (RF), Artificial Neural Network (ANN), Fuzzy Inference System (FIS), Adaptive-Neuro Fuzzy Inference System (ANFIS), K-Nearest Neighbor (KNN), Bayesian Network (BN), Naïve Bayes (NB), Decision Tree (DT), Linear Discriminant Analysis (LDA), Quadratic Discriminant Analysis (QDA), Multilinear Regression (MLR), Partial Least-squares Discriminant Analysis (PLSDA), Gradient-boosting Machine (GBM), Classification Tree (CT), Emotional Neural Network (ENN), Gene Expression Programming (GEP), Firefly Algorithm (FA).
While these methods have demonstrated satisfactory results in predicting rockburst conditions, they are not without limitations. For instance, ANN may suffer a slow learning rate and the risk of getting trapped in local minima [24,25,40]; ANFIS can be time-consuming, due to the need for tuning optimal functions and rules [24,26,41,42]; SVM classifiers require extensive computations and storage, while the KNN algorithm can be computationally intensive [24,35,43,44]. Despite the existence of numerous methods for predicting rockburst conditions and their respective accuracies, developing a reliable and precise method for rockburst-prone zones remains a challenge [24].
This paper explores the use of ML algorithms, especially decision trees (DT), to predict rockburst conditions in different rock types. The goal is to develop a unique model that can effectively predict rockburst conditions, regardless of the rock type. Two distinct approaches employing decision trees are developed, and their performance metrics are compared.
Other ML algorithms, such as ANN, SVM, RF, and AdaBoostM1, are also utilized. The study is based on a dataset of rockburst and a predefined classification scale of four levels (Table 1). The report is divided into Data Characterization (the database used for training and the characterization of testing the models), Methodology (a brief description of models and evaluation), Results, and Discussion (summary of main results and observations).
2. Data Characterization
The rockburst database is collected according to the studies performed by many authors [20,21,28,29,30,33,35,36,39,45]. Several empirical methods have been introduced to evaluate rockburst phenomena [1,20]. Founded on empirical methods proposed for rockburst, the input database was selected [20,24,30,46,47]. The input variables consist of depth, uniaxial compressive strength (σc), tensile strength (σt), maximum tangential stress (σθ), and the elastic energy index (EEI), which are converted to four variables, namely, depth, EEI, BI—(σc/σt), and SI—(σθ/σc), for the prediction of rockburst condition. The depth was chosen because it influences the size of the in-situ stress, distribution, and direction. Uniaxial compressive strength (σc), tensile strength (σt), and the elastic energy index (EEI) [15] reflect the properties of the surrounding rock, and the maximum tangential stress (σθ) reflects the virgin geostatic stress condition and the influence of the shape and dimension of the underground space on rockburst. The Stress Index (σθ/σc) and Brittle Index (σc/σt) were selected because, when the BI value is small, rockburst occurs intensely, and when large, it is light. Whereas, SI relates directly to BI through Ks [20].
This paper uses a rockburst dataset with 210 records and predefined classes (Table 1) to predict rockburst using a classification approach. Table 3, Figure 1 and Figure 2 provide the input variables and statistics. In summary, the statistical analysis of the dataset revealed that the weight distribution and variance are high, indicating a wide distribution of data, which may be caused by outliers.

Table 3.
Statistics of main input variables considered in this study.
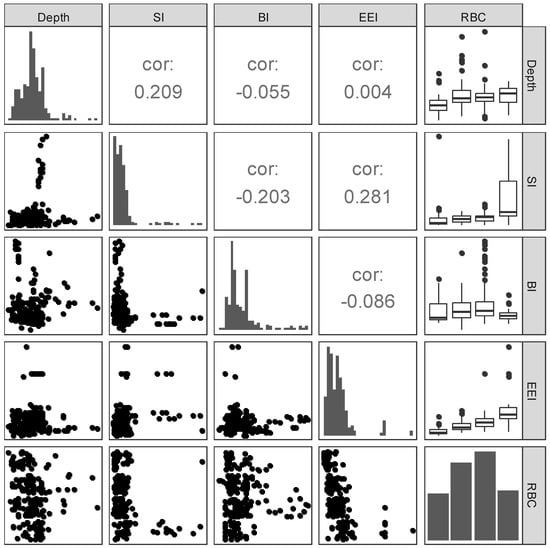
Figure 1.
Matrix scatter plots (SPLOM) for each variable in the prediction of rockburst condition-RBC (with bivariate scatter plots below the diagonal, histograms on the diagonal, Pearson correlation above the diagonal, and boxplots for each RBC based on the input variables).
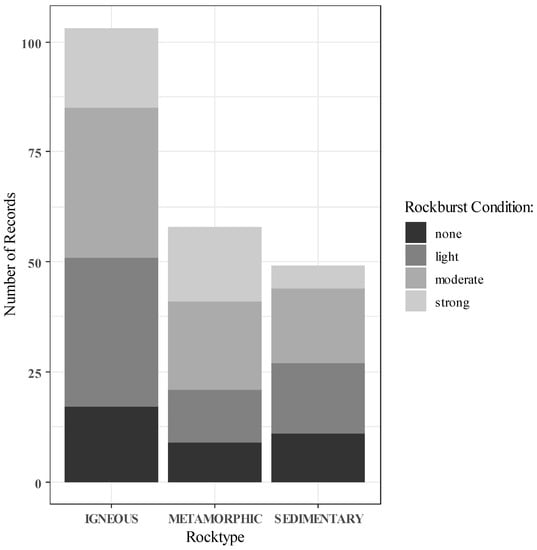
Figure 2.
Rockburst Data Characterization.
- Rock type (Igneous—IG, Metamorphic—MT, and Sedimentary—SD)
- Depth (m)
- Brittle Index (BI)
- Stress Index (SI)
- Elastic Energy Index (EEI)
3. Methods
This paper discusses the use of data mining (DM) techniques in predicting rockburst conditions. The focus is on decision trees (J48), using a nominal classification approach. The R statistical environment and the Rweka [48] package are used to execute various DM algorithms, including J48 [23,49,50], ANN [21,51], SVM [37,51], RF [30,51], and AdaboostM1 [30,51]. The modelling approach and hyperparameters used for the algorithms are detailed in Table 4, and a cross-validation approach (KFOLD = 10) is used for validation purposes. Below is a brief overview of the modelling approaches used in this paper. Interested readers are encouraged to read the references for a more comprehensive understanding of ML algorithms.

Table 4.
Modelling Approach with Hyperparameters for the ML Algorithms.
3.1. Modelling Approach
3.1.1. Decision Tree Approach
The decision tree is a popular ML algorithm used for both classification and regression tasks. It is a tree-like model, where each internal node represents a test on an attribute, each branch represents the outcome of the test, and each leaf node represents a class label or a numeric value. The algorithm works by recursively splitting the data based on the most important attribute at each level of the tree, thus forming a decision path from the root of the leaf node.
Two approaches based on decision trees are described: the DT-RT approach predicts rockburst conditions for each rock type i.e., Igneous (103 cases), Metamorphic (58 cases), and Sedimentary (49 cases) using DT (J48), while the Unique-DT approach uses all datasets (210 cases) to predict rockburst conditions, reduce analysis work, and improve accuracy. Both approaches aim to improve the effectiveness of the algorithm in predicting rockburst conditions.
3.1.2. Multiple Algorithm Approach
This approach employs ANN, SVM, KNN, RF, and AdaboostM1 to predict rockburst conditions, using a dataset of 210 records. The goal is to compare the results based on performance metrics with other approaches.
3.2. Data Evaluation
A key problem with ML algorithms is their complexity. Thus, according to different proposals, ML algorithms are assessed by relying on accuracy. The confusion matrix is a classification process that contains the evaluation metrics, such as recall, F1, and precision. This makes it easier to access and more reliable. The performance of different distinct data-driven models will be evaluated and compared using seven metrics: Recall, Precision, F1, Accuracy (ACC), Specificity (SP), Matthew Correlation Coefficient (MCC), and Area Under the Receiving Operating Characteristic (ROC) Curve (AUC). Additionally, the interpretability of the models is assessed through sensitivity analysis—the relative importance of input variables to the output variable—rockburst condition. The equations and definitions of the metrics are as follows.
The recall measures the proportion of cases of a certain class correctly identified by the model. Therefore, recall is given by:
On the other hand, precision measures the correctness of the model when it predicts a certain class. Precision is given by:
The harmonic mean of precision and recall is a class of F1 score (F1). It is also a measure of the performance of the model’s classification ability. The F1 score is considered a better indicator of the classifier’s performance than the regular accuracy measure.
Furthermore, the accuracy criterion defines the percentage of the data in the correct place. The closer the value is to one, the higher the accuracy and reliability.
Specificity can be defined as the algorithm’s ability to predict the True Negative of each category available. It is also known as the True Negative Rate (TNR).
AUC calculates the area under the ROC curve. The higher the AUC, the better the model classifier. Therefore, the AUC for a perfect classifier is 1. In all, the higher the metric values, the better the prediction. This goes for all the metrics selected. MCC ranges in the interval −1, +1, with extreme values –1 and +1 reached in the case of perfect misclassification and perfect classification, respectively, while MCC = 0 is the expected value for the coin-tossing classifier.
4. Discussion
This section summarizes the main results achieved in rockburst condition prediction through the application of ML techniques. These algorithms are analyzed through the accuracy criteria—metrics, and the results are according to the modelling approach adopted in this study.
4.1. DT-RT
The performance metric and DT representation of the DT-RT approach are indicated in Table 5 and Figure 3, Figure 4 and Figure 5 below. The model showed promising results for each rock type, based on the evaluation metrics. The metamorphic DT algorithm performed the best, in terms of F1 score (0.74), indicating better classifier performance. However, the sedimentary model performed the worst, which may be due to the complexity of the geological material involved and the limited amount of data.

Table 5.
Metrics of DT-RT.
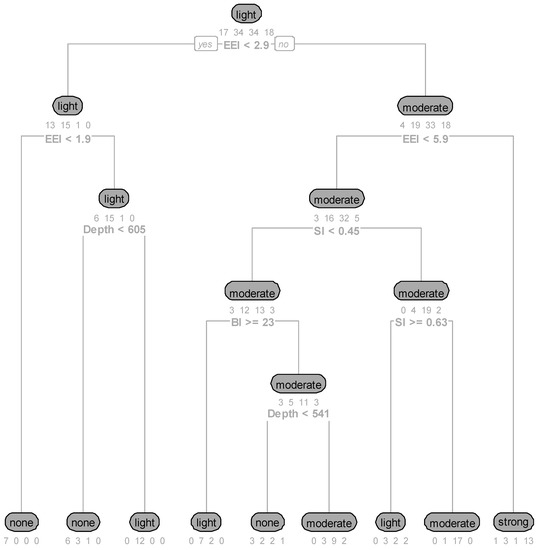
Figure 3.
DT for igneous rock.
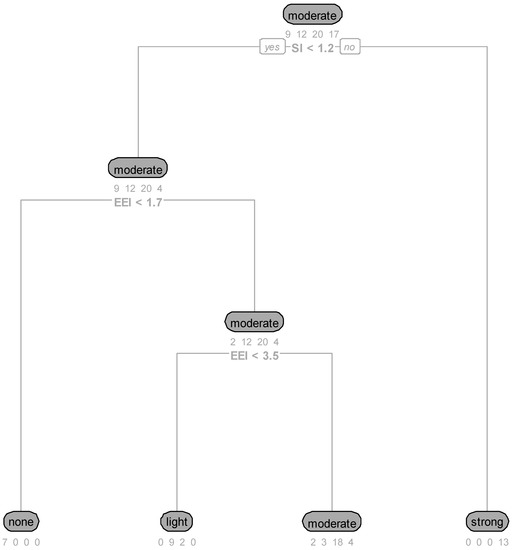
Figure 4.
Decision tree schematic of metamorphic rock.
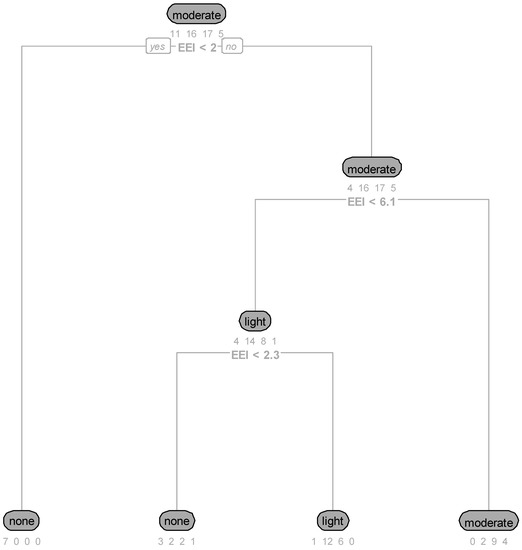
Figure 5.
Decision tree schematic of sedimentary rock.
4.2. Unique-DT
This section describes the results of using the Unique-DT approach for predicting rockburst conditions. Table 6 and Figure 6 present the performance metrics and DT diagram, respectively. The DT-RT model for metamorphic rocks leads to the best results, with an F1 score of 0.74 and an accuracy of 0.86. However, this model is restricted to a single rock type, whereas the Unique-DT model includes all rock types and showed a promising performance, with an F1 score of 0.65 and an accuracy of 0.82. The other performance metrics indicated also showed high performance. It should be stressed that the two other DT-RT models showed poorer performances than Unique-DT.

Table 6.
Metrics for Unique-DT Model.
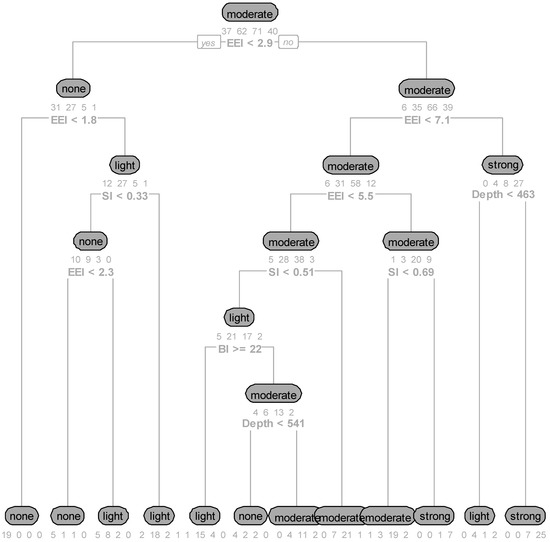
Figure 6.
Unique-DT approach’s decision tree diagram.
4.3. Multiple ML Algorithms
The evaluation results of several ML algorithms, such as ANN, KNN, RF, SVM, AdaboostM1, and Unique-DT, were compared and presented in Table 7. RF, AdaboostM1, unique-DT, ANN, and KNN were found to perform well in predicting rockburst conditions, while SVM showed poorer performance. F1 and accuracy metrics for RF, Unique-DT, and AdaboostM1 were similar, with RF having a slight advantage. The study suggests that the Unique-DT model is a good alternative to other ML algorithms for predicting rockburst conditions. In addition, the ML algorithms used in this study are compared with some from other studies (Table 8).

Table 7.
Metrics for Multiple ML algorithms.
Table 7.
Metrics for Multiple ML algorithms.
| RF | |||||||
|---|---|---|---|---|---|---|---|
| Rockburst Condition | Precision | Recall | F1 | AUC | ACC | SP | MCC |
| None | 0.64 | 0.68 | 0.66 | 0.94 | 0.88 | 0.92 | 0.58 |
| Light | 0.6 | 0.53 | 0.56 | 0.85 | 0.76 | 0.85 | 0.4 |
| Moderate | 0.64 | 0.75 | 0.69 | 0.86 | 0.77 | 0.78 | 0.51 |
| Strong | 0.79 | 0.65 | 0.71 | 0.93 | 0.9 | 0.96 | 0.66 |
| Average | 0.67 | 0.65 | 0.66 | 0.9 | 0.83 | 0.88 | 0.54 |
| KNN | |||||||
| None | 0.53 | 0.62 | 0.58 | 0.75 | 0.84 | 0.88 | 0.48 |
| Light | 0.52 | 0.44 | 0.47 | 0.63 | 0.71 | 0.83 | 0.28 |
| Moderate | 0.58 | 0.63 | 0.61 | 0.7 | 0.72 | 0.77 | 0.4 |
| Strong | 0.68 | 0.65 | 0.67 | 0.79 | 0.88 | 0.93 | 0.59 |
| Average | 0.58 | 0.59 | 0.58 | 0.72 | 0.79 | 0.85 | 0.44 |
| SVM | |||||||
| None | 0.64 | 0.19 | 0.29 | 0.77 | 0.84 | 0.98 | 0.28 |
| Light | 0.27 | 0.39 | 0.32 | 0.52 | 0.5 | 0.55 | -0.05 |
| Moderate | 0.35 | 0.42 | 0.38 | 0.53 | 0.54 | 0.6 | 0.03 |
| Strong | 0.88 | 0.53 | 0.66 | 0.87 | 0.9 | 0.98 | 0.63 |
| Average | 0.54 | 0.38 | 0.41 | 0.67 | 0.7 | 0.78 | 0.22 |
| ANN | |||||||
| None | 0.74 | 0.62 | 0.68 | 0.88 | 0.9 | 0.95 | 0.62 |
| Light | 0.48 | 0.5 | 0.49 | 0.71 | 0.7 | 0.78 | 0.27 |
| Moderate | 0.51 | 0.52 | 0.51 | 0.72 | 0.61 | 0.67 | 0.19 |
| Strong | 0.67 | 0.7 | 0.68 | 0.91 | 0.88 | 0.92 | 0.61 |
| Average | 0.6 | 0.59 | 0.59 | 0.81 | 0.77 | 0.83 | 0.42 |
| AdaboostM1 | |||||||
| None | 0.72 | 0.7 | 0.71 | 0.92 | 0.9 | 0.94 | 0.65 |
| Light | 0.58 | 0.52 | 0.55 | 0.77 | 0.75 | 0.84 | 0.37 |
| Moderate | 0.62 | 0.7 | 0.66 | 0.8 | 0.71 | 0.71 | 0.41 |
| Strong | 0.74 | 0.7 | 0.72 | 0.9 | 0.9 | 0.94 | 0.65 |
| Average | 0.67 | 0.66 | 0.66 | 0.85 | 0.82 | 0.86 | 0.52 |
| Unique-DT | |||||||
| None | 0.7 | 0.57 | 0.63 | 0.83 | 0.88 | 0.95 | 0.61 |
| Light | 0.57 | 0.63 | 0.6 | 0.75 | 0.75 | 0.8 | 0.41 |
| Moderate | 0.64 | 0.69 | 0.66 | 0.75 | 0.76 | 0.8 | 0.37 |
| Strong | 0.77 | 0.68 | 0.72 | 0.86 | 0.9 | 0.95 | 0.52 |
| Average | 0.67 | 0.64 | 0.65 | 0.8 | 0.82 | 0.88 | 0.48 |
NB.: Best Value in Bold.

Table 8.
Summary of some ML algorithms available in the literature, used for comparison with the proposed models.
Table 8.
Summary of some ML algorithms available in the literature, used for comparison with the proposed models.
| REF. Algorithms | Accuracy | REF. Algorithms | Accuracy |
|---|---|---|---|
| KNN [30] | 53.2–67.2% | GEP [36] | 85.16% |
| GBM [30] | 61.22% | DT [36] | 81.48% |
| NB [30] | 53.9–67.2% | Cloud [29] | 71.05% |
| DT [35] | 73–93% | GSM-SVM [20] | 66.67–88.9% |
| LRC [33] | 80.2–90.9% | GA-SVM [20] | 66.67–80% |
| BN [31] | 91.75% | PSO-SVM [20] | 66.67–90% |
| ENN [36] | 85.19% | ANFIS [26] | 66.5–95.6% |
This section highlights the importance of interpretability in explaining ML algorithms, particularly sensitivity analysis of DT algorithms. The aim was to identify the relevant variables (inputs) that contribute to the prediction of rockburst conditions. Figure 7 was generated to help understand what was learned by the algorithms and compare it to empirical knowledge.
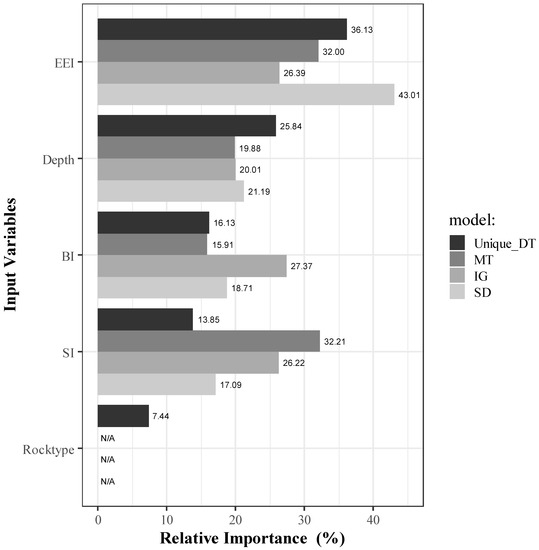
Figure 7.
ML algorithms identify the most contributing variables for rockburst prediction through relative importance.
Each rock type has distinct variables that contribute to determining rockburst conditions, with the Unique-DT model showing the most influence on elastic energy index (EEI = 36.73%). Other influential input variables include Depth (25.84%), Brittle index (BI = 16.13%), and Stress Index (SI = 13.85%). The three DT-RT models show varying importance, based on their input variables. This is indicative of the influence the variable has on rockburst due to the rock type. The importance of the DT-RT model for sedimentary (SD) indicates EEI (43.01%) as the most relevant factor, followed by Depth (21.19%), BI (18.71%), and SI (17.09%), respectively. In the case of IG and MT, BI (27.37%) and SI (32.21%) are the most relevant factors, respectively, and EEI is the second-most important variable for both models.
These findings align with previous studies [21,30,31,33] on rockburst condition prediction, emphasizing the importance of accurately identifying underlying factors through closer examination of input data. It should be noted that all models assign high importance to the elastic energy index (EEI), which aligns with Xu and Yu [16] who presented a new prediction method for rockburst based on this index.
4.4. Limitations
Despite the satisfactory results obtained in predicting rockburst conditions, this work has certain limitations:
- Due to the relatively small size of the dataset (210), it may not fully capture the variability of the rockburst conditions across different geological settings. Therefore, obtaining a larger dataset could provide more robust results.
- The study only considers five input variables, which may not capture all the relevant factors that contribute to rockburst occurrence. Including more variables could improve the accuracy of the results.
- The study only uses DT, and a few other ML algorithms, for predicting rockburst conditions. Other approaches, such as physics-based models or hybrid models that combine data-driven and physics-based approaches, could provide complementary insights and improve the overall prediction performance.
- The study only uses a nominal classification approach for DT, which may not be optimal for handling continuous or ordinal variables. Using other classification approaches, such as binary or multi-class classification, could provide more flexibility and accuracy in modelling the rockburst conditions.
5. Conclusions
Predicting the rockburst condition plays a vital role in the safety, economy, performance, and efficiency of deep underground projects. In this research, a Decision Tree (DT), which is a simple, efficient, and accurate technique, was utilized to predict rockburst conditions for different rock types, such as igneous, metamorphic, and sedimentary, both alone and together. A new model was developed by combining datasets for each rock type and modelling it, using the DT algorithm, to predict rockburst conditions. Other Machine Learning (ML) algorithms, such as Random Forest (RF), K-Nearest Neighbor (KNN), Artificial Neural Network (ANN), Support Vector Machine (SVM), and AdaboostM1 were also utilized in predicting rockburst condition. Training and testing of the models were performed on a representative dataset of 210 records containing 5 input variables, required for forecasting rockburst conditions. The dataset contains 103 igneous rockburst cases, 58 metamorphic, and 49 sedimentary.
The approach, using different DT models for each rock type, is very restrictive, in comparison with the Unique-DT model, which has a wider domain of application. Among the DT models, the one related to metamorphic rocks provided the best results. However, it can only be applied to one type of rock. Furthermore, based on the evaluated metrics, the Unique-DT (F1 = 0.65) algorithm showed a very promising performance. Although other ML algorithms were utilized and compared to Unique-DT, RF (F1 =0.66) and AdaboostM1 (F1 = 0.66) were slightly better in performance metrics. Taking into account its simplicity and effectiveness, the Unique-DT model is suggested to be used in predicting rockburst conditions.
Subsequently, more focus should be placed on ensemble methods, such as RF and boosting algorithms, such as AdaboostM1, as they have demonstrated strong performance in classification tasks. Moreover, to improve prediction accuracy, authors intend to incorporate additional data—rockburst cases and results obtained from different input variables and ML methods in future work.
In summary, the ML algorithms have shown that they can be used for predicting rockburst conditions if data are available. Also, the use of DT in rockburst prediction based on depth, elastic energy index, and strength rock parameters has proved effective, and demonstrated its merit in solving this complex phenomenon—rockburst.
Author Contributions
Conceptualization, J.T., D.O.-A. and F.L.; Software, J.T. and D.O.-A.; Investigation, D.O.-A., J.T. and F.L.; Methodology, D.O.-A., J.T. and F.L.; Validation, D.O.-A., J.T., F.L., F.M. and J.M.; Writing—original draft, D.O.-A.; Writing—review and editing, D.O.-A., J.T., F.M. and F.L.; Project administration, J.T.; Funding acquisition, J.T. and J.M. All authors have read and agreed to the published version of the manuscript.
Funding
This work was partly financed by FCT/MCTES through national funds (PIDDAC) under the R&D Unit Institute for Sustainability and Innovation in Structural Engineering (ISISE), under reference UIDB/04029/2020, and under the Associate Laboratory Advanced Production and Intelligent Systems ARISE under reference LA/P/0112/2020.
Institutional Review Board Statement
Not applicable.
Informed Consent Statement
Not applicable.
Data Availability Statement
The data used in the present study are under privacy issues and cannot be shared.
Conflicts of Interest
The authors declare no conflict of interest.
References
- Askaripour, M.; Saeidi, A.; Rouleau, A.; Mercier-Langevin, P. Rockburst in Underground Excavations: A Review of Mechanism, Classification, and Prediction Methods. Undergr. Space 2022, 7, 577–607. [Google Scholar] [CrossRef]
- Aydan, Ö.; Geniş, M.; Akagi, T. Assessment of Susceptibility of Rock Bursting in Tunnelling in Hard Rocks. Mod. Tunn. Sci. Technol. 2001, 67, 369–380. [Google Scholar]
- Meng, F.; Zhou, H.; Wang, Z.; Zhang, L.; Kong, L.; Li, S.; Zhang, C.; Hu, S. Experimental Study of Factors Affecting Fault Slip Rockbursts in Deeply Buried Hard Rock Tunnels. Bull. Eng. Geol. Environ. 2017, 76, 1167–1182. [Google Scholar] [CrossRef]
- Zhu, W.C.; Li, Z.H.; Zhu, L.; Tang, C.A. Numerical Simulation on Rockburst of Underground Opening Triggered by Dynamic Disturbance. Tunn. Undergr. Space Technol. 2010, 25, 587–599. [Google Scholar] [CrossRef]
- Hoek, E.; Brown, E.T. Underground Excavations in Rock, 1st ed.; The Institution of Mining and Metallurgy: London, UK, 1996; ISBN 978-0-419-16030-4. [Google Scholar]
- Kadkhodaei, M.; Ghasemi, E. Prediction of the Occurrence and Severity of Rockburst Using MARS Technique. In Proceedings of the 8th Iranian Mining Engineering Conference, Birjand, Iran, 19 February 2020. [Google Scholar]
- Lu, C.-P.; Liu, Y.; Zhang, N.; Zhao, T.-B.; Wang, H.-Y. In-Situ and Experimental Investigations of Rockburst Precursor and Prevention Induced by Fault Slip. Int. J. Rock Mech. Min. Sci. 2018, 108, 86–95. [Google Scholar] [CrossRef]
- Kaiser, P.K.; McCreath, D.R.; Brummer, R.K.; Maloney, S.; Vasak, P.; Xiaoping, Y. Canadian Rockburst Support Handbook; Geomechanics Research Centre: Sudbury, ON, Canada, 1996. [Google Scholar]
- Kaiser, P.K. Excavation Vulnerability and Selection of Effective Rock Support to Mitigate Rockburst Damage. In Rockburst; Elsevier: Amsterdam, The Netherlands, 2018; pp. 473–518. ISBN 978-0-12-805054-5. [Google Scholar]
- Ribeiro e Sousa, L.; Miranda, T.; Leal e Sousa, R.; Tinoco, J. The Use of Data Mining Techniques in Rockburst Risk Assessment. Engineering 2017, 3, 552–558. [Google Scholar] [CrossRef]
- Sousa, L.; Miranda, T.; Sousa, R.; Tinoco, J. Deep Underground Engineering and The Use of Artificial Intelligence Techniques. Int. J. Earth Environ. Sci. 2018, 3, 20. [Google Scholar] [CrossRef]
- Whyatt, J.; Blake, W.; Lake, H.; Williams, T.; White, B. 60 Years of Rockbursting in the Coeur D’alene District of Northern Idaho, USA: Lessons Learned and Remaining Issues; Society for Mining, Metallurgy, and Exploration, Inc.: Littleton, CO, USA, 2002. [Google Scholar]
- Dietz, M.; Oremek, G.M.; Groneberg, D.A.; Bendels, M.H.K. Was ist ein Gebirgsschlag? Zent. Arb. Arb. Ergon. 2018, 68, 45–49. [Google Scholar] [CrossRef]
- Keneti, A.; Sainsbury, B.-A. Review of Published Rockburst Events and Their Contributing Factors. Eng. Geol. 2018, 246, 361–373. [Google Scholar] [CrossRef]
- Kidybiński, A. Bursting Liability Indices of Coal. Int. J. Rock Mech. Min. Sci. Geomech. Abstr. 1981, 18, 295–304. [Google Scholar] [CrossRef]
- Xu, S.; Yu, S. A New Prediction Method of Rockburst in Underground Engineering Based on Elastic Energy Index. In Proceedings of the 2016 International conference of Civil, Structure and Envirinmental Engineering, Guangzhou, China, 12–13 March 2016. [Google Scholar]
- Ortlepp, W.D.; Stacey, T.R. Rockburst Mechanisms in Tunnels and Shafts. Tunn. Undergr. Space Technol. 1994, 9, 59–65. [Google Scholar] [CrossRef]
- Blake, W.; Hedley, D.G.F. Rockbursts: Case Studies from North American Hard-Rock Mines; Society for Mining, Metallurgy, and Exploration, Inc.: Littleton, CO, USA, 2003; ISBN 978-0-87335-232-1. [Google Scholar]
- Russenes, B.F. Analysis of Rock Spalling for Tunnels in Steep Valley Sides. Master’s Thesis, Norwegian Institute of Technology, Trondheim, Norway, 1974. [Google Scholar]
- Zhou, J.; Li, X.; Shi, X. Long-Term Prediction Model of Rockburst in Underground Openings Using Heuristic Algorithms and Support Vector Machines. Saf. Sci. 2012, 50, 629–644. [Google Scholar] [CrossRef]
- Zhou, J.; Guo, H.; Koopialipoor, M.; Jahed Armaghani, D.; Tahir, M.M. Investigating the Effective Parameters on the Risk Levels of Rockburst Phenomena by Developing a Hybrid Heuristic Algorithm. Eng. Comput. 2021, 37, 1679–1694. [Google Scholar] [CrossRef]
- Gong, F.; Li, X. A distance discriminant analysis method for prediction of possibility and classification of rockburst and its application. Yanshilixue Yu Gongcheng Xuebao Chin. J. Rock Mech. Eng. 2007, 26, 1012–1018. [Google Scholar]
- Han, J.; Kamber, M.; Pei, J. Data Mining: Concepts and Techniques, 3rd ed.; The Morgan Kaufmann Series in Data Management Systems; Elsevier: Amsterdam, The Netherlands, 2011; ISBN 978-0-12-381480-7. [Google Scholar]
- Wang, S.; Zhou, J.; Li, C.; Armaghani, D.J.; Li, X.; Mitri, H.S. Rockburst Prediction in Hard Rock Mines Developing Bagging and Boosting Tree-Based Ensemble Techniques. J. Cent. South Univ. 2021, 28, 527–542. [Google Scholar] [CrossRef]
- Dong, L.; Li, X.; Peng, K. Prediction of Rockburst Classification Using Random Forest. Trans. Nonferrous Met. Soc. China 2013, 23, 472–477. [Google Scholar] [CrossRef]
- Adoko, A.C.; Gokceoglu, C.; Wu, L.; Zuo, Q.J. Knowledge-Based and Data-Driven Fuzzy Modeling for Rockburst Prediction. Int. J. Rock Mech. Min. Sci. 2013, 61, 86–95. [Google Scholar] [CrossRef]
- Liu, Z.; Shao, J.; Xu, W.; Meng, Y. Prediction of Rock Burst Classification Using the Technique of Cloud Models with Attribution Weight. Nat. Hazards 2013, 68, 549–568. [Google Scholar] [CrossRef]
- Zhou, J.; Shi, X.; Huang, R.; Qiu, X.; Chen, C. Feasibility of Stochastic Gradient Boosting Approach for Predicting Rockburst Damage in Burst-Prone Mines. Trans. Nonferrous Met. Soc. China 2016, 26, 1938–1945. [Google Scholar] [CrossRef]
- Zhou, K.; Lin, Y.; Deng, H.; Li, J.; Liu, C. Prediction of Rock Burst Classification Using Cloud Model with Entropy Weight. Trans. Nonferrous Met. Soc. China 2016, 26, 1995–2002. [Google Scholar] [CrossRef]
- Zhou, J.; Li, X.; Mitri, H.S. Classification of Rockburst in Underground Projects: Comparison of Ten Supervised Learning Methods. J. Comput. Civ. Eng. 2016, 30, 04016003. [Google Scholar] [CrossRef]
- Li, N.; Feng, X.; Jimenez, R. Predicting Rock Burst Hazard with Incomplete Data Using Bayesian Networks. Tunn. Undergr. Space Technol. 2017, 61, 61–70. [Google Scholar] [CrossRef]
- Adoko, A.C.; Zvarivadza, T. A Bayesian Approach for Predicting Rockburst: 52nd U.S. Rock Mechanics/Geomechanics Symposium; American Rock Mechanics Association (ARMA18): Seattle, WA, USA, 2018. [Google Scholar]
- Li, N.; Jimenez, R. A Logistic Regression Classifier for Long-Term Probabilistic Prediction of Rock Burst Hazard. Nat. Hazards J. Int. Soc. Prev. Mitig. Nat. Hazards 2018, 90, 197–215. [Google Scholar] [CrossRef]
- Xu, C.; Liu, X.; Wang, E.; Zheng, Y.; Wang, S. Rockburst Prediction and Classification Based on the Ideal-Point Method of Information Theory. Tunn. Undergr. Space Technol. 2018, 81, 382–390. [Google Scholar] [CrossRef]
- Pu, Y.; Apel, D.B.; Lingga, B. Rockburst Prediction in Kimberlite Using Decision Tree with Incomplete Data. J. Sustain. Min. 2018, 17, 158–165. [Google Scholar] [CrossRef]
- Shirani Faradonbeh, R.; Taheri, A. Long-Term Prediction of Rockburst Hazard in Deep Underground Openings Using Three Robust Data Mining Techniques. Eng. Comput. 2019, 35, 659–675. [Google Scholar] [CrossRef]
- Afraei, S.; Shahriar, K.; Madani, S.H. Developing Intelligent Classification Models for Rock Burst Prediction after Recognizing Significant Predictor Variables, Section 2: Designing Classifiers. Tunn. Undergr. Space Technol. 2019, 84, 522–537. [Google Scholar] [CrossRef]
- Pu, Y.; Apel, D.B.; Xu, H. Rockburst Prediction in Kimberlite with Unsupervised Learning Method and Support Vector Classifier. Tunn. Undergr. Space Technol. 2019, 90, 12–18. [Google Scholar] [CrossRef]
- Ghasemi, E.; Gholizadeh, H.; Adoko, A.C. Evaluation of Rockburst Occurrence and Intensity in Underground Structures Using Decision Tree Approach. Eng. Comput. 2020, 36, 213–225. [Google Scholar] [CrossRef]
- Le, L.T.; Nguyen, H.; Dou, J.; Zhou, J. A Comparative Study of PSO-ANN, GA-ANN, ICA-ANN, and ABC-ANN in Estimating the Heating Load of Buildings’ Energy Efficiency for Smart City Planning. Appl. Sci. 2019, 9, 2630. [Google Scholar] [CrossRef]
- Zhou, J.; Li, C.; Arslan, C.A.; Hasanipanah, M.; Bakhshandeh Amnieh, H. Performance Evaluation of Hybrid FFA-ANFIS and GA-ANFIS Models to Predict Particle Size Distribution of a Muck-Pile after Blasting. Eng. Comput. 2021, 37, 265–274. [Google Scholar] [CrossRef]
- Marzi, H.; Haj Darwish, A.; Helfawi, H. Training ANFIS Using the Enhanced Bees Algorithm and Least Squares Estimation. Intell. Autom. Soft Comput. 2017, 23, 227–234. [Google Scholar] [CrossRef]
- Yu, Z.; Shi, X.; Zhou, J.; Chen, X.; Miao, X.; Teng, B.; Ipangelwa, T. Prediction of Blast-Induced Rock Movement During Bench Blasting: Use of Gray Wolf Optimizer and Support Vector Regression. Nat. Resour. Res. 2020, 29, 843–865. [Google Scholar] [CrossRef]
- Zhang, S. Cost-Sensitive KNN Classification. Neurocomputing 2020, 391, 234–242. [Google Scholar] [CrossRef]
- Zhou, J.; Li, X.; Mitri, H.S. Evaluation Method of Rockburst: State-of-the-Art Literature Review. Tunn. Undergr. Space Technol. 2018, 81, 632–659. [Google Scholar] [CrossRef]
- Zhang, J.J.; Fu, B.J.; Li, Z.K.; Song, S.W.; Shang, Y.J. Criterion and Classification for Strain Mode Rockbursts Based on Five-Factor Comprehensive Method. In Proceedings of the 12th ISRM congress, Beijing, China, 16 October 2011. [Google Scholar]
- Zhang, G.; Gao, Q.; Du, J.; Li, K. Rockburst Criterion Based on Artificial Neural Networks and Nonlinear Regression. Zhongnan Daxue Xuebao Ziran Kexue Ban J. Cent. South Univ. Sci. Technol. 2013, 44, 2977–2981. [Google Scholar]
- Hornik, K.; Buchta, C.; Hothorn, T.; Karatzoglou, A.; Meyer, D.; Zeileis, A. Rweka. RSTUDIO 2021, 0.4–44, 1–34. [Google Scholar]
- Hong, H.; Liu, J.; Bui, D.T.; Pradhan, B.; Acharya, T.D.; Pham, B.T.; Zhu, A.X.; Chen, W.; Ahmad, B.B. Landslide Susceptibility Mapping Using J48 Decision Tree with AdaBoost, Bagging and Rotation Forest Ensembles in the Guangchang Area (China). Catena 2018, 163, 399–413. [Google Scholar] [CrossRef]
- Patil, T.R.; Sherekar, S. Performance Analysis of Naive Bayes and J48 Classification Algorithm for Data Classification. Int. J. Comput. Sci. Appl. 2013, 6, 256–261. [Google Scholar]
- Chollet, F.; Kalinowski, T.; Allaire, J.J. Deep Learning with R, 2nd ed.; Manning Publications Co.: Shelter Island, NY, USA, 2022; ISBN 978-1-63343-984-9. [Google Scholar]
Disclaimer/Publisher’s Note: The statements, opinions and data contained in all publications are solely those of the individual author(s) and contributor(s) and not of MDPI and/or the editor(s). MDPI and/or the editor(s) disclaim responsibility for any injury to people or property resulting from any ideas, methods, instructions or products referred to in the content. |
© 2023 by the authors. Licensee MDPI, Basel, Switzerland. This article is an open access article distributed under the terms and conditions of the Creative Commons Attribution (CC BY) license (https://creativecommons.org/licenses/by/4.0/).